

Compact Muon Solenoid
LHC, CERN
| CMS-SMP-15-007 ; CERN-EP-2016-104 | ||
| Measurement of the double-differential inclusive jet cross section in proton-proton collisions at $ \sqrt{s} = $ 13 TeV | ||
| CMS Collaboration | ||
| 14 May 2016 | ||
| Eur. Phys. J. C 76 (2016) 451 | ||
| Abstract: A measurement of the double-differential inclusive jet cross section as a function of jet transverse momentum $p_{\mathrm{T}}$ and absolute jet rapidity $|y|$ is presented. The analysis is based on proton-proton collisions collected by the CMS experiment at the LHC at a centre-of-mass energy of 13 TeV. The data samples correspond to integrated luminosities of 71 and 44 pb$^{-1}$ for $|y|< $ 3 and 3.2 $ <|y|< $ 4.7 , respectively. Jets are reconstructed with the anti-$k_{\mathrm{t}}$ clustering algorithm for two jet sizes, $R$, of 0.7 and 0.4, in a phase space region covering jet $p_{\mathrm{T}}$ up to 2 TeV and jet rapidity up to $|y|$ = 4.7. Predictions of perturbative quantum chromodynamics at next-to-leading order precision, complemented with electroweak and nonperturbative corrections, are used to compute the absolute scale and the shape of the inclusive jet cross section. The cross section difference in $R$, when going to a smaller jet size of 0.4, is best described by Monte Carlo event generators with next-to-leading order predictions matched to parton showering, hadronisation, and multiparton interactions. In the phase space accessible with the new data, this measurement provides a first indication that jet physics is as well understood at $ \sqrt{s} = $ 13 TeV as at smaller centre-of-mass energies. | ||
| Links: e-print arXiv:1605.04436 [hep-ex] (PDF) ; CDS record ; inSPIRE record ; Rivet record ; HepData record ; CADI line (restricted) ; | ||
| Figures | |

png pdf |
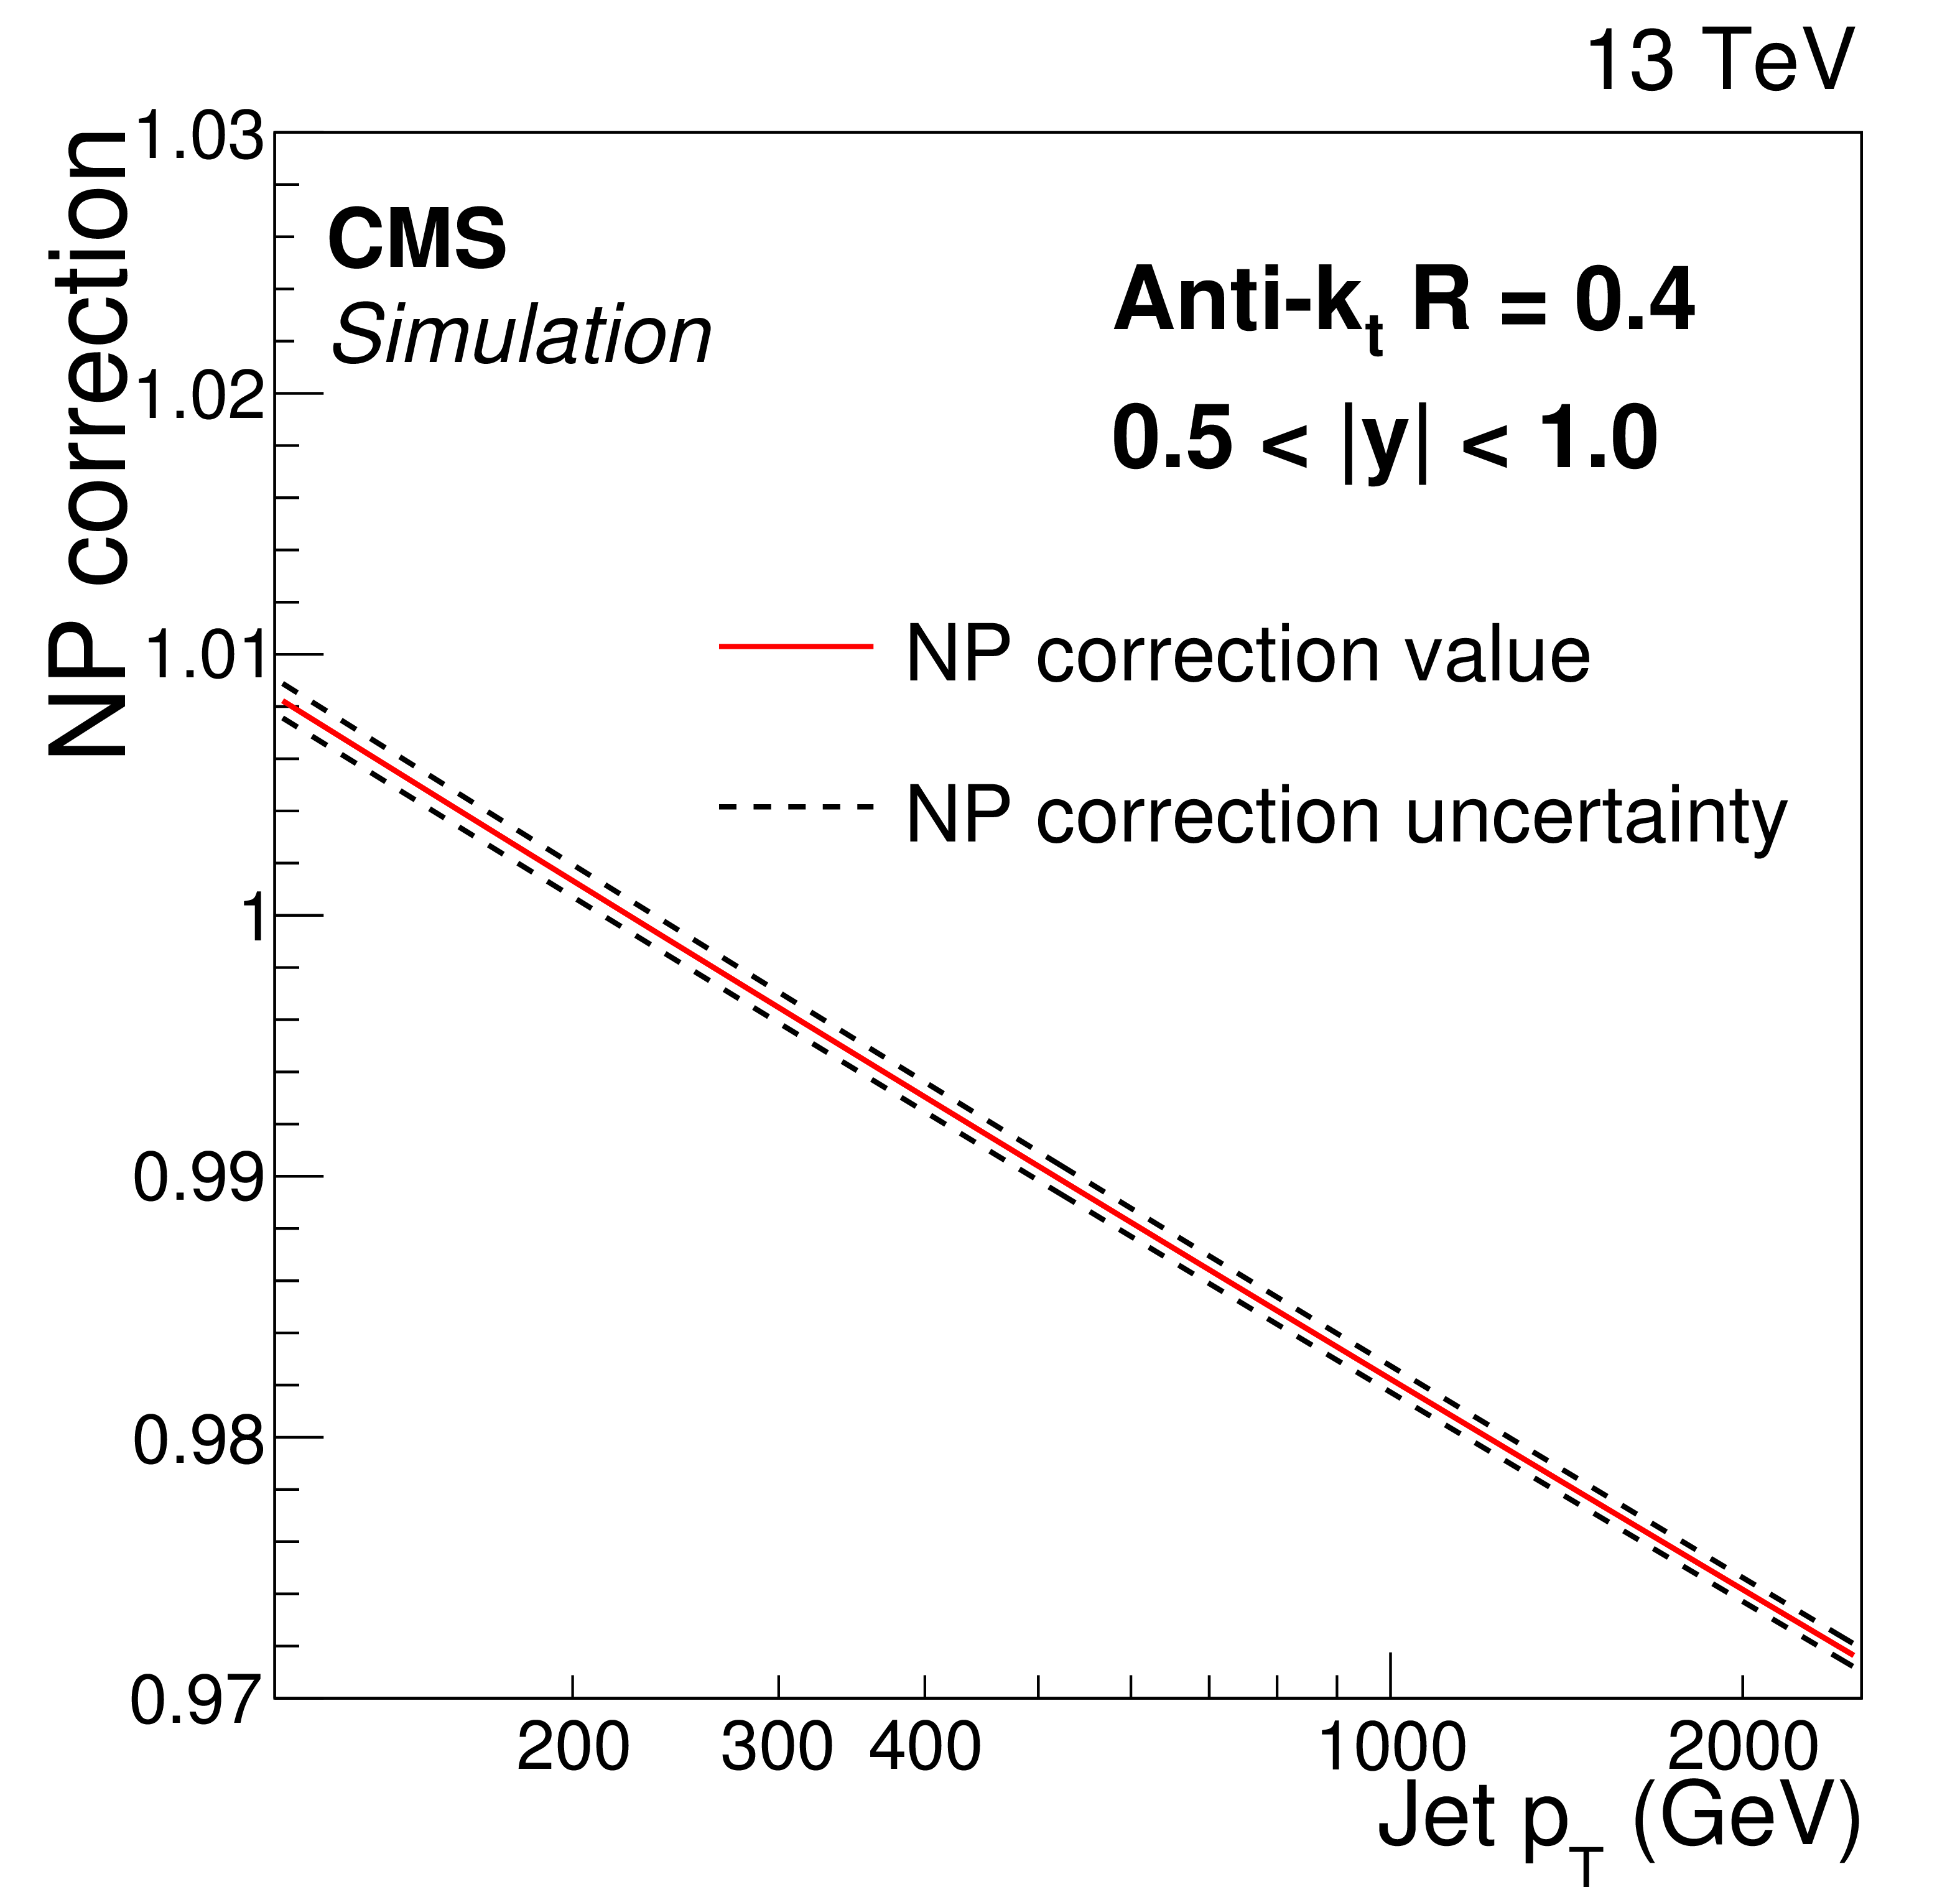
Figure 1-a:
Fits to the nonperturbative corrections obtained for inclusive AK7 jet cross sections as a function of jet $ {p_{\mathrm {T}}} $ for two rapidity bins: 0.5 $ < |y| < $ 1.0 (left) and 2.5 $ < |y| < $ 3.0 (right). The dotted lines represent the uncertainty bands, which are evaluated by fitting the envelopes of the predictions of the different generators used. |

png pdf |
Figure 1-b:
Fits to the nonperturbative corrections obtained for inclusive AK7 jet cross sections as a function of jet $ {p_{\mathrm {T}}} $ for two rapidity bins: 0.5 $ < |y| < $ 1.0 (left) and 2.5 $ < |y| < $ 3.0 (right). The dotted lines represent the uncertainty bands, which are evaluated by fitting the envelopes of the predictions of the different generators used. |
png pdf |
Figure 2-a:
Fits to the nonperturbative corrections obtained for inclusive AK4 jet cross sections as a function of jet $ {p_{\mathrm {T}}} $ for two rapidity bins: 0.5 $ < |y| < $ 1.0 (left) and 2.5 $ < |y| < $ 3.0 (right). The dotted lines represent the uncertainty bands, which are evaluated by fitting the envelopes of the predictions of the different generators used. |

png pdf |
Figure 2-b:
Fits to the nonperturbative corrections obtained for inclusive AK4 jet cross sections as a function of jet $ {p_{\mathrm {T}}} $ for two rapidity bins: 0.5 $ < |y| < $ 1.0 (left) and 2.5 $ < |y| < $ 3.0 (right). The dotted lines represent the uncertainty bands, which are evaluated by fitting the envelopes of the predictions of the different generators used. |
png pdf |
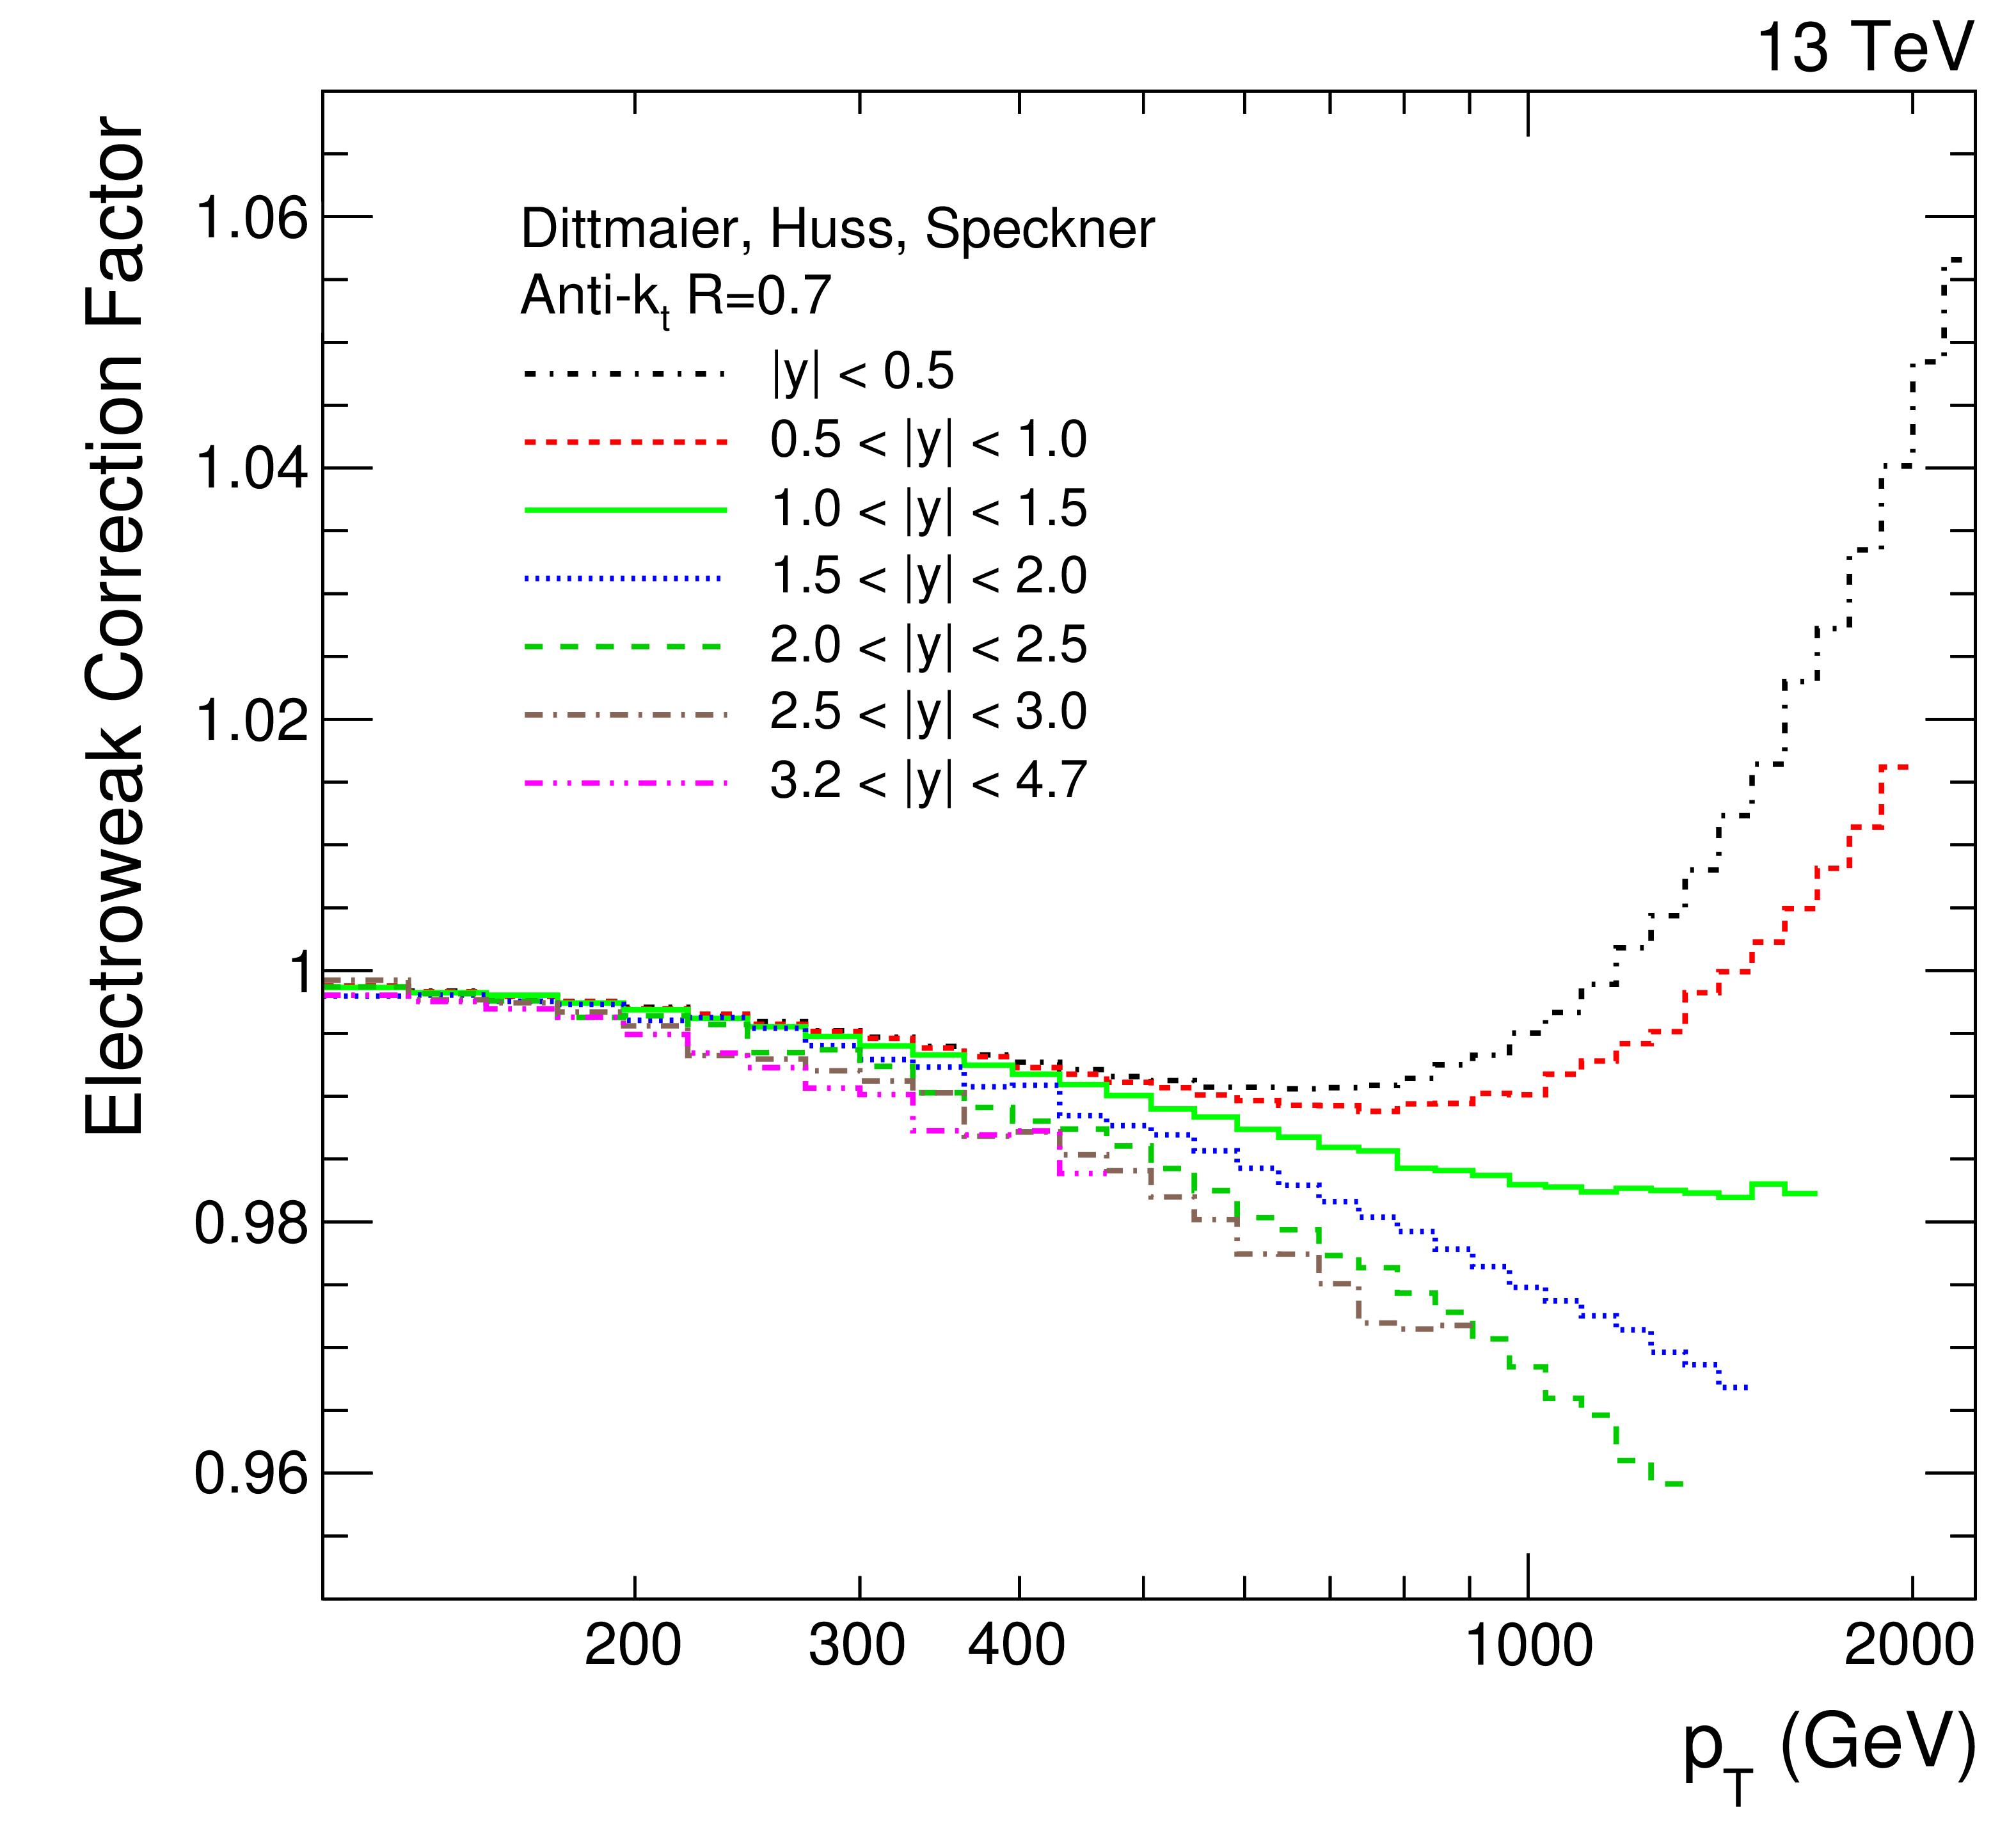
Figure 3-a:
Electroweak correction factors for the seven rapidity bins for the AK7 (left) and AK4 (right) jets as a function of jet $ {p_{\mathrm {T}}} $. |

png pdf |
Figure 3-b:
Electroweak correction factors for the seven rapidity bins for the AK7 (left) and AK4 (right) jets as a function of jet $ {p_{\mathrm {T}}} $. |
png pdf |
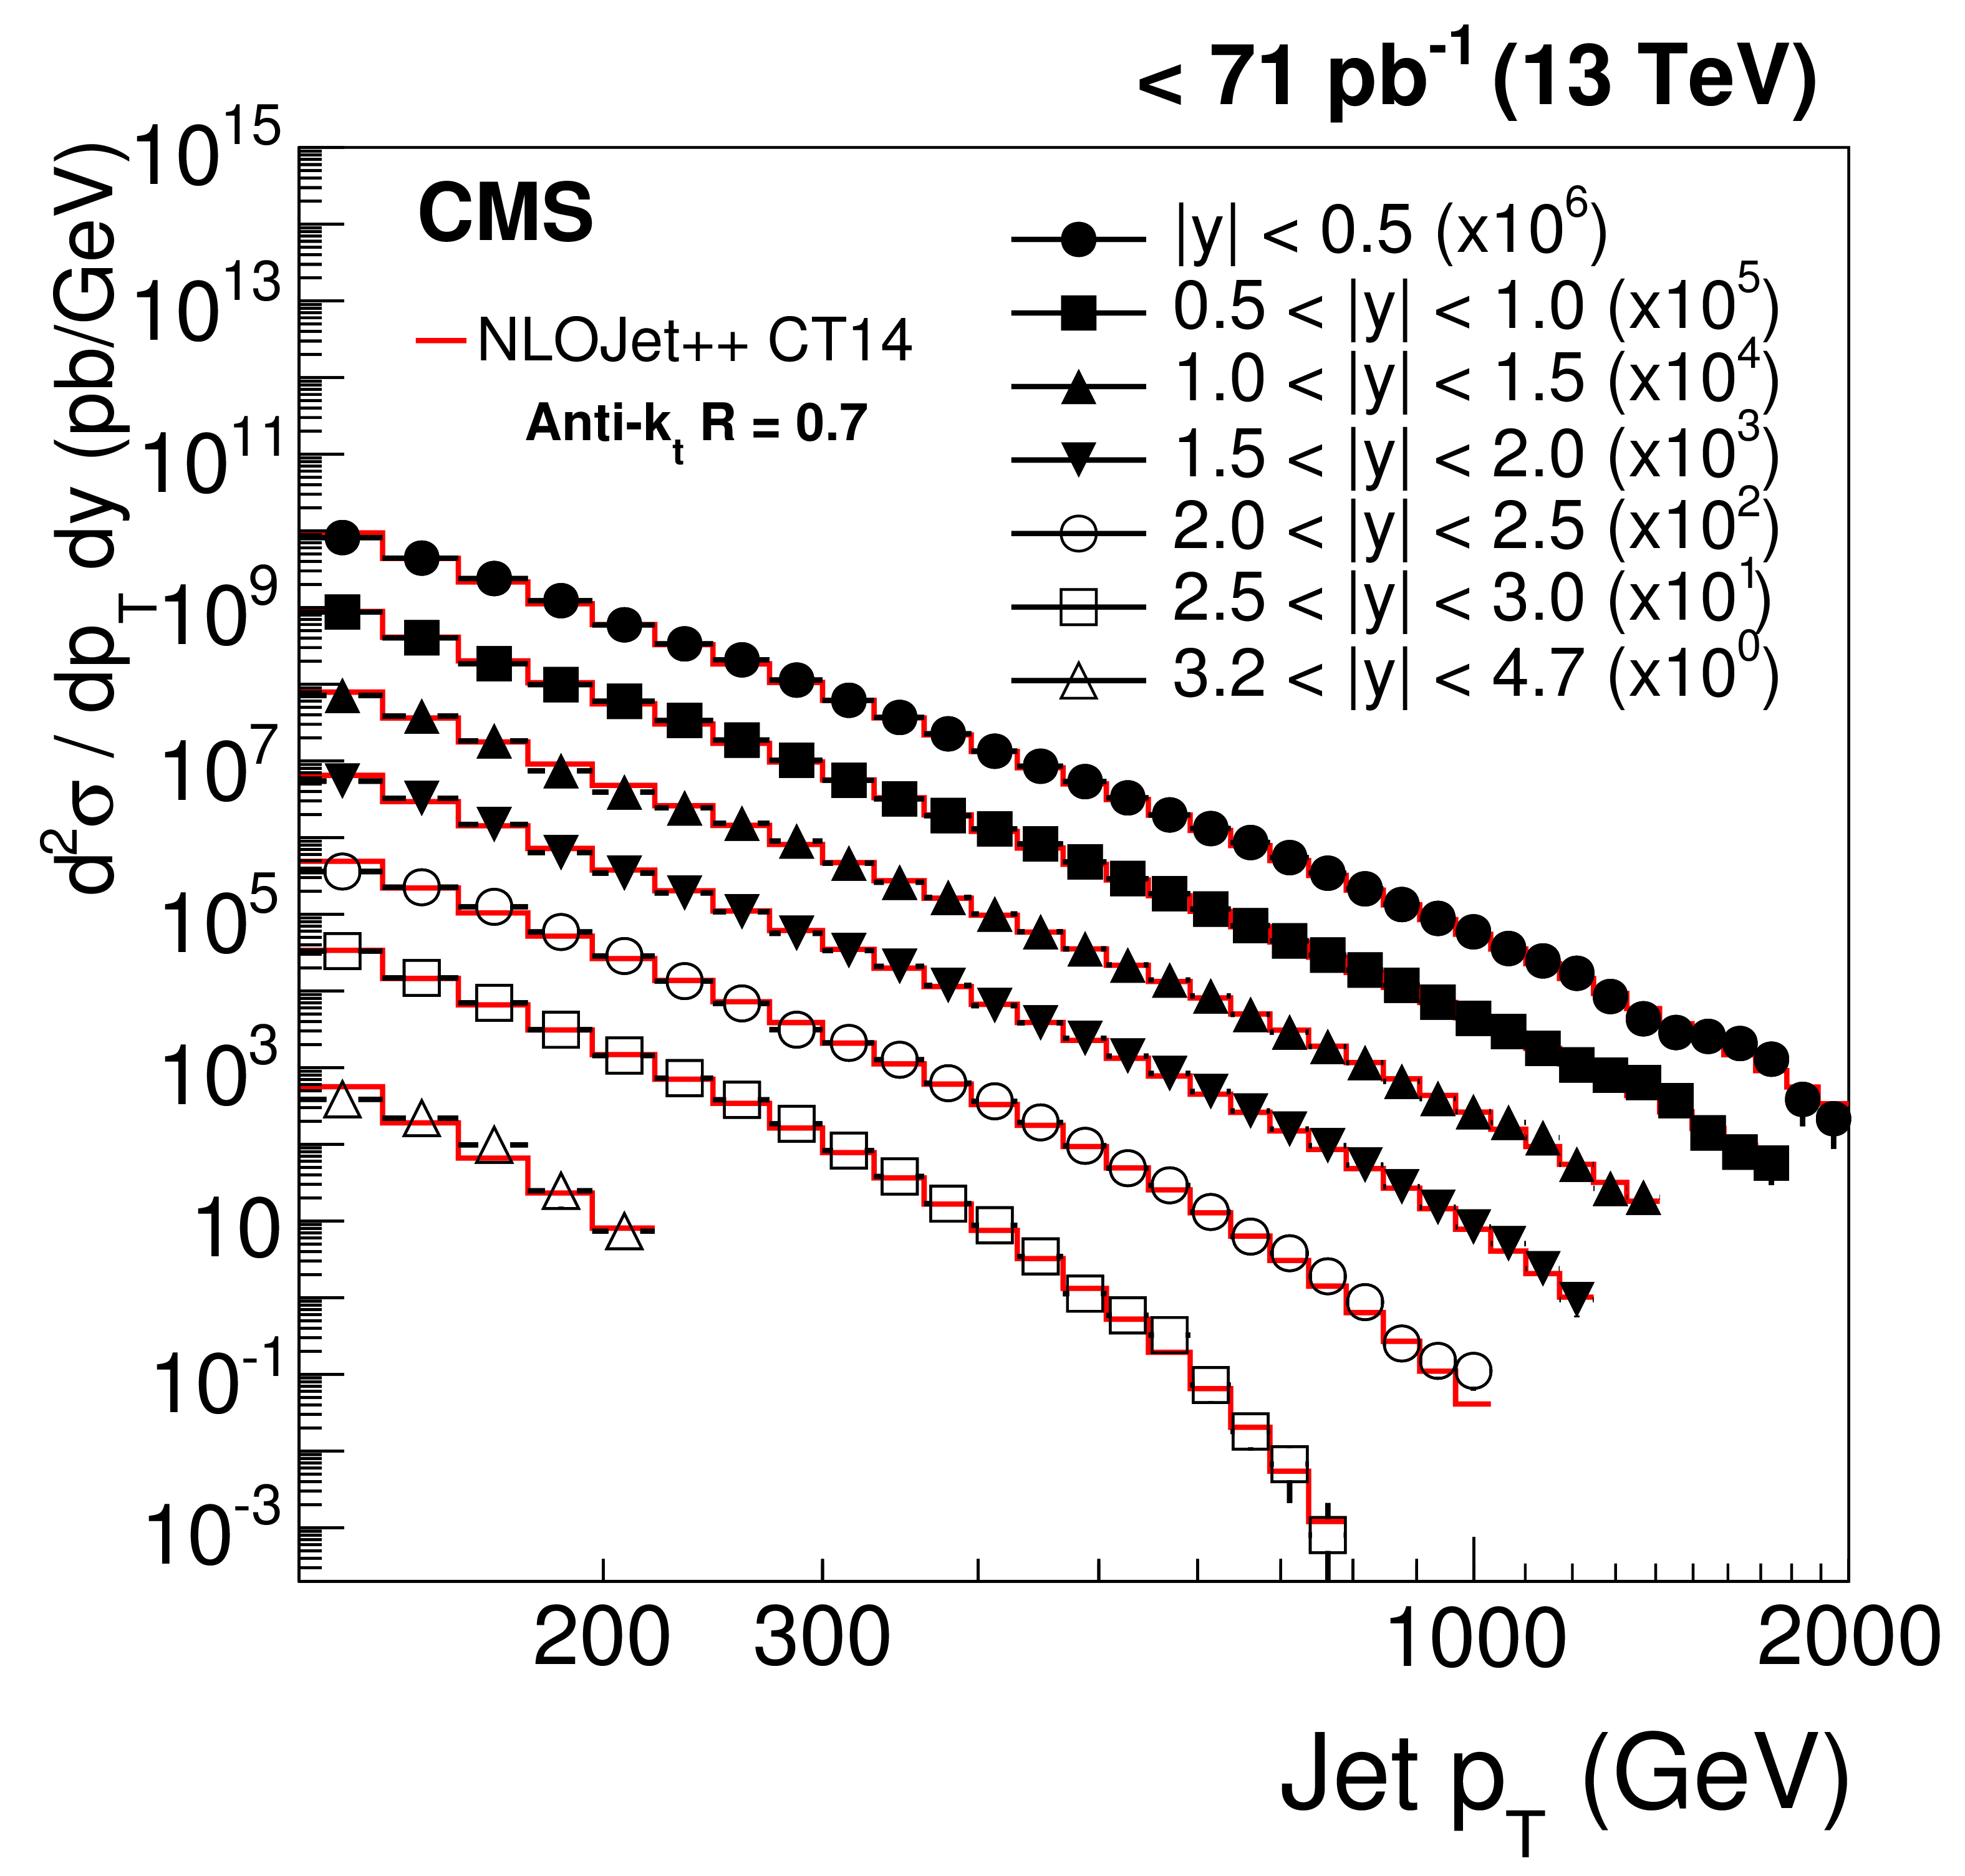
Figure 4-a:
Double-differential inclusive jet cross section as function of jet ${p_{\mathrm {T}}} $. On the left, data (points) and predictions from NLOJet++ based on the CT14 PDF set corrected for the NP and electroweak effects (line) are shown. On the right, data (points) and predictions from POWHEG (PH) + PYTHIA-8 (P8) with tune CUETM1 (line) are shown. Jets are clustered with the anti-$ {k_{\mathrm {t}}}$ algorithm ($R = $ 0.7). |
png pdf |
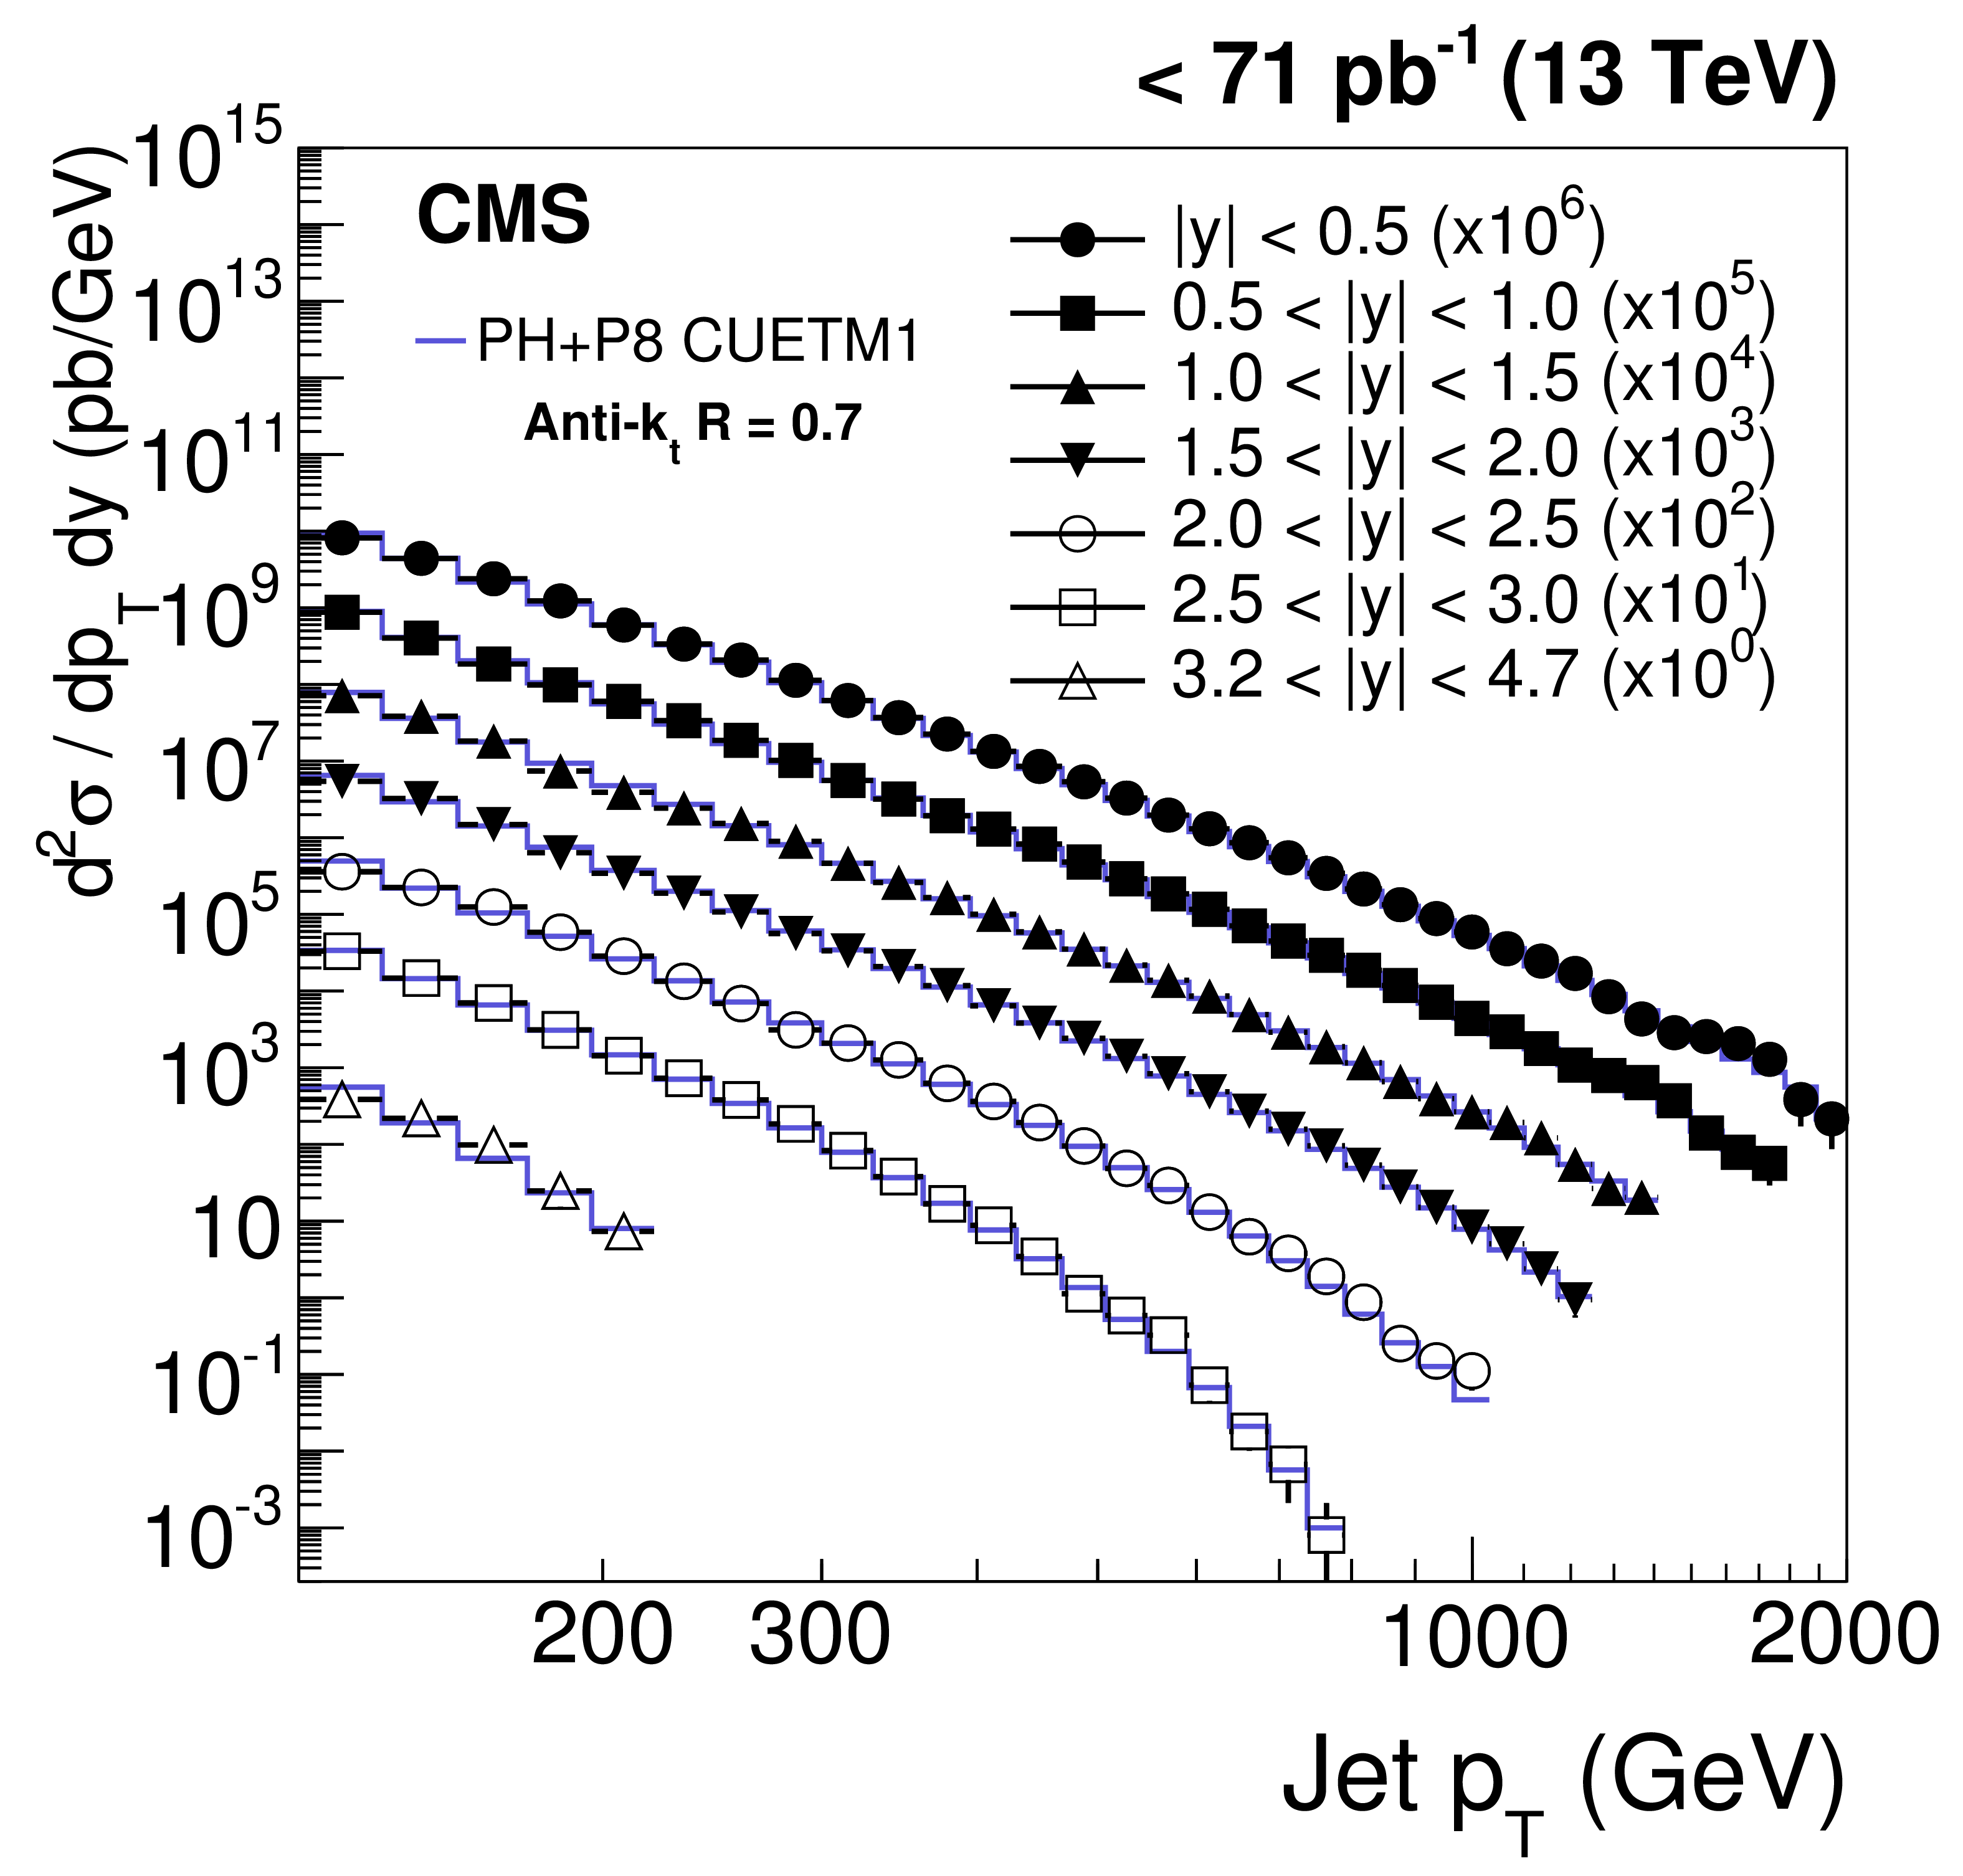
Figure 4-b:
Double-differential inclusive jet cross section as function of jet ${p_{\mathrm {T}}} $. On the left, data (points) and predictions from NLOJet++ based on the CT14 PDF set corrected for the NP and electroweak effects (line) are shown. On the right, data (points) and predictions from POWHEG (PH) + PYTHIA-8 (P8) with tune CUETM1 (line) are shown. Jets are clustered with the anti-$ {k_{\mathrm {t}}}$ algorithm ($R = $ 0.7). |

png pdf |
Figure 5-a:
Double-differential inclusive jet cross section as function of jet ${p_{\mathrm {T}}} $. On the left, data (points) and predictions from NLOJet++ based on the CT14 PDF set corrected for the NP and electroweak effects (line) are shown. On the right, data (points) and predictions fromPOWHEG (PH) + PYTHIA-8 (P8) with tune CUETM1 (line) are shown. Jets are clustered with the anti-$ {k_{\mathrm {t}}}$ algorithm ($R = $ 0.4 ). |

png pdf |
Figure 5-b:
Double-differential inclusive jet cross section as function of jet ${p_{\mathrm {T}}} $. On the left, data (points) and predictions from NLOJet++ based on the CT14 PDF set corrected for the NP and electroweak effects (line) are shown. On the right, data (points) and predictions fromPOWHEG (PH) + PYTHIA-8 (P8) with tune CUETM1 (line) are shown. Jets are clustered with the anti-$ {k_{\mathrm {t}}}$ algorithm ($R = $ 0.4 ). |
png pdf |
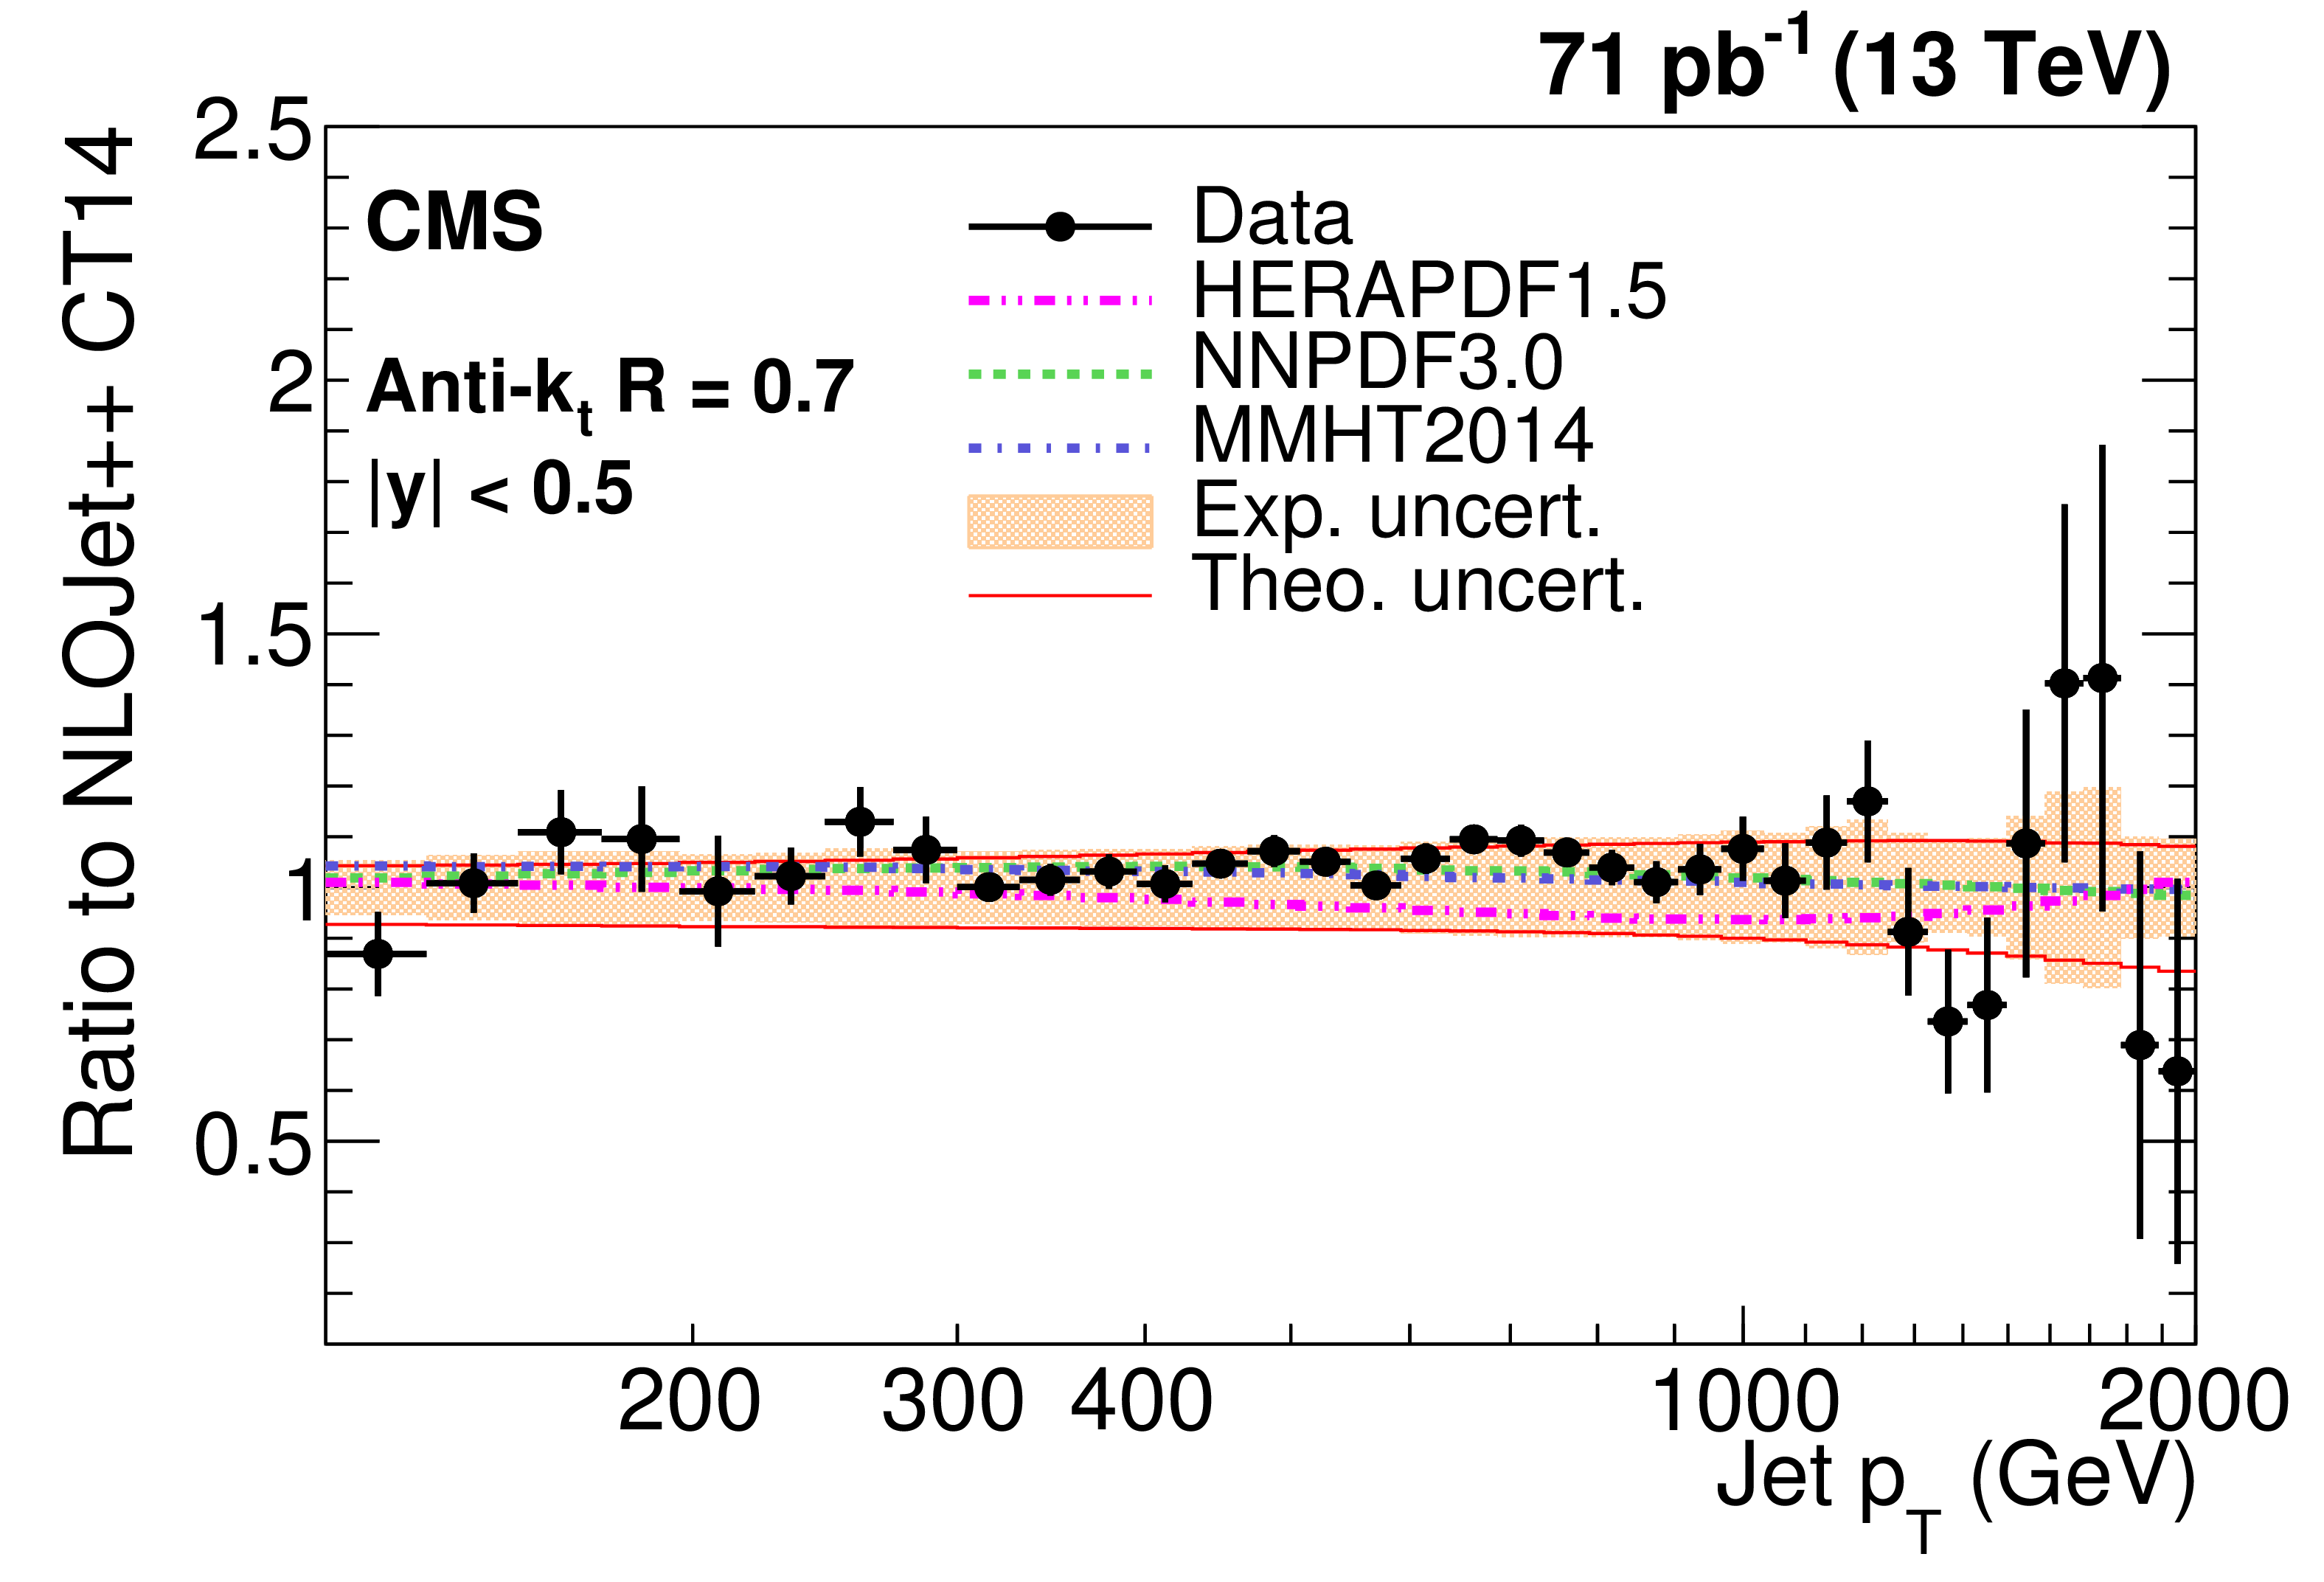
Figure 6-a:
Ratio of measured values to theoretical prediction from NLOJet++ using the CT14 PDF set and corrected for the NP and electroweak effects. Predictions employing three other PDF sets are also shown for comparison. Jets are clustered with the anti-$ {k_{\mathrm {t}}}$ algorithm with a distance parameter of 0.7. The error bars correspond to the statistical uncertainties of the data and the shaded bands to the total experimental systematic uncertainties. |
png pdf |
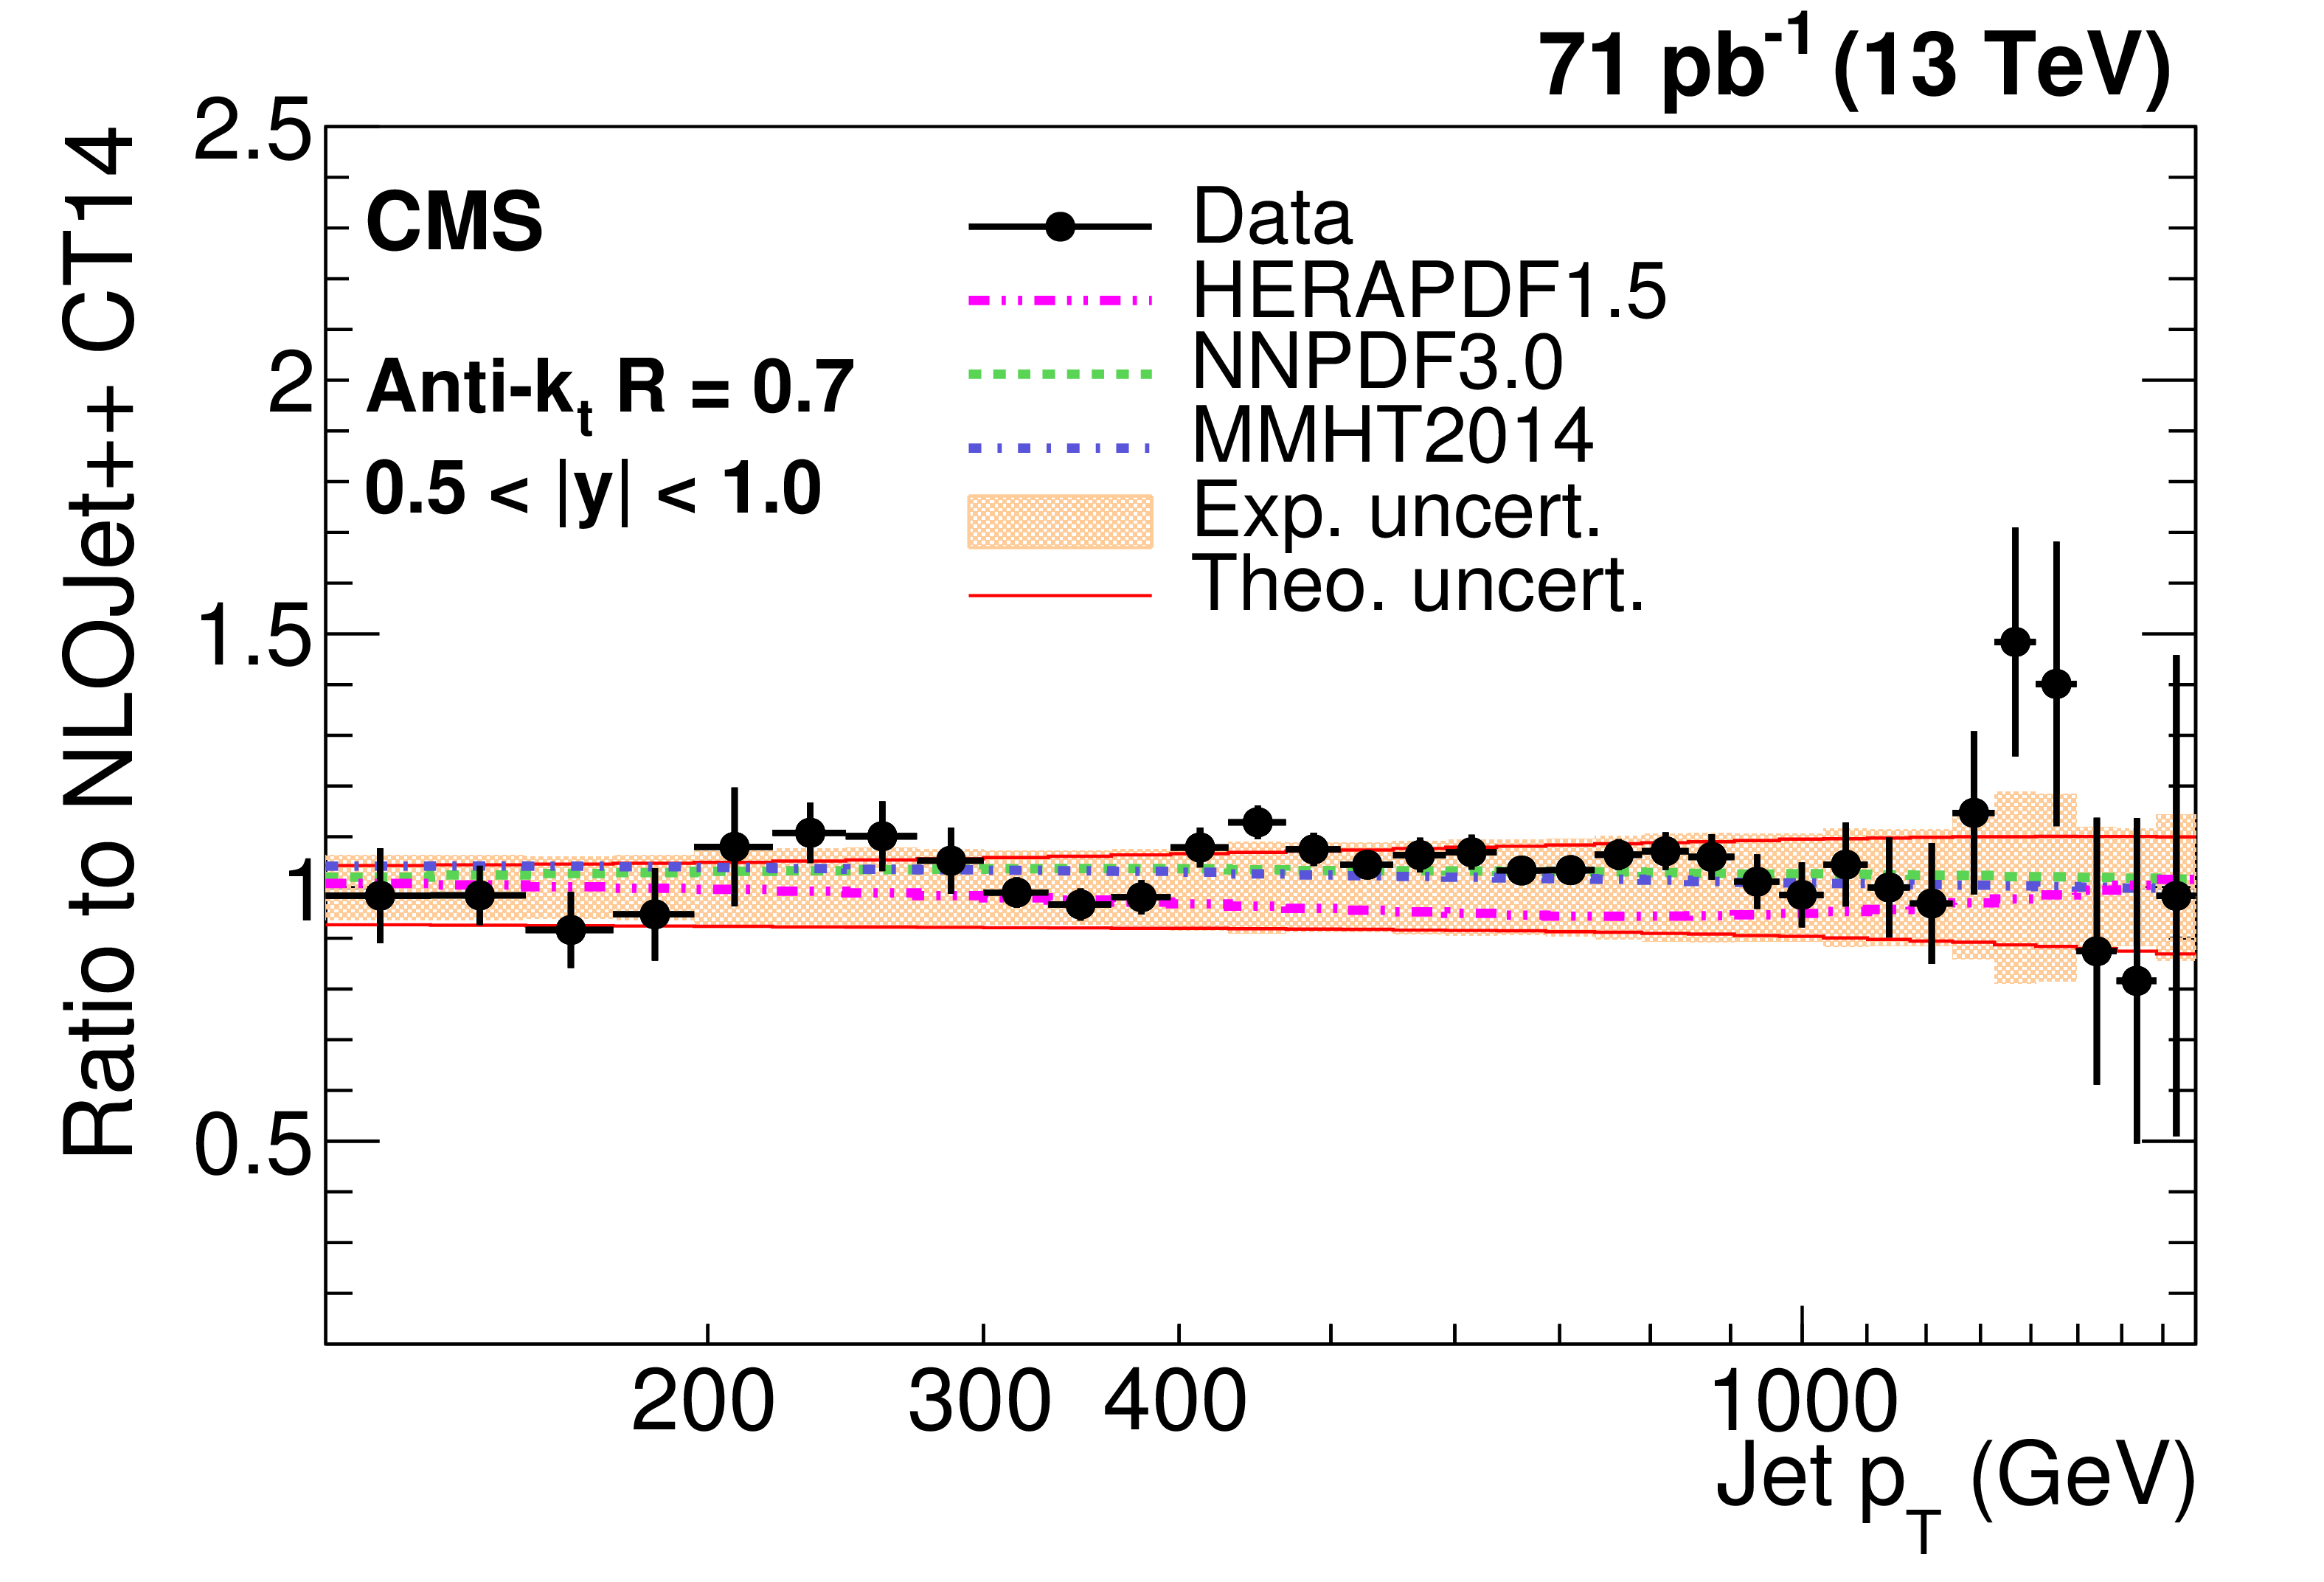
Figure 6-b:
Ratio of measured values to theoretical prediction from NLOJet++ using the CT14 PDF set and corrected for the NP and electroweak effects. Predictions employing three other PDF sets are also shown for comparison. Jets are clustered with the anti-$ {k_{\mathrm {t}}}$ algorithm with a distance parameter of 0.7. The error bars correspond to the statistical uncertainties of the data and the shaded bands to the total experimental systematic uncertainties. |

png pdf |
Figure 6-c:
Ratio of measured values to theoretical prediction from NLOJet++ using the CT14 PDF set and corrected for the NP and electroweak effects. Predictions employing three other PDF sets are also shown for comparison. Jets are clustered with the anti-$ {k_{\mathrm {t}}}$ algorithm with a distance parameter of 0.7. The error bars correspond to the statistical uncertainties of the data and the shaded bands to the total experimental systematic uncertainties. |

png pdf |
Figure 6-d:
Ratio of measured values to theoretical prediction from NLOJet++ using the CT14 PDF set and corrected for the NP and electroweak effects. Predictions employing three other PDF sets are also shown for comparison. Jets are clustered with the anti-$ {k_{\mathrm {t}}}$ algorithm with a distance parameter of 0.7. The error bars correspond to the statistical uncertainties of the data and the shaded bands to the total experimental systematic uncertainties. |

png pdf |
Figure 6-e:
Ratio of measured values to theoretical prediction from NLOJet++ using the CT14 PDF set and corrected for the NP and electroweak effects. Predictions employing three other PDF sets are also shown for comparison. Jets are clustered with the anti-$ {k_{\mathrm {t}}}$ algorithm with a distance parameter of 0.7. The error bars correspond to the statistical uncertainties of the data and the shaded bands to the total experimental systematic uncertainties. |
png pdf |
Figure 6-f:
Ratio of measured values to theoretical prediction from NLOJet++ using the CT14 PDF set and corrected for the NP and electroweak effects. Predictions employing three other PDF sets are also shown for comparison. Jets are clustered with the anti-$ {k_{\mathrm {t}}}$ algorithm with a distance parameter of 0.7. The error bars correspond to the statistical uncertainties of the data and the shaded bands to the total experimental systematic uncertainties. |

png pdf |
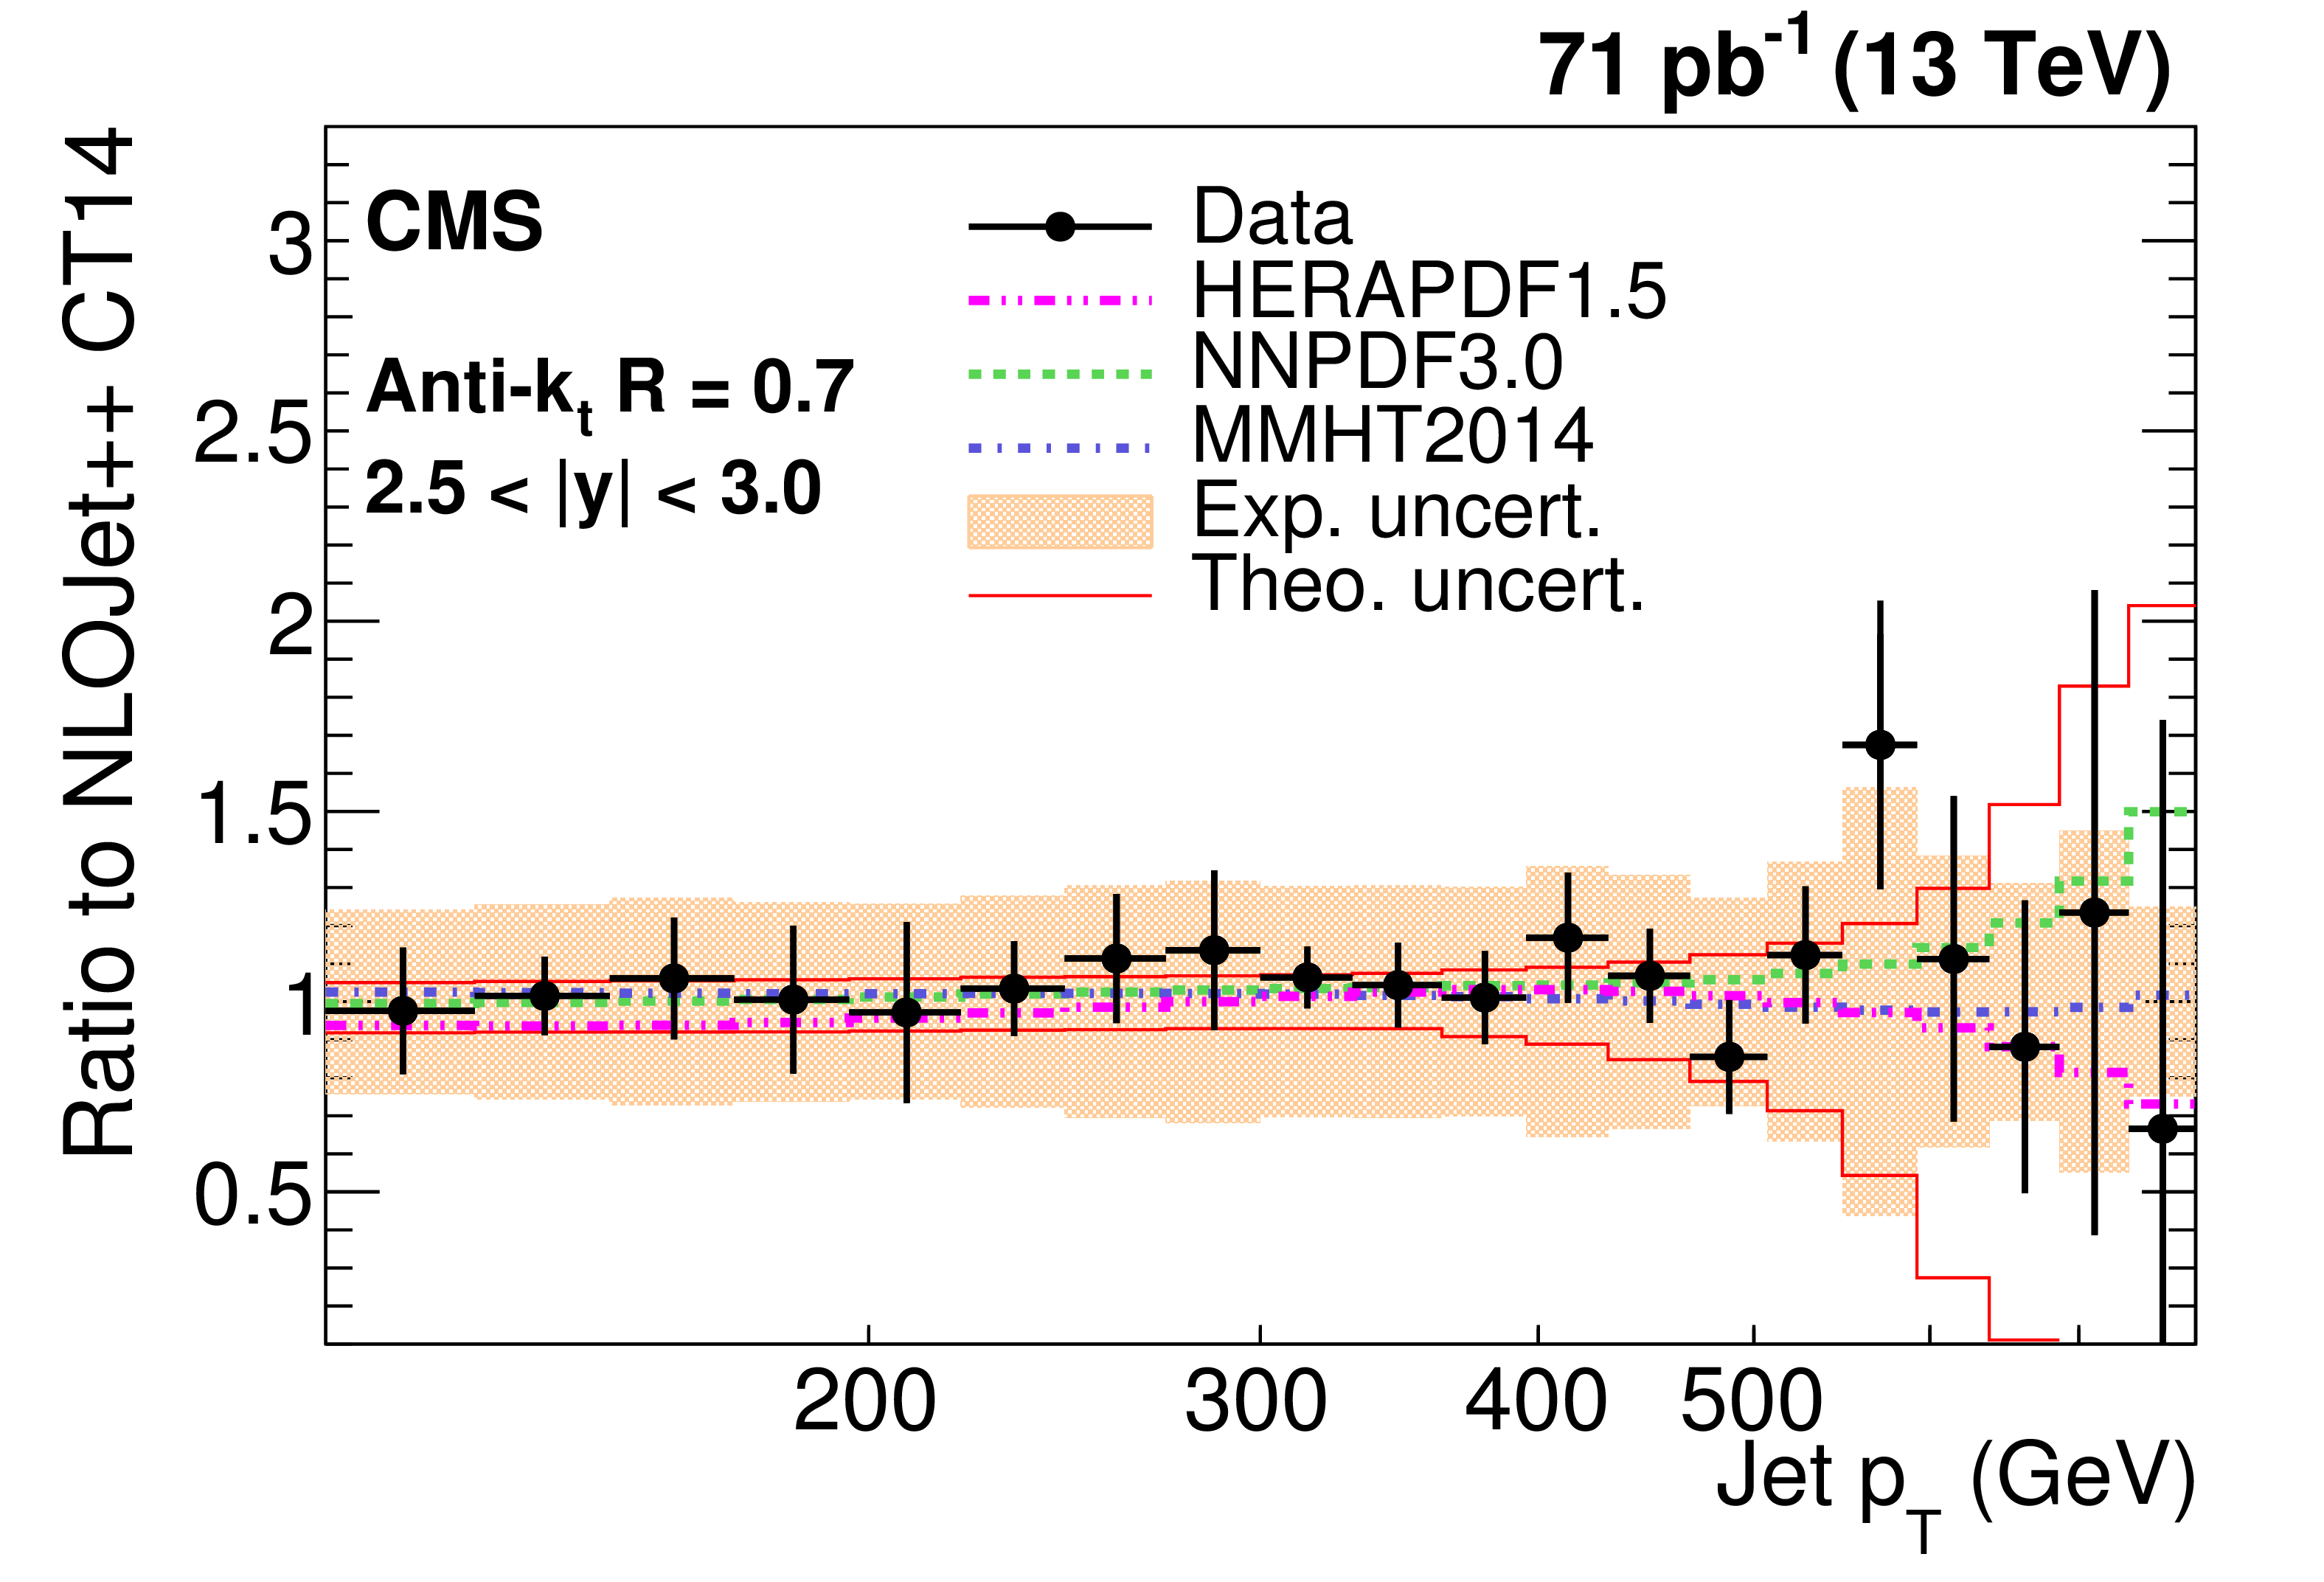
Figure 6-g:
Ratio of measured values to theoretical prediction from NLOJet++ using the CT14 PDF set and corrected for the NP and electroweak effects. Predictions employing three other PDF sets are also shown for comparison. Jets are clustered with the anti-$ {k_{\mathrm {t}}}$ algorithm with a distance parameter of 0.7. The error bars correspond to the statistical uncertainties of the data and the shaded bands to the total experimental systematic uncertainties. |

png pdf |
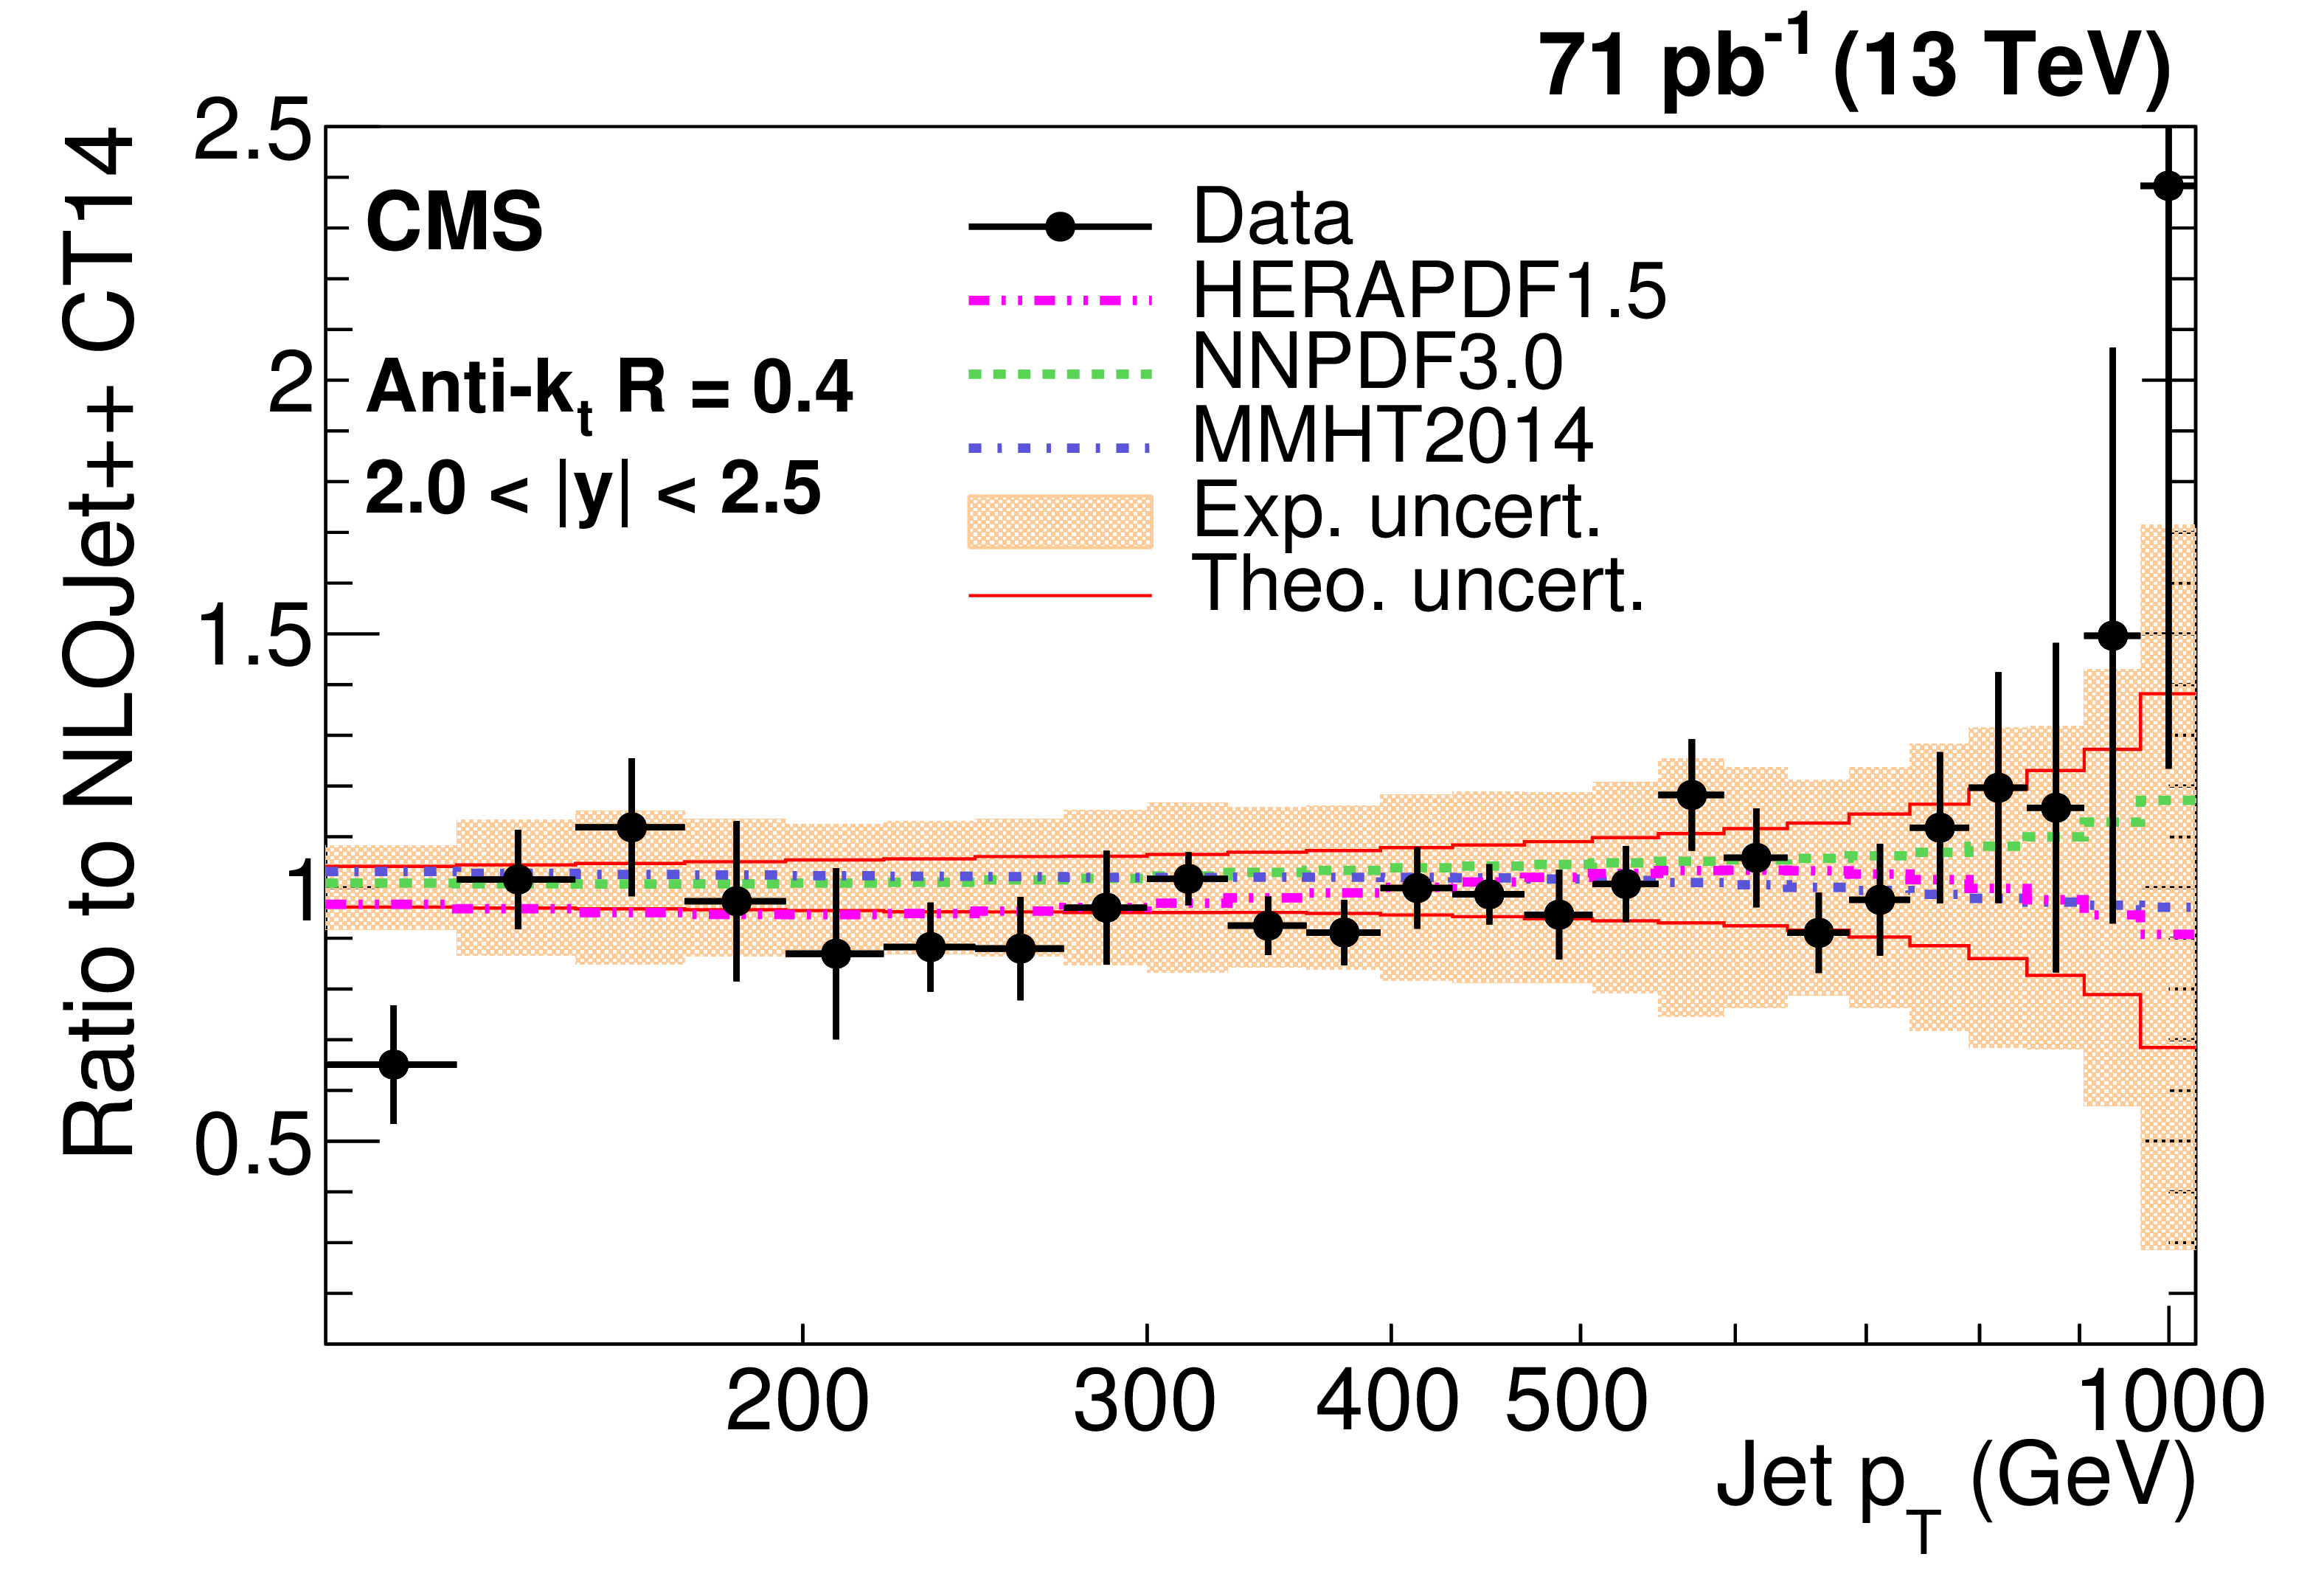
Figure 7-a:
Ratio of measured values to theoretical prediction from NLOJet++ using the CT14 PDF set and corrected for the NP and electroweak effects. Predictions employing three other PDF sets are also shown for comparison. Jets are clustered with the anti-$ {k_{\mathrm {t}}}$ algorithm with a distance parameter of 0.4. The error bars correspond to the statistical uncertainties of the data and the shaded bands to the total experimental systematic uncertainties. |
png pdf |
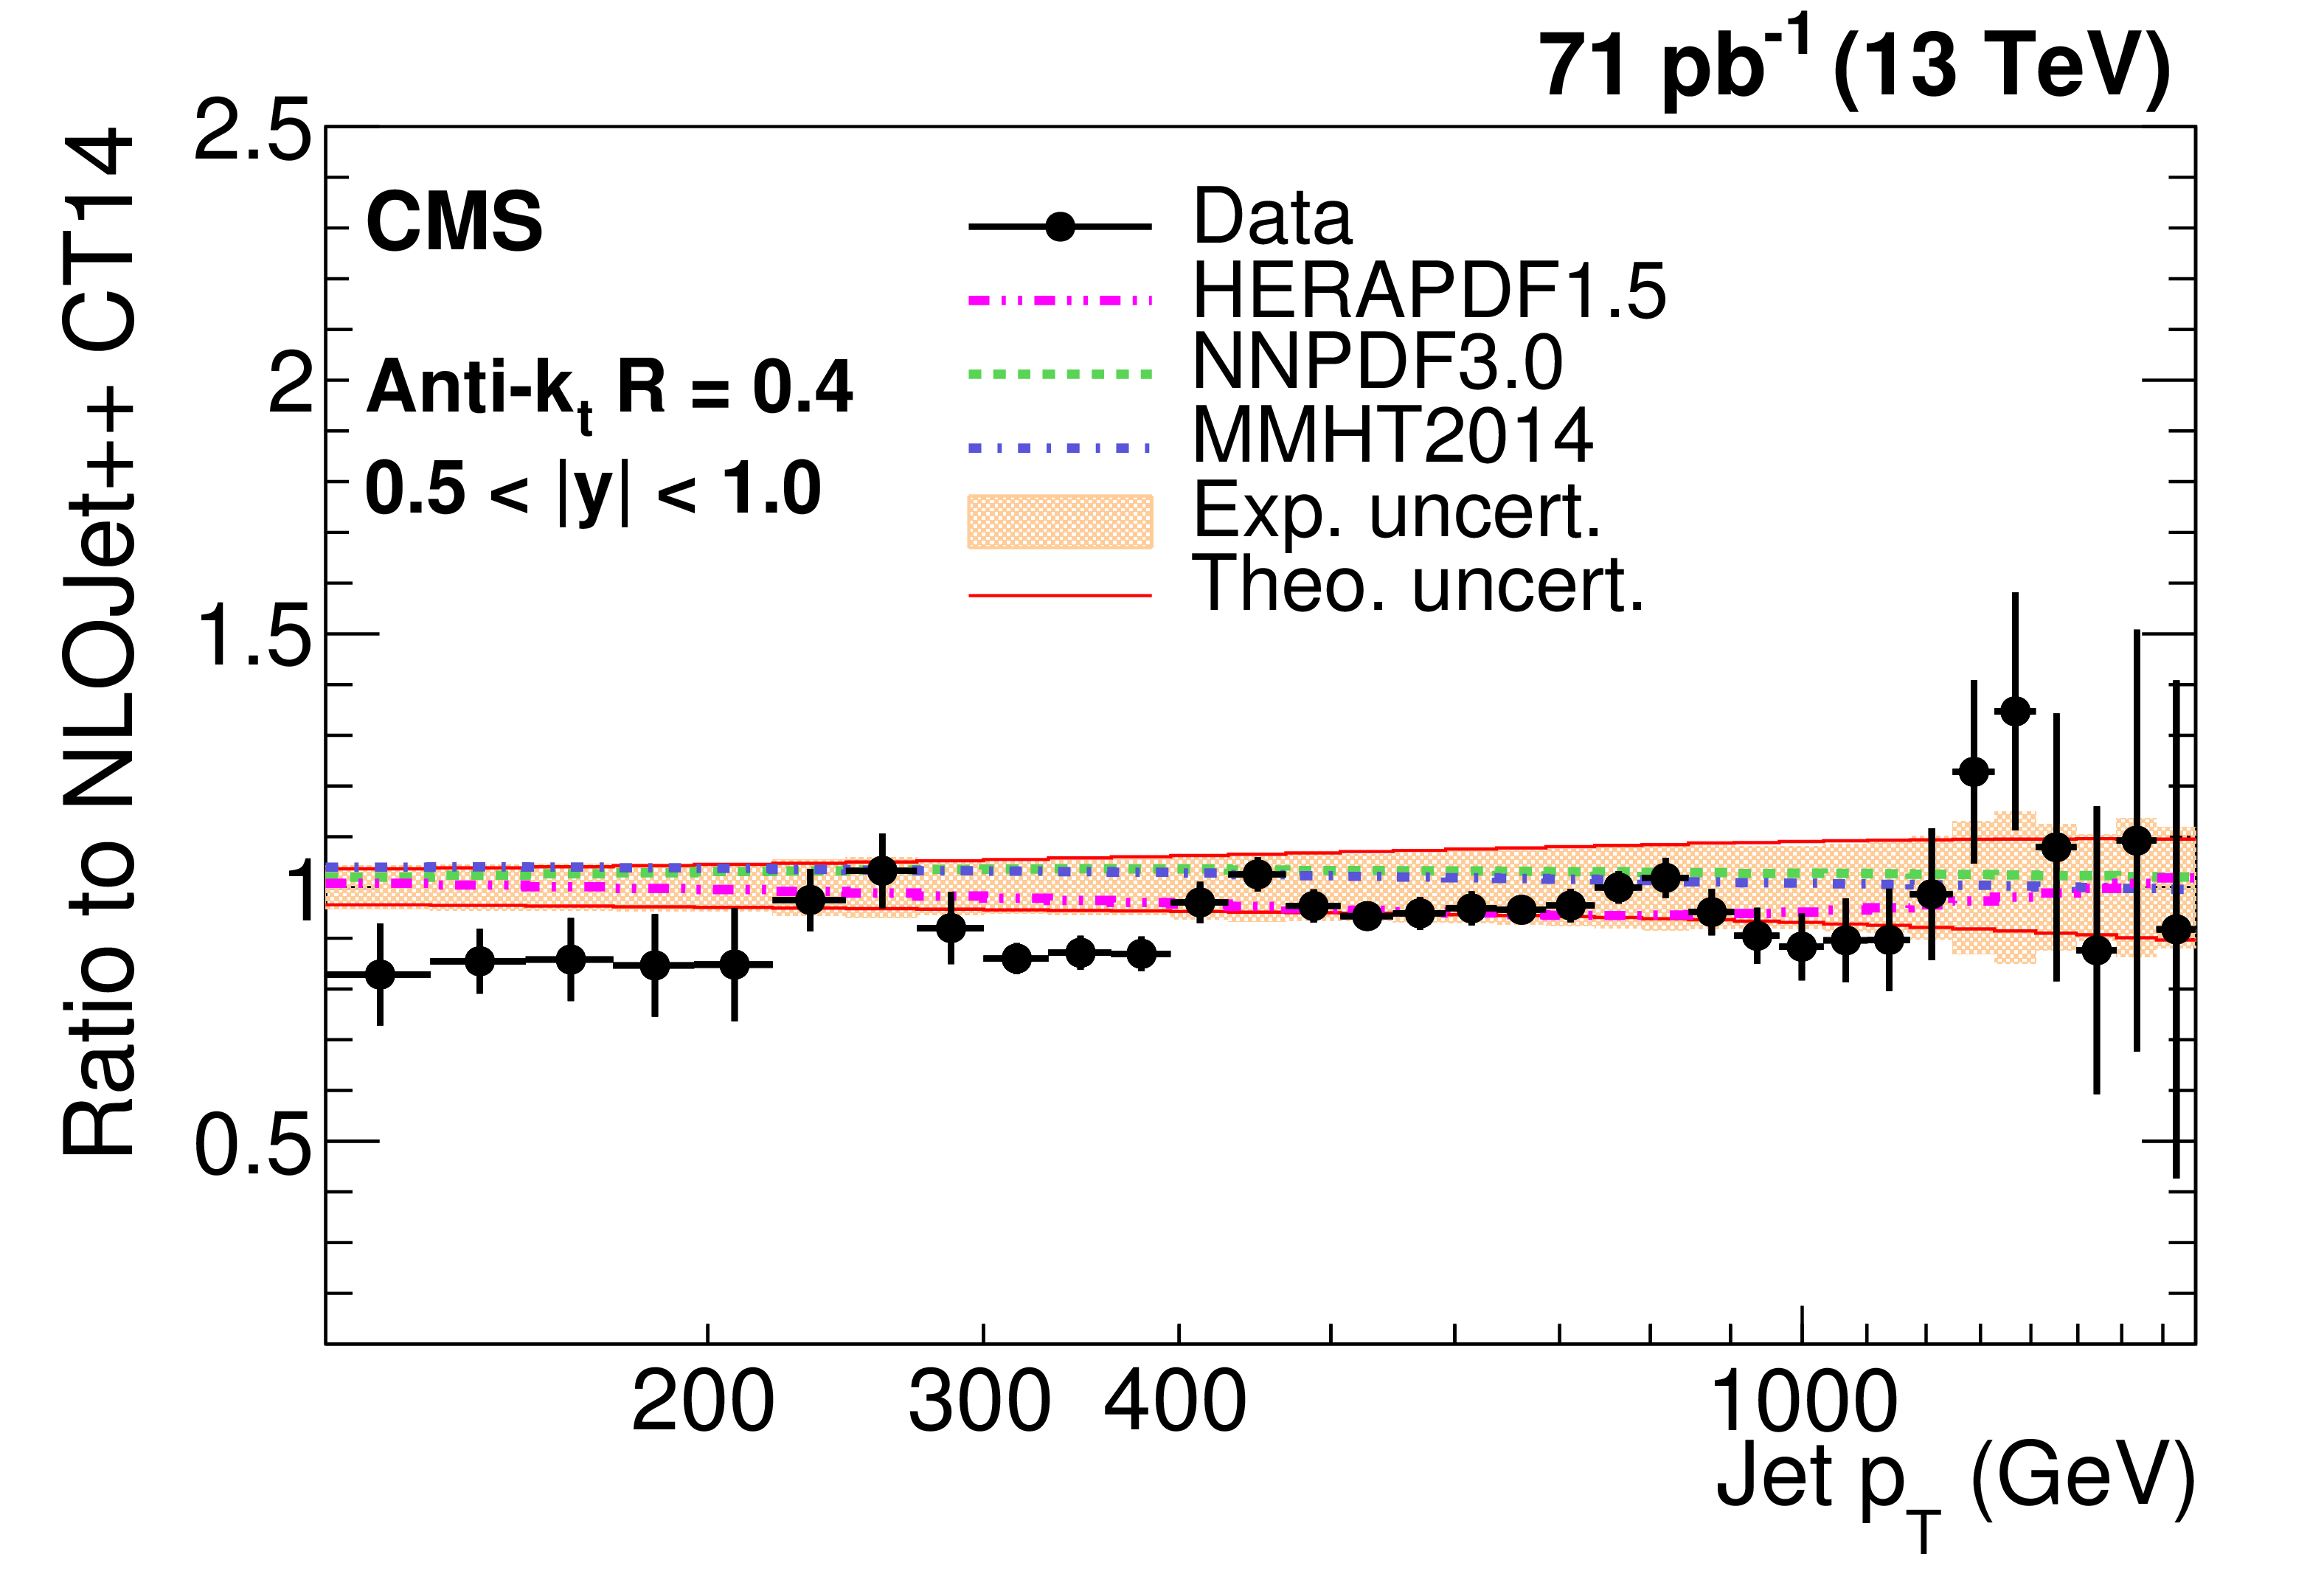
Figure 7-b:
Ratio of measured values to theoretical prediction from NLOJet++ using the CT14 PDF set and corrected for the NP and electroweak effects. Predictions employing three other PDF sets are also shown for comparison. Jets are clustered with the anti-$ {k_{\mathrm {t}}}$ algorithm with a distance parameter of 0.4. The error bars correspond to the statistical uncertainties of the data and the shaded bands to the total experimental systematic uncertainties. |

png pdf |
Figure 7-c:
Ratio of measured values to theoretical prediction from NLOJet++ using the CT14 PDF set and corrected for the NP and electroweak effects. Predictions employing three other PDF sets are also shown for comparison. Jets are clustered with the anti-$ {k_{\mathrm {t}}}$ algorithm with a distance parameter of 0.4. The error bars correspond to the statistical uncertainties of the data and the shaded bands to the total experimental systematic uncertainties. |

png pdf |
Figure 7-d:
Ratio of measured values to theoretical prediction from NLOJet++ using the CT14 PDF set and corrected for the NP and electroweak effects. Predictions employing three other PDF sets are also shown for comparison. Jets are clustered with the anti-$ {k_{\mathrm {t}}}$ algorithm with a distance parameter of 0.4. The error bars correspond to the statistical uncertainties of the data and the shaded bands to the total experimental systematic uncertainties. |
png pdf |
Figure 7-e:
Ratio of measured values to theoretical prediction from NLOJet++ using the CT14 PDF set and corrected for the NP and electroweak effects. Predictions employing three other PDF sets are also shown for comparison. Jets are clustered with the anti-$ {k_{\mathrm {t}}}$ algorithm with a distance parameter of 0.4. The error bars correspond to the statistical uncertainties of the data and the shaded bands to the total experimental systematic uncertainties. |

png pdf |
Figure 7-f:
Ratio of measured values to theoretical prediction from NLOJet++ using the CT14 PDF set and corrected for the NP and electroweak effects. Predictions employing three other PDF sets are also shown for comparison. Jets are clustered with the anti-$ {k_{\mathrm {t}}}$ algorithm with a distance parameter of 0.4. The error bars correspond to the statistical uncertainties of the data and the shaded bands to the total experimental systematic uncertainties. |
png pdf |
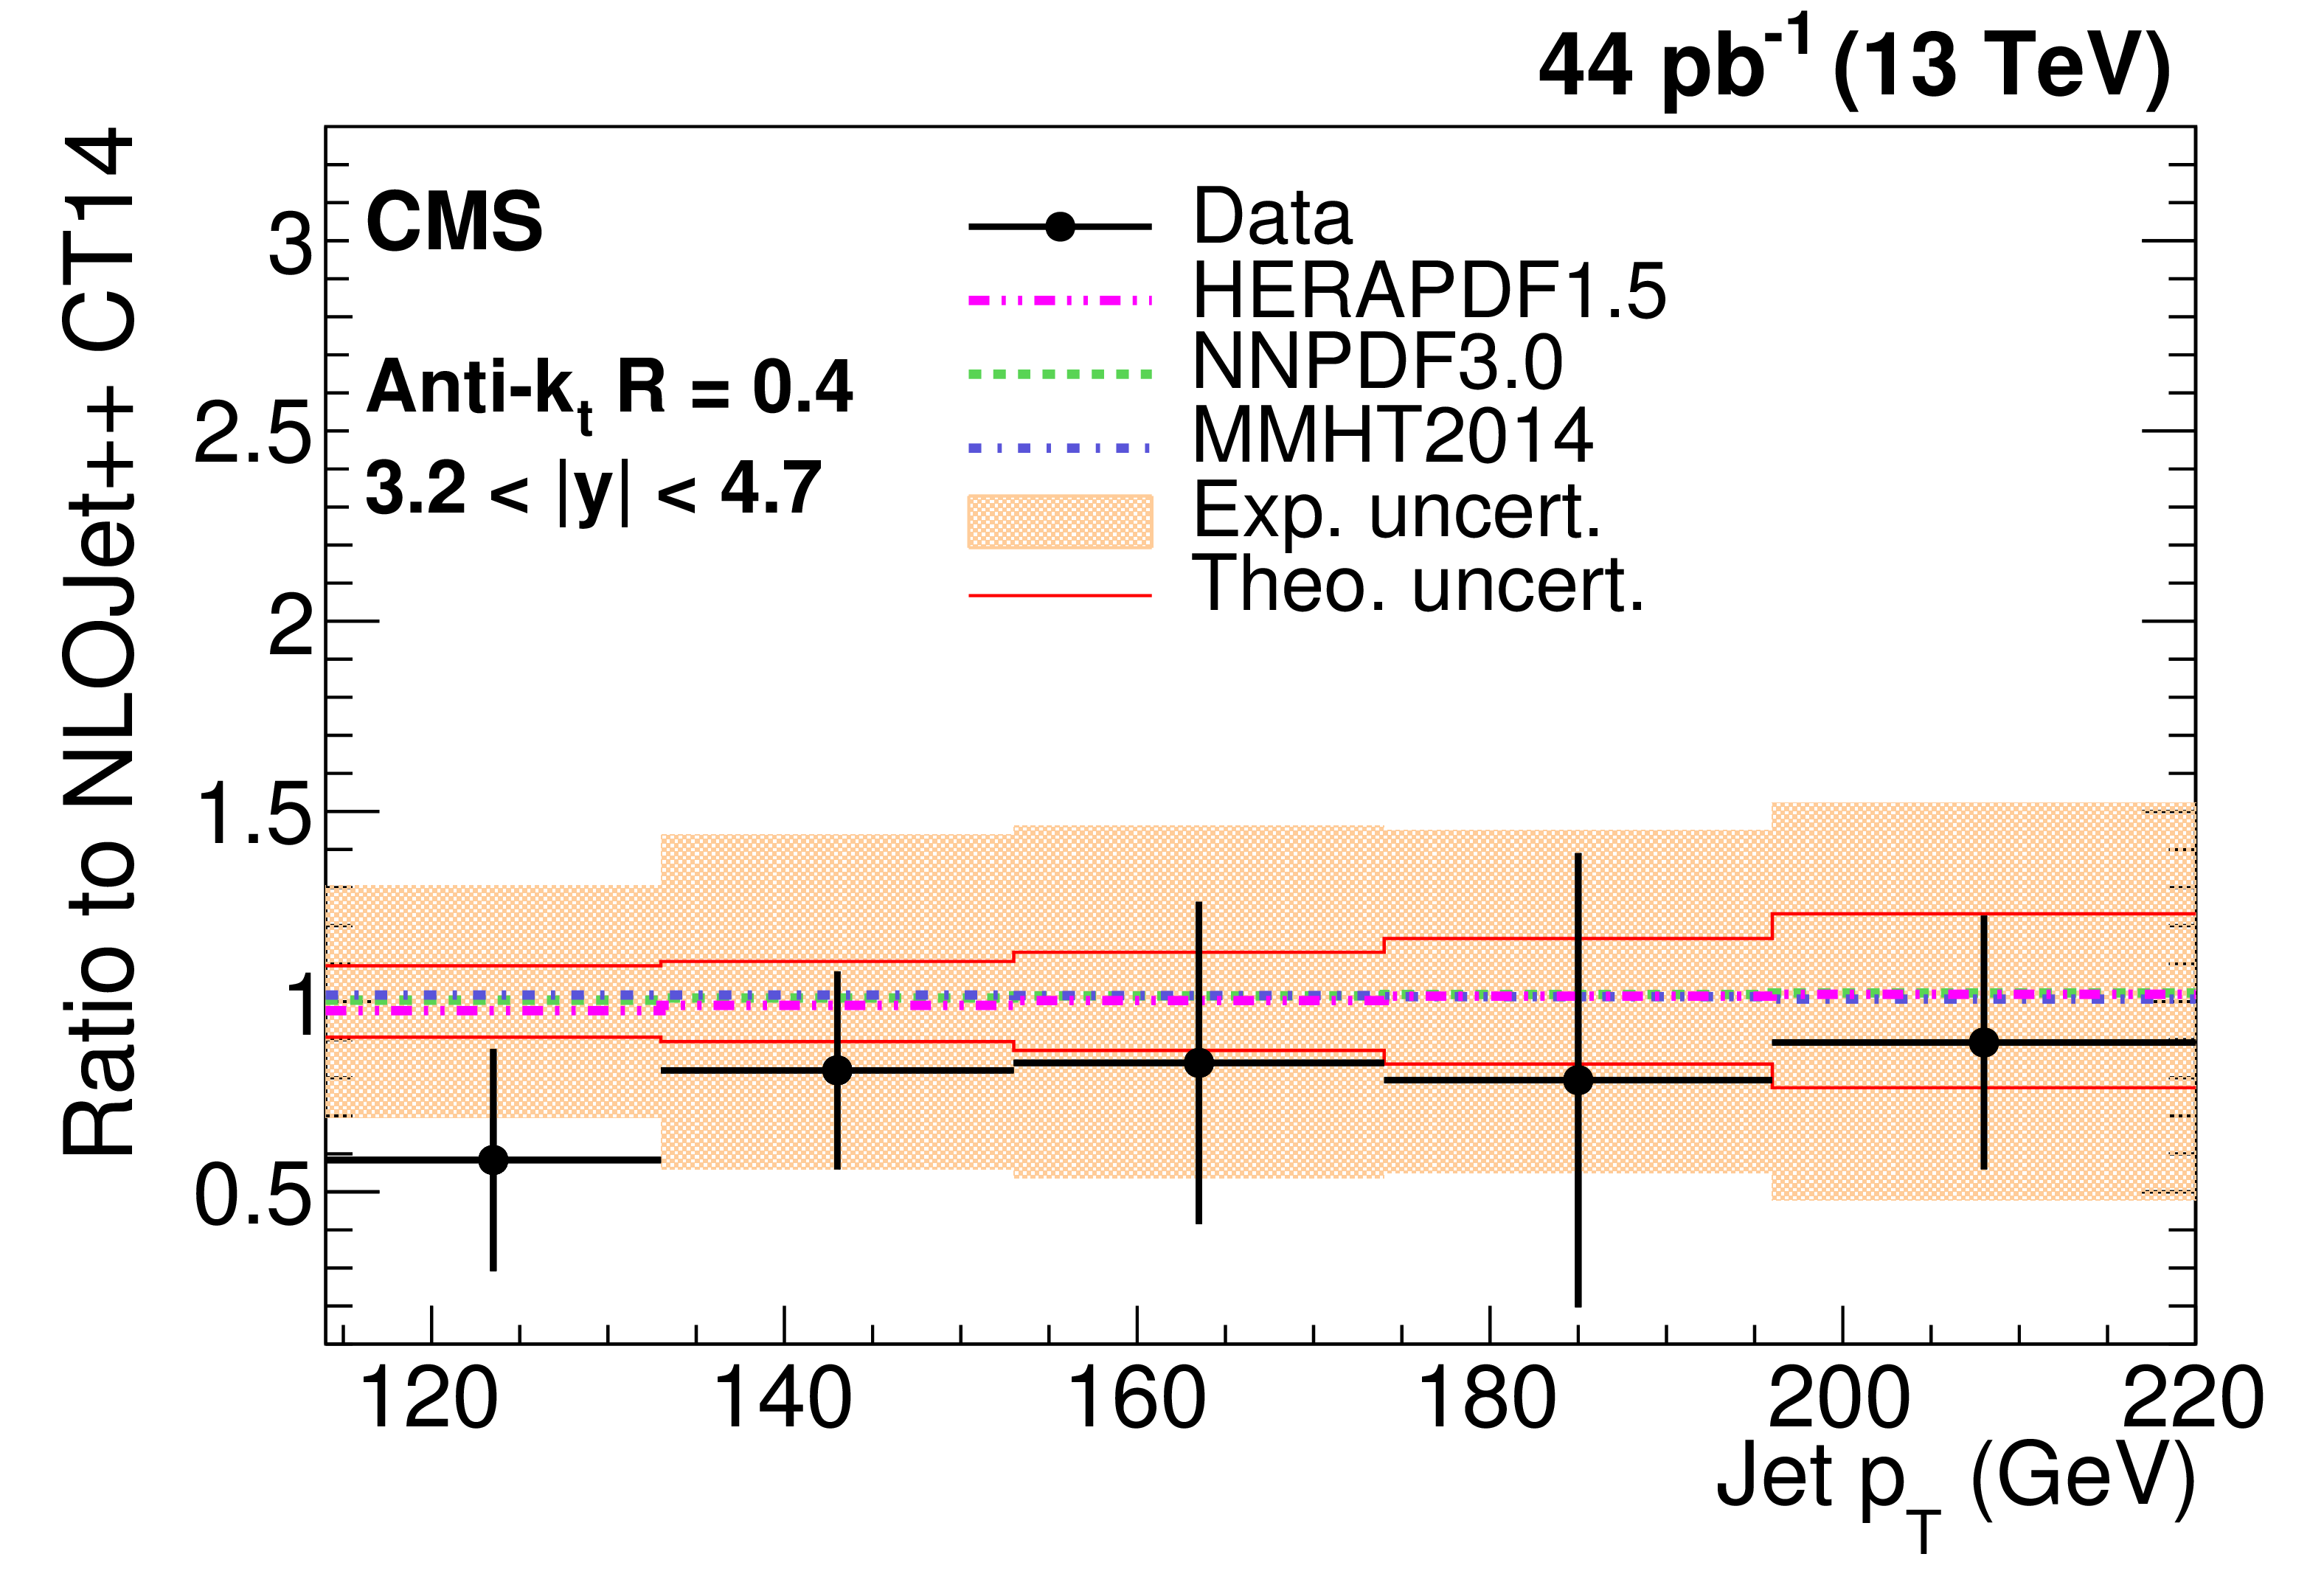
Figure 7-g:
Ratio of measured values to theoretical prediction from NLOJet++ using the CT14 PDF set and corrected for the NP and electroweak effects. Predictions employing three other PDF sets are also shown for comparison. Jets are clustered with the anti-$ {k_{\mathrm {t}}}$ algorithm with a distance parameter of 0.4. The error bars correspond to the statistical uncertainties of the data and the shaded bands to the total experimental systematic uncertainties. |
png pdf |
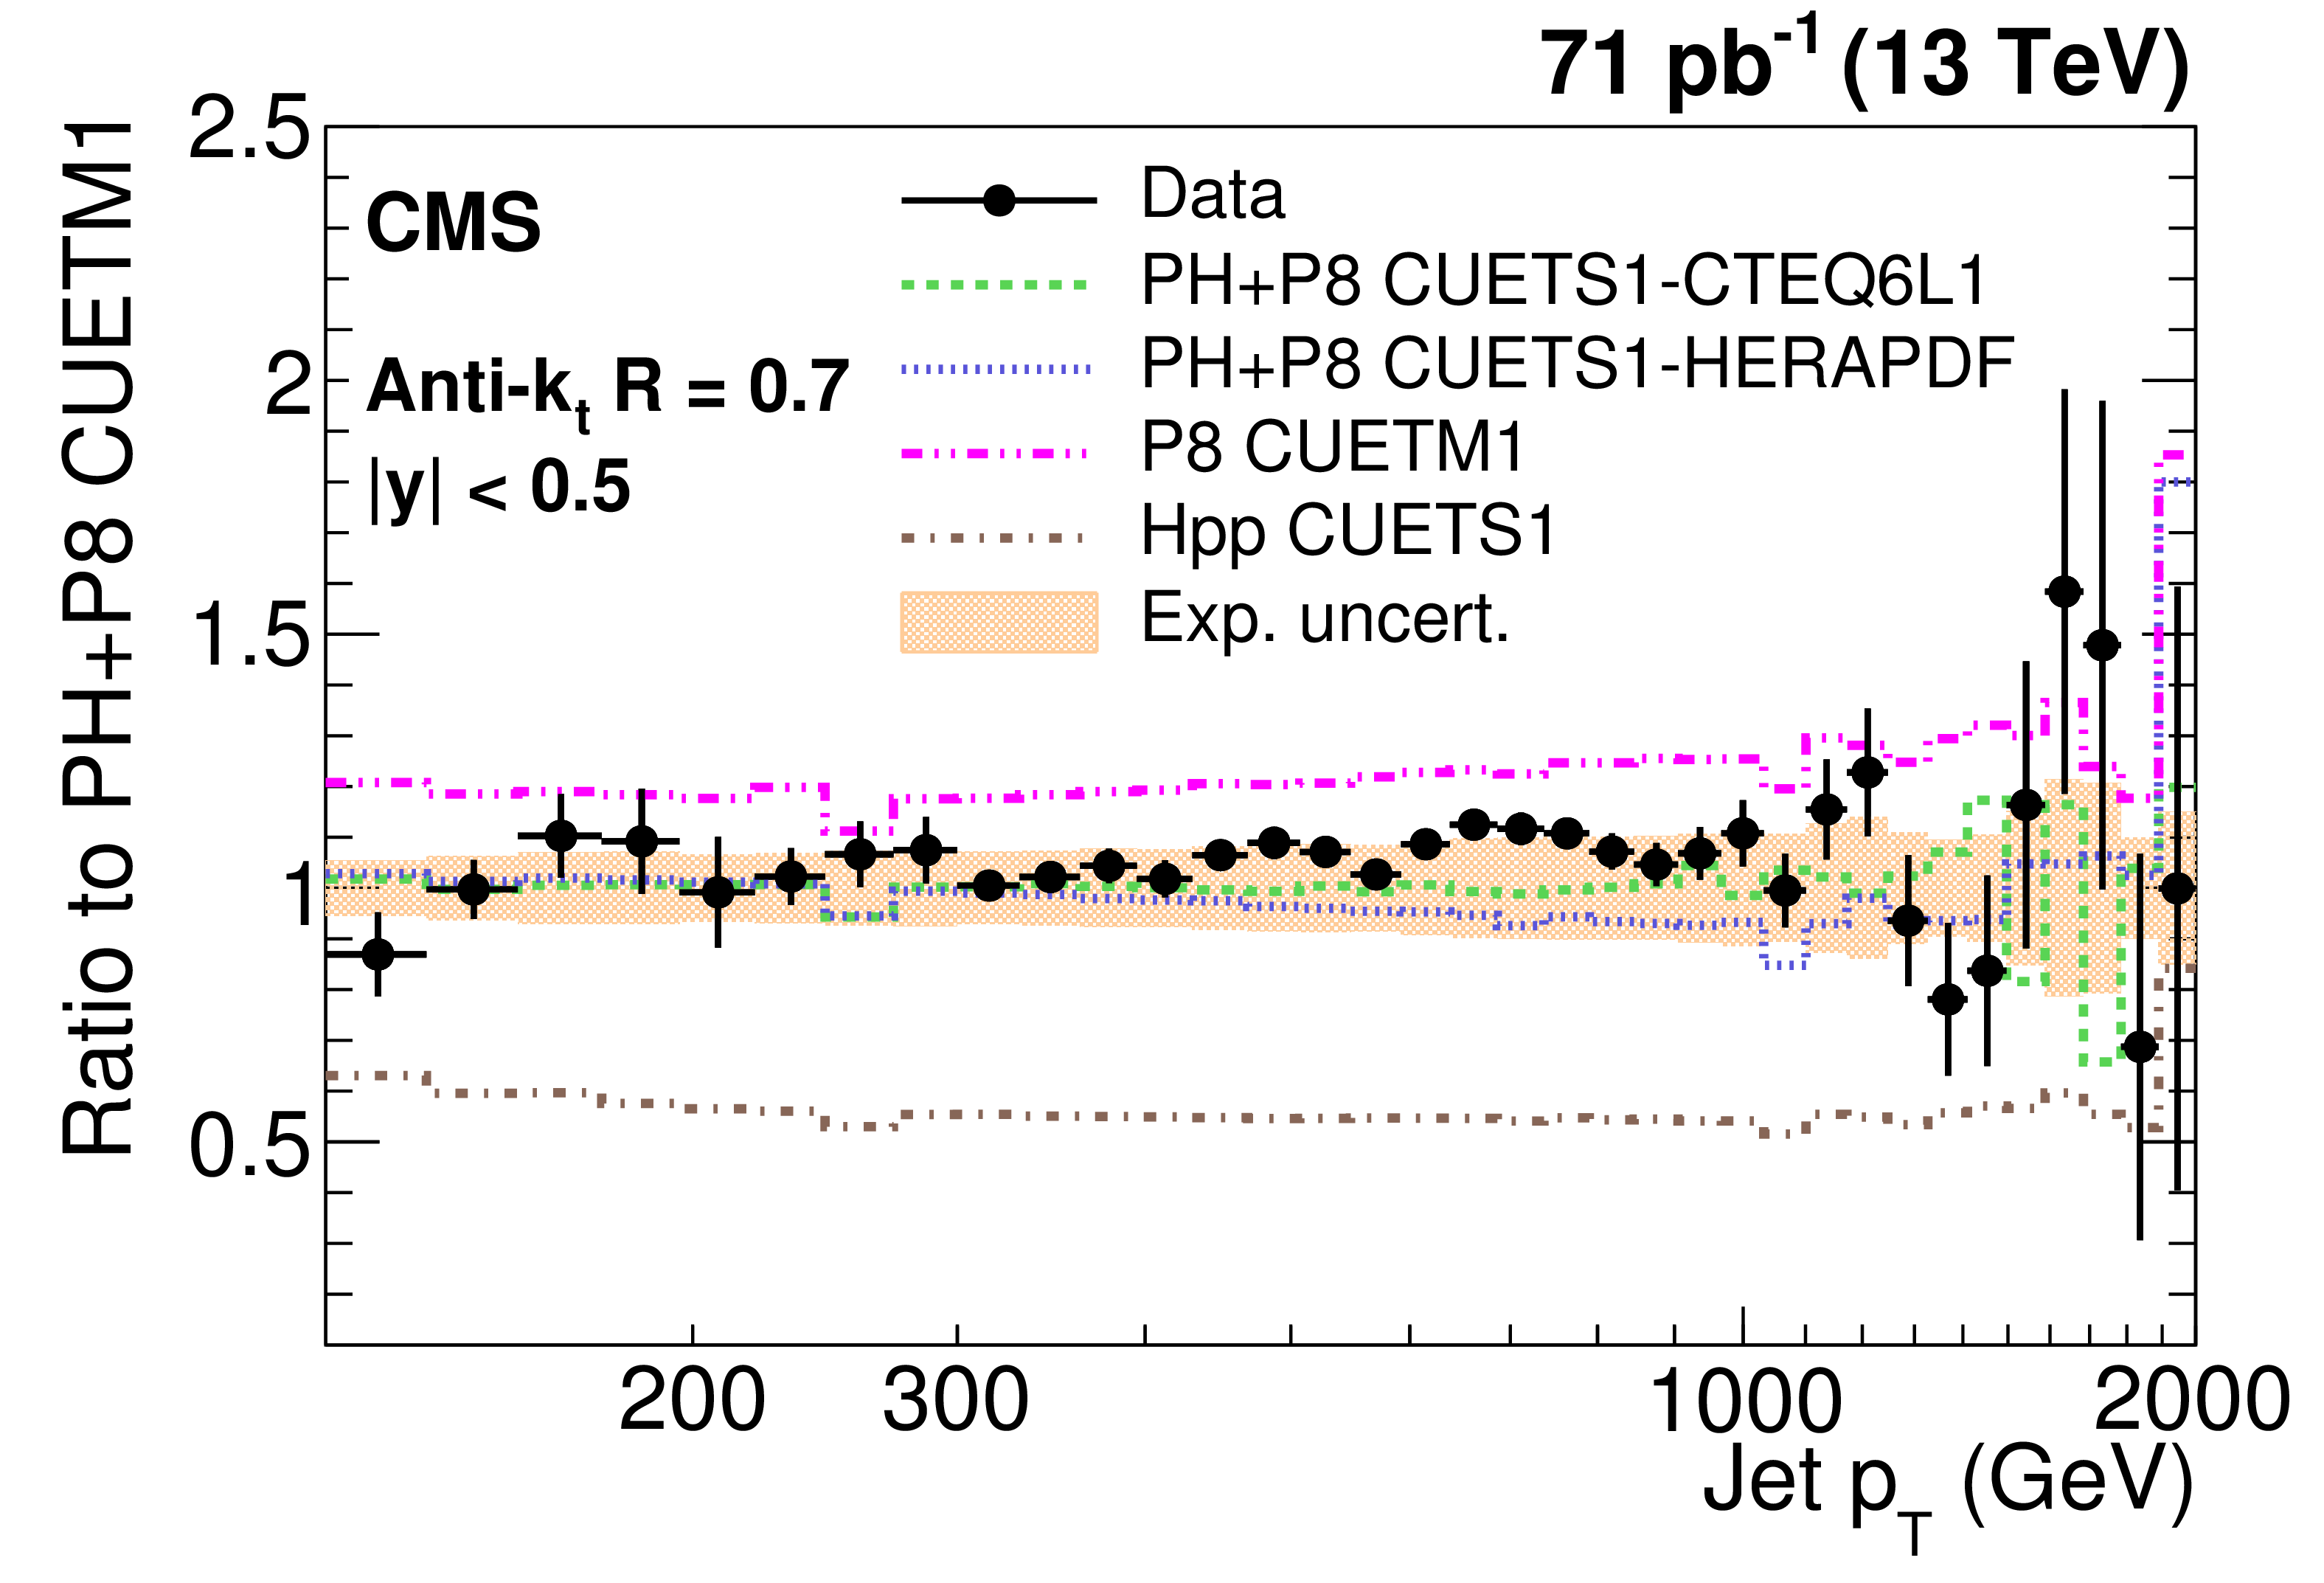
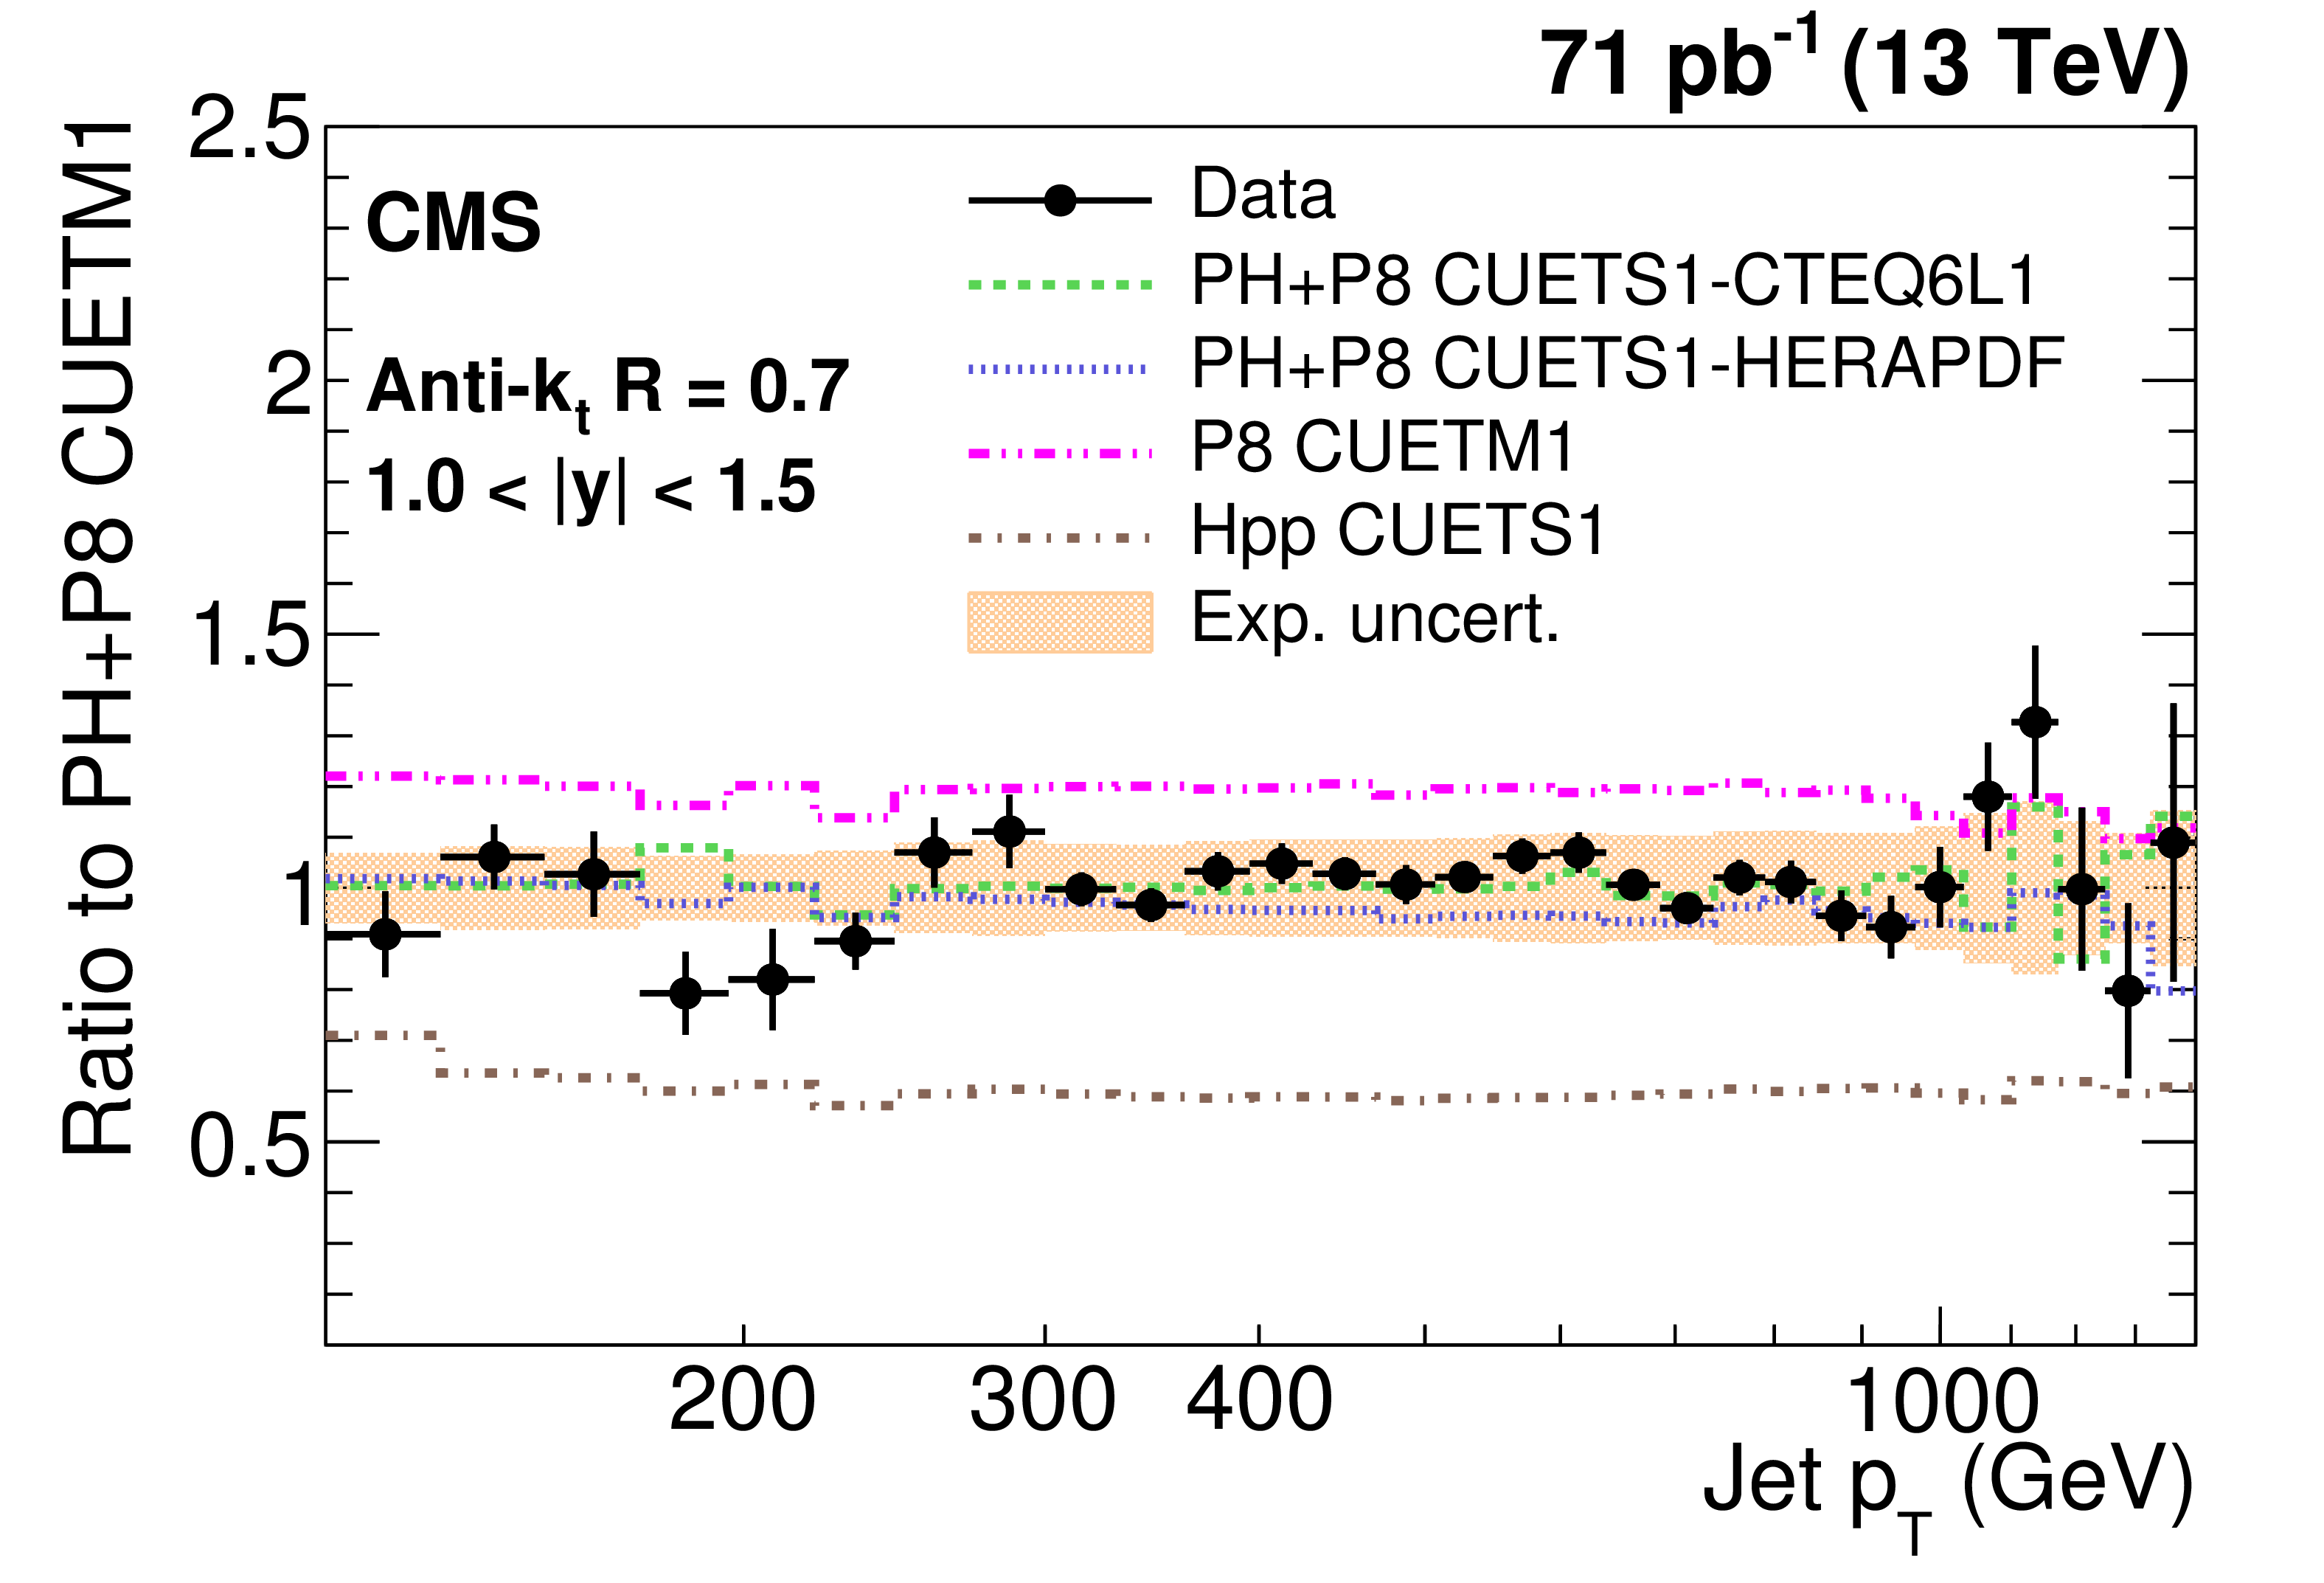
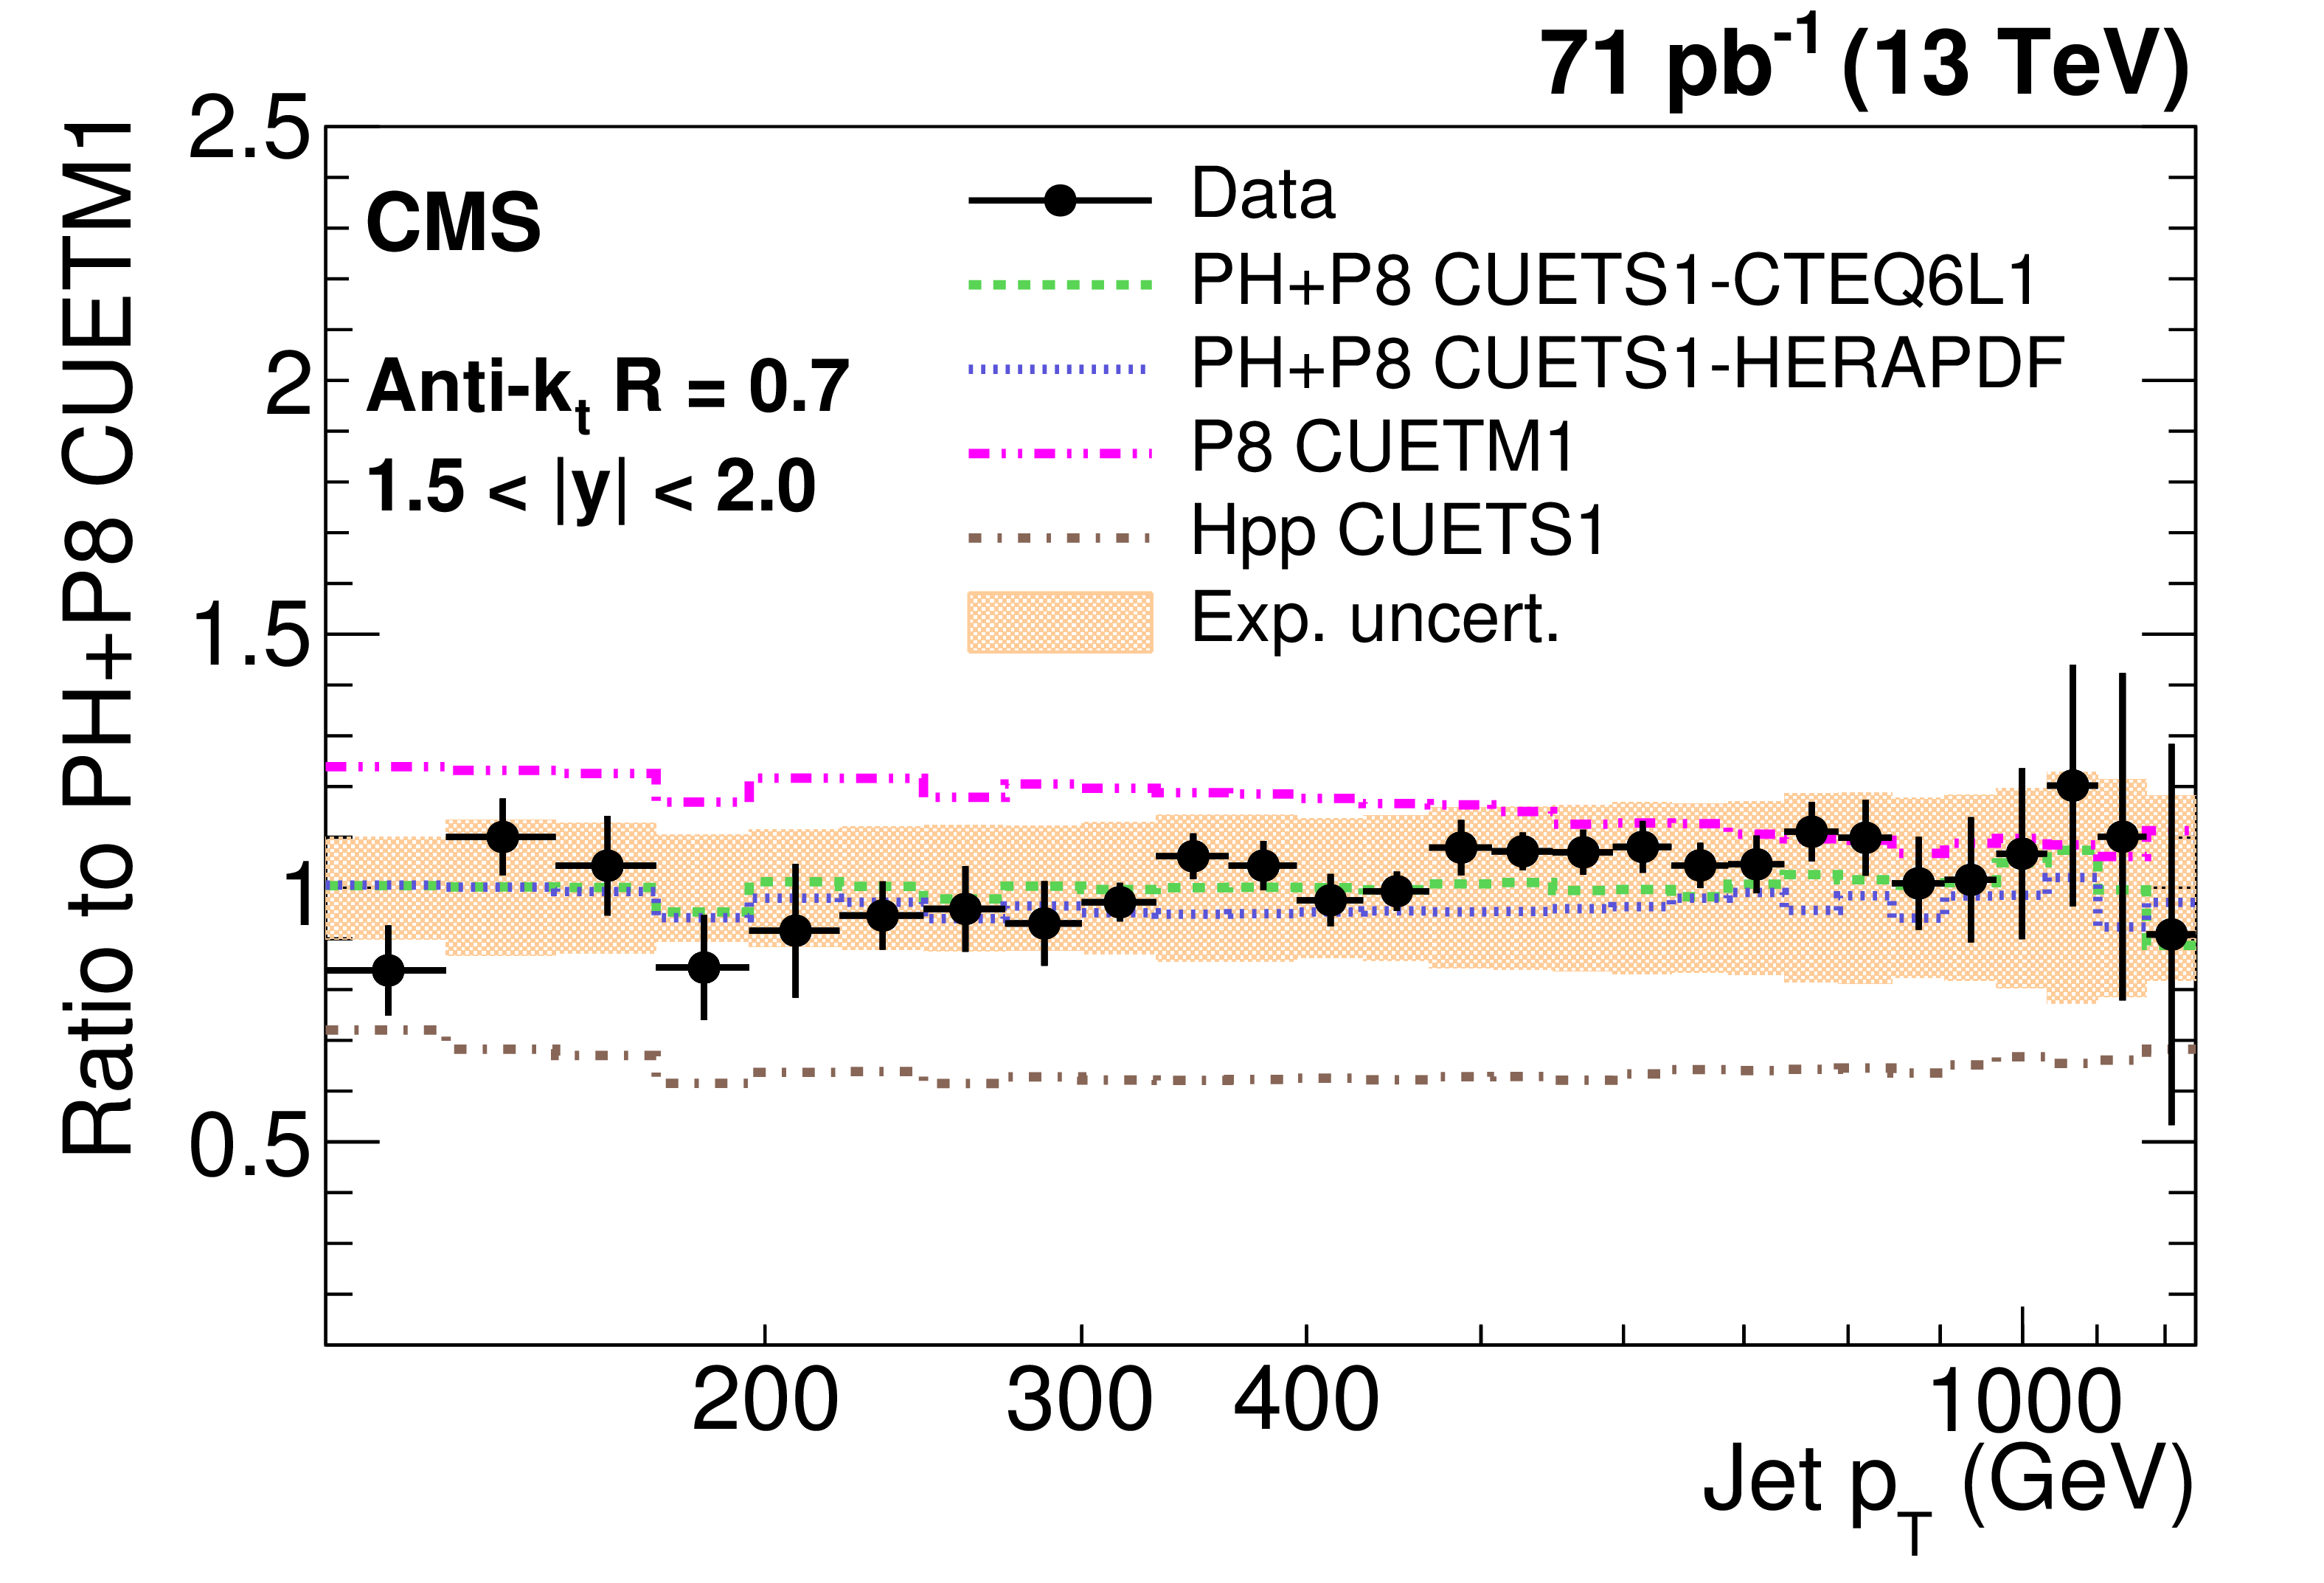
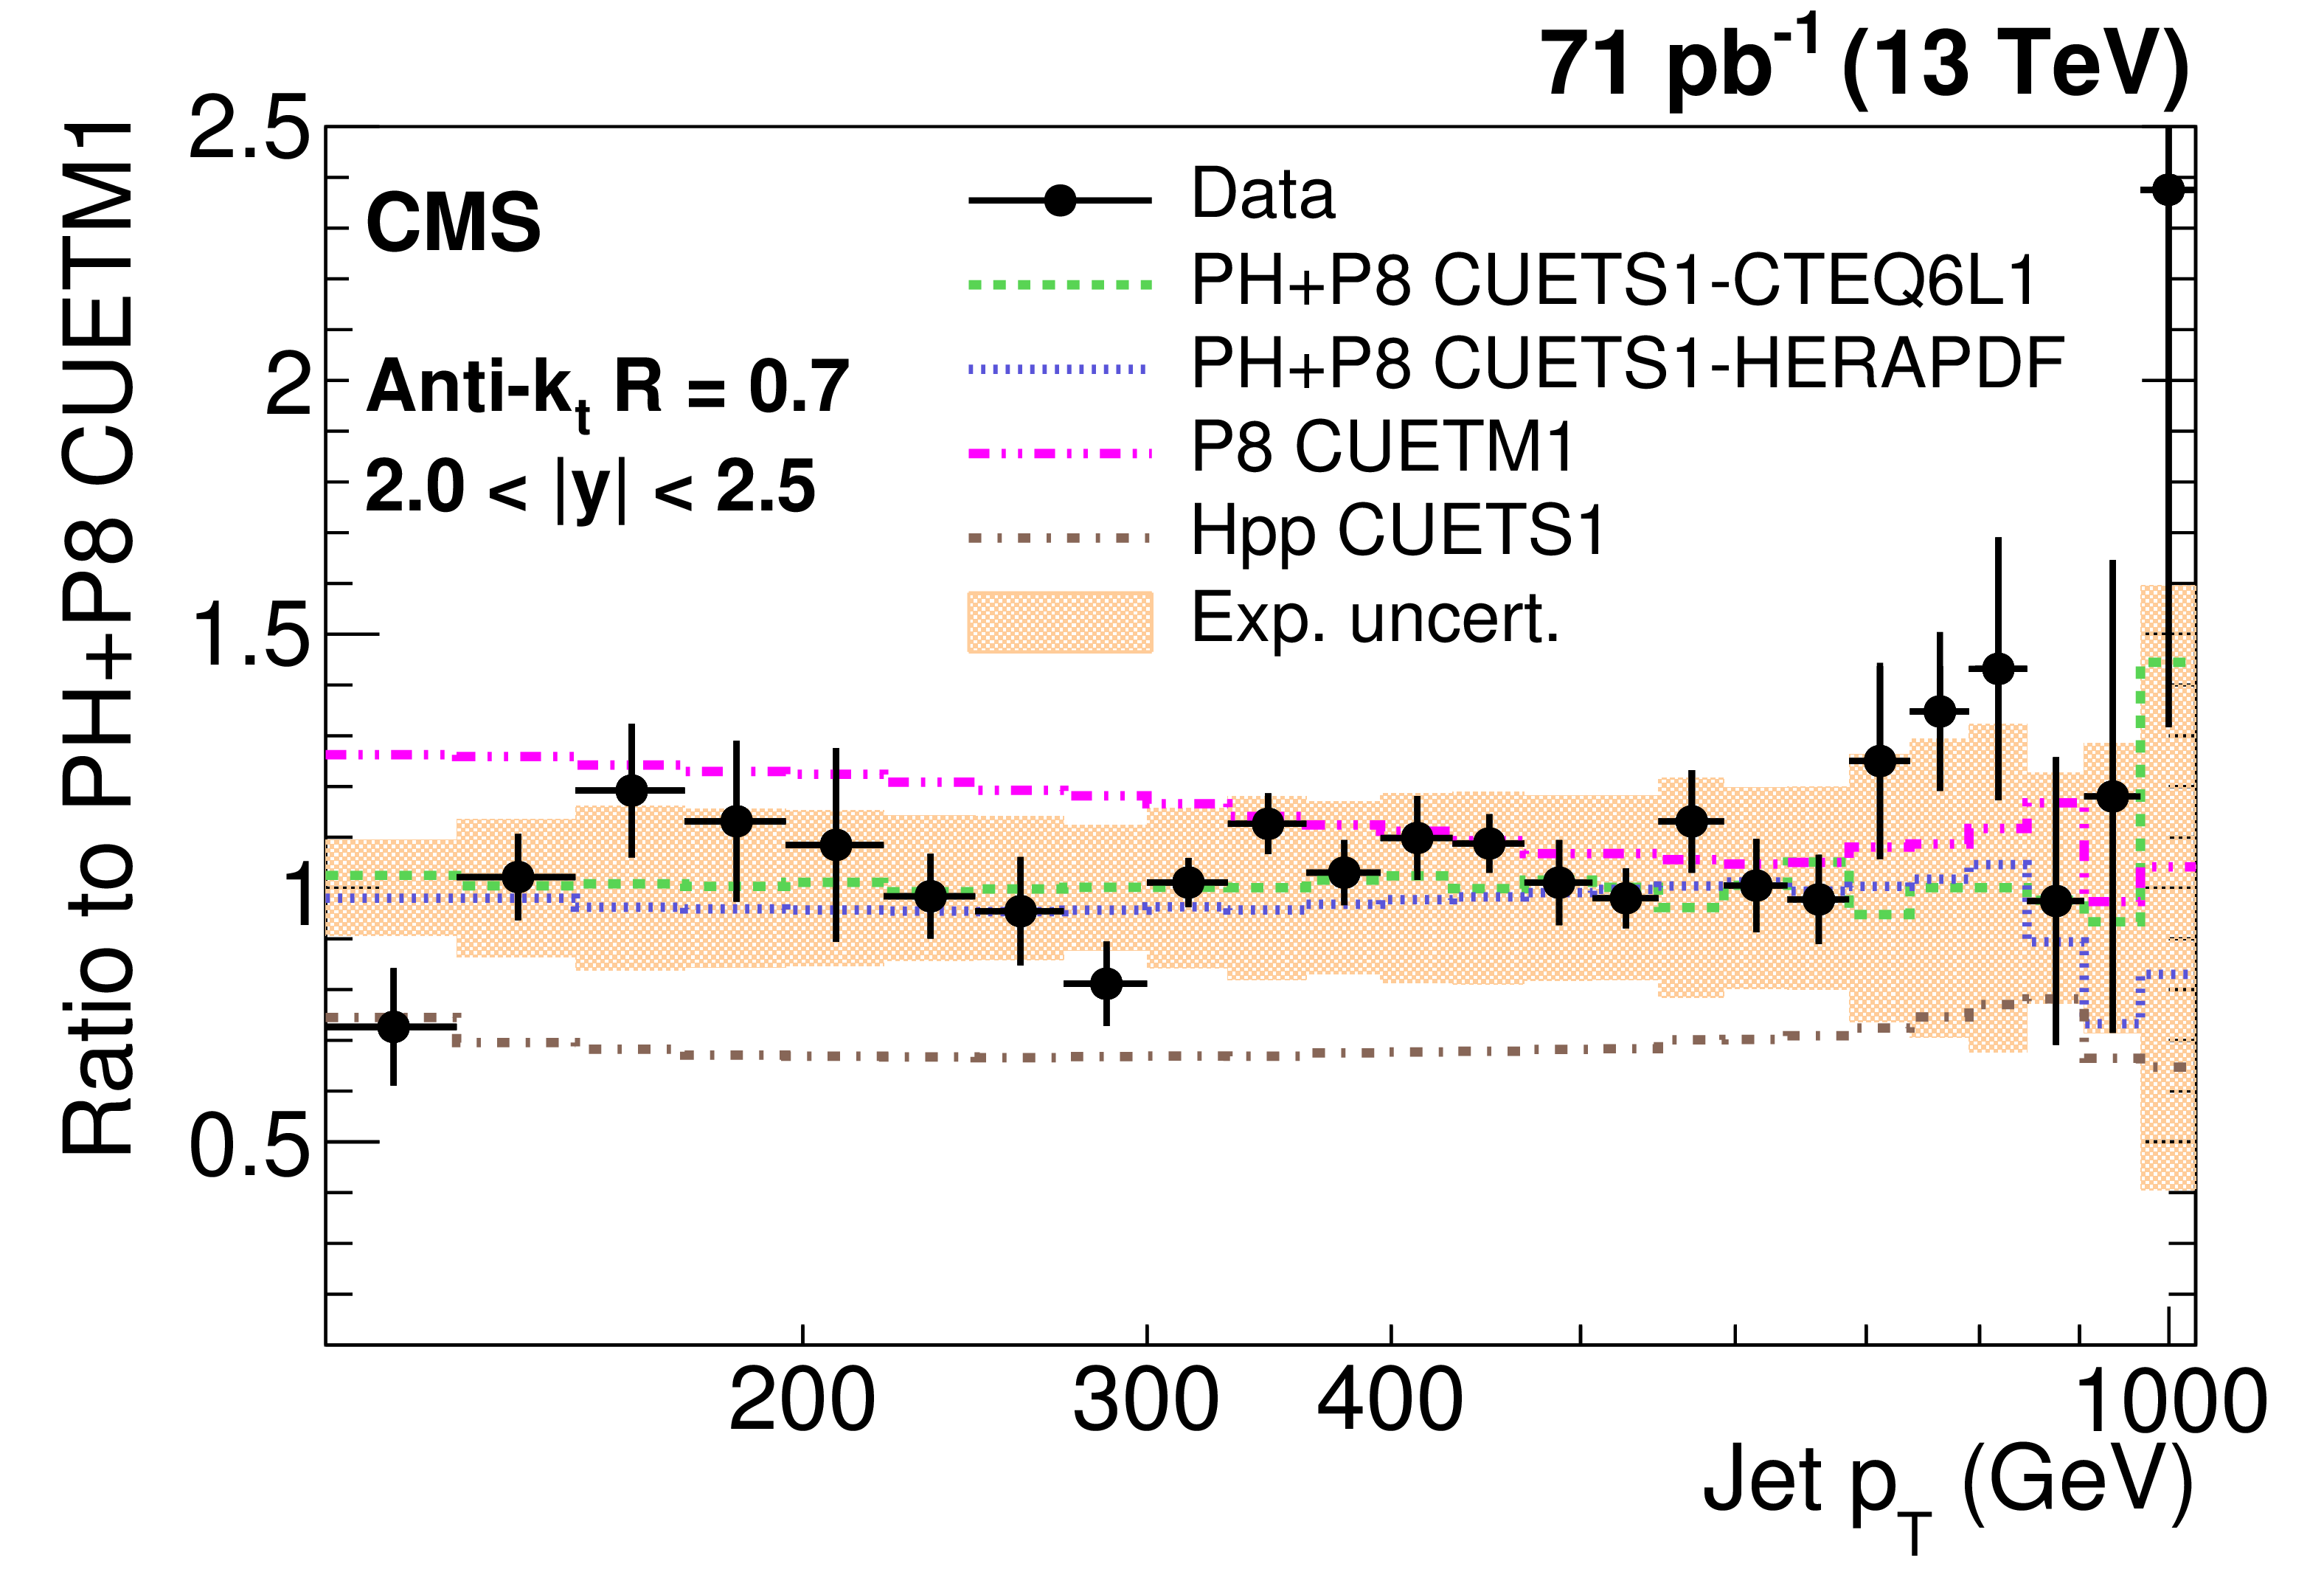
Figure 8-a:
Ratio of measured values to predictions from POWHEG (PH) + PYTHIA-8 (P8) with tune CUETM1. Predictions employing four other MC generators are also shown for comparison, where PH, P8, and Hpp stands for POWHEG, PYTHIA-8, and HERWIG++ (HPP), respectively. Jets are clustered with the anti-$ {k_{\mathrm {t}}}$ algorithm with a distance parameter of 0.7. The error bars correspond to the statistical uncertainties of the data and the shaded bands to the total experimental systematic uncertainties. |
png pdf |
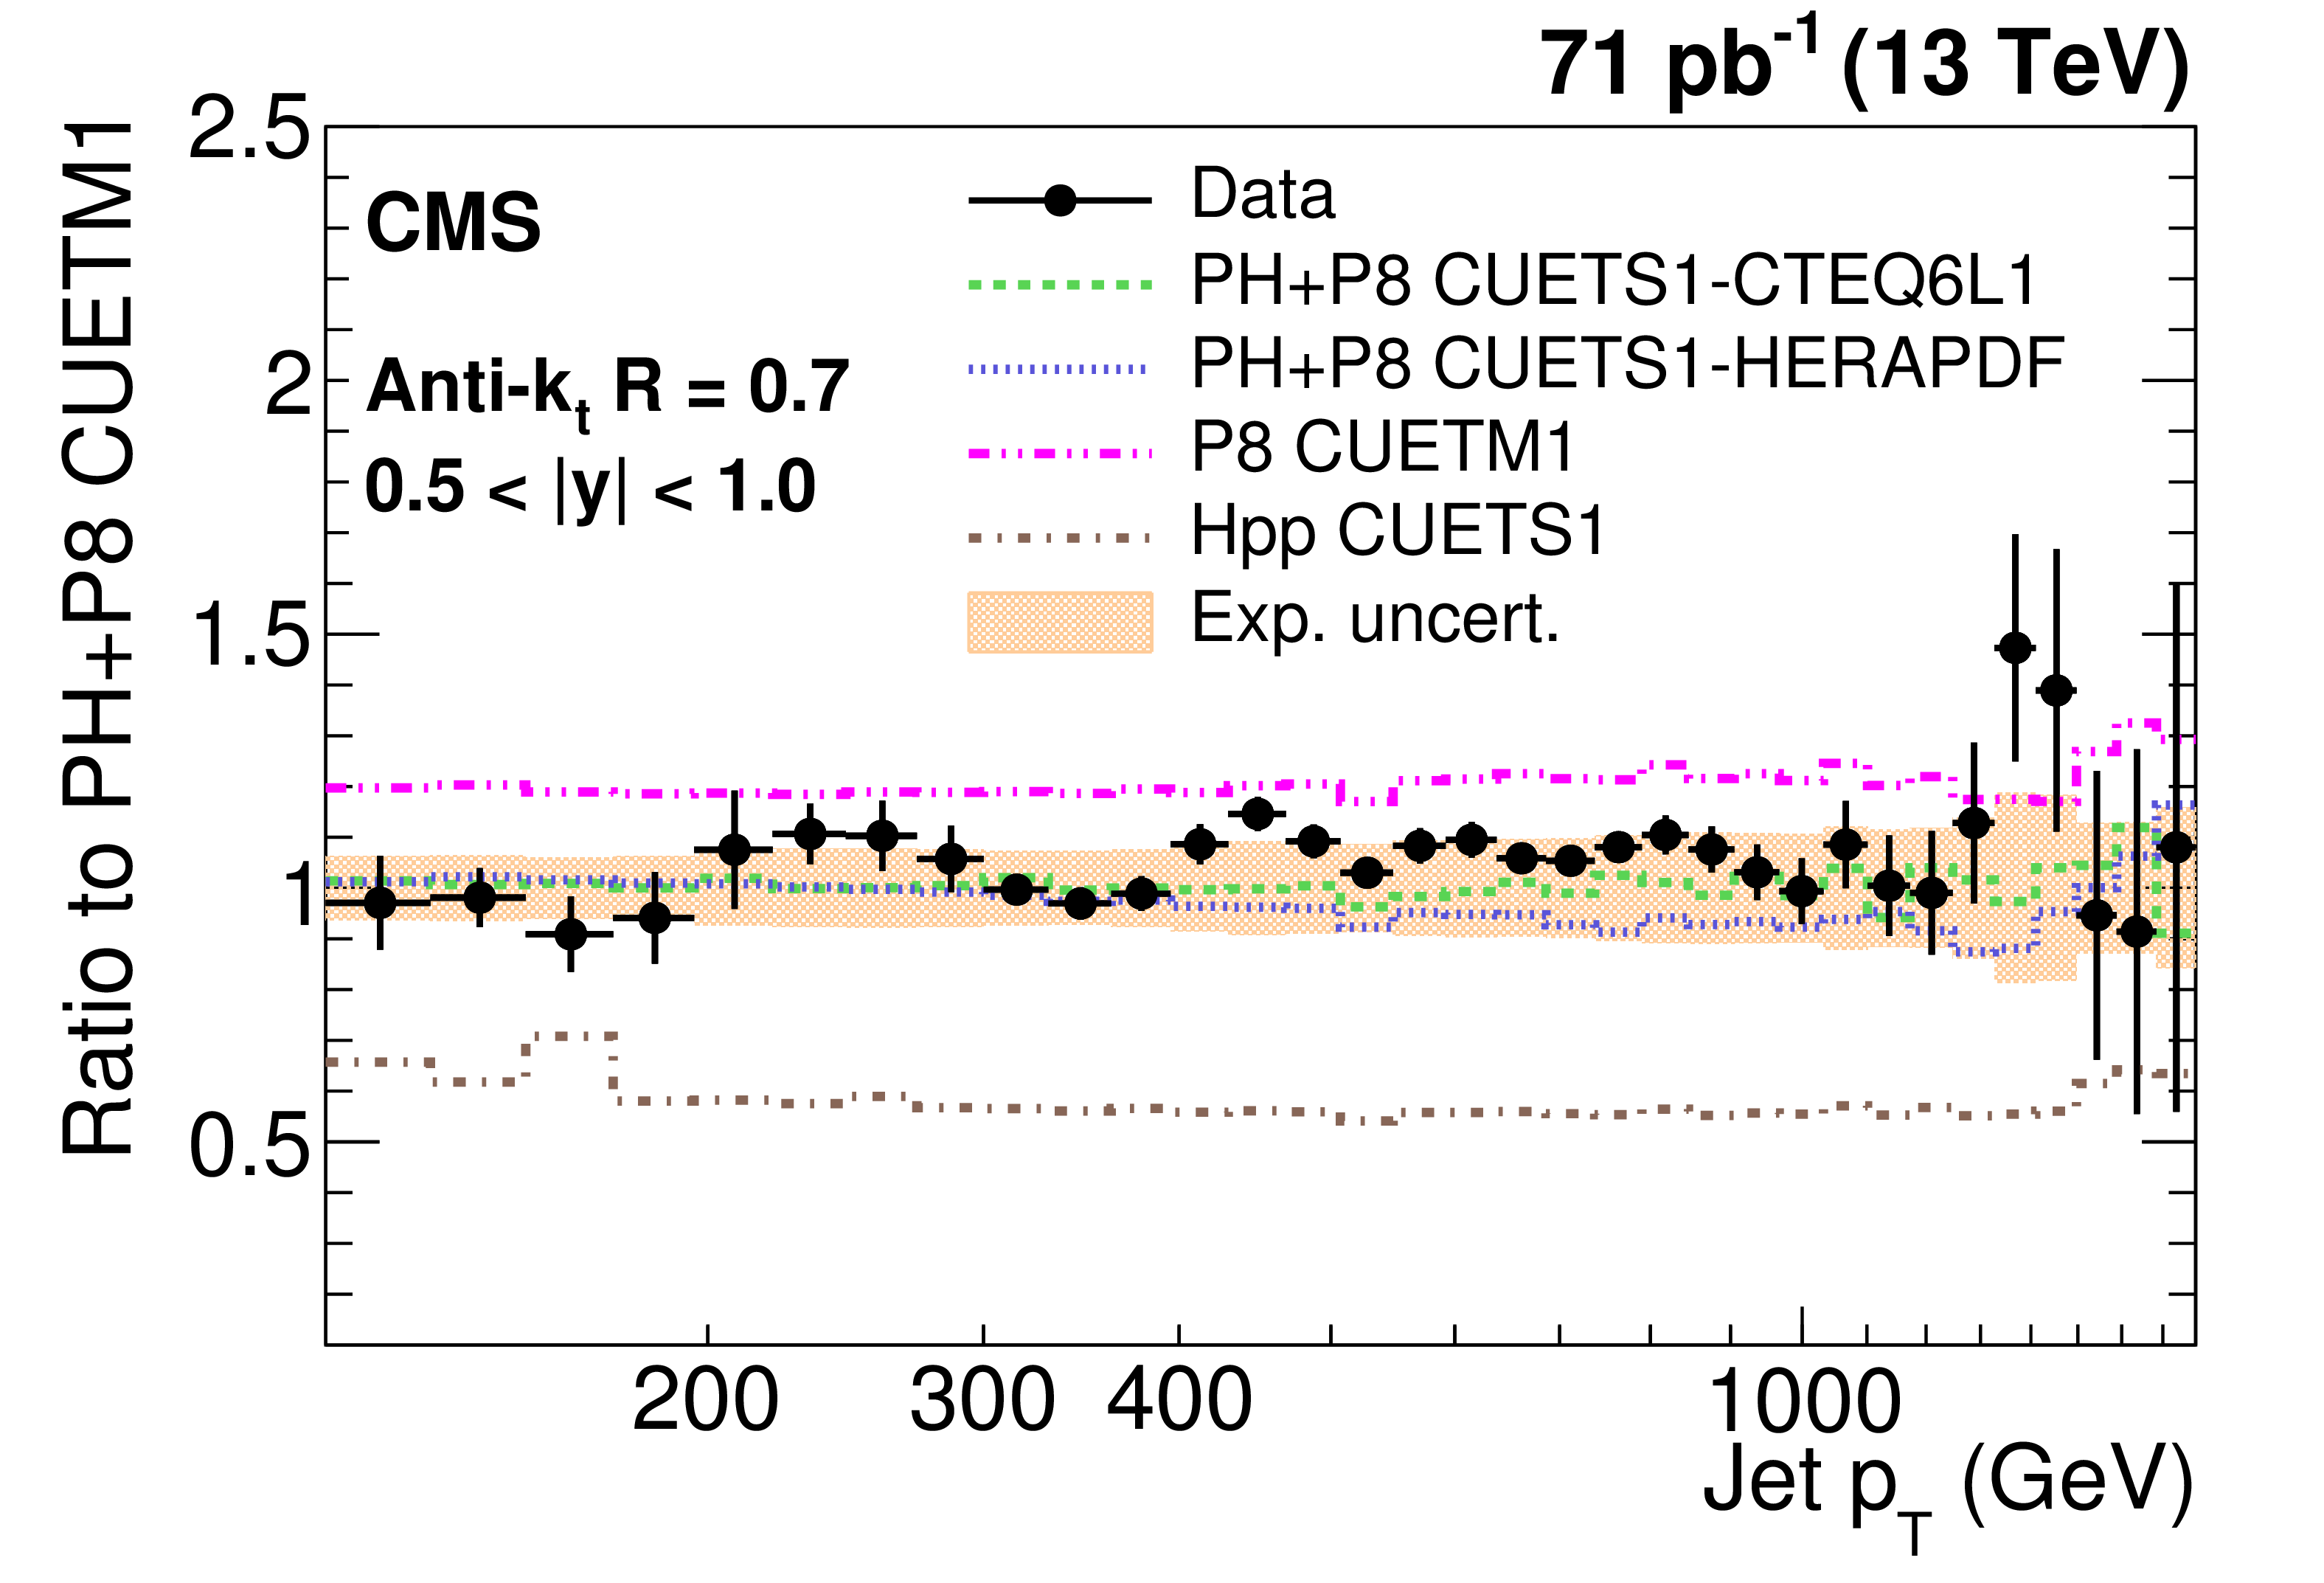
Figure 8-b:
Ratio of measured values to predictions from POWHEG (PH) + PYTHIA-8 (P8) with tune CUETM1. Predictions employing four other MC generators are also shown for comparison, where PH, P8, and Hpp stands for POWHEG, PYTHIA-8, and HERWIG++ (HPP), respectively. Jets are clustered with the anti-$ {k_{\mathrm {t}}}$ algorithm with a distance parameter of 0.7. The error bars correspond to the statistical uncertainties of the data and the shaded bands to the total experimental systematic uncertainties. |
png pdf |
Figure 8-c:
Ratio of measured values to predictions from POWHEG (PH) + PYTHIA-8 (P8) with tune CUETM1. Predictions employing four other MC generators are also shown for comparison, where PH, P8, and Hpp stands for POWHEG, PYTHIA-8, and HERWIG++ (HPP), respectively. Jets are clustered with the anti-$ {k_{\mathrm {t}}}$ algorithm with a distance parameter of 0.7. The error bars correspond to the statistical uncertainties of the data and the shaded bands to the total experimental systematic uncertainties. |
png pdf |
Figure 8-d:
Ratio of measured values to predictions from POWHEG (PH) + PYTHIA-8 (P8) with tune CUETM1. Predictions employing four other MC generators are also shown for comparison, where PH, P8, and Hpp stands for POWHEG, PYTHIA-8, and HERWIG++ (HPP), respectively. Jets are clustered with the anti-$ {k_{\mathrm {t}}}$ algorithm with a distance parameter of 0.7. The error bars correspond to the statistical uncertainties of the data and the shaded bands to the total experimental systematic uncertainties. |
png pdf |
Figure 8-e:
Ratio of measured values to predictions from POWHEG (PH) + PYTHIA-8 (P8) with tune CUETM1. Predictions employing four other MC generators are also shown for comparison, where PH, P8, and Hpp stands for POWHEG, PYTHIA-8, and HERWIG++ (HPP), respectively. Jets are clustered with the anti-$ {k_{\mathrm {t}}}$ algorithm with a distance parameter of 0.7. The error bars correspond to the statistical uncertainties of the data and the shaded bands to the total experimental systematic uncertainties. |

png pdf |
Figure 8-f:
Ratio of measured values to predictions from POWHEG (PH) + PYTHIA-8 (P8) with tune CUETM1. Predictions employing four other MC generators are also shown for comparison, where PH, P8, and Hpp stands for POWHEG, PYTHIA-8, and HERWIG++ (HPP), respectively. Jets are clustered with the anti-$ {k_{\mathrm {t}}}$ algorithm with a distance parameter of 0.7. The error bars correspond to the statistical uncertainties of the data and the shaded bands to the total experimental systematic uncertainties. |

png pdf |
Figure 8-g:
Ratio of measured values to predictions from POWHEG (PH) + PYTHIA-8 (P8) with tune CUETM1. Predictions employing four other MC generators are also shown for comparison, where PH, P8, and Hpp stands for POWHEG, PYTHIA-8, and HERWIG++ (HPP), respectively. Jets are clustered with the anti-$ {k_{\mathrm {t}}}$ algorithm with a distance parameter of 0.7. The error bars correspond to the statistical uncertainties of the data and the shaded bands to the total experimental systematic uncertainties. |
png pdf |
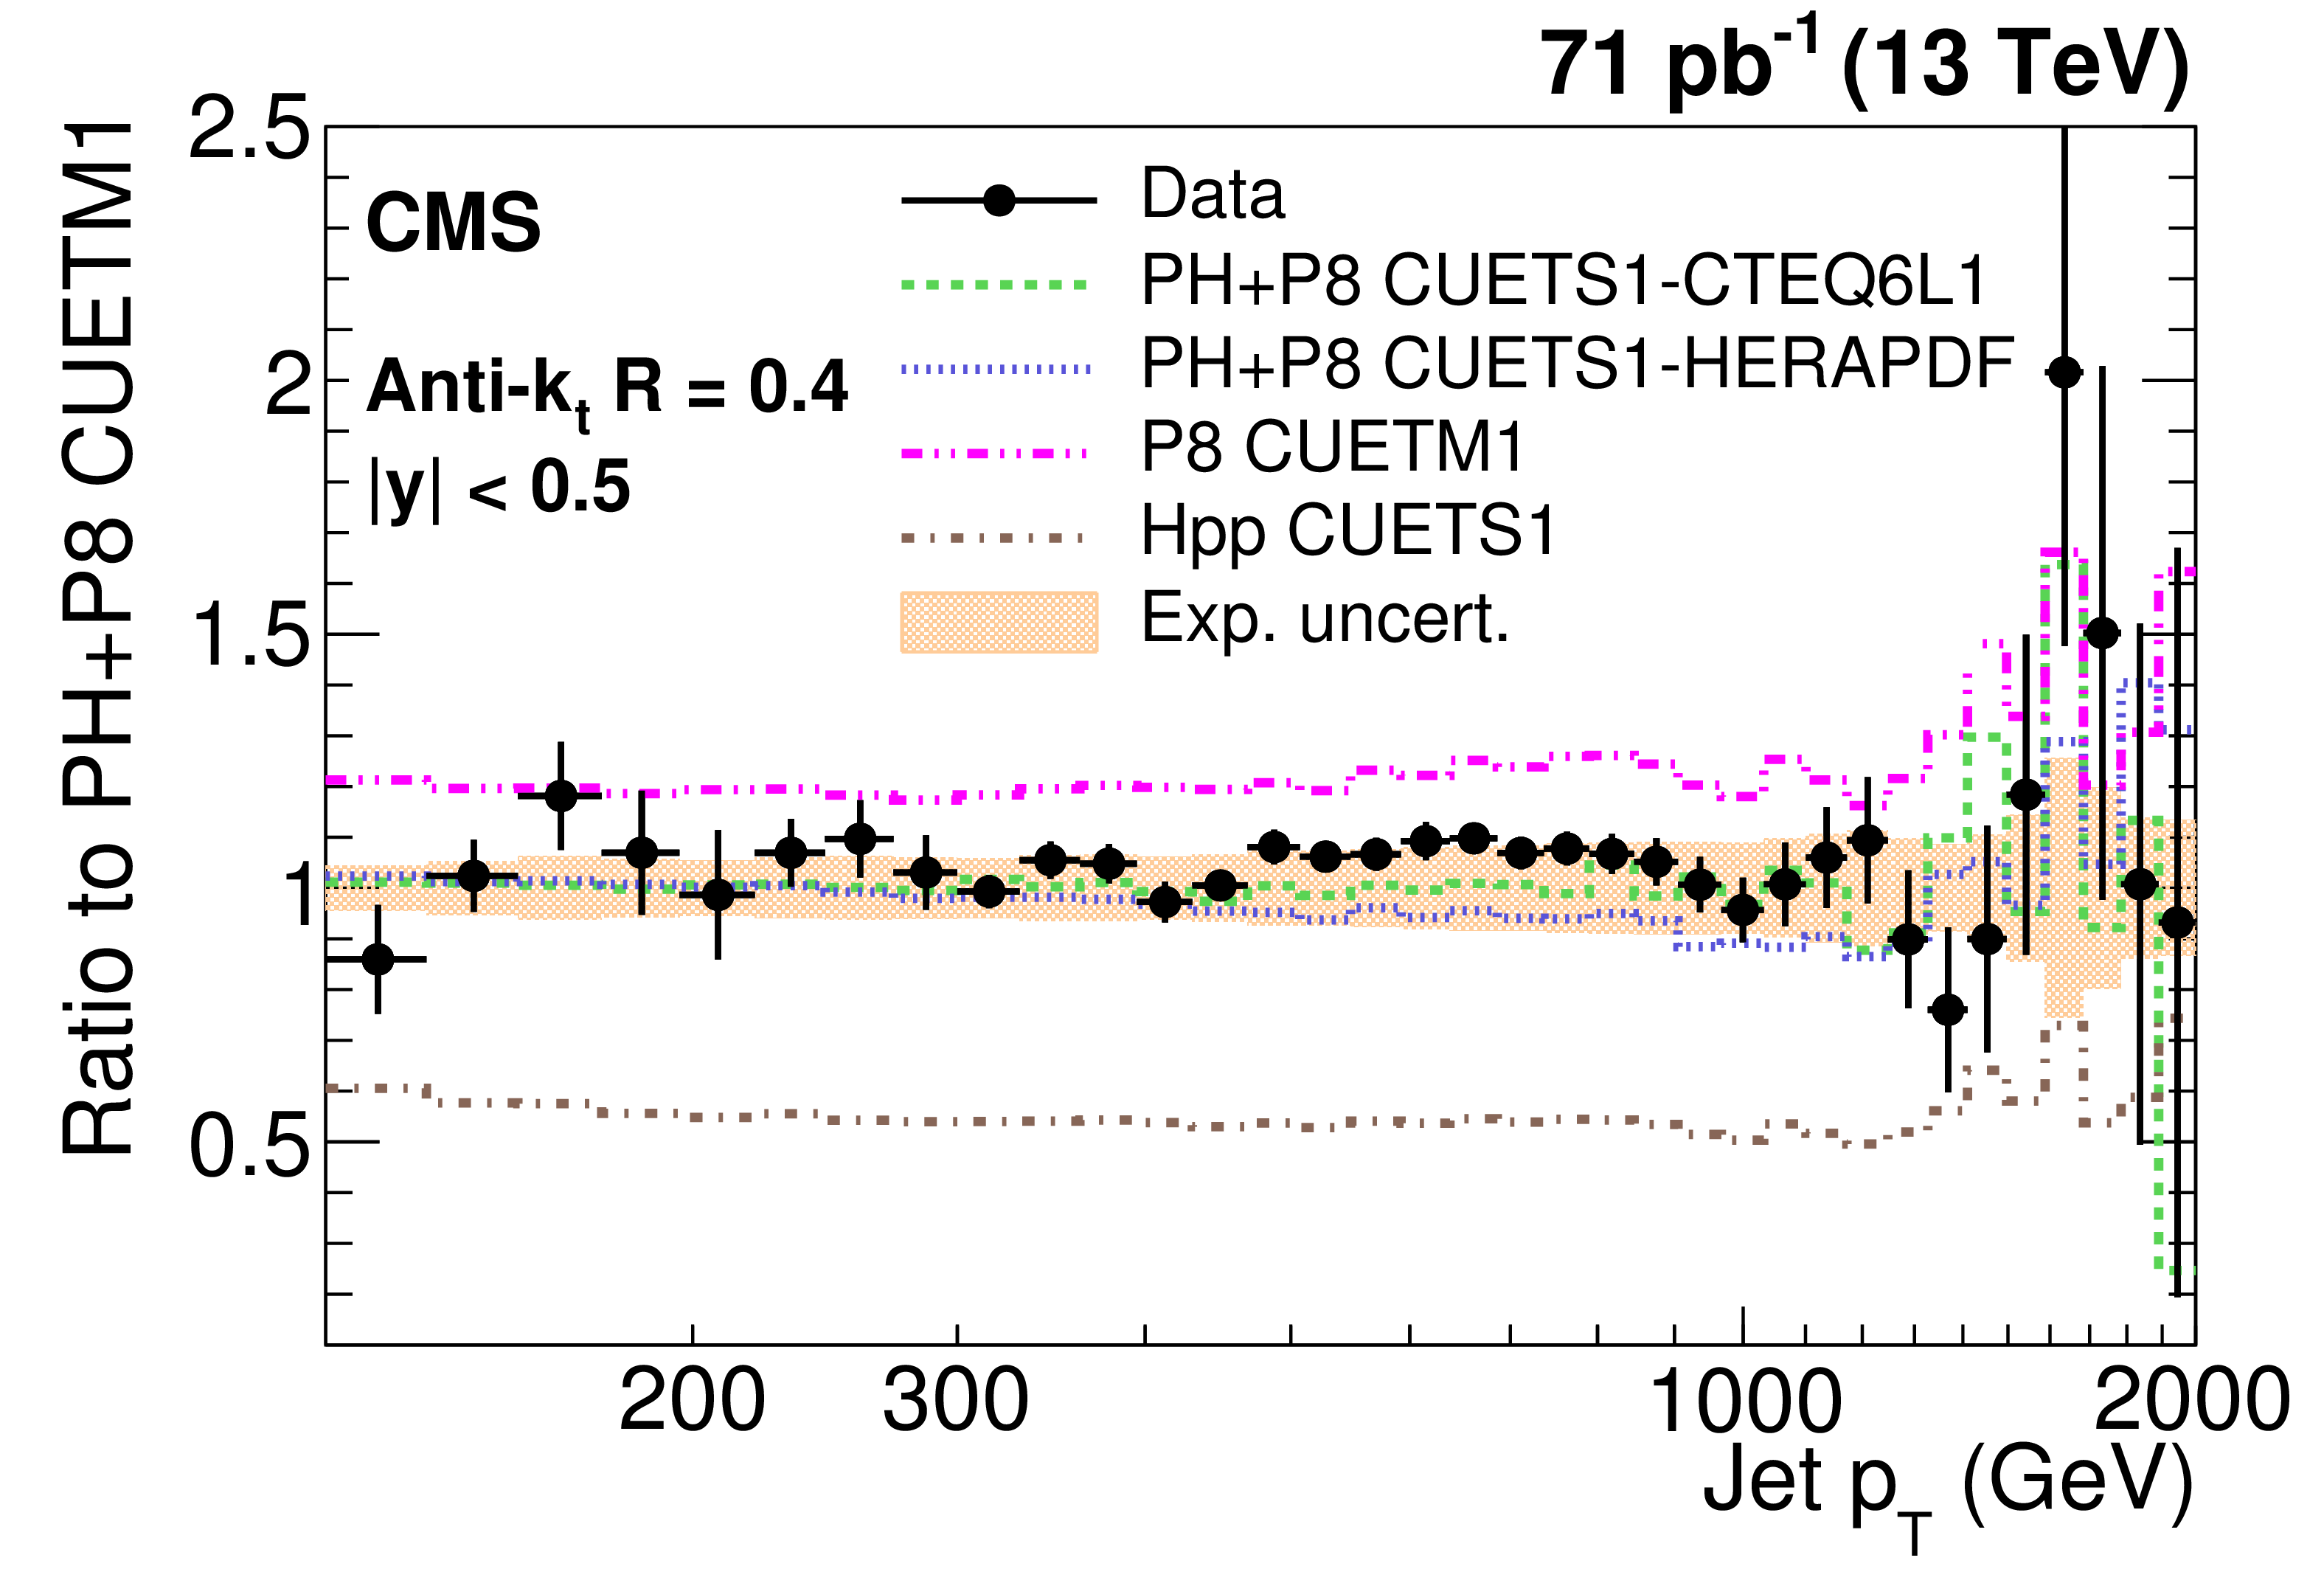
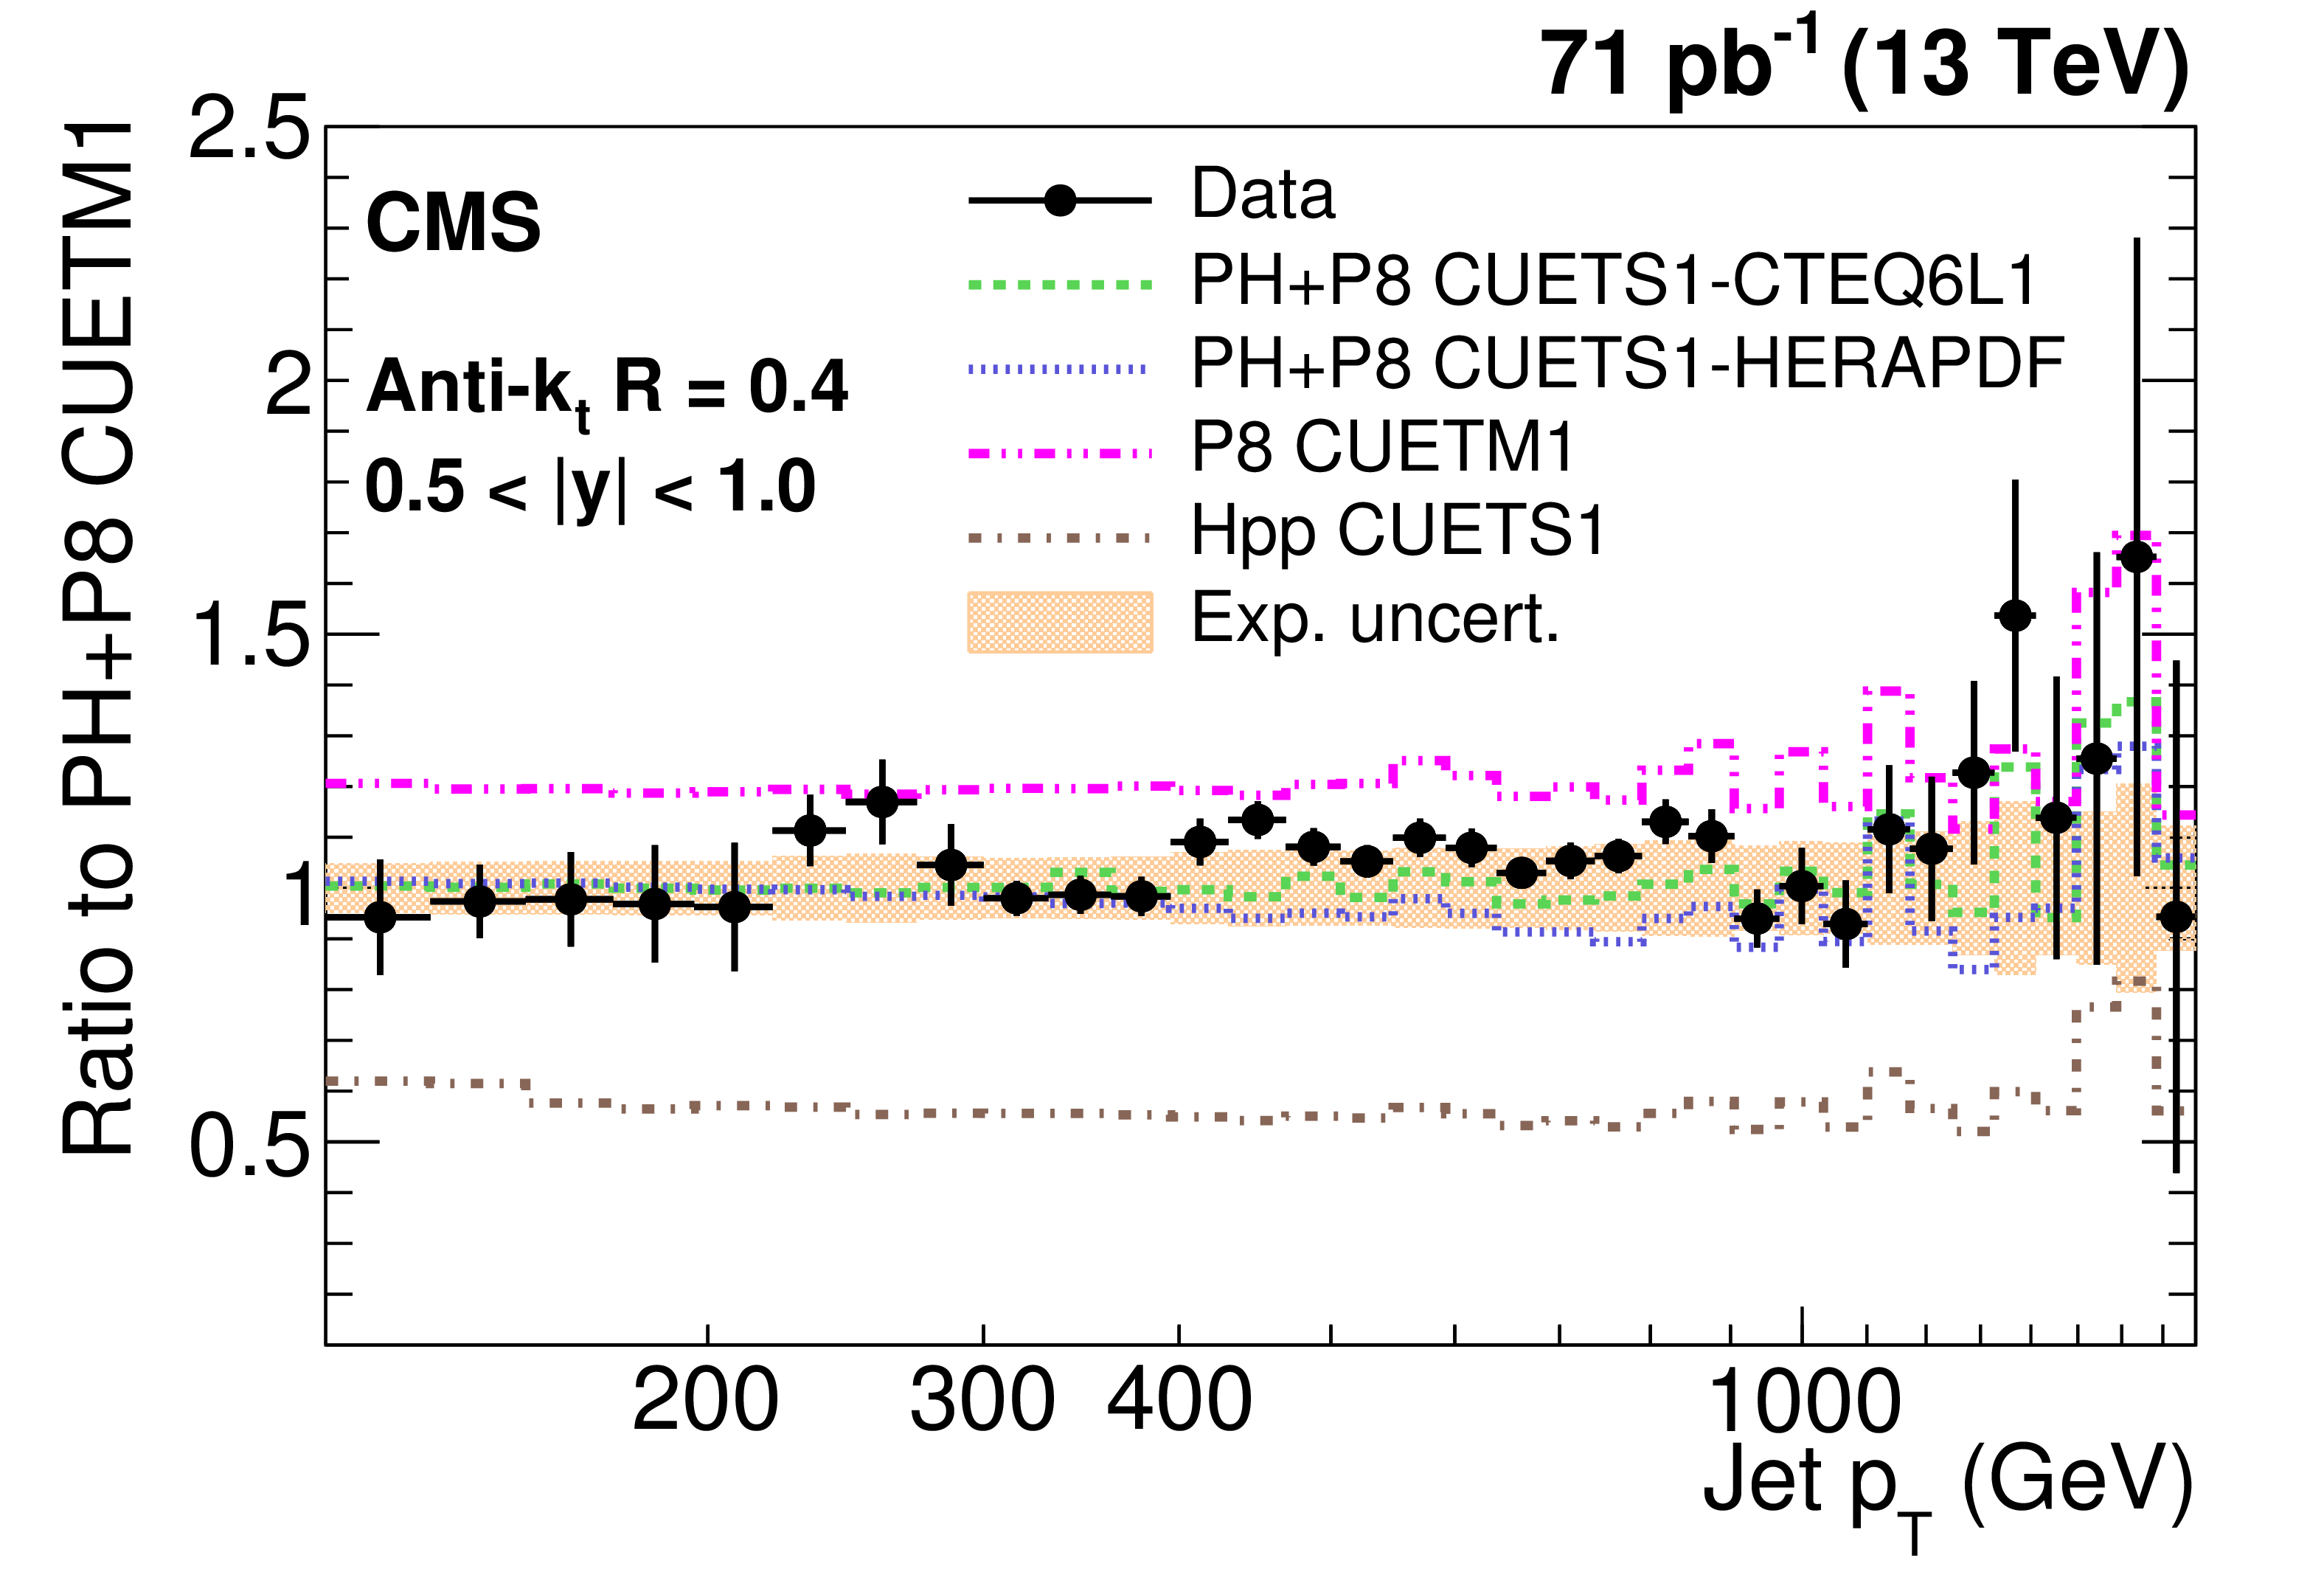
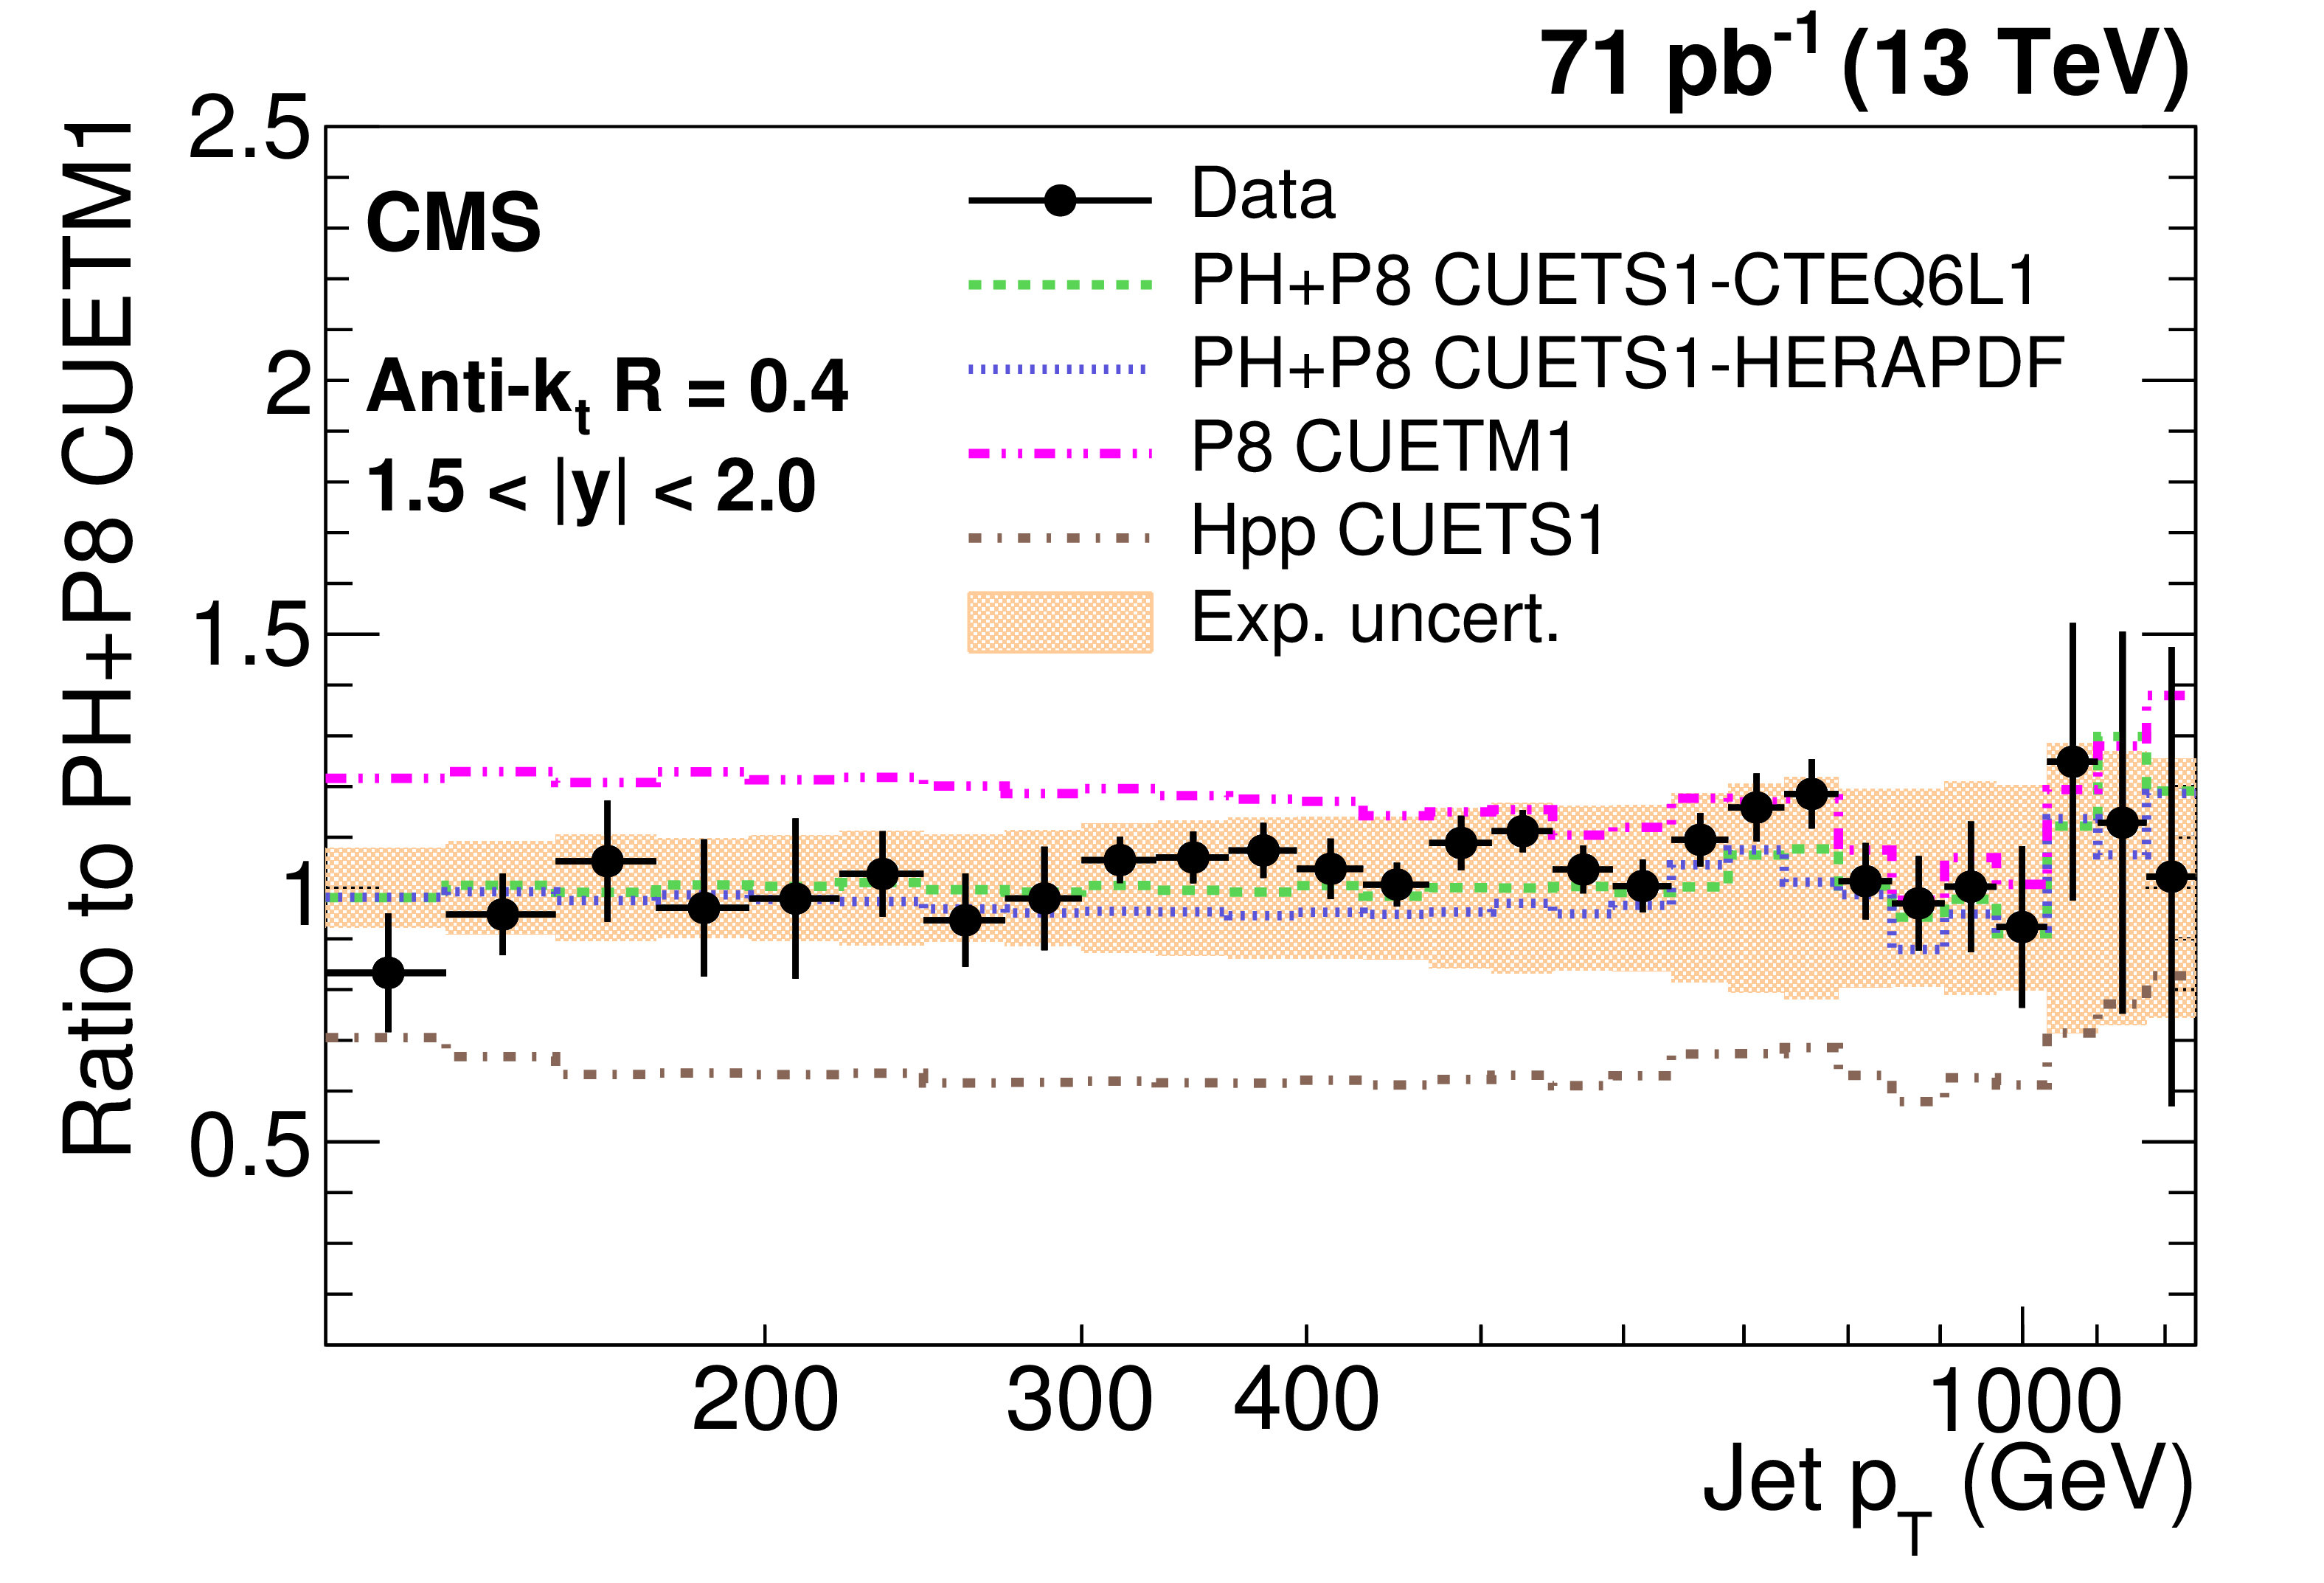
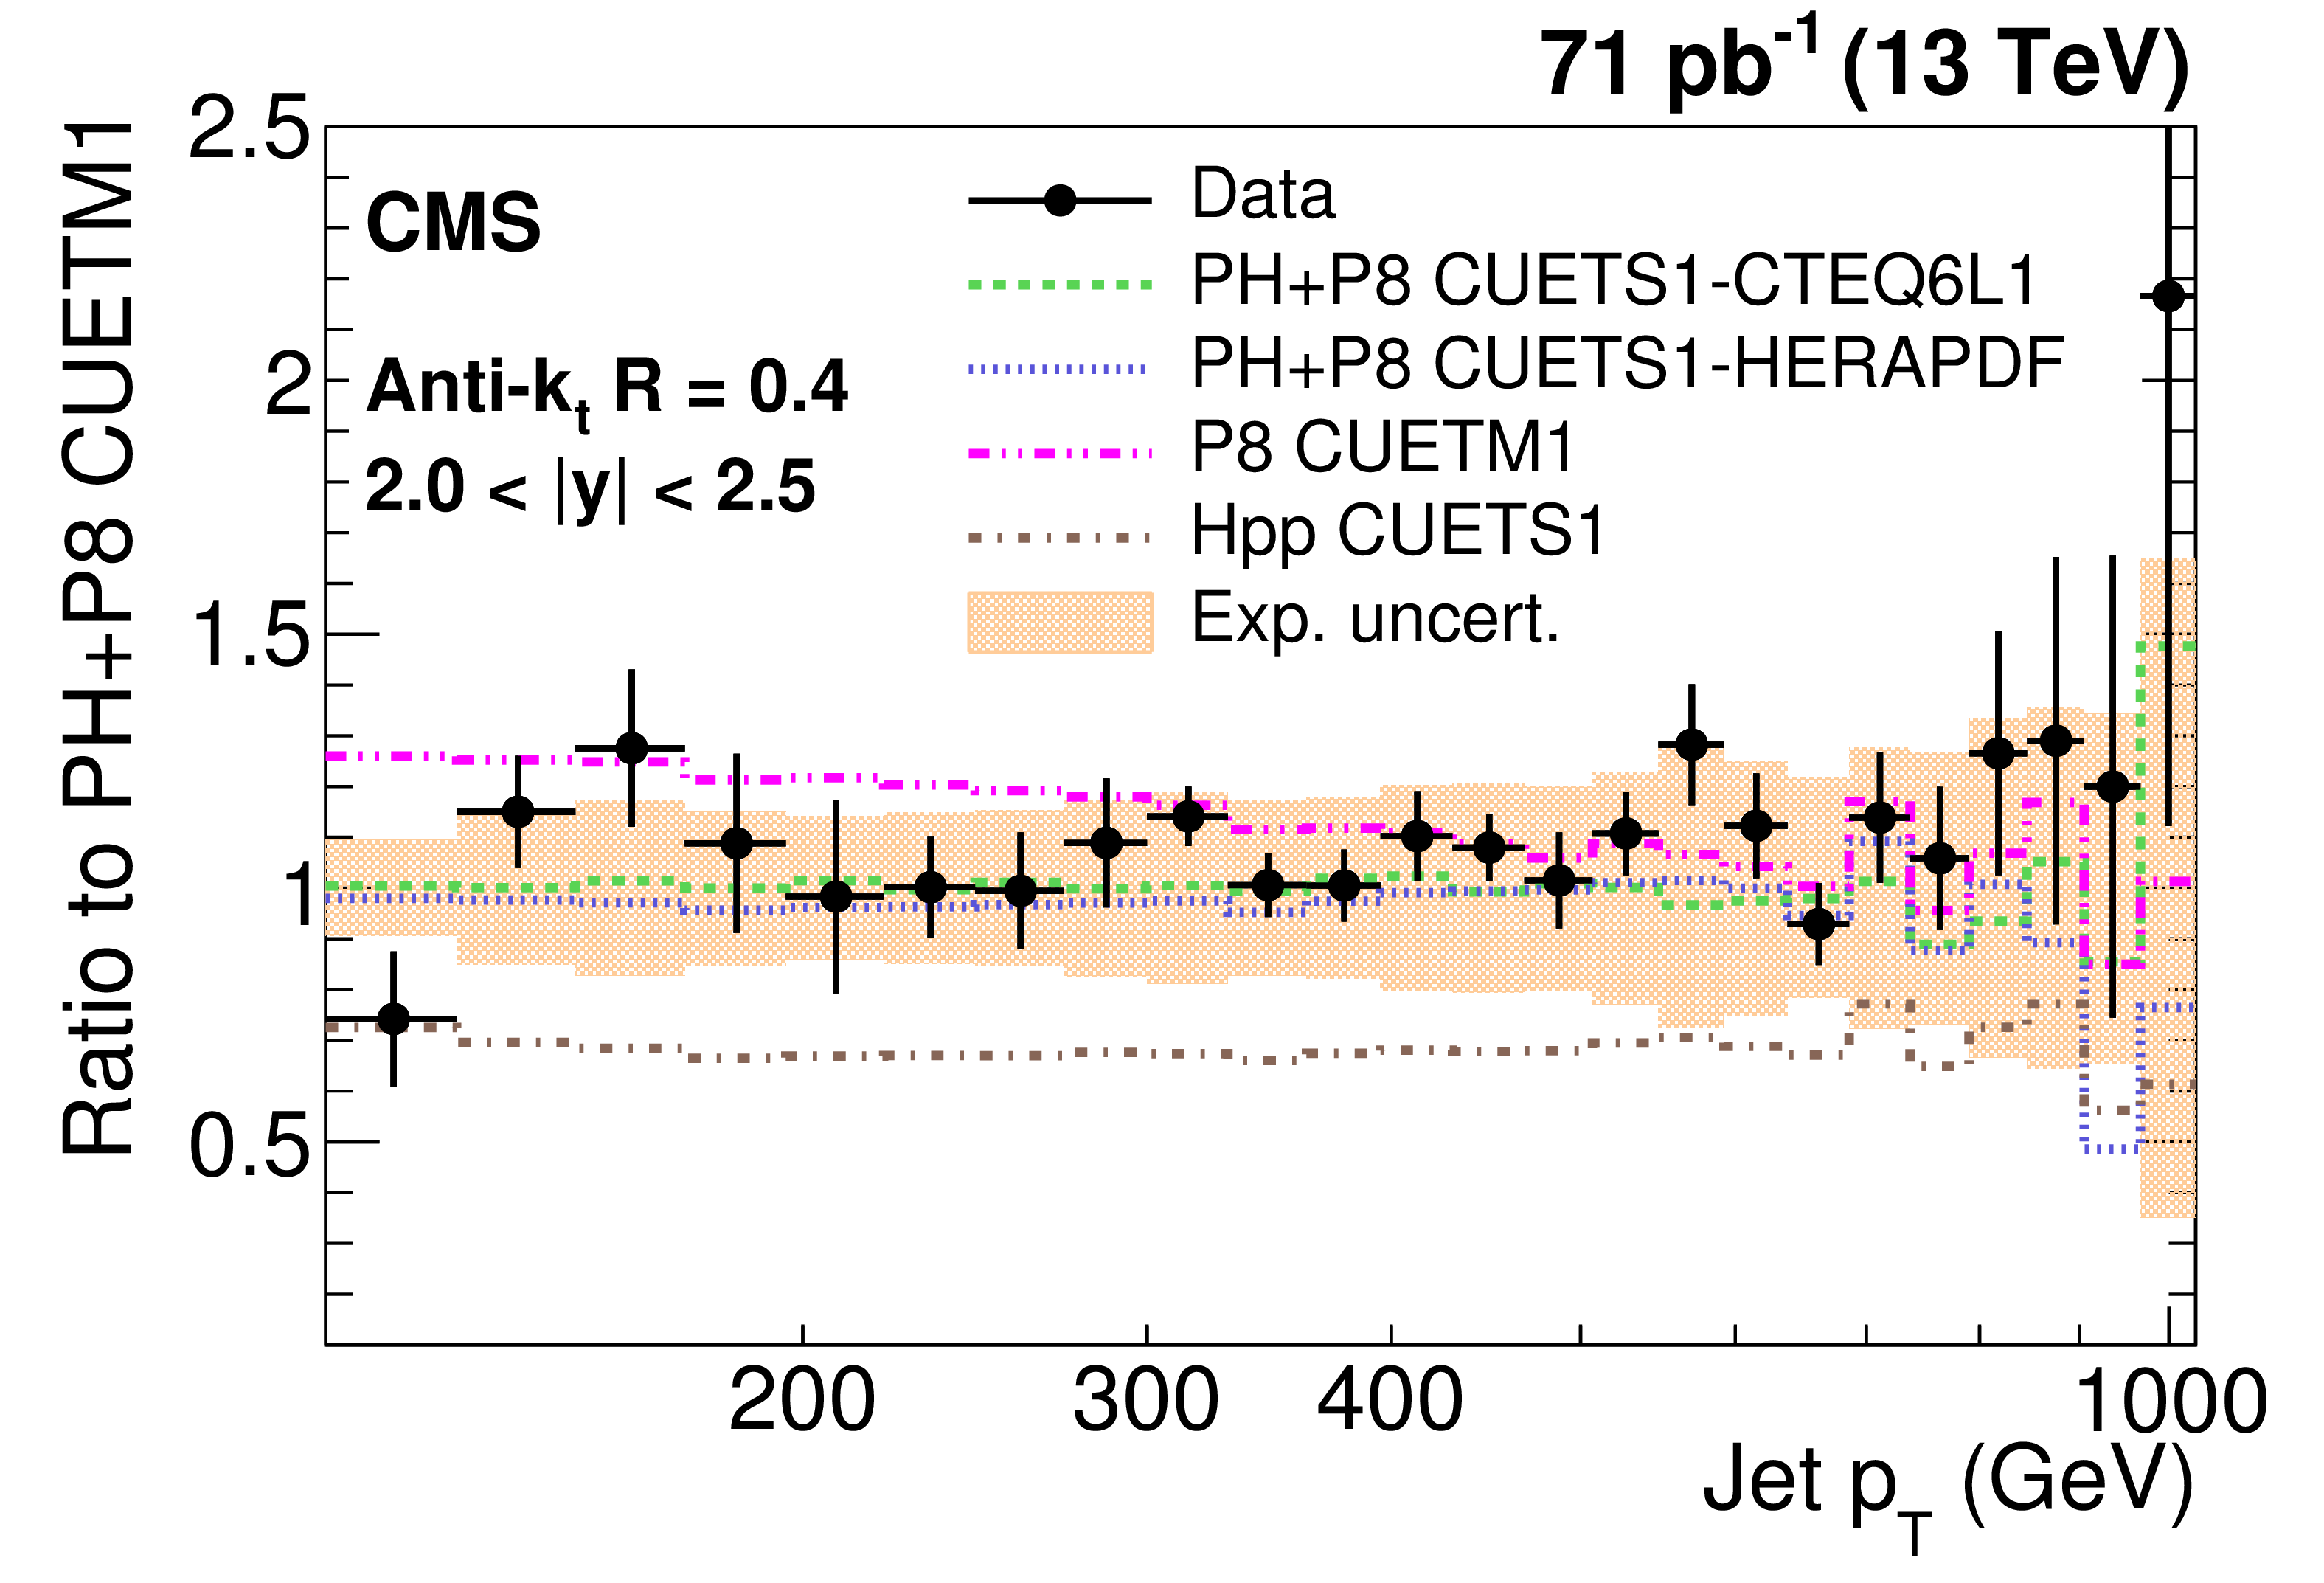
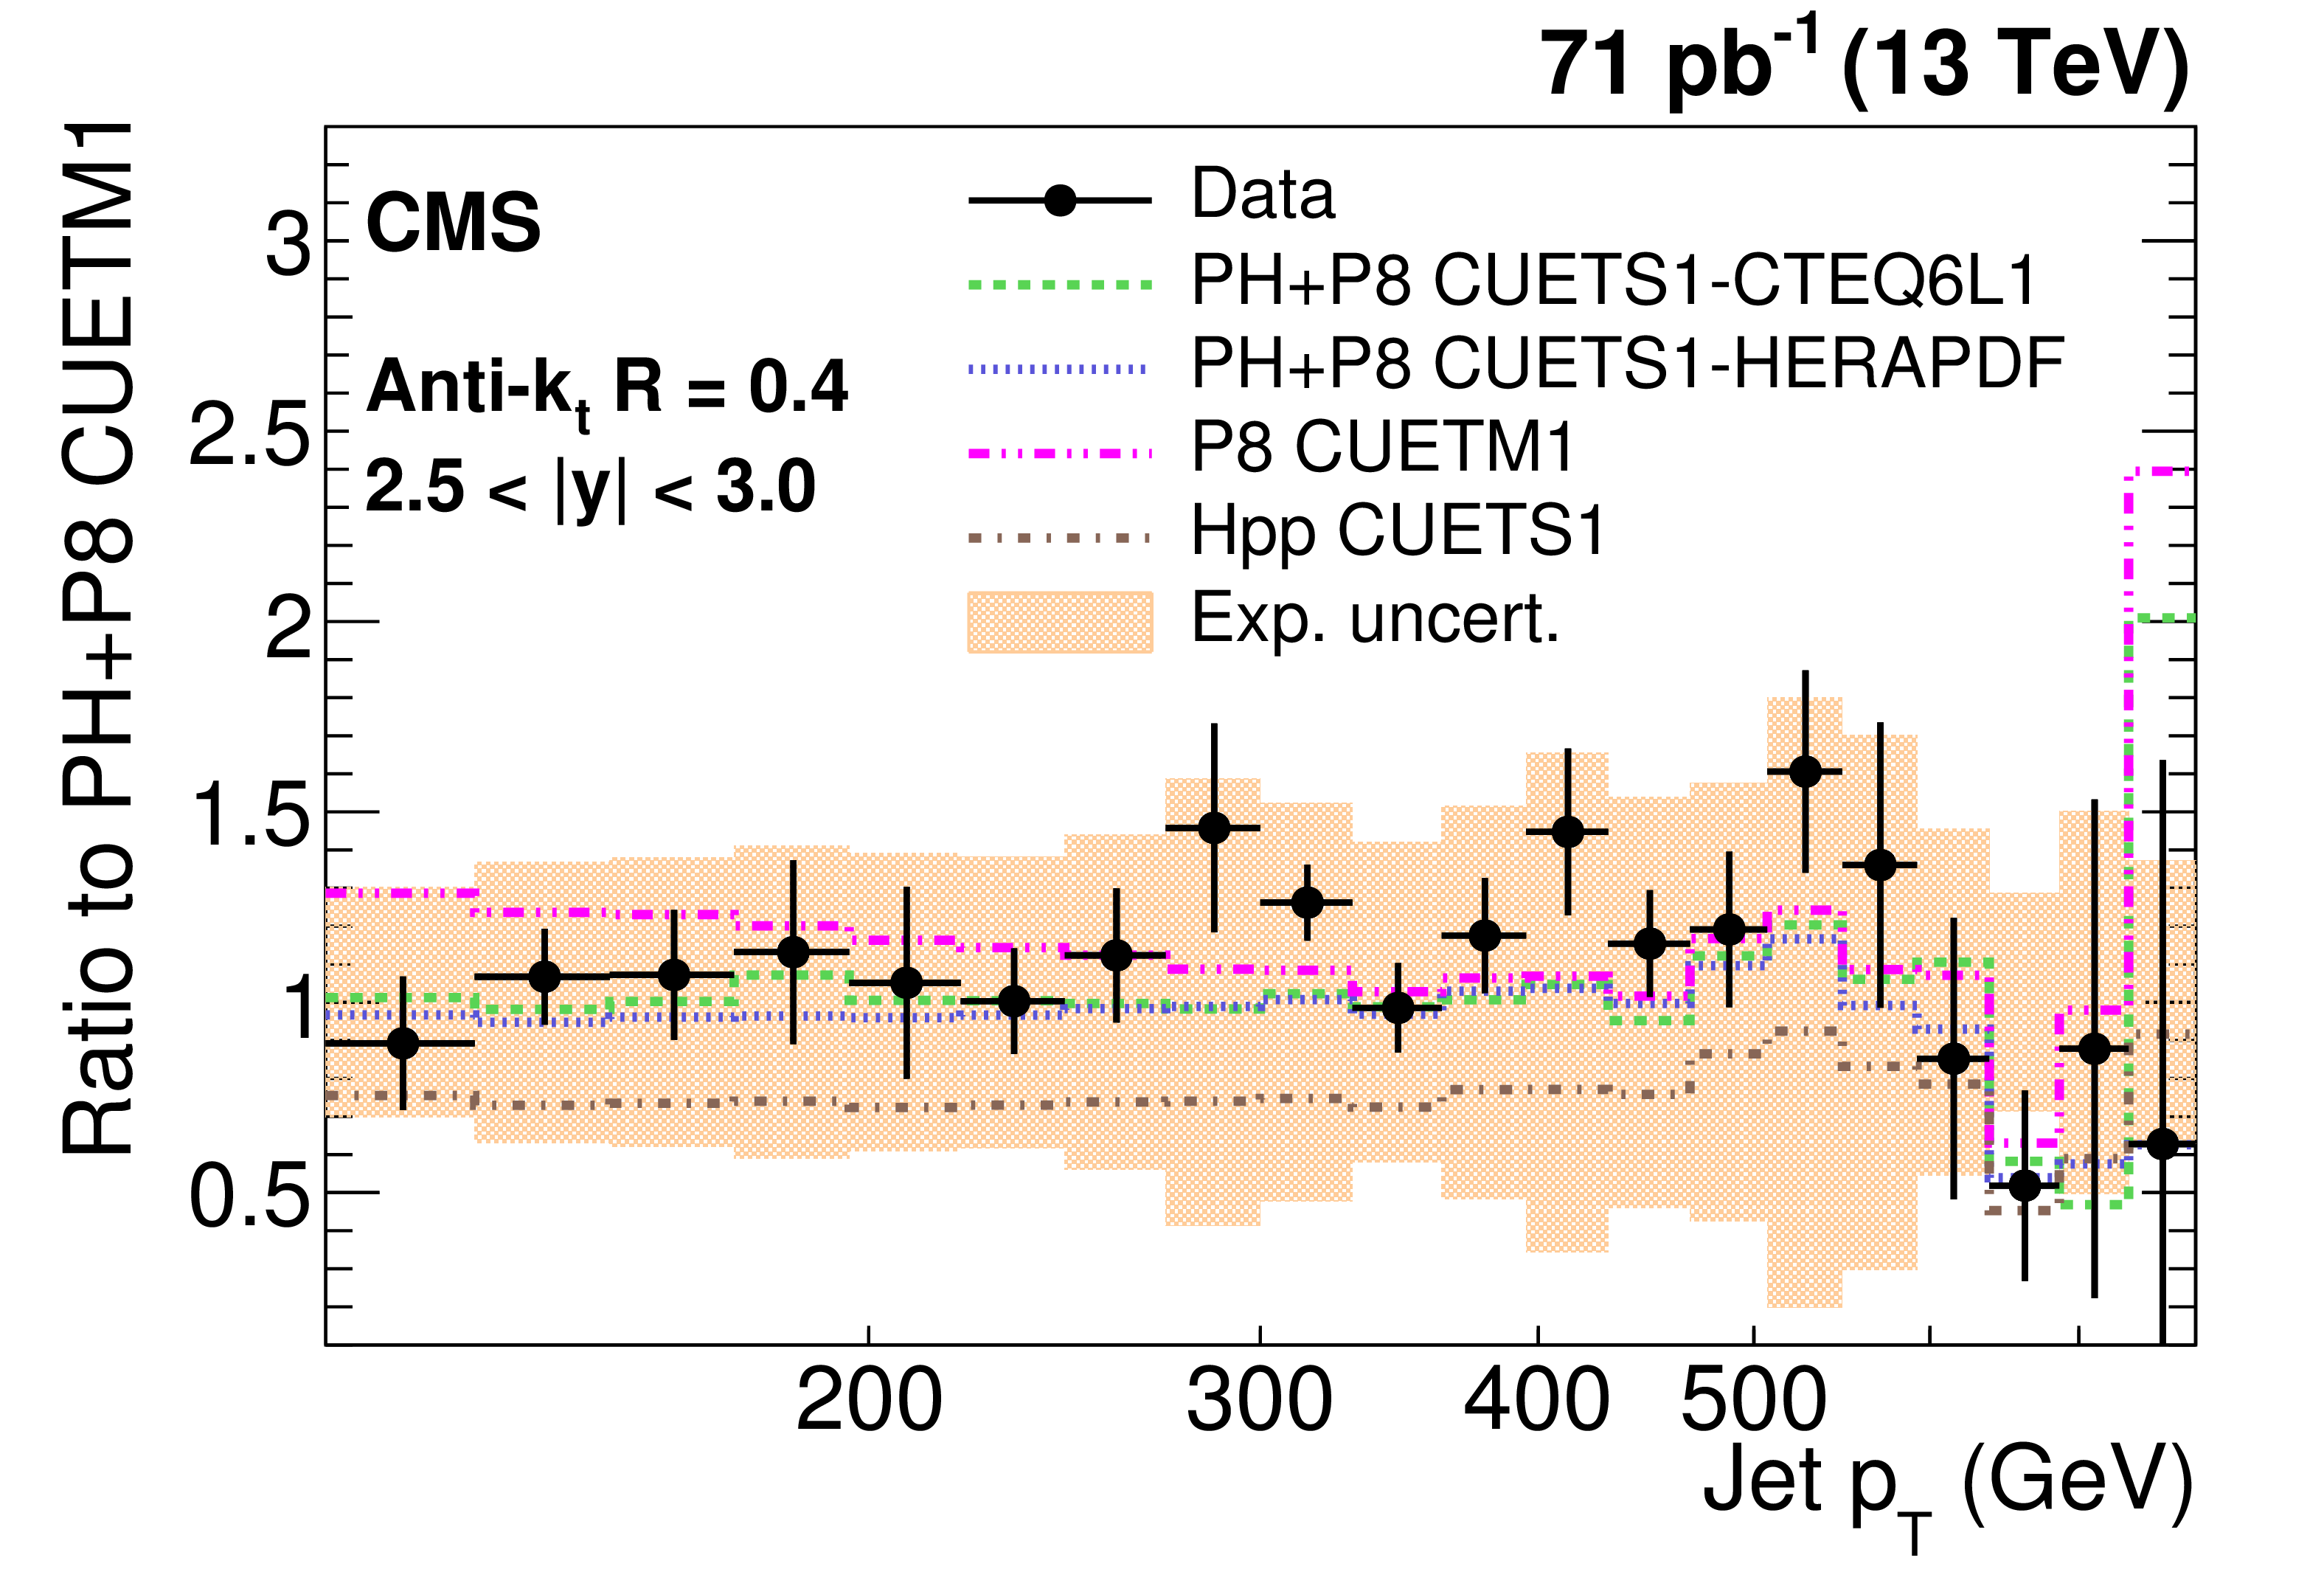
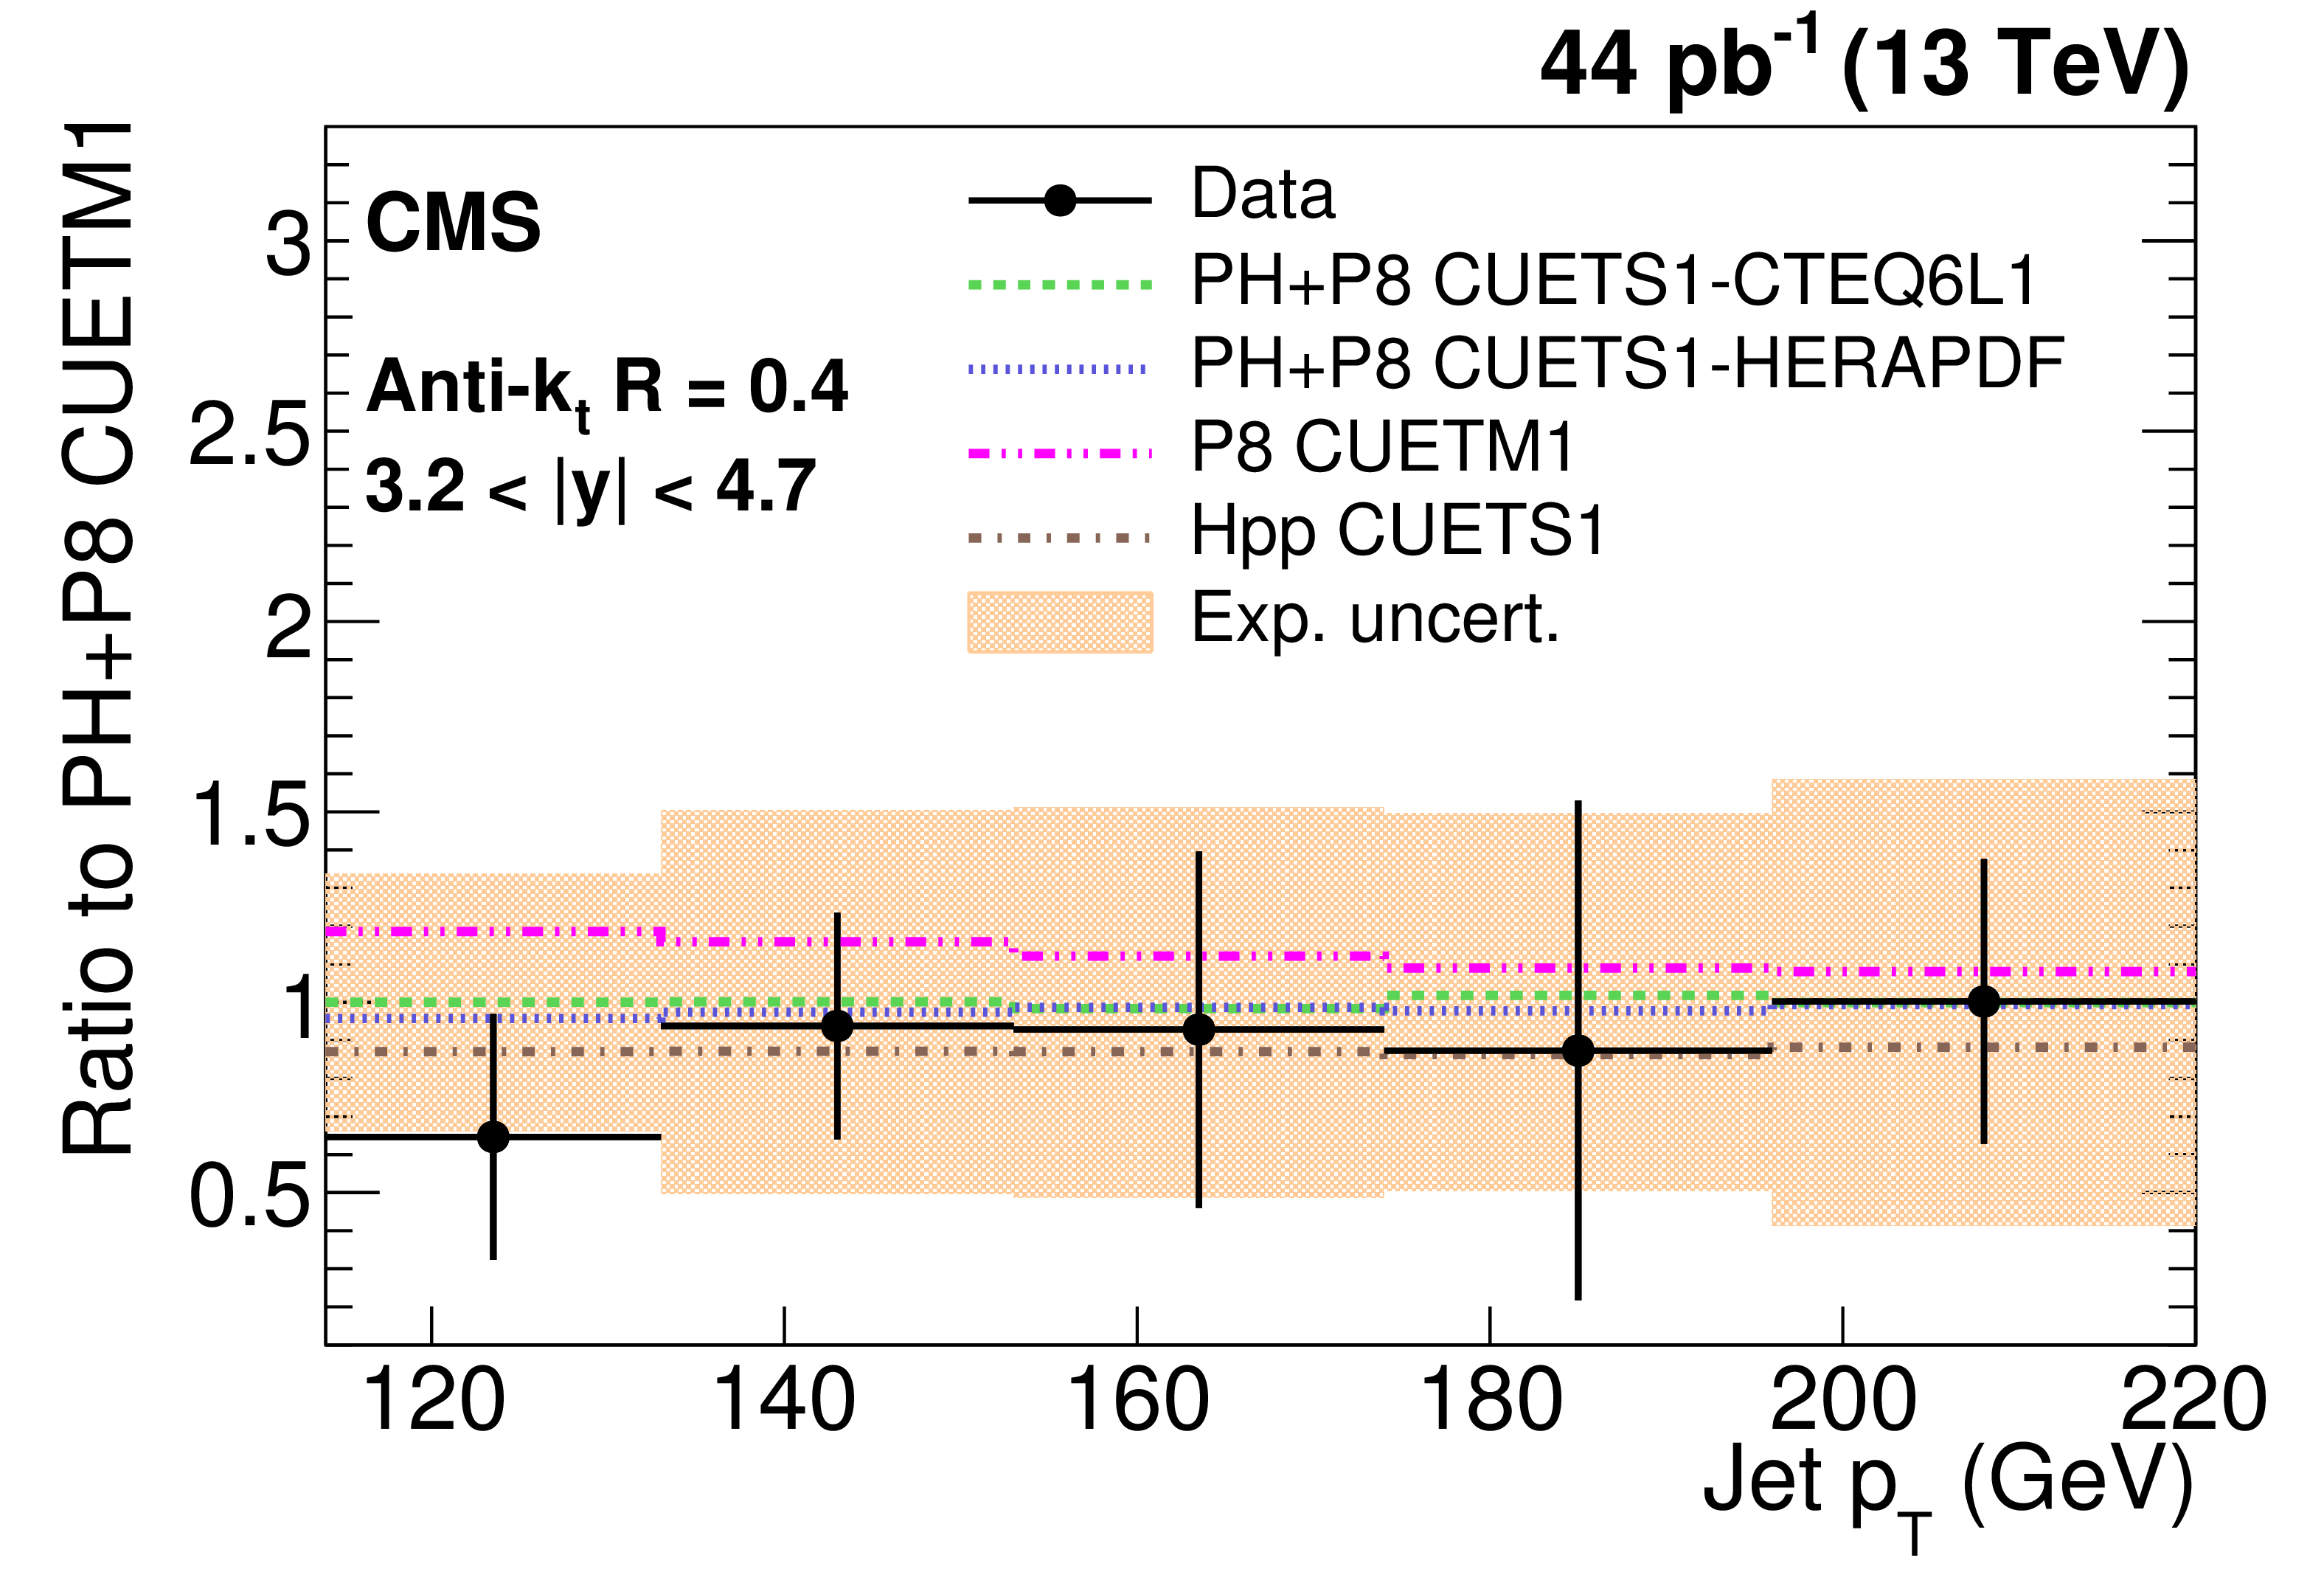
Figure 9-a:
Ratio of measured values to predictions fromPOWHEG (PH) + PYTHIA-8 (P8) with tune CUETM1. Predictions employing four other MC generators are also shown for comparison, where PH, P8, and Hpp stands forPOWHEG , PYTHIA-8 , and HERWIG++ (HPP), respectively. Jets are clustered with the anti-$ {k_{\mathrm {t}}}$ algorithm with a distance parameter of 0.4. The error bars correspond to the statistical uncertainties of the data and the shaded bands to the total experimental systematic uncertainties. |
png pdf |
Figure 9-b:
Ratio of measured values to predictions fromPOWHEG (PH) + PYTHIA-8 (P8) with tune CUETM1. Predictions employing four other MC generators are also shown for comparison, where PH, P8, and Hpp stands forPOWHEG , PYTHIA-8 , and HERWIG++ (HPP), respectively. Jets are clustered with the anti-$ {k_{\mathrm {t}}}$ algorithm with a distance parameter of 0.4. The error bars correspond to the statistical uncertainties of the data and the shaded bands to the total experimental systematic uncertainties. |

png pdf |
Figure 9-c:
Ratio of measured values to predictions fromPOWHEG (PH) + PYTHIA-8 (P8) with tune CUETM1. Predictions employing four other MC generators are also shown for comparison, where PH, P8, and Hpp stands forPOWHEG , PYTHIA-8 , and HERWIG++ (HPP), respectively. Jets are clustered with the anti-$ {k_{\mathrm {t}}}$ algorithm with a distance parameter of 0.4. The error bars correspond to the statistical uncertainties of the data and the shaded bands to the total experimental systematic uncertainties. |
png pdf |
Figure 9-d:
Ratio of measured values to predictions fromPOWHEG (PH) + PYTHIA-8 (P8) with tune CUETM1. Predictions employing four other MC generators are also shown for comparison, where PH, P8, and Hpp stands forPOWHEG , PYTHIA-8 , and HERWIG++ (HPP), respectively. Jets are clustered with the anti-$ {k_{\mathrm {t}}}$ algorithm with a distance parameter of 0.4. The error bars correspond to the statistical uncertainties of the data and the shaded bands to the total experimental systematic uncertainties. |
png pdf |
Figure 9-e:
Ratio of measured values to predictions fromPOWHEG (PH) + PYTHIA-8 (P8) with tune CUETM1. Predictions employing four other MC generators are also shown for comparison, where PH, P8, and Hpp stands forPOWHEG , PYTHIA-8 , and HERWIG++ (HPP), respectively. Jets are clustered with the anti-$ {k_{\mathrm {t}}}$ algorithm with a distance parameter of 0.4. The error bars correspond to the statistical uncertainties of the data and the shaded bands to the total experimental systematic uncertainties. |
png pdf |
Figure 9-f:
Ratio of measured values to predictions fromPOWHEG (PH) + PYTHIA-8 (P8) with tune CUETM1. Predictions employing four other MC generators are also shown for comparison, where PH, P8, and Hpp stands forPOWHEG , PYTHIA-8 , and HERWIG++ (HPP), respectively. Jets are clustered with the anti-$ {k_{\mathrm {t}}}$ algorithm with a distance parameter of 0.4. The error bars correspond to the statistical uncertainties of the data and the shaded bands to the total experimental systematic uncertainties. |
png pdf |
Figure 9-g:
Ratio of measured values to predictions fromPOWHEG (PH) + PYTHIA-8 (P8) with tune CUETM1. Predictions employing four other MC generators are also shown for comparison, where PH, P8, and Hpp stands forPOWHEG , PYTHIA-8 , and HERWIG++ (HPP), respectively. Jets are clustered with the anti-$ {k_{\mathrm {t}}}$ algorithm with a distance parameter of 0.4. The error bars correspond to the statistical uncertainties of the data and the shaded bands to the total experimental systematic uncertainties. |
| Tables | |

png pdf |
Table 1:
Trigger regions defined as ranges of the leading jet ${p_{\mathrm {T}}} $ in each event for all single-jet triggers used in the inclusive jet cross section measurement. |
| Summary |
|
A measurement of the double-differential cross section as a function of jet $ p_{\mathrm{T}} $italic and absolute rapidity $|y|$ is presented for two jet sizes $R= $ 0.4 and 0.7 using data from proton-proton collisions at $ \sqrt{s} = $ 13 TeV collected with the CMS detector. Data samples corresponding to integrated luminosities of 71 pb$^{-1}$ and 44 pb$^{-1}$ are used for absolute rapidities $|y|< $ 3 and for the forward region 3.2 $ <|y|< $ 4.7 , respectively. As expected for LO predictions, the MC event generators PYTHIA-8 and HERWIG++ exhibit significant discrepancies in absolute scale with respect to data, which are somewhat more pronounced for the case of HERWIG++. In contrast, the shape of the inclusive jet $ p_{\mathrm{T}} $ distribution is well described by HERWIG++ in all rapidity bins. Predictions from PYTHIA-8 start deviating from the observed shape as $|y|$ increases. In the comparison between data and predictions at NLO in perturbative QCD including corrections for nonperturbative and electroweak effects, it is observed that jet cross sections for the larger jet size of $R= $ 0.7 are accurately described, while for $R= $ 0.4 theory overestimates the cross section by 5-10% almost globally. In contrast, NLO predictions matched to parton showers as performed with POWHEG + PYTHIA-8 for two different tunes, perform equally well for both jet sizes. This result is consistent with the previous measurement performed at $ \sqrt{s} = $ 7 TeV [15], where it was observed that POWHEG + PYTHIA-8 correctly describes the $R$ dependence of the inclusive jet cross section, while fixed-order predictions at NLO were insufficient in that respect. This measurement is a first indication that jet physics is as well understood at $ \sqrt{s} = $ 13 TeV as at smaller centre-of-mass energies in the phase space accessible with the new data. |
| References | ||||
| 1 | ATLAS Collaboration | Measurement of the inclusive jet cross-section in pp collisions at $ \sqrt{s} = $ 2.76 TeV and comparison to the inclusive jet cross-section at $ \sqrt{s} = $ 7 TeV using the ATLAS detector | EPJC 73 (2013) 2509 | 1304.4739 |
| 2 | CMS Collaboration | Measurement of the inclusive jet cross section in pp collisions at $ \sqrt{s} = $ 2.76 TeV | Accepted by EPJC | CMS-SMP-14-017 1512.06212 |
| 3 | ATLAS Collaboration | Measurement of inclusive jet and dijet cross sections in proton-proton collisions at 7$ TeV $ centre-of-mass energy with the ATLAS detector | EPJC 71 (2011) 1512 | 1009.5908 |
| 4 | CMS Collaboration | Measurement of the inclusive jet cross section in pp collisions at $ \sqrt{s} = $ 7 TeV | PRL 107 (2011) 132001 | CMS-QCD-10-011 1106.0208 |
| 5 | ATLAS Collaboration | Measurement of inclusive jet and dijet production in pp collisions at $ \sqrt{s} = $ 7 TeV using the ATLAS detector | PRD 86 (2012) 014022 | 1112.6297 |
| 6 | CMS Collaboration | Measurements of differential jet cross sections in proton-proton collisions at $ \sqrt{s} = $ 7 TeV with the CMS detector | PRD 87 (2013) 112002 | CMS-QCD-11-004 1212.6660 |
| 7 | ATLAS Collaboration | Measurement of the inclusive jet cross-section in proton-proton collisions at $ \sqrt{s} = $ 7 TeV using 4.5$ fb$^{-1}$ $ of data with the ATLAS detector | JHEP 02 (2015) 153, , [Erratum: \DOI10.1007/JHEP09(2015)141] | 1410.8857 |
| 8 | UA2 Collaboration | Observation of very large transverse momentum jets at the CERN $ \mathrm{ p \bar{p} } $ collider | PLB 118 (1982) 203 | |
| 9 | UA1 Collaboration | Hadronic jet production at the CERN proton-antiproton collider | PLB 132 (1983) 214 | |
| 10 | CDF Collaboration | Measurement of the inclusive jet cross section using the $ k_{\mathrm T} $ algorithm in $ \mathrm{ p \bar{p} } $ collisions at $ \sqrt{s} = $ 1.96 TeV with the CDF II detector | PRD 75 (2007) 092006, , [Erratum: \DOI10.1103/PhysRevD.75.119901] | hep-ex/0701051 |
| 11 | D0 Collaboration | Measurement of the inclusive jet cross section in $ \mathrm{ p \bar{p} } $ collisions at $ \sqrt{s} = $ 1.96 TeV | PRL 101 (2008) 062001 | 0802.2400 |
| 12 | CDF Collaboration | Measurement of the inclusive jet cross section at the Fermilab Tevatron $ \mathrm{ p \bar{p} } $ collider using a cone-based jet algorithm | PRD 78 (2008) 052006, , [Erratum: \DOI10.1103/PhysRevD.79.119902] | 0807.2204 |
| 13 | M. Cacciari, G. P. Salam, and G. Soyez | The anti-$ k_t $ jet clustering algorithm | JHEP 04 (2008) 063 | 0802.1189 |
| 14 | M. Cacciari, G. P. Salam, and G. Soyez | FastJet user manual | EPJC 72 (2012) 1896 | 1111.6097 |
| 15 | CMS Collaboration | Measurement of the ratio of inclusive jet cross sections using the anti-$ k_t $ algorithm with radius parameters $ R = 0.5 $ and $ 0.7 $ in pp collisions at $ \sqrt{s} = $ 7 TeV | PRD 90 (2014) 072006 | CMS-SMP-13-002 1406.0324 |
| 16 | M. Dasgupta, L. Magnea, and G. P. Salam | Non-perturbative QCD effects in jets at hadron colliders | JHEP 02 (2008) 055 | 0712.3014 |
| 17 | M. Dasgupta, F. Dreyer, G. P. Salam, and G. Soyez | Small-radius jets to all orders in QCD | JHEP 04 (2015) 039 | 1411.5182 |
| 18 | M. Dasgupta, F. A. Dreyer, G. P. Salam, and G. Soyez | Inclusive jet spectrum for small-radius jets | 1602.01110 | |
| 19 | CMS Collaboration | Particle--flow event reconstruction in CMS and performance for jets, taus, and $ E_{\mathrm{T}}^{\text{miss}} $ | CDS | |
| 20 | CMS Collaboration | Commissioning of the particle-flow reconstruction in minimum-bias and jet events from pp collisions at 7$ TeV $ | CDS | |
| 21 | CMS Collaboration | The CMS experiment at the CERN LHC | JINST 3 (2008) S08004 | CMS-00-001 |
| 22 | CMS Collaboration | The CMS high level trigger | EPJC 46 (2006) 605 | hep-ex/0512077 |
| 23 | CMS Collaboration | Determination of jet energy calibration and transverse momentum resolution in CMS | JINST 6 (2011) P11002 | CMS-JME-10-011 1107.4277 |
| 24 | CMS Collaboration | Jet energy corrections and uncertainties. Detector performance plots for 2012 | CDS | |
| 25 | T. Sj\"ostrand et al. | An Introduction to PYTHIA 8.2 | CPC 191 (2015) 159 | 1410.3012 |
| 26 | CMS Collaboration | Event generator tunes obtained from underlying event and multiparton scattering measurements | EPJC 76 (2016) 155 | CMS-GEN-14-001 1512.00815 |
| 27 | CMS Collaboration | Jet performance in pp collisions at $ \sqrt{s} = $ 7 TeV | CDS | |
| 28 | C. Buttar et al. | Standard Model handles and candles working group: tools and jets summary report | 0803.0678 | |
| 29 | G. D'Agostini | A multidimensional unfolding method based on Bayes' theorem | NIMA 362 (1995) 487 | |
| 30 | T. Adye | Unfolding algorithms and tests using RooUnfold | in PHYSTAT 2011 Workshop on Statistical Issues Related to Discovery Claims in Search Experiments and Unfolding, H. Prosper and L. Lyons, eds. Geneva, Switzerland, 2011. | 1105.1160 |
| 31 | Z. Nagy | Three-jet cross sections in hadron-hadron collisions at next-to-leading order | PRL 88 (2002) 122003 | hep-ph/0110315 |
| 32 | Z. Nagy | Next-to-leading order calculation of three-jet observables in hadron-hadron collisions | PRD 68 (2003) 094002 | hep-ph/0307268 |
| 33 | D. Britzger, K. Rabbertz, F. Stober, and M. Wobisch | New features in version 2 of the fastNLO project | 1208.3641 | |
| 34 | S. Dulat et al. | New parton distribution functions from a global analysis of quantum chromodynamics | 1506.07443 | |
| 35 | GEANT4 Collaboration | GEANT4---a simulation toolkit | NIMA 506 (2003) 250 | |
| 36 | CMS Collaboration | CMS luminosity measurement for the 2015 data taking period | CMS-PAS-LUM-15-001 | CMS-PAS-LUM-15-001 |
| 37 | ZEUS and H1 Collaborations | Combined measurement and QCD analysis of the inclusive $ \mathrm{ e^{\pm}p } $ scattering cross sections at HERA | JHEP 01 (2010) 109 | 0911.0884 |
| 38 | L. A. Harland-Lang, A. D. Martin, P. Motylinski, and R. S. Thorne | Parton distributions in the LHC era: MMHT 2014 PDFs | EPJC 75 (2015) 204 | 1412.3989 |
| 39 | NNPDF Collaboration | Parton distributions for the LHC run II | JHEP 04 (2015) 040 | 1410.8849 |
| 40 | J. Bellm et al. | Herwig++ 2.7 release note | 1310.6877 | |
| 41 | M. H. Seymour and A. Si\'odmok | Constraining MPI models using $ \sigma_{\textrm{eff}} $ and recent Tevatron and LHC underlying event data | JHEP 10 (2013) 113 | 1307.5015 |
| 42 | P. Nason | A new method for combining NLO QCD with shower Monte Carlo algorithms | JHEP 11 (2004) 040 | hep-ph/0409146 |
| 43 | S. Frixione, P. Nason, and C. Oleari | Matching NLO QCD computations with parton shower simulations: the POWHEG method | JHEP 11 (2007) 070 | 0709.2092 |
| 44 | S. Alioli et al. | Jet pair production in POWHEG | JHEP 04 (2011) 081 | 1012.3380 |
| 45 | S. Dittmaier, A. Huss, and C. Speckner | Weak radiative corrections to dijet production at hadron colliders | JHEP 11 (2012) 095 | 1210.0438 |
| 46 | CMS Collaboration | Constraints on parton distribution functions and extraction of the strong coupling constant from the inclusive jet cross section in pp collisions at $ \sqrt{s} = $ 7 TeV | EPJC 75 (2015) 288 | CMS-SMP-12-028 1410.6765 |
| 47 | B. Andersson | The Lund model | Camb. Monogr. Part. Phys. Nucl. Phys. Cosmol. 7 (1997) 1 | |
| 48 | B. R. Webber | A QCD model for jet fragmentation including soft gluon interference | Nucl. Phys. B 238 (1984) 492 | |
| 49 | R. Corke and T. Sj\"ostrand | Interleaved parton showers and tuning prospects | JHEP 03 (2011) 032 | 1011.1759 |
| 50 | NNPDF Collaboration | Parton distributions with QED corrections | Nucl. Phys. B 877 (2013) 290 | 1308.0598 |
| 51 | NNPDF Collaboration | Unbiased global determination of parton distributions and their uncertainties at NNLO and at LO | Nucl. Phys. B 855 (2012) 153 | 1107.2652 |
| 52 | J. Pumplin et al. | New generation of parton distributions with uncertainties from global QCD analysis | JHEP 07 (2002) 012 | hep-ph/0201195 |
| 53 | H.-L. Lai et al. | New parton distributions for collider physics | PRD 82 (2010) 074024 | 1007.2241 |
| 54 | A. M. Cooper-Sarkar | HERAPDF1.5LO PDF set with experimental uncertainties | in Proceedings, 22nd International Workshop on Deep-Inelastic Scattering and Related Subjects (DIS 2014), volume DIS2014, p. 032, 2014. | |
| 55 | P. Z. Skands, S. Carrazza, and J. Rojo | Tuning PYTHIA 8.1: the Monash 2013 Tune | EPJC 74 (2014) 3024 | 1404.5630 |
|
|
Compact Muon Solenoid LHC, CERN |
|

|

|

|

|

|