

Compact Muon Solenoid
LHC, CERN
| CMS-TOP-12-028 ; CERN-PH-EP-2015-117 | ||
| Measurement of the differential cross section for top quark pair production in pp collisions at $\sqrt{s} $ = 8 TeV | ||
| CMS Collaboration | ||
| 17 May 2015 | ||
| Eur. Phys. J. C 75 (2015) 542 | ||
| Abstract: The normalized differential cross section for top quark pair ($ \mathrm{ t \bar{t} } $) production is measured in pp collisions at a centre-of-mass energy of 8 TeV at the CERN LHC using the CMS detector in data corresponding to an integrated luminosity of 19.7 fb$^{-1}$. The measurements are performed in the lepton+jets (e/$ \mu $+jets) and in the dilepton (ee, $ \mu \mu $, and e$ \mu $) decay channels. The $ \mathrm{ t \bar{t} } $ cross section is measured as a function of the kinematic properties of the charged leptons, the jets associated to b quarks, the top quarks, and the $ \mathrm{ t \bar{t} } $ system. The data are compared with several predictions from perturbative QCD up to approximate next-to-next-to-leading-order precision. No significant deviations are observed relative to the standard model predictions. | ||
| Links: e-print arXiv:1505.04480 [hep-ex] (PDF) ; CDS record ; inSPIRE record ; HepData record ; CADI line (restricted) ; | ||
| Figures | |

png pdf |
Figure 1-a:
Kinematic distributions after event selection and before the kinematic reconstruction of the $ {\mathrm {t}\overline {\mathrm {t}}} $ system in the $ {\ell }$+jets channels: the multiplicity in the reconstructed number of b-tagged jets (a), the multiplicity in the reconstructed number of jets (b), the $ {p_{\mathrm {T}}} $ of the selected isolated leptons (c), and the $ {p_{\mathrm {T}}} $ of all reconstructed jets (d). The QCD multijet background is negligible and not shown. The hatched regions correspond to the shape uncertainties for the signal and backgrounds (cf Section 5, Systematic Uncertainties). The lower part of each plot shows the ratio of data to the predictions. |
png pdf |
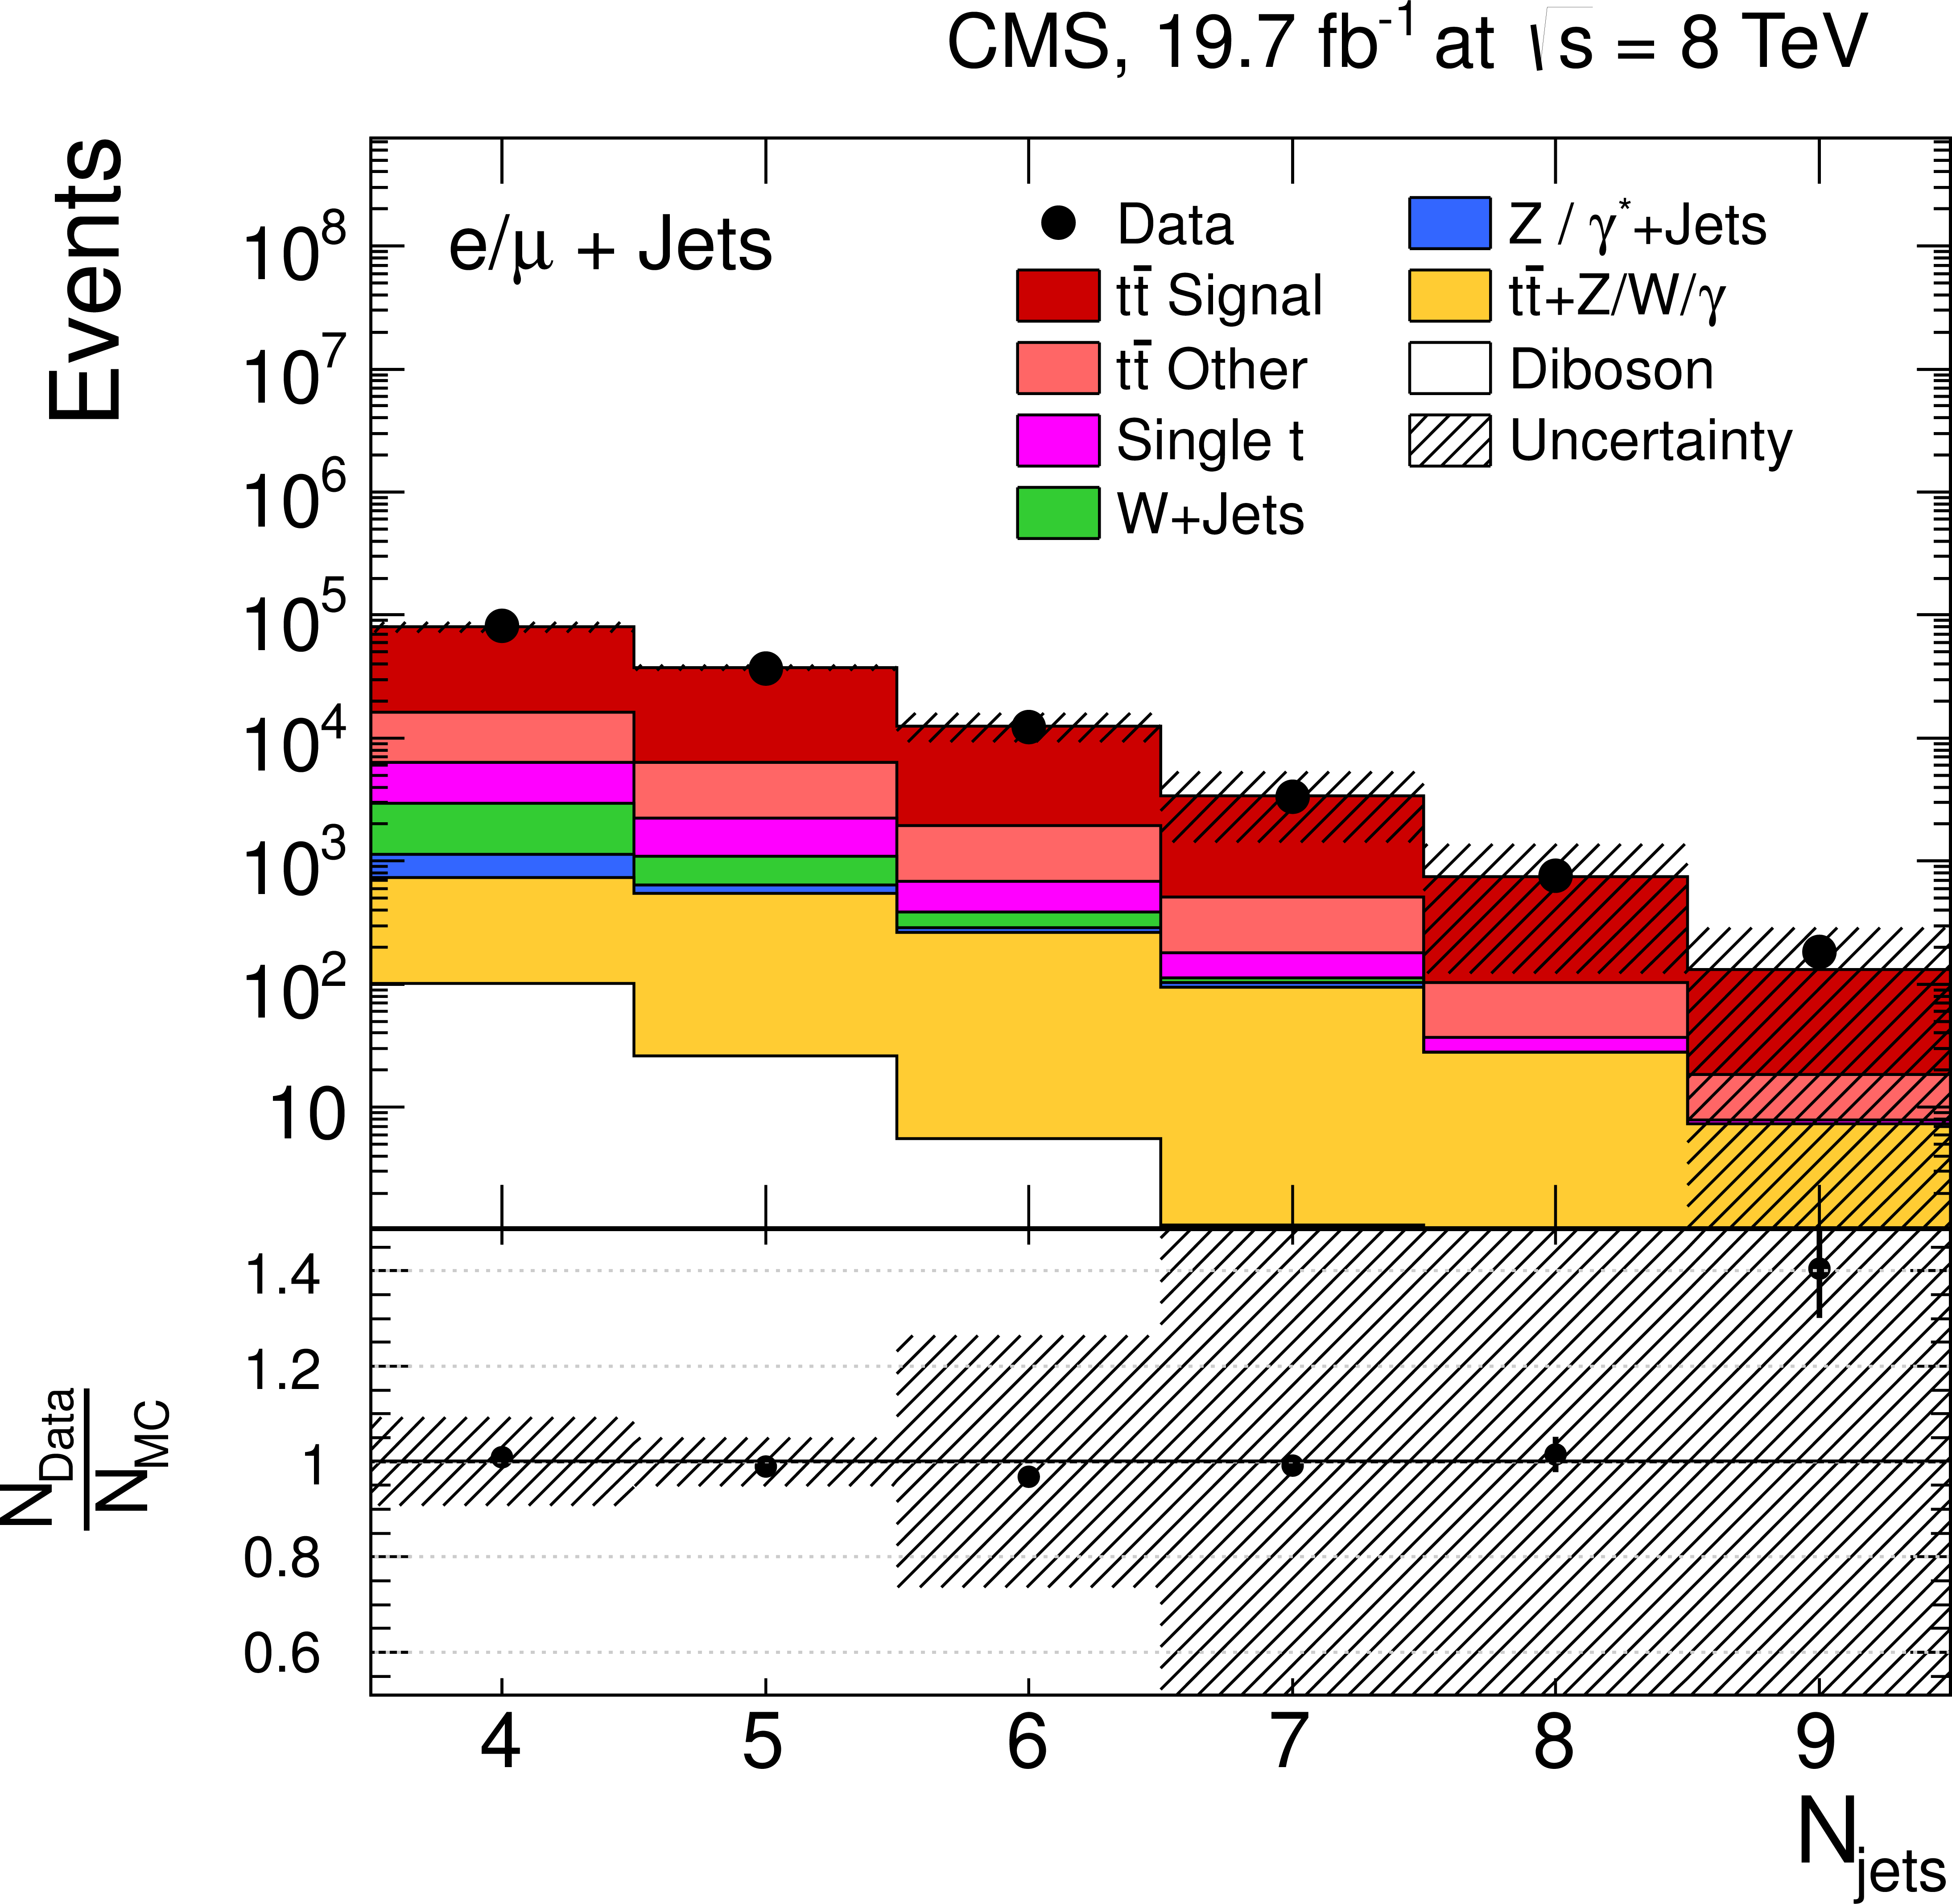
Figure 1-b:
Kinematic distributions after event selection and before the kinematic reconstruction of the $ {\mathrm {t}\overline {\mathrm {t}}} $ system in the $ {\ell }$+jets channels: the multiplicity in the reconstructed number of b-tagged jets (a), the multiplicity in the reconstructed number of jets (b), the $ {p_{\mathrm {T}}} $ of the selected isolated leptons (c), and the $ {p_{\mathrm {T}}} $ of all reconstructed jets (d). The QCD multijet background is negligible and not shown. The hatched regions correspond to the shape uncertainties for the signal and backgrounds (cf Section 5, Systematic Uncertainties). The lower part of each plot shows the ratio of data to the predictions. |

png pdf |
Figure 1-c:
Kinematic distributions after event selection and before the kinematic reconstruction of the $ {\mathrm {t}\overline {\mathrm {t}}} $ system in the $ {\ell }$+jets channels: the multiplicity in the reconstructed number of b-tagged jets (a), the multiplicity in the reconstructed number of jets (b), the $ {p_{\mathrm {T}}} $ of the selected isolated leptons (c), and the $ {p_{\mathrm {T}}} $ of all reconstructed jets (d). The QCD multijet background is negligible and not shown. The hatched regions correspond to the shape uncertainties for the signal and backgrounds (cf Section 5, Systematic Uncertainties). The lower part of each plot shows the ratio of data to the predictions. |

png pdf |
Figure 1-d:
Kinematic distributions after event selection and before the kinematic reconstruction of the $ {\mathrm {t}\overline {\mathrm {t}}} $ system in the $ {\ell }$+jets channels: the multiplicity in the reconstructed number of b-tagged jets (a), the multiplicity in the reconstructed number of jets (b), the $ {p_{\mathrm {T}}} $ of the selected isolated leptons (c), and the $ {p_{\mathrm {T}}} $ of all reconstructed jets (d). The QCD multijet background is negligible and not shown. The hatched regions correspond to the shape uncertainties for the signal and backgrounds (cf Section 5, Systematic Uncertainties). The lower part of each plot shows the ratio of data to the predictions. |

png pdf |
Figure 2-a:
Kinematic distributions after event selection and before the kinematic reconstruction of the $ {\mathrm {t}\overline {\mathrm {t}}} $ system for the dilepton channels: the multiplicity in the reconstructed number of b-tagged jets (a), the multiplicity in the number of reconstructed jets (b), the $ {p_{\mathrm {T}}} $ of the selected isolated leptons (c), and the $ {p_{\mathrm {T}}} $ of the reconstructed jets (d). The QCD multijet background is negligible and not shown. The Z/$\gamma ^{*}$+jets background is determined from data [5 (CMS, EPJC 73 (2013) 2339)-40 (CMS, JHEP 07 (2011) 049)] . The hatched regions correspond to the shape uncertainties for the signal and backgrounds (cf. Section 5, Systematic Uncertainties). The lower part of each plot shows the ratio of data to the predictions. |
png pdf |
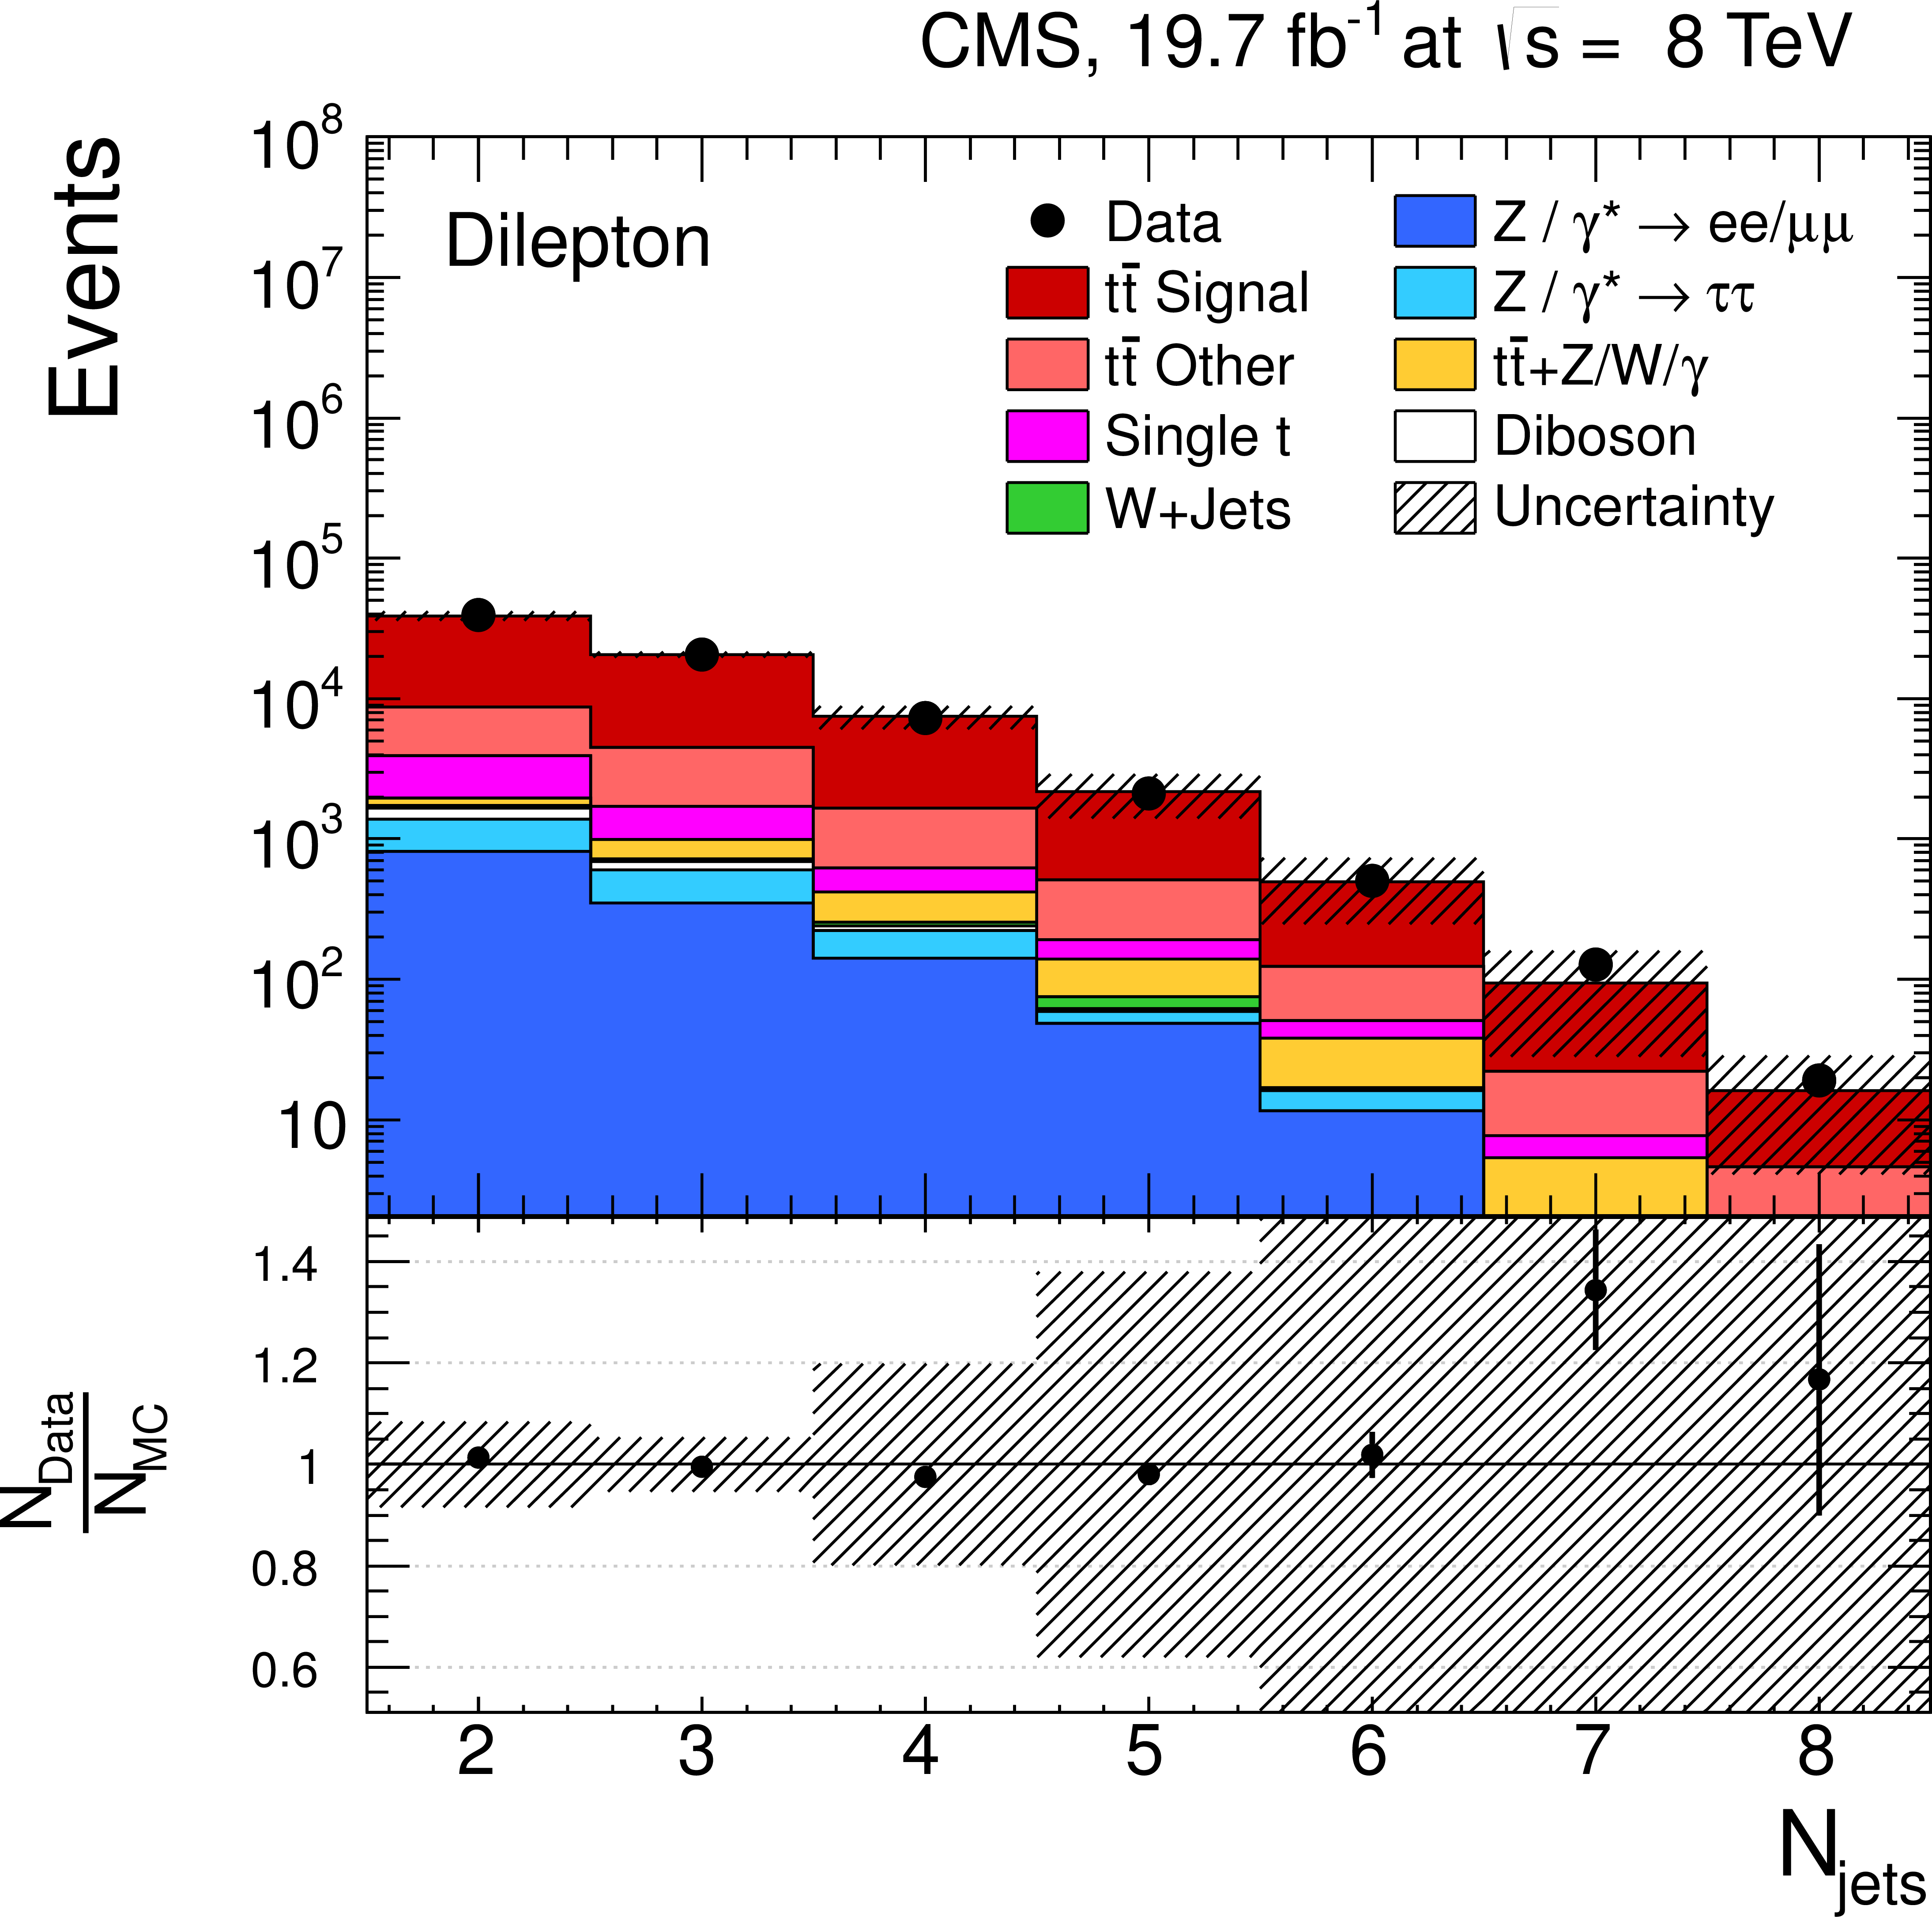
Figure 2-b:
Kinematic distributions after event selection and before the kinematic reconstruction of the $ {\mathrm {t}\overline {\mathrm {t}}} $ system for the dilepton channels: the multiplicity in the reconstructed number of b-tagged jets (a), the multiplicity in the number of reconstructed jets (b), the $ {p_{\mathrm {T}}} $ of the selected isolated leptons (c), and the $ {p_{\mathrm {T}}} $ of the reconstructed jets (d). The QCD multijet background is negligible and not shown. The Z/$\gamma ^{*}$+jets background is determined from data [5 (CMS, EPJC 73 (2013) 2339)-40 (CMS, JHEP 07 (2011) 049)] . The hatched regions correspond to the shape uncertainties for the signal and backgrounds (cf. Section 5, Systematic Uncertainties). The lower part of each plot shows the ratio of data to the predictions. |
png pdf |
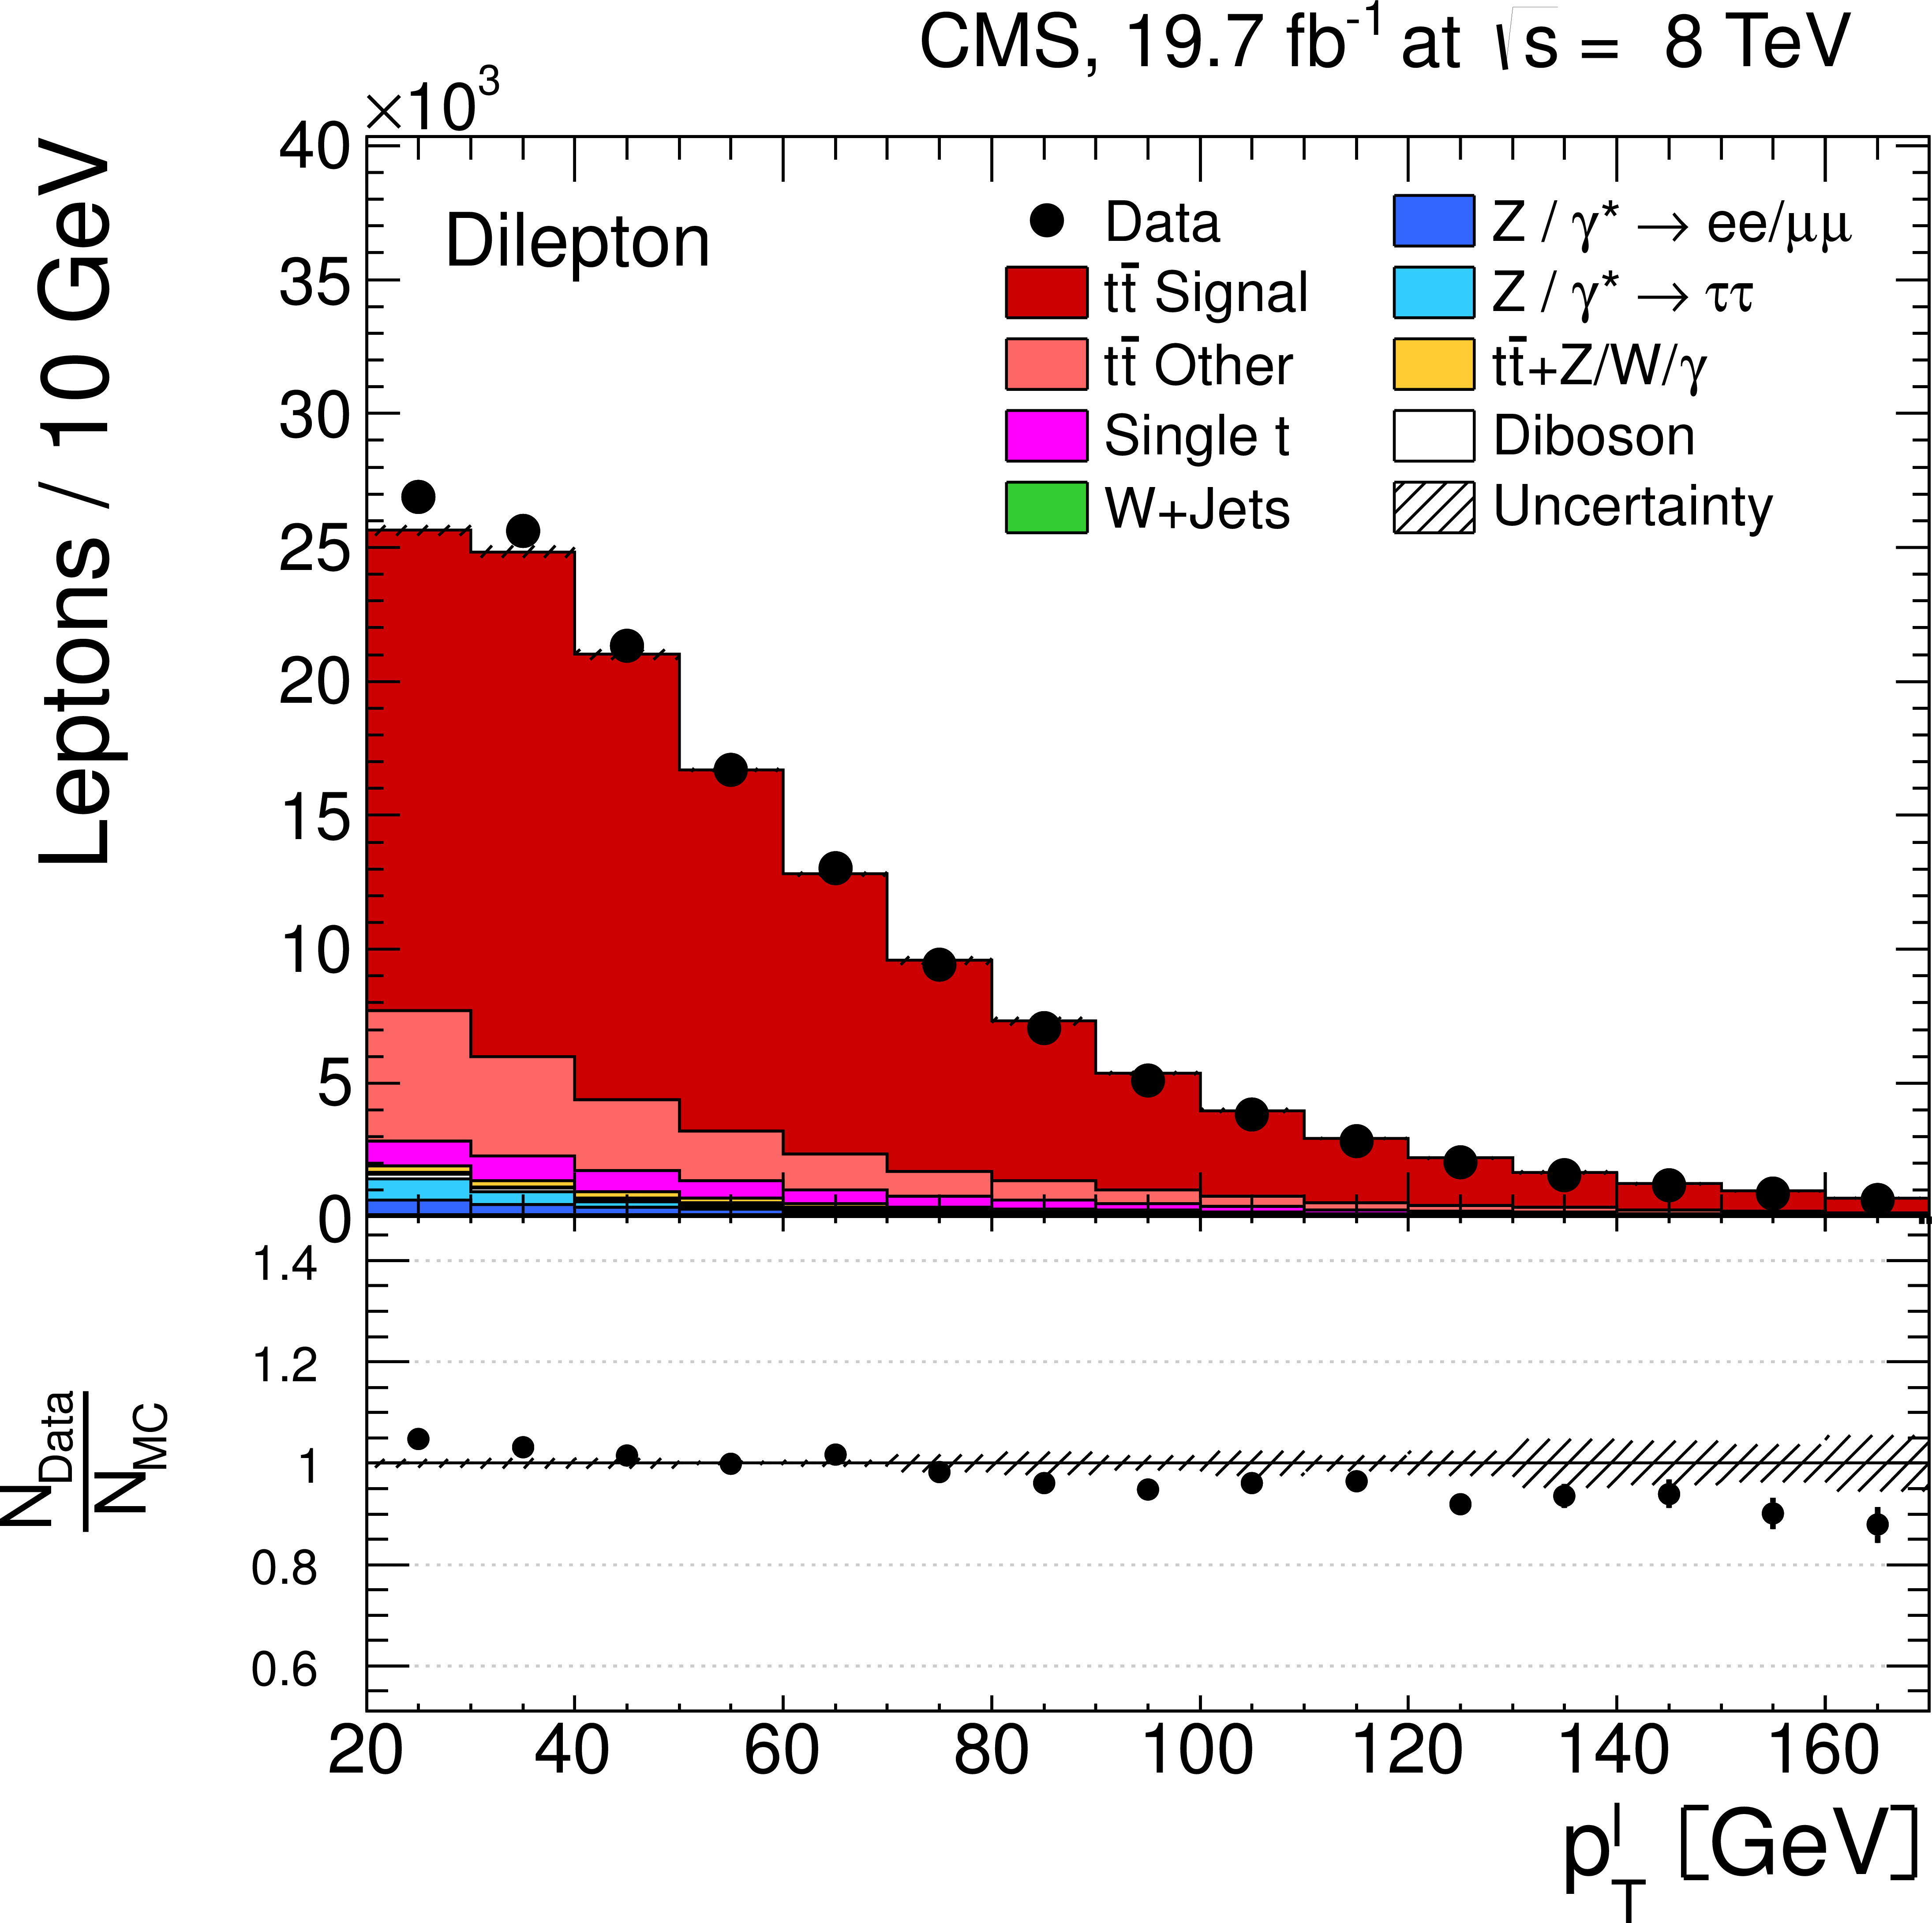
Figure 2-c:
Kinematic distributions after event selection and before the kinematic reconstruction of the $ {\mathrm {t}\overline {\mathrm {t}}} $ system for the dilepton channels: the multiplicity in the reconstructed number of b-tagged jets (a), the multiplicity in the number of reconstructed jets (b), the $ {p_{\mathrm {T}}} $ of the selected isolated leptons (c), and the $ {p_{\mathrm {T}}} $ of the reconstructed jets (d). The QCD multijet background is negligible and not shown. The Z/$\gamma ^{*}$+jets background is determined from data [5 (CMS, EPJC 73 (2013) 2339)-40 (CMS, JHEP 07 (2011) 049)] . The hatched regions correspond to the shape uncertainties for the signal and backgrounds (cf. Section 5, Systematic Uncertainties). The lower part of each plot shows the ratio of data to the predictions. |
png pdf |
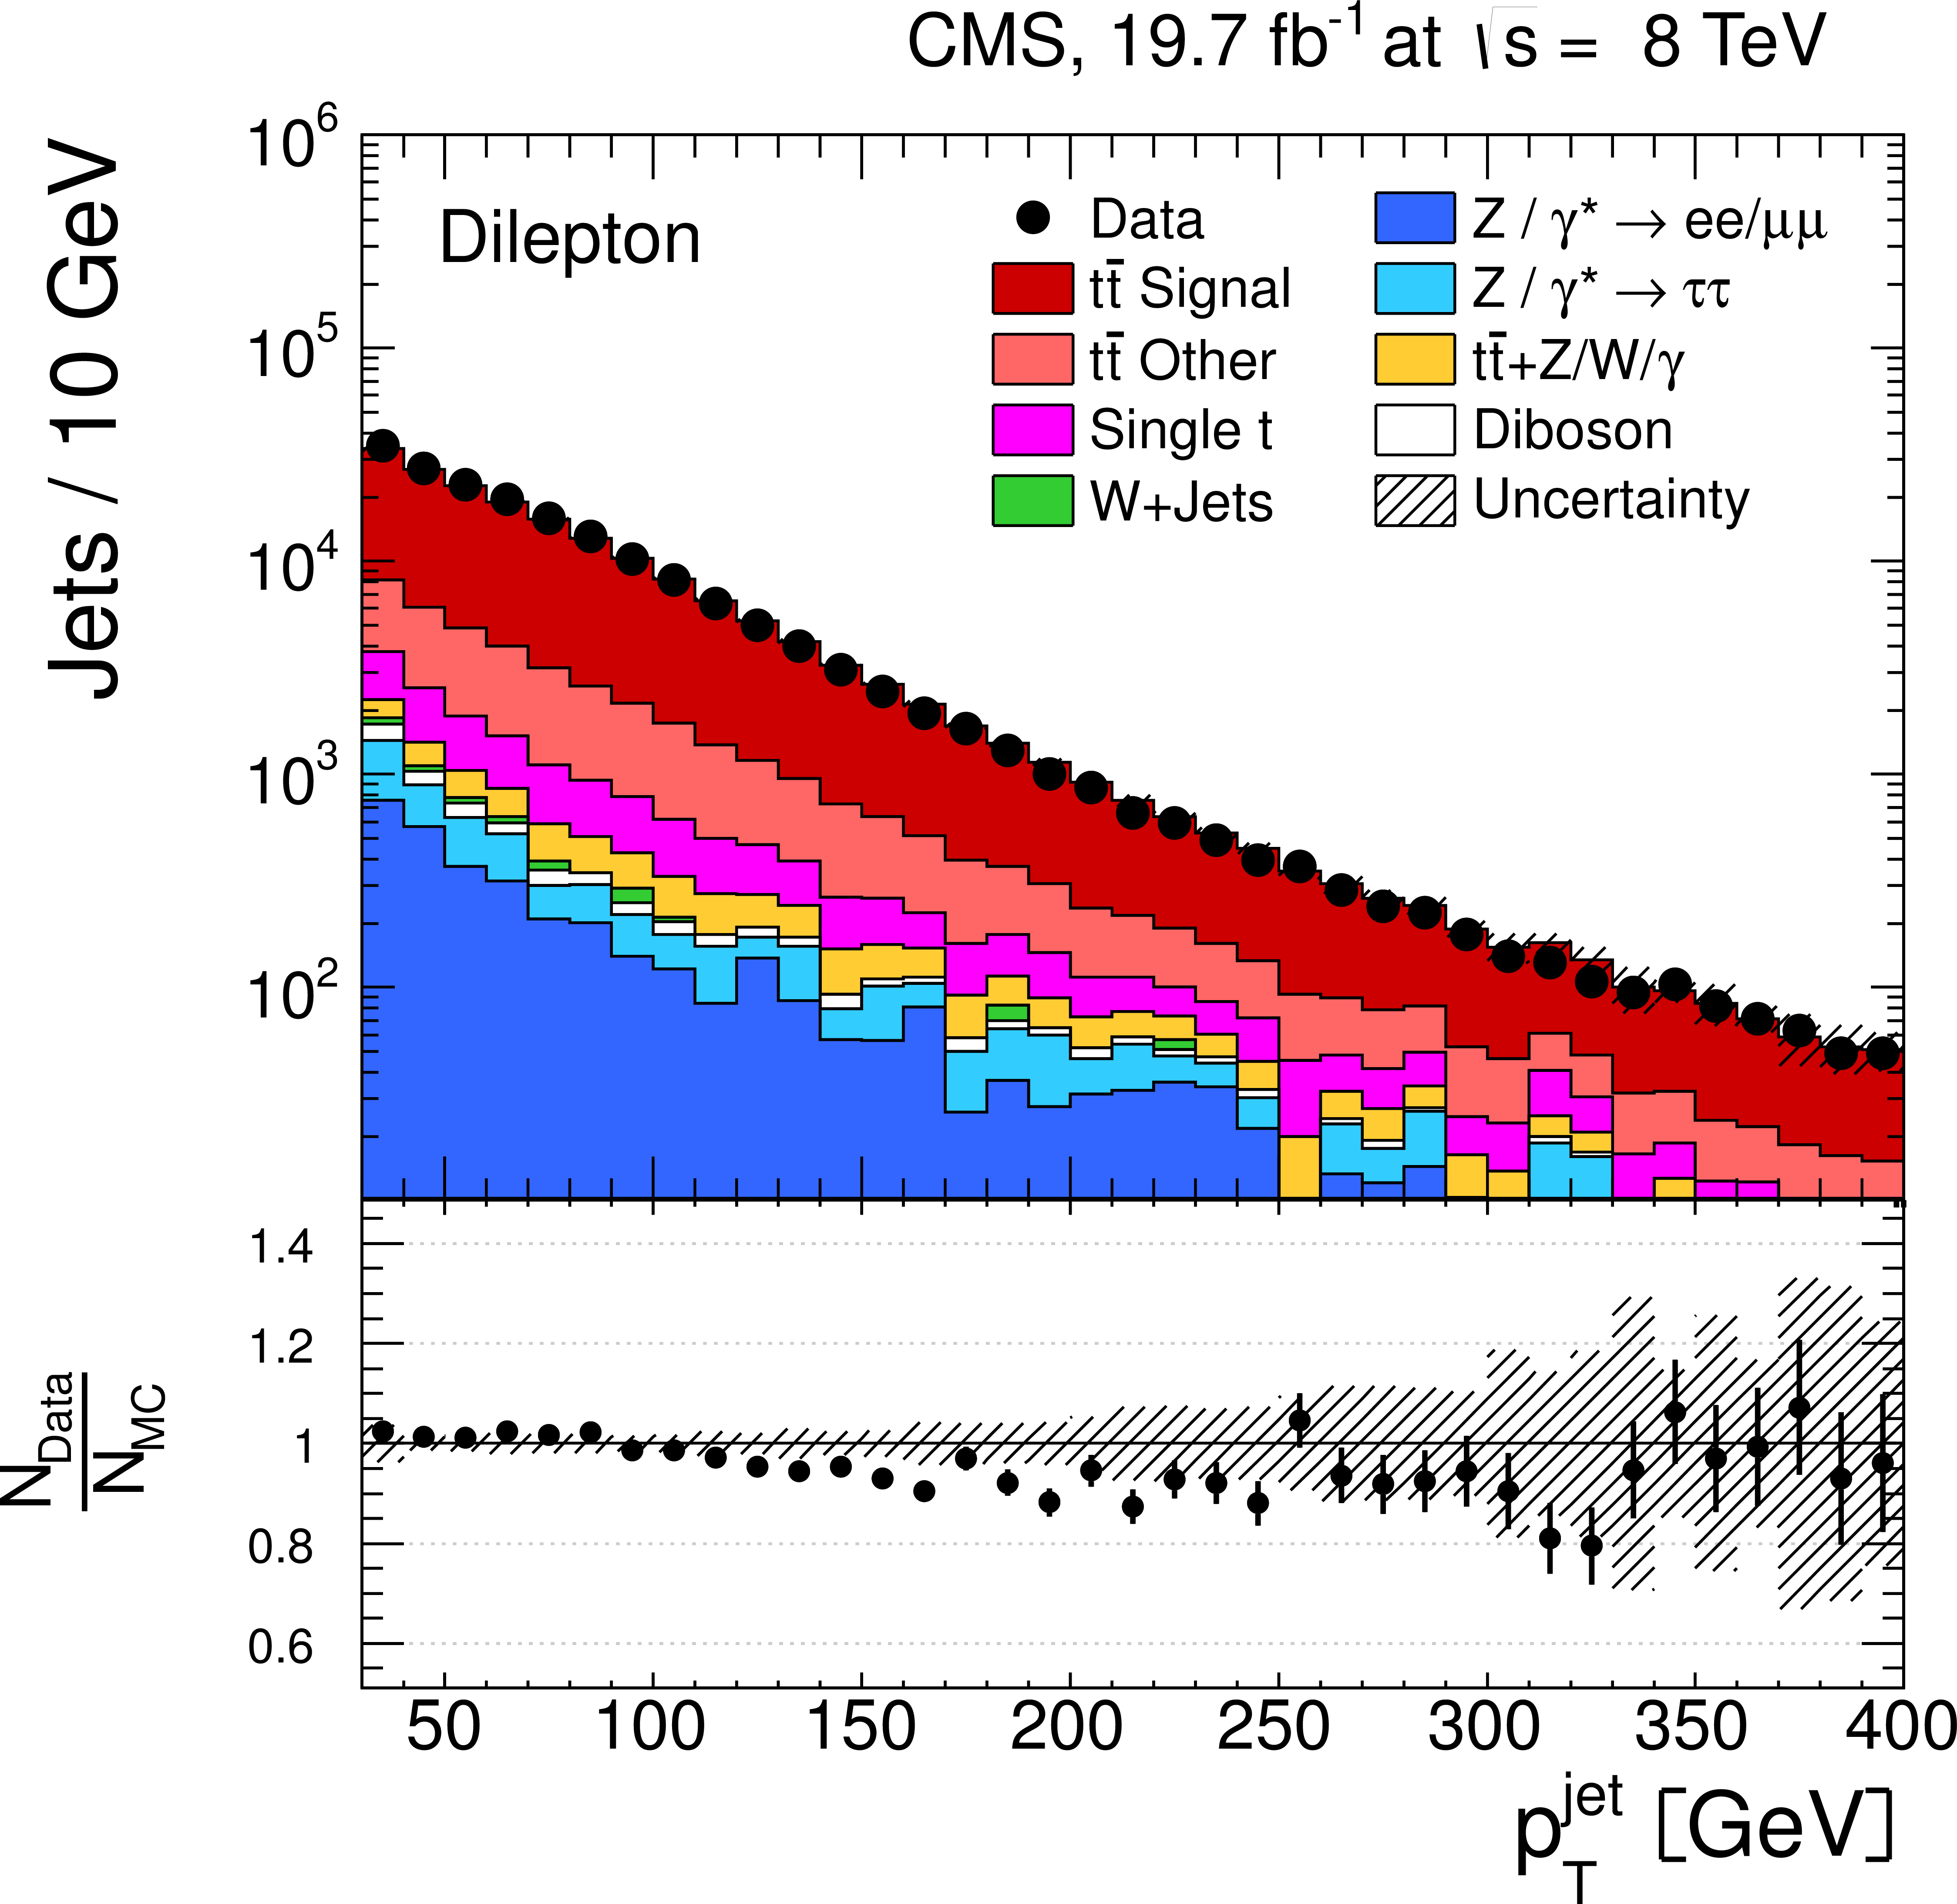
Figure 2-d:
Kinematic distributions after event selection and before the kinematic reconstruction of the $ {\mathrm {t}\overline {\mathrm {t}}} $ system for the dilepton channels: the multiplicity in the reconstructed number of b-tagged jets (a), the multiplicity in the number of reconstructed jets (b), the $ {p_{\mathrm {T}}} $ of the selected isolated leptons (c), and the $ {p_{\mathrm {T}}} $ of the reconstructed jets (d). The QCD multijet background is negligible and not shown. The Z/$\gamma ^{*}$+jets background is determined from data [5 (CMS, EPJC 73 (2013) 2339)-40 (CMS, JHEP 07 (2011) 049)] . The hatched regions correspond to the shape uncertainties for the signal and backgrounds (cf. Section 5, Systematic Uncertainties). The lower part of each plot shows the ratio of data to the predictions. |
png pdf |
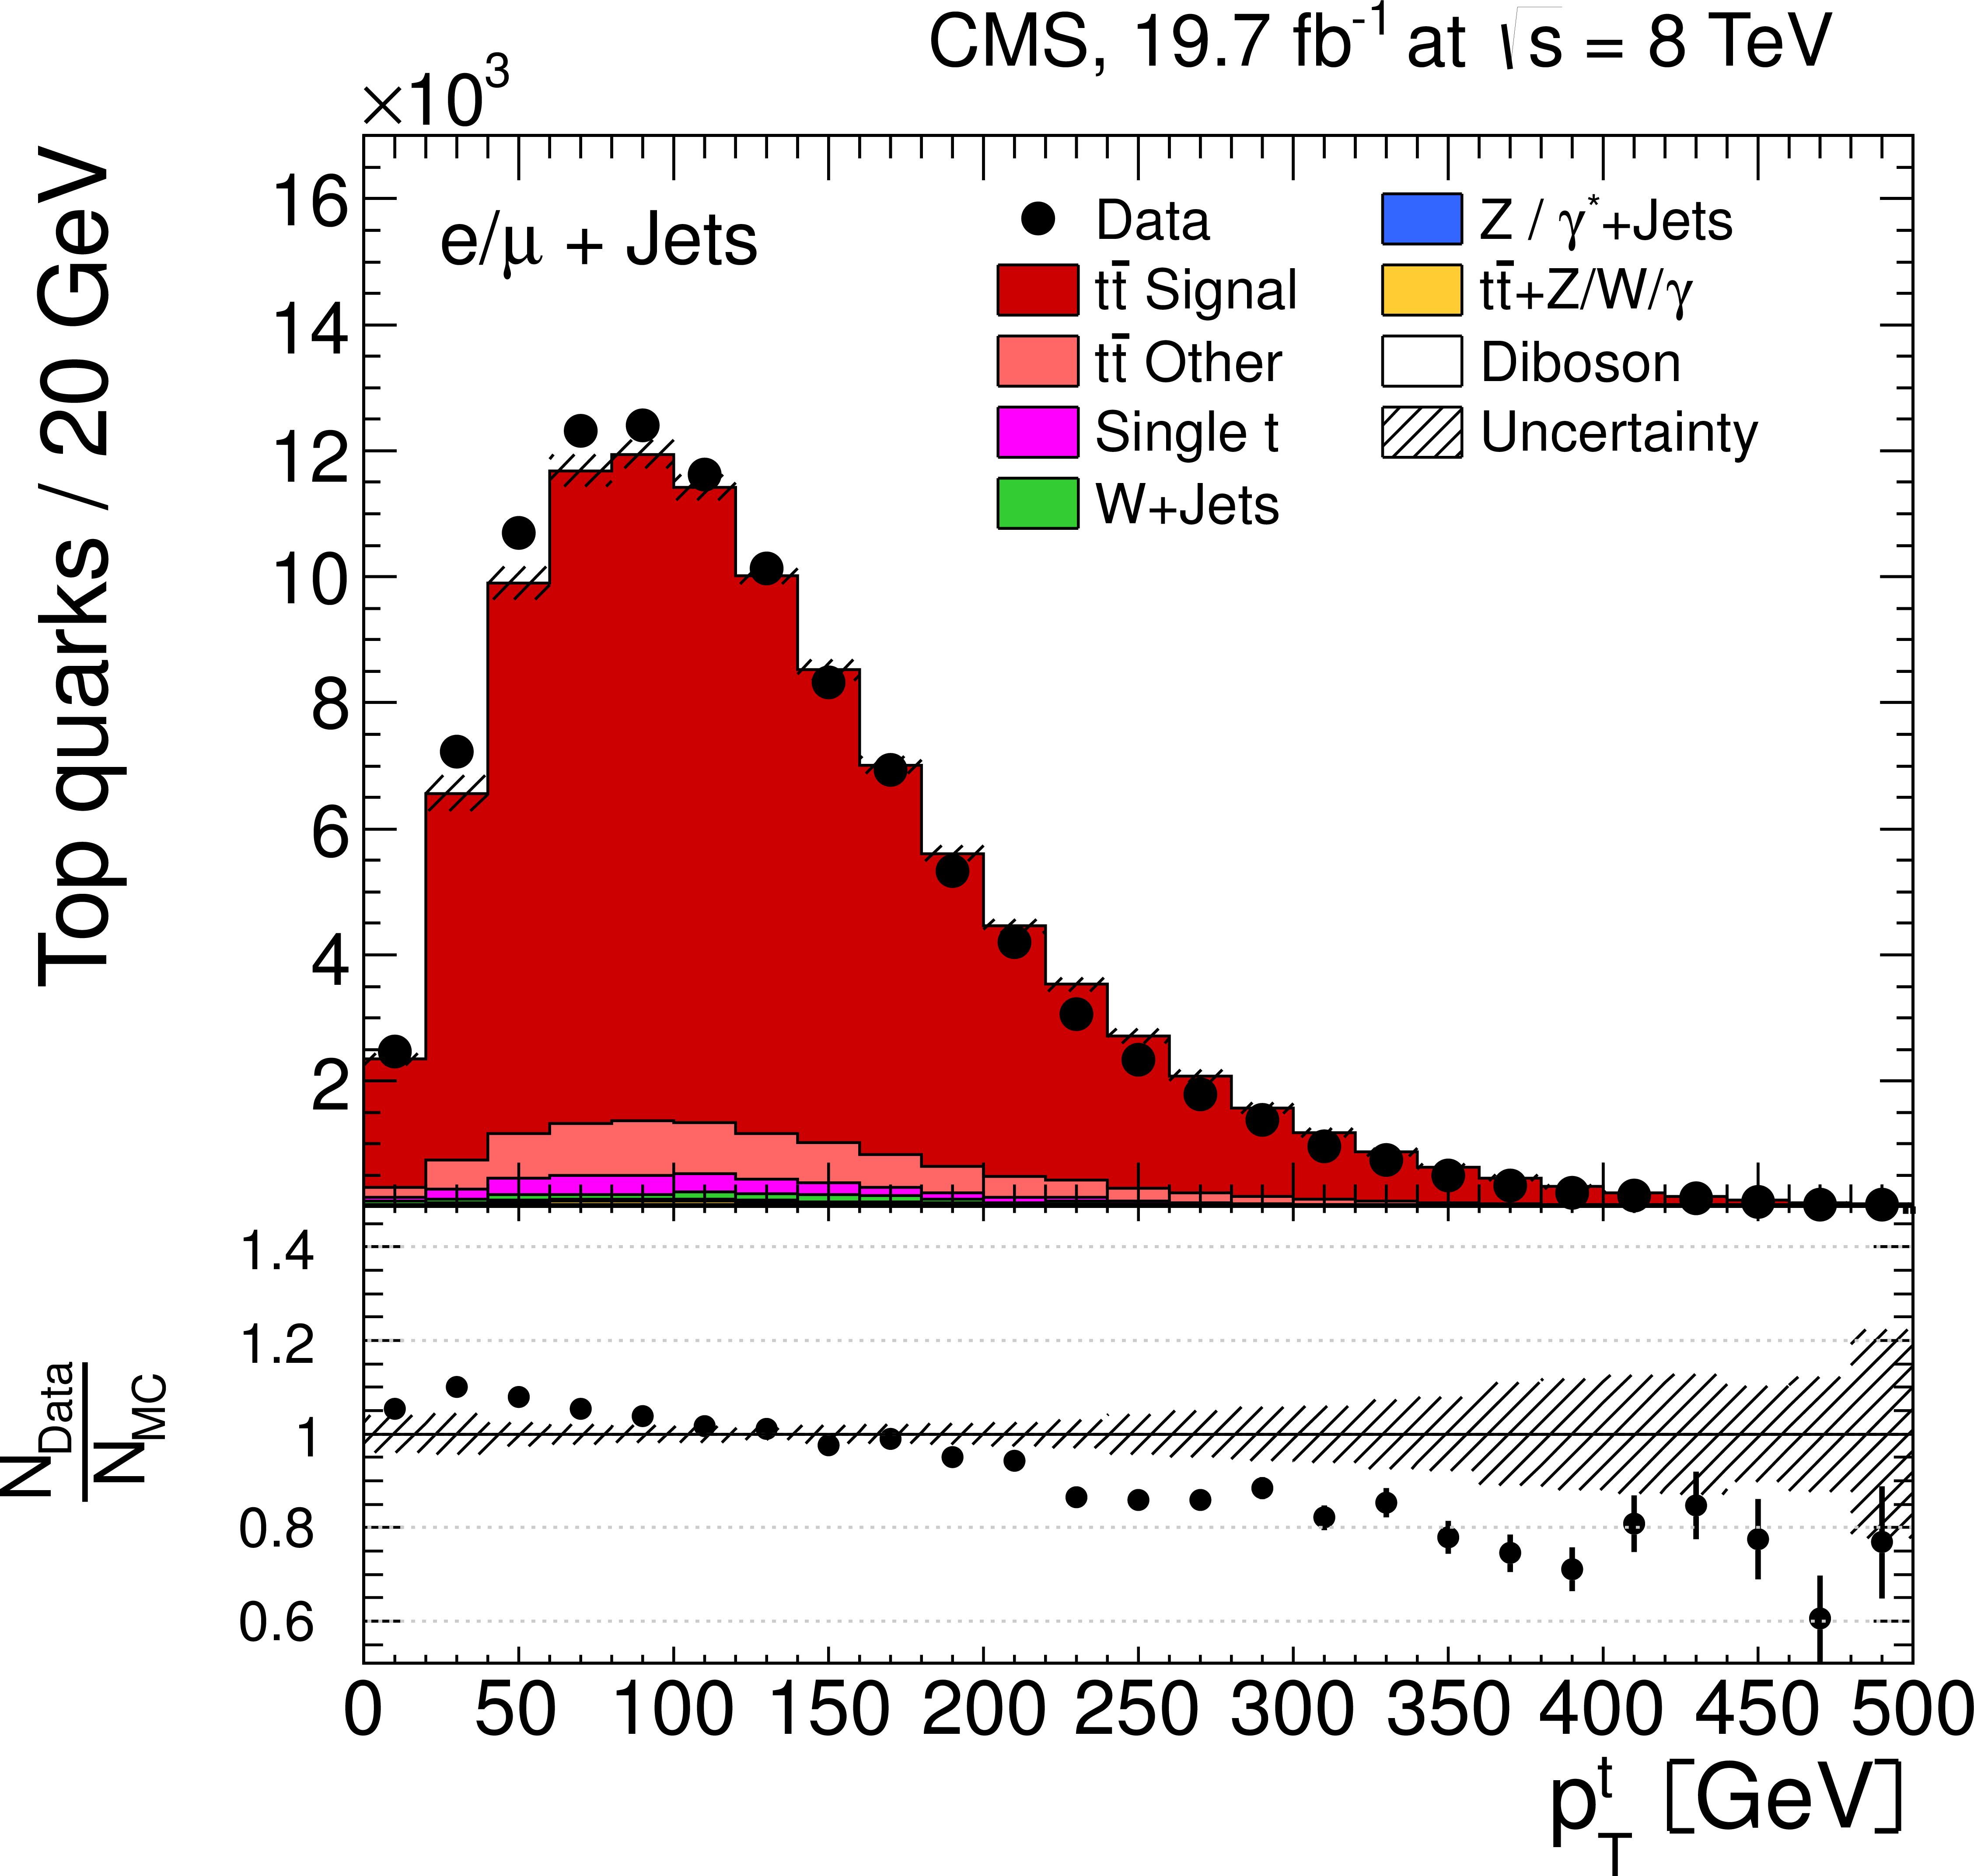
Figure 3-a:
Distribution of top quark or antiquark (a) and $ {\mathrm {t}\overline {\mathrm {t}}} $ (b) quantities as obtained from the kinematic reconstruction in the $ {\ell }$+jets channels. The top row shows the $ {p_{\mathrm {T}}} $, and the bottom row shows the rapidities. The QCD multijet background is negligible and not shown. The hatched regions correspond to the shape uncertainties for the signal and backgrounds. The lower part of each plot shows the ratio of data to the predictions. |

png pdf |
Figure 3-b:
Distribution of top quark or antiquark (a) and $ {\mathrm {t}\overline {\mathrm {t}}} $ (b) quantities as obtained from the kinematic reconstruction in the $ {\ell }$+jets channels. The top row shows the $ {p_{\mathrm {T}}} $, and the bottom row shows the rapidities. The QCD multijet background is negligible and not shown. The hatched regions correspond to the shape uncertainties for the signal and backgrounds. The lower part of each plot shows the ratio of data to the predictions. |
png pdf |
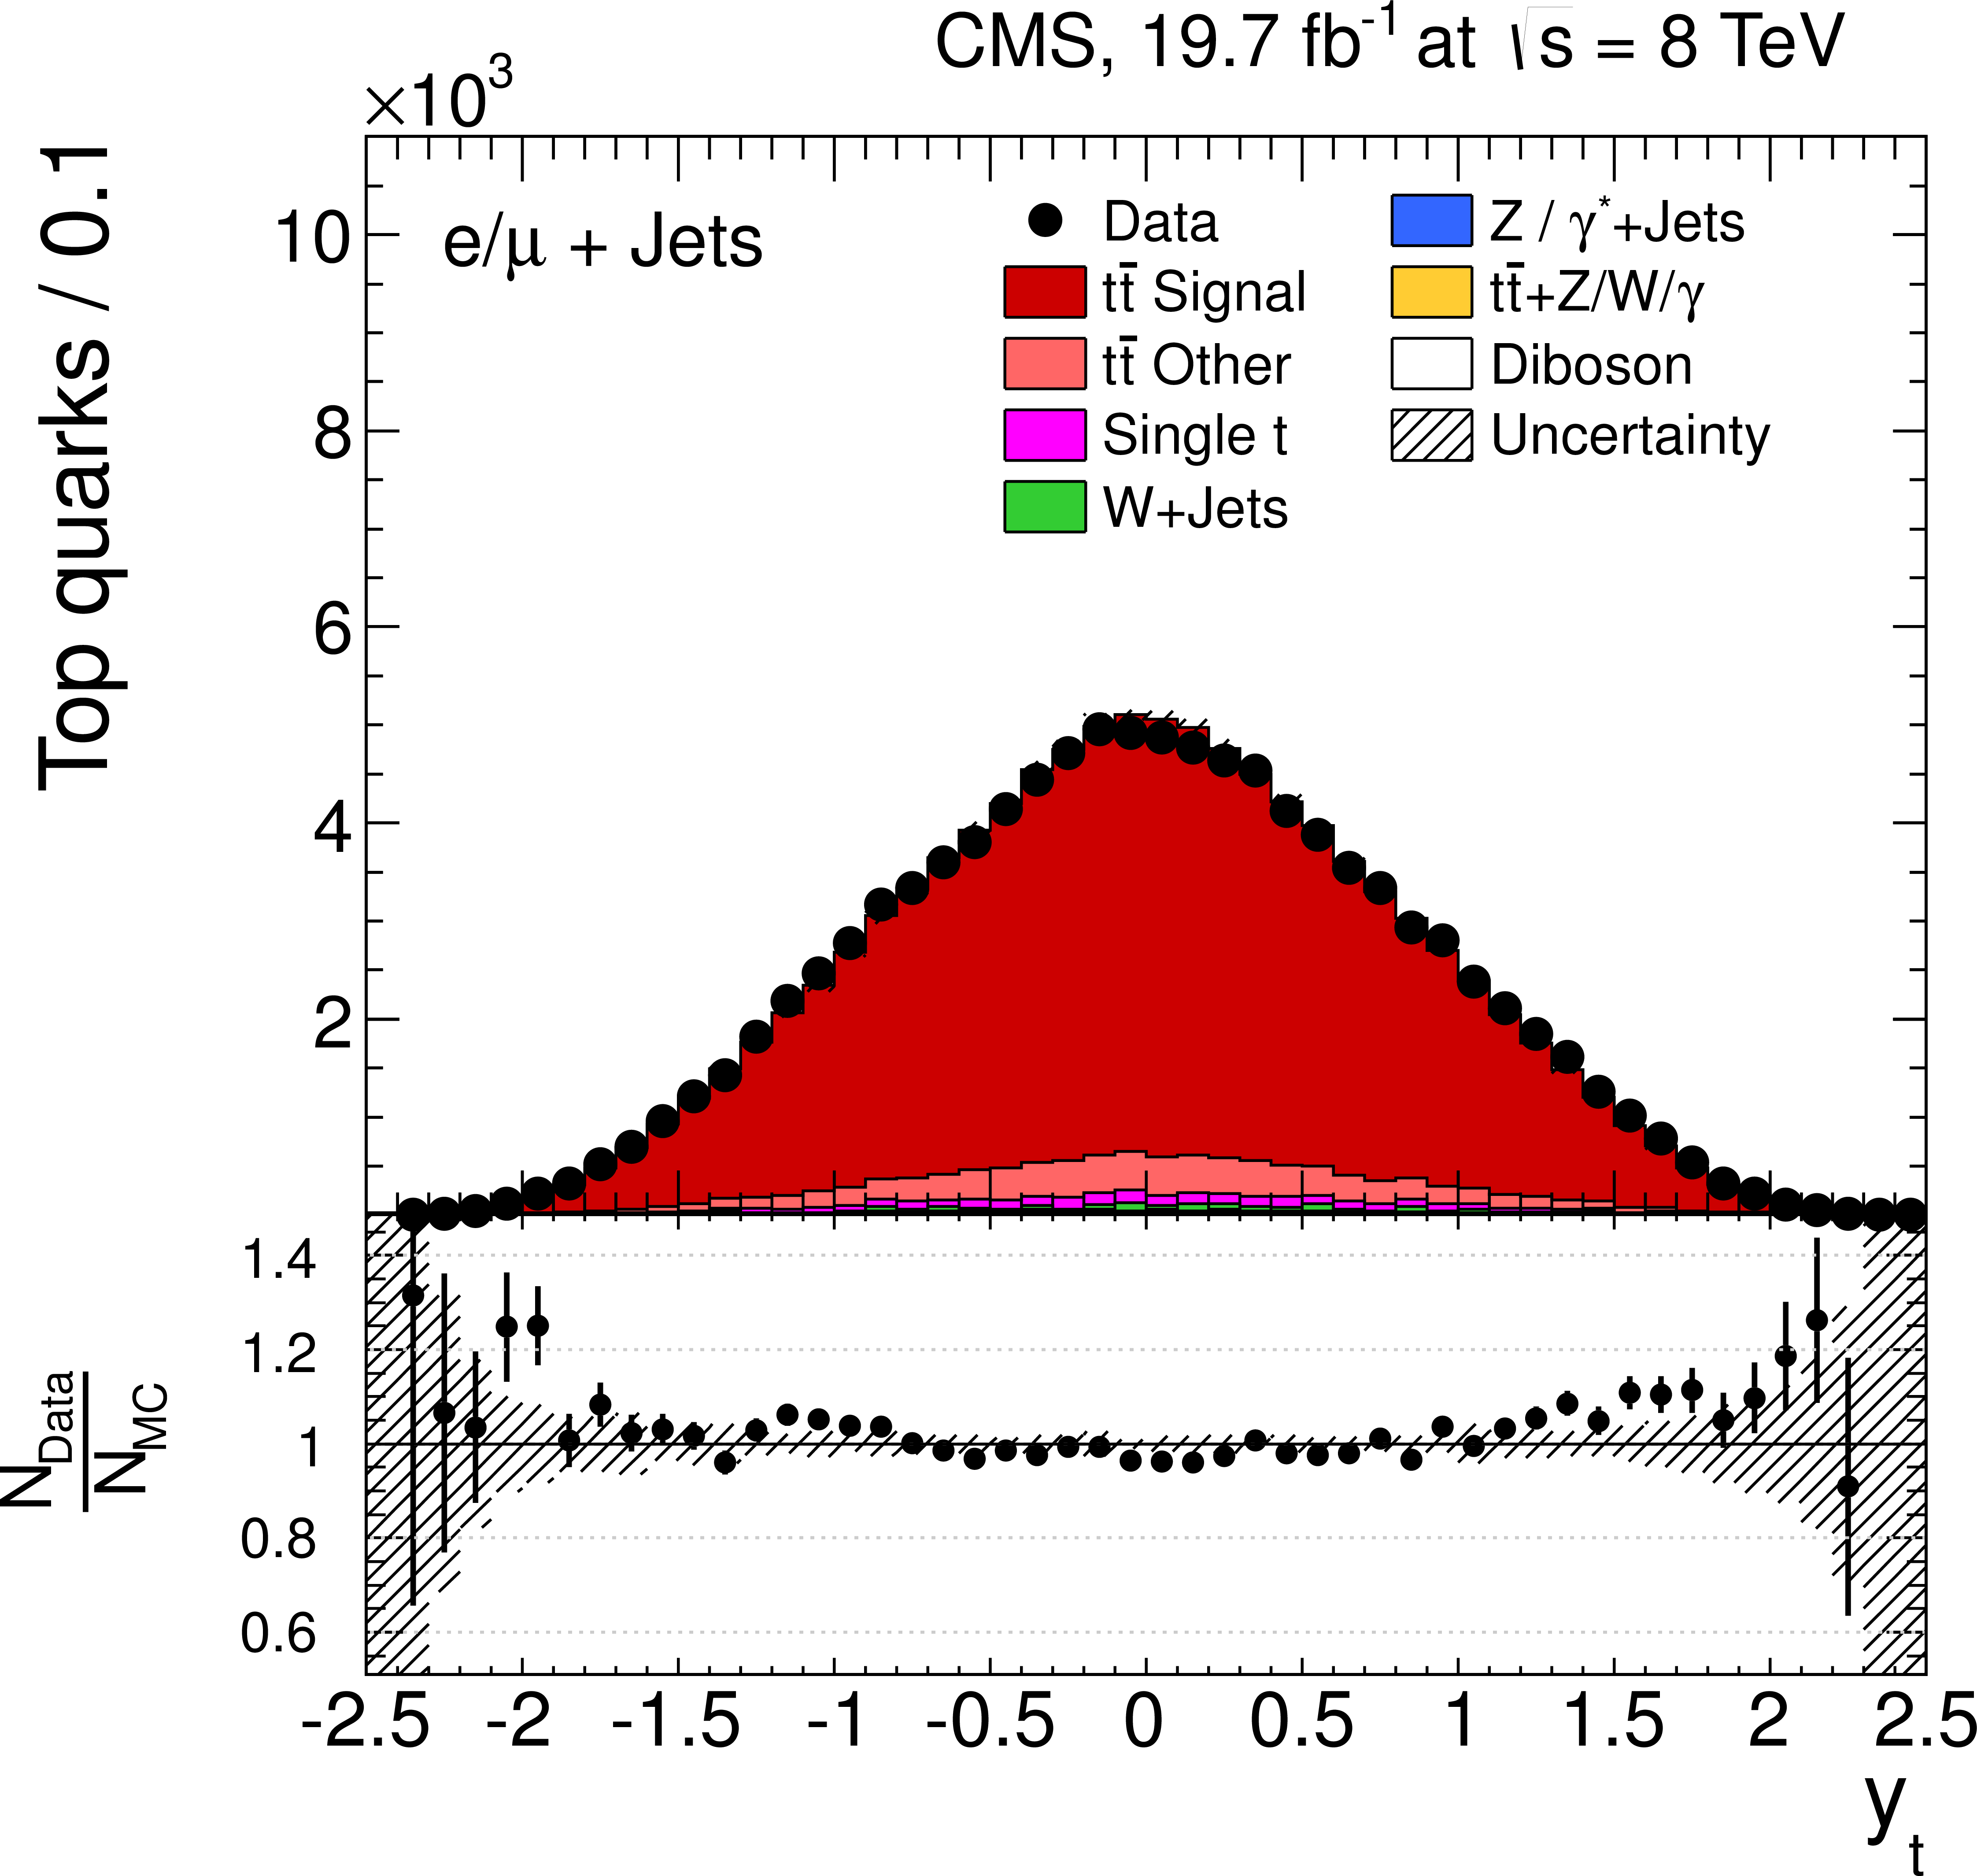
Figure 3-c:
Distribution of top quark or antiquark (a) and $ {\mathrm {t}\overline {\mathrm {t}}} $ (b) quantities as obtained from the kinematic reconstruction in the $ {\ell }$+jets channels. The top row shows the $ {p_{\mathrm {T}}} $, and the bottom row shows the rapidities. The QCD multijet background is negligible and not shown. The hatched regions correspond to the shape uncertainties for the signal and backgrounds. The lower part of each plot shows the ratio of data to the predictions. |

png pdf |
Figure 3-d:
Distribution of top quark or antiquark (a) and $ {\mathrm {t}\overline {\mathrm {t}}} $ (b) quantities as obtained from the kinematic reconstruction in the $ {\ell }$+jets channels. The top row shows the $ {p_{\mathrm {T}}} $, and the bottom row shows the rapidities. The QCD multijet background is negligible and not shown. The hatched regions correspond to the shape uncertainties for the signal and backgrounds. The lower part of each plot shows the ratio of data to the predictions. |
png pdf |
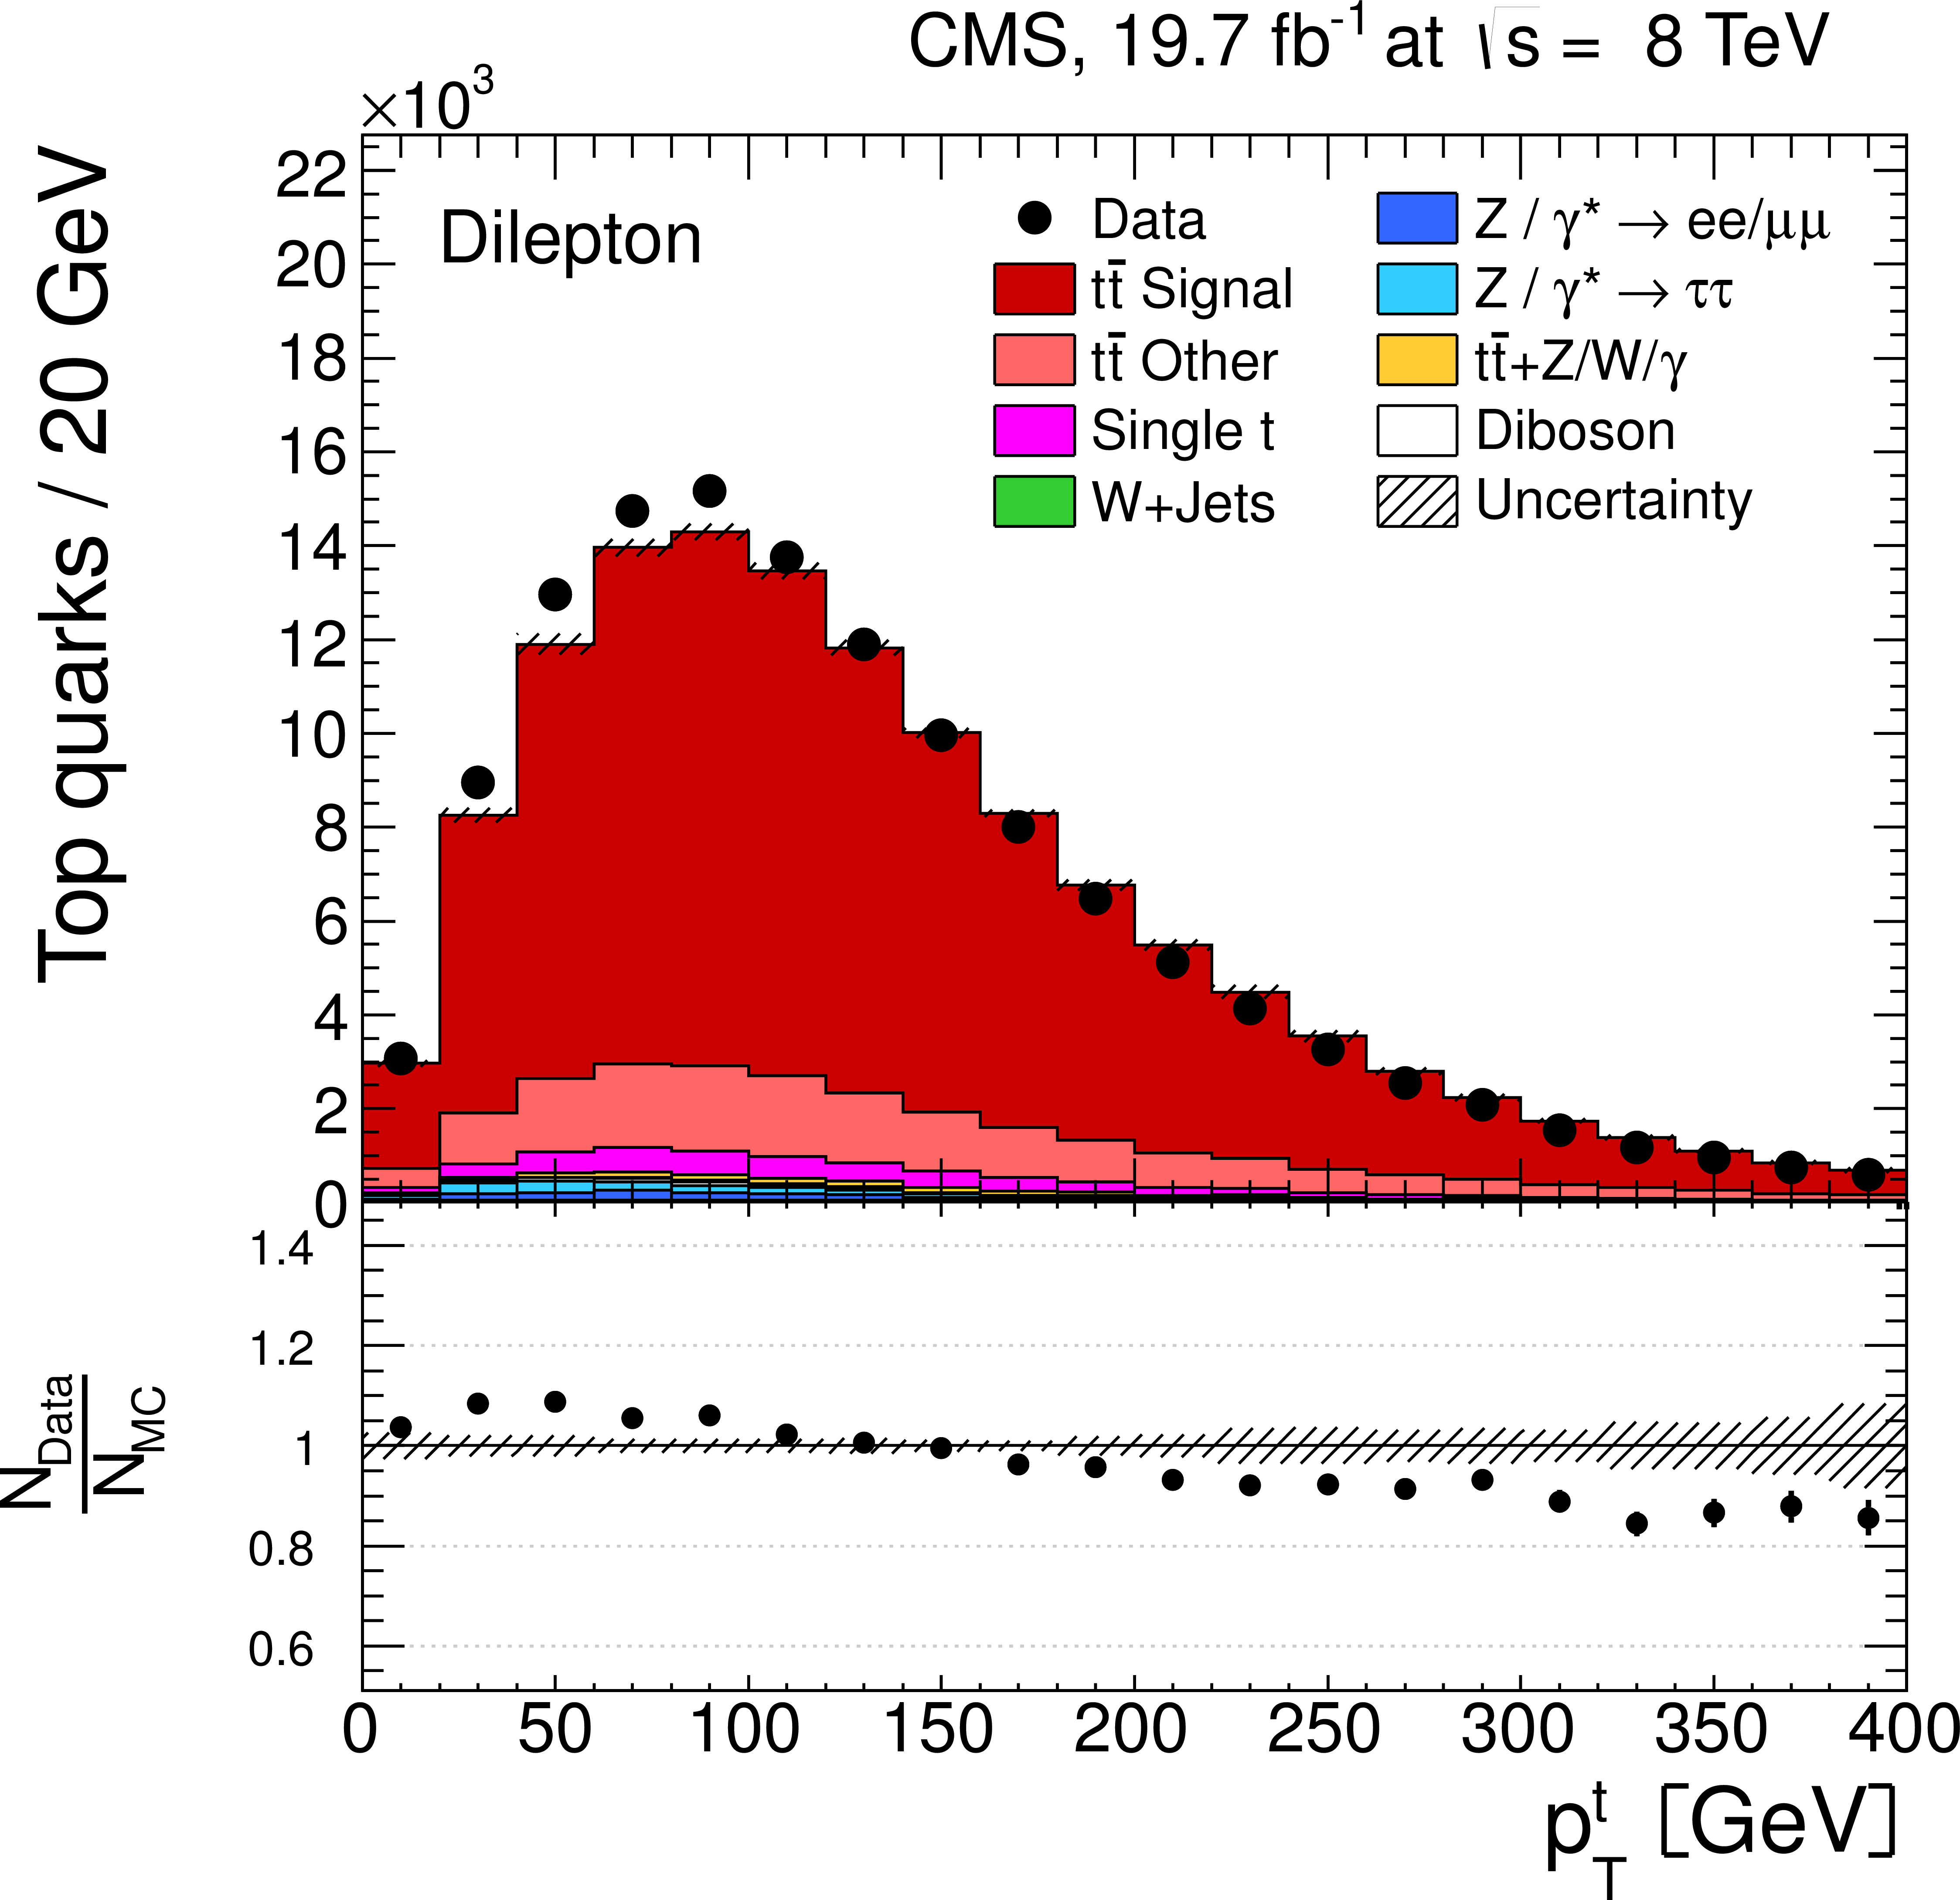
Figure 4-a:
Distribution of top quark or antiquark (a) and $ {\mathrm {t}\overline {\mathrm {t}}} $ (b) quantities as obtained from the kinematic reconstruction in the dilepton channels. The top row shows the $ {p_{\mathrm {T}}} $, and the bottom row shows the rapidities. The QCD multijet background is negligible and not shown. The Z/$\gamma ^{*}$+jets background is determined from data [5 (CMS, EPJC 73 (2013) 2339)-40 (CMS, JHEP 07 (2011) 049)]. The hatched regions correspond to the shape uncertainties for the signal and backgrounds (cf. Section 5, Systematic Uncertainties). The lower part of each plot shows the ratio of data to the predictions. |
png pdf |
Figure 4-b:
Distribution of top quark or antiquark (a) and $ {\mathrm {t}\overline {\mathrm {t}}} $ (b) quantities as obtained from the kinematic reconstruction in the dilepton channels. The top row shows the $ {p_{\mathrm {T}}} $, and the bottom row shows the rapidities. The QCD multijet background is negligible and not shown. The Z/$\gamma ^{*}$+jets background is determined from data [5 (CMS, EPJC 73 (2013) 2339)-40 (CMS, JHEP 07 (2011) 049)]. The hatched regions correspond to the shape uncertainties for the signal and backgrounds (cf. Section 5, Systematic Uncertainties). The lower part of each plot shows the ratio of data to the predictions. |

png pdf |
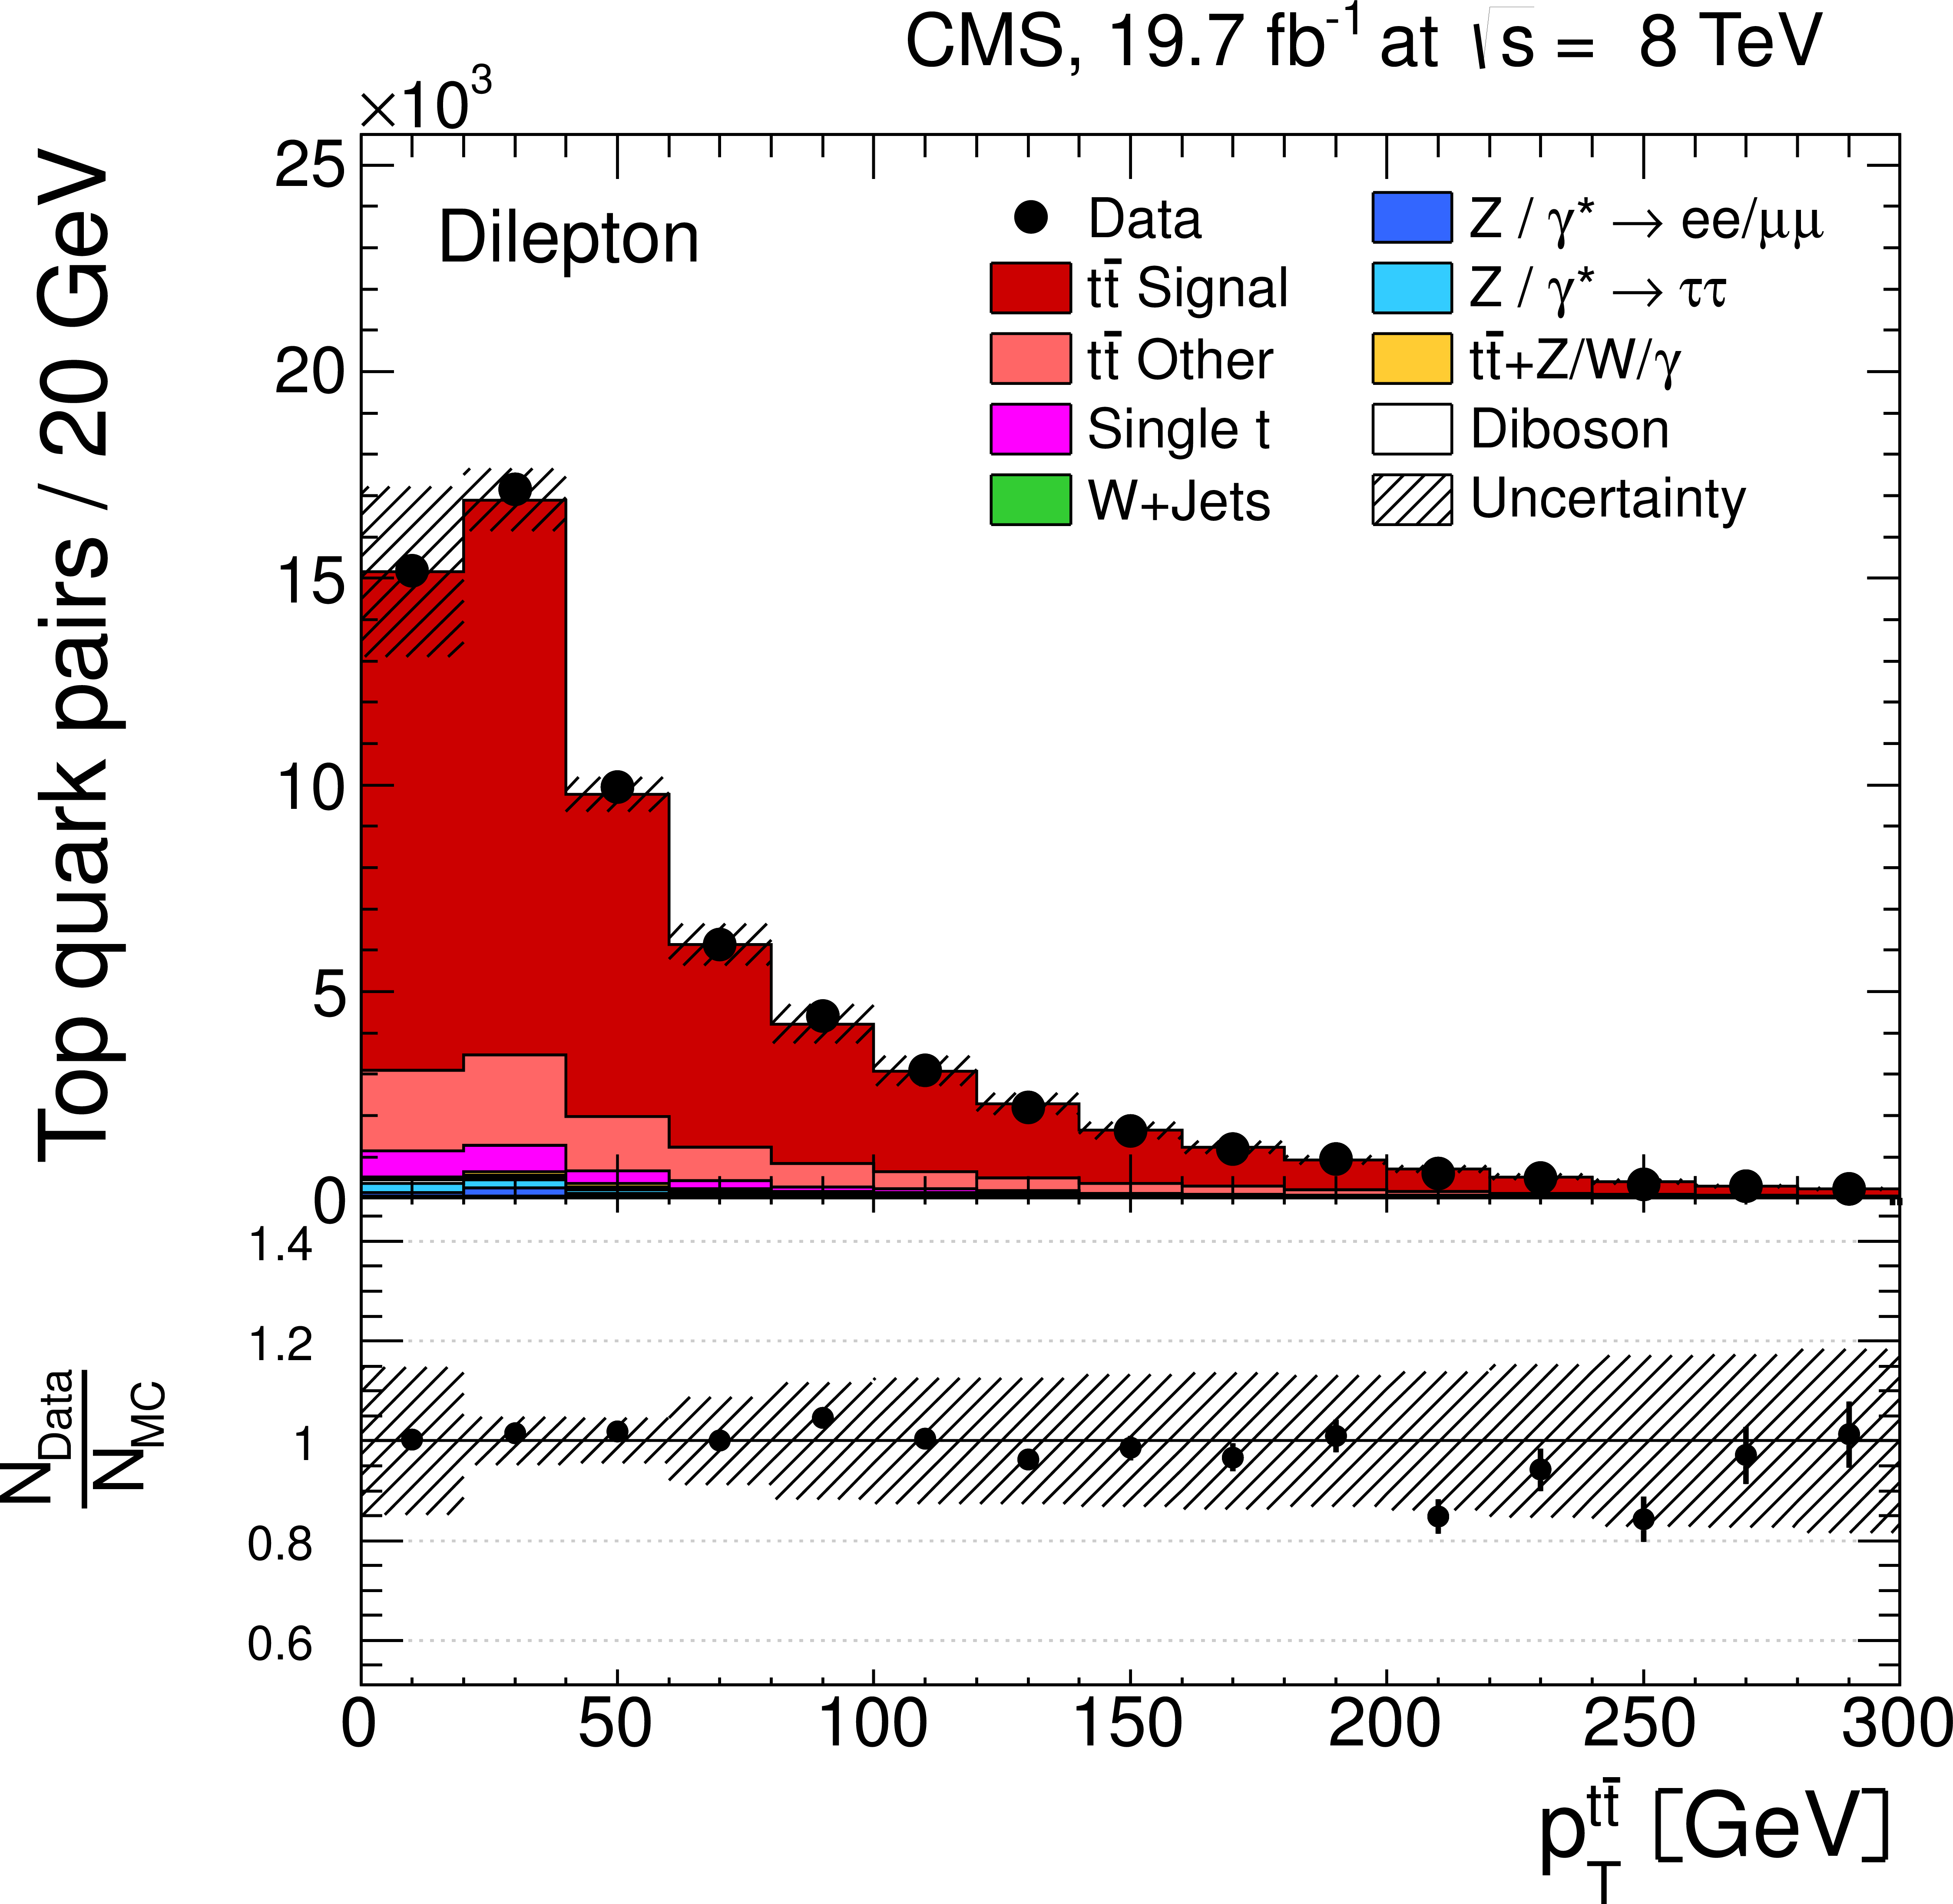
Figure 4-c:
Distribution of top quark or antiquark (a) and $ {\mathrm {t}\overline {\mathrm {t}}} $ (b) quantities as obtained from the kinematic reconstruction in the dilepton channels. The top row shows the $ {p_{\mathrm {T}}} $, and the bottom row shows the rapidities. The QCD multijet background is negligible and not shown. The Z/$\gamma ^{*}$+jets background is determined from data [5 (CMS, EPJC 73 (2013) 2339)-40 (CMS, JHEP 07 (2011) 049)]. The hatched regions correspond to the shape uncertainties for the signal and backgrounds (cf. Section 5, Systematic Uncertainties). The lower part of each plot shows the ratio of data to the predictions. |
png pdf |
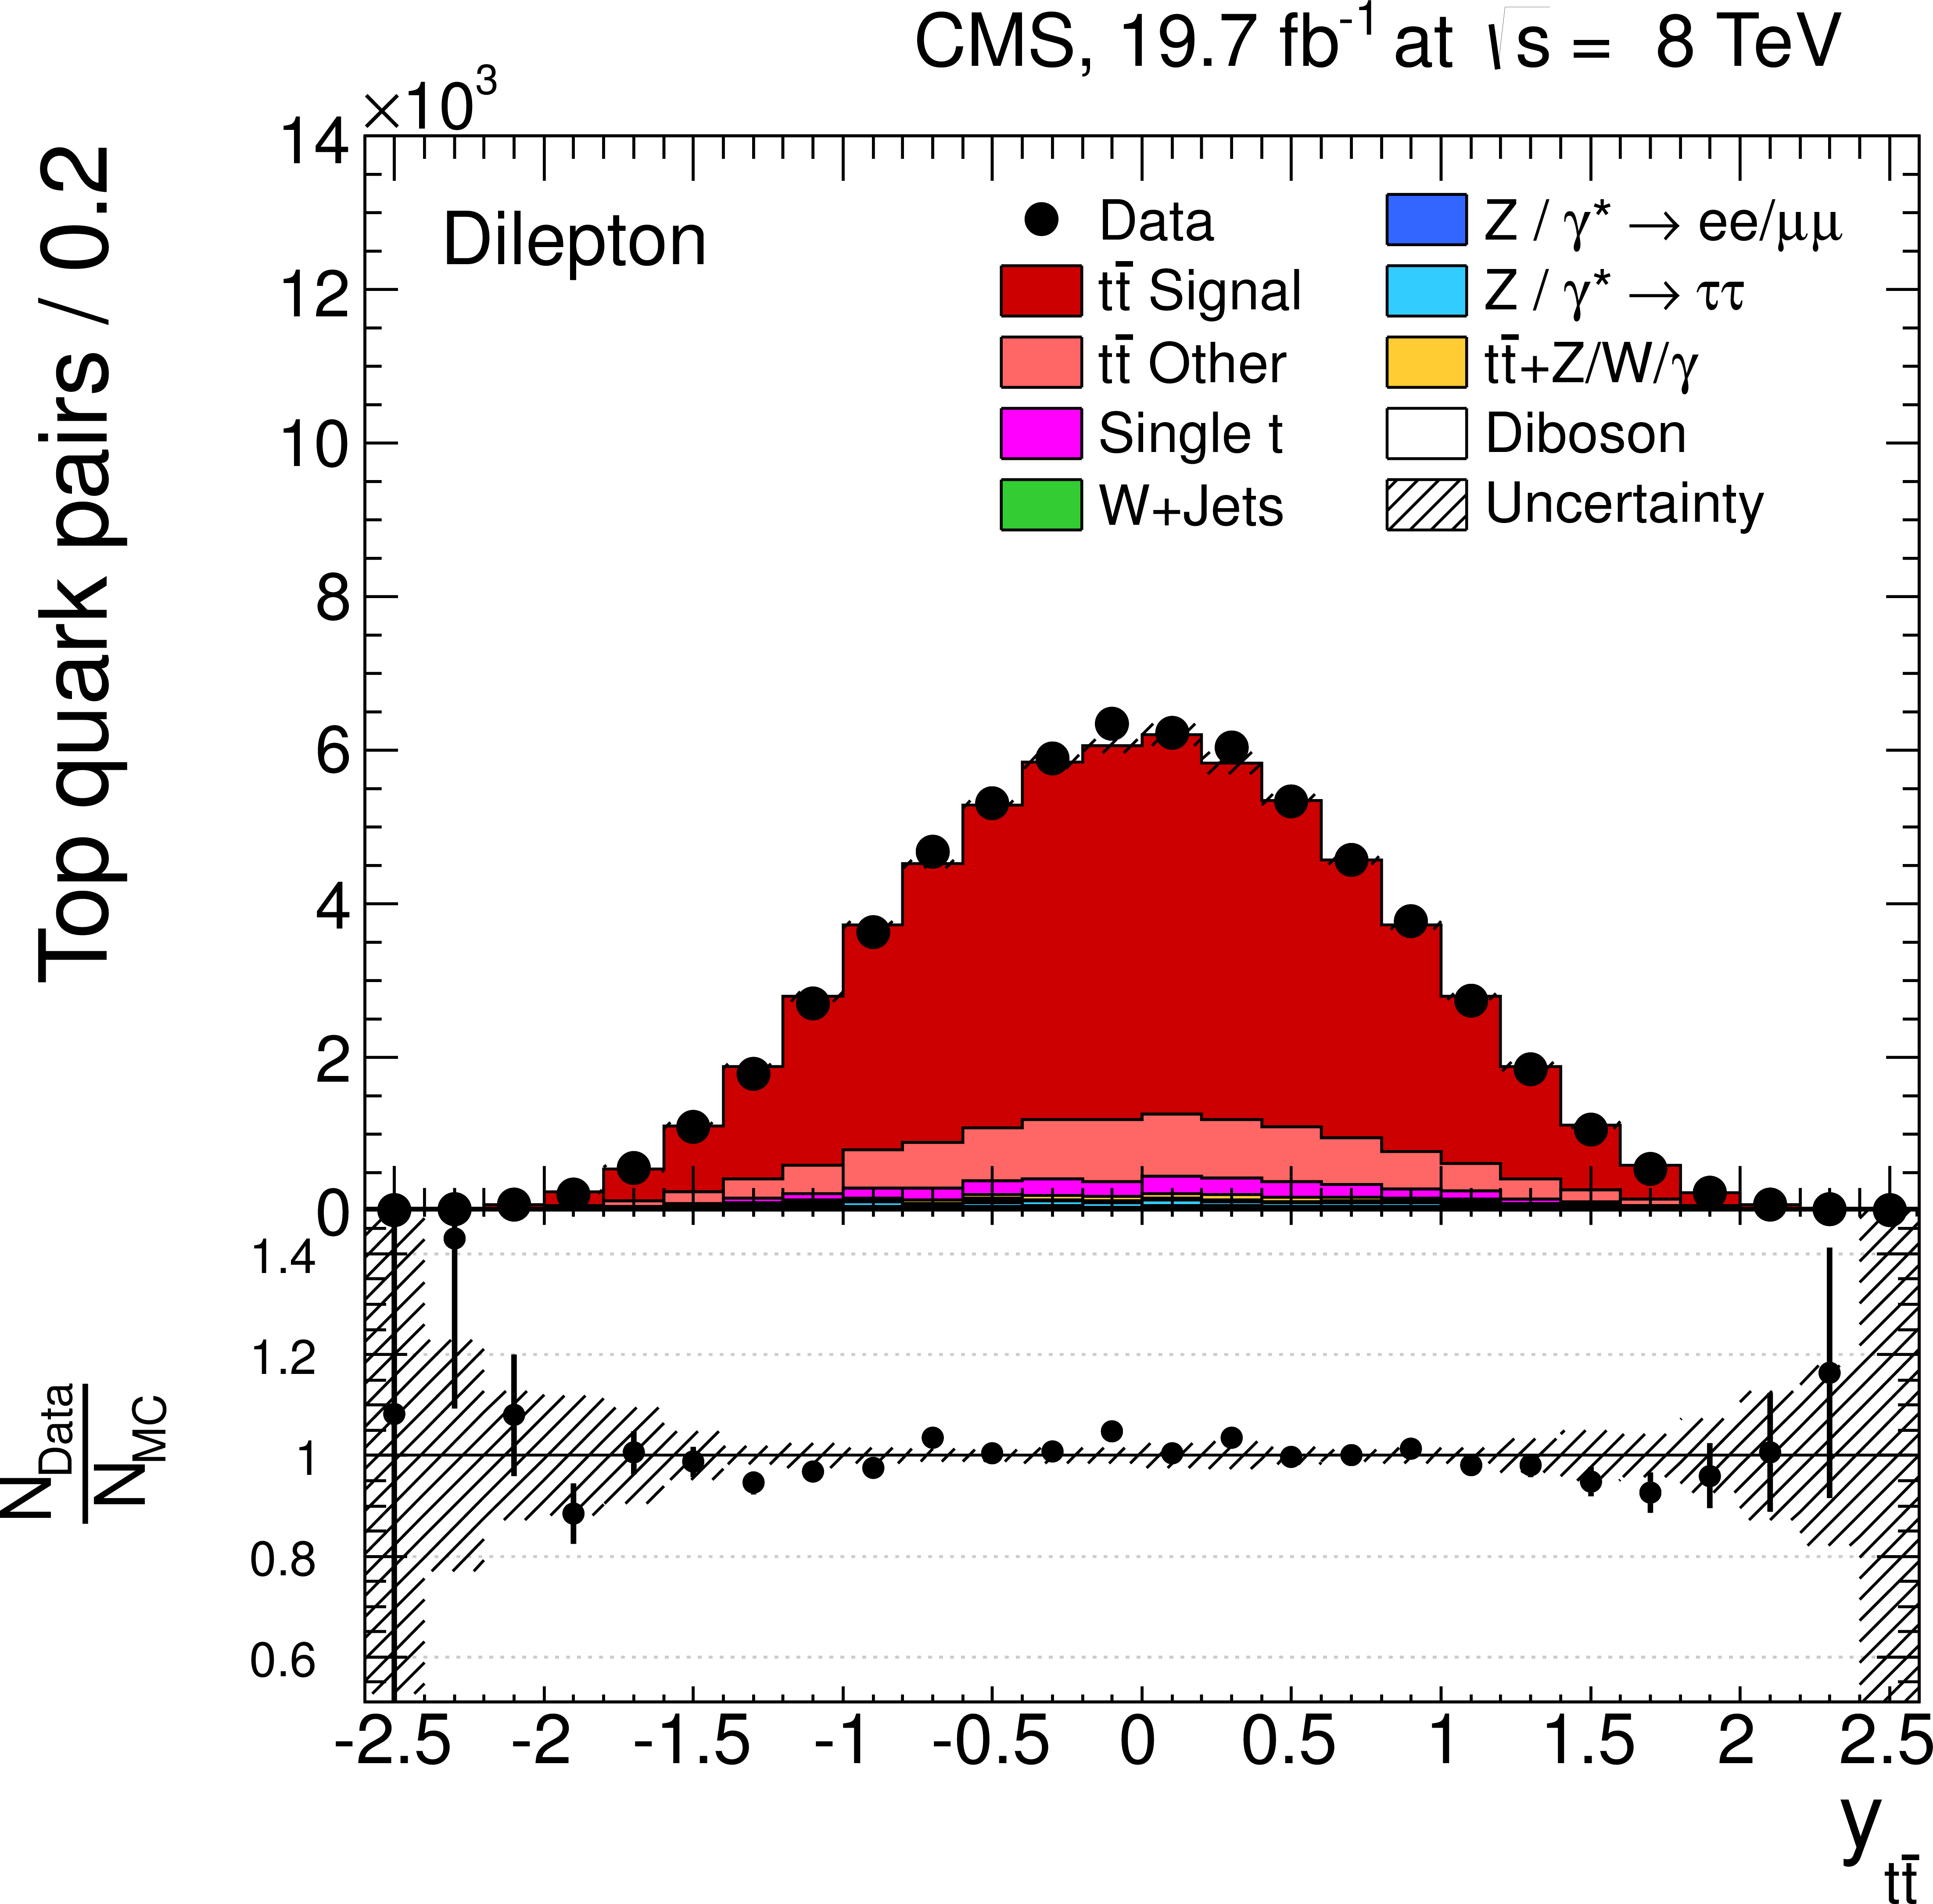
Figure 4-d:
Distribution of top quark or antiquark (a) and $ {\mathrm {t}\overline {\mathrm {t}}} $ (b) quantities as obtained from the kinematic reconstruction in the dilepton channels. The top row shows the $ {p_{\mathrm {T}}} $, and the bottom row shows the rapidities. The QCD multijet background is negligible and not shown. The Z/$\gamma ^{*}$+jets background is determined from data [5 (CMS, EPJC 73 (2013) 2339)-40 (CMS, JHEP 07 (2011) 049)]. The hatched regions correspond to the shape uncertainties for the signal and backgrounds (cf. Section 5, Systematic Uncertainties). The lower part of each plot shows the ratio of data to the predictions. |
png pdf |
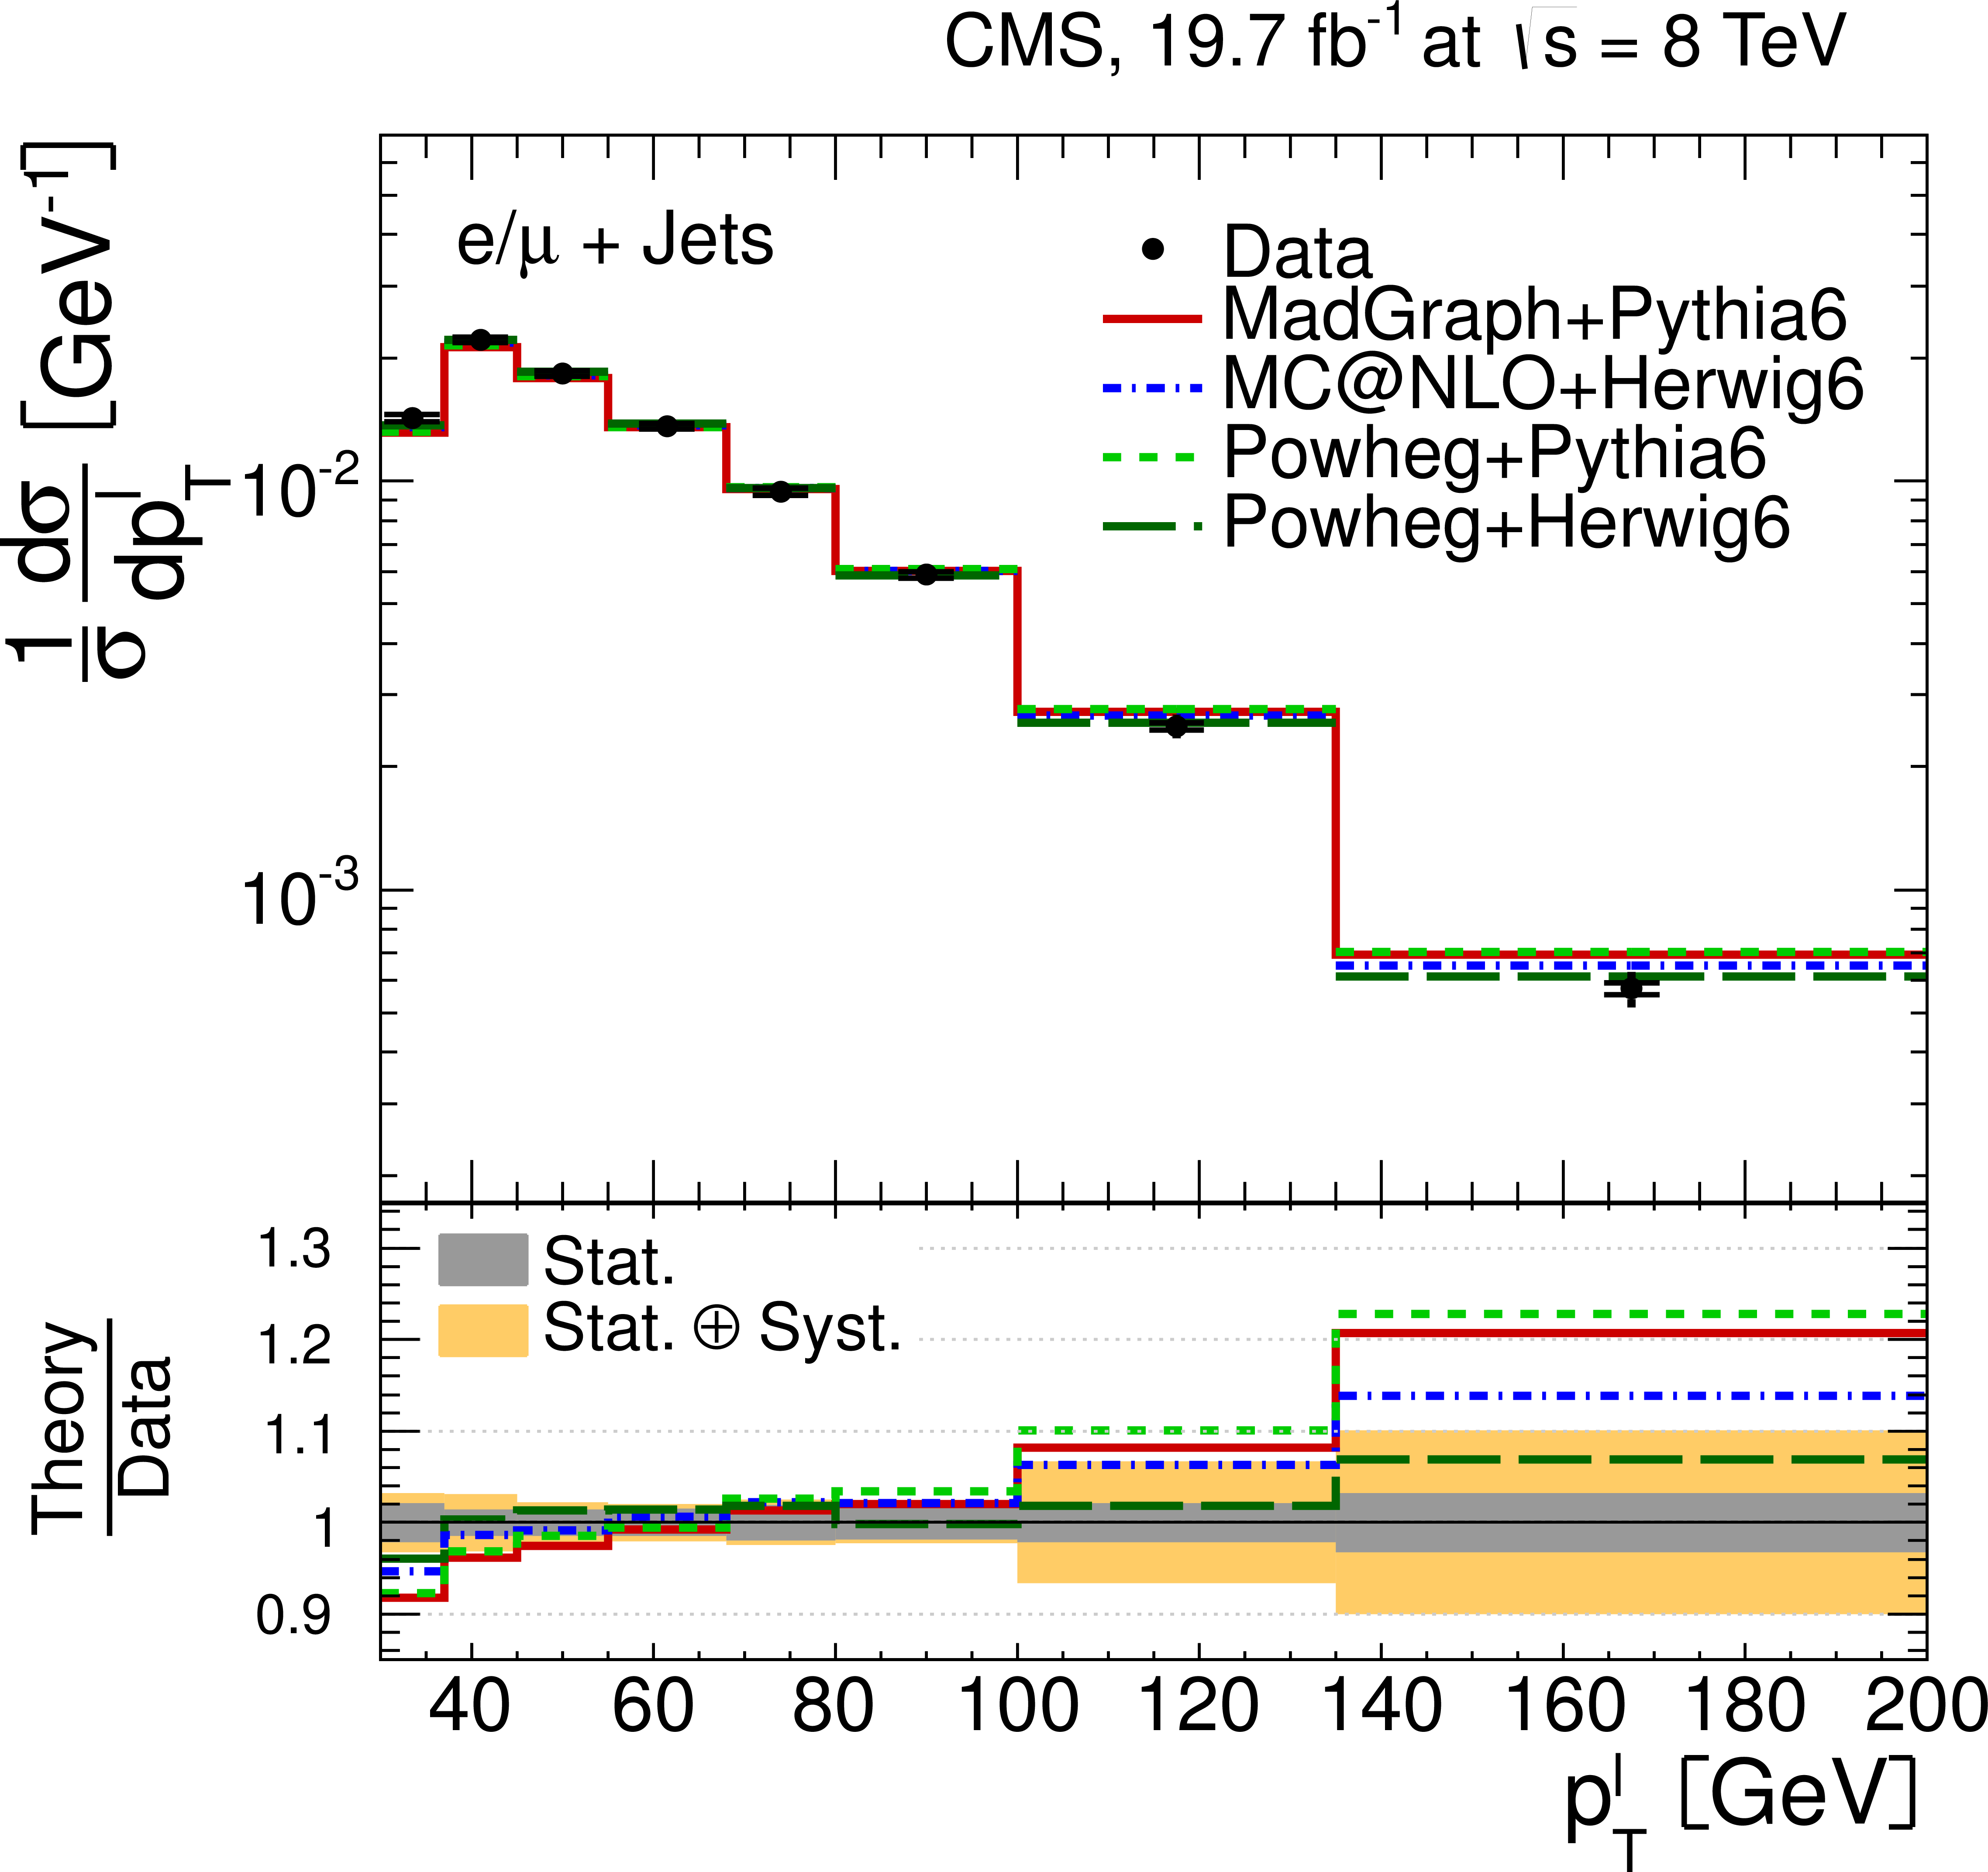
Figure 5-a:
Normalized differential $ {\mathrm {t}\overline {\mathrm {t}}} $ production cross section in the $ {\ell }$+jets channels as a function of the $ {p_{\mathrm {T}}} ^{\ell }$ (a) and $\eta _{\ell }$ (b) of the charged lepton. The data points are placed at the midpoint of the bins. The inner (outer) error bars indicate the statistical (combined statistical and systematic) uncertainties. The measurements are compared to predictions from MadGraph+PYTHIA6, POWHEG+PYTHIA6, POWHEG+HERWIG6 and MCatNLO+HERWIG6. The lower part of each plot shows the ratio of the predictions to data. |
png pdf |
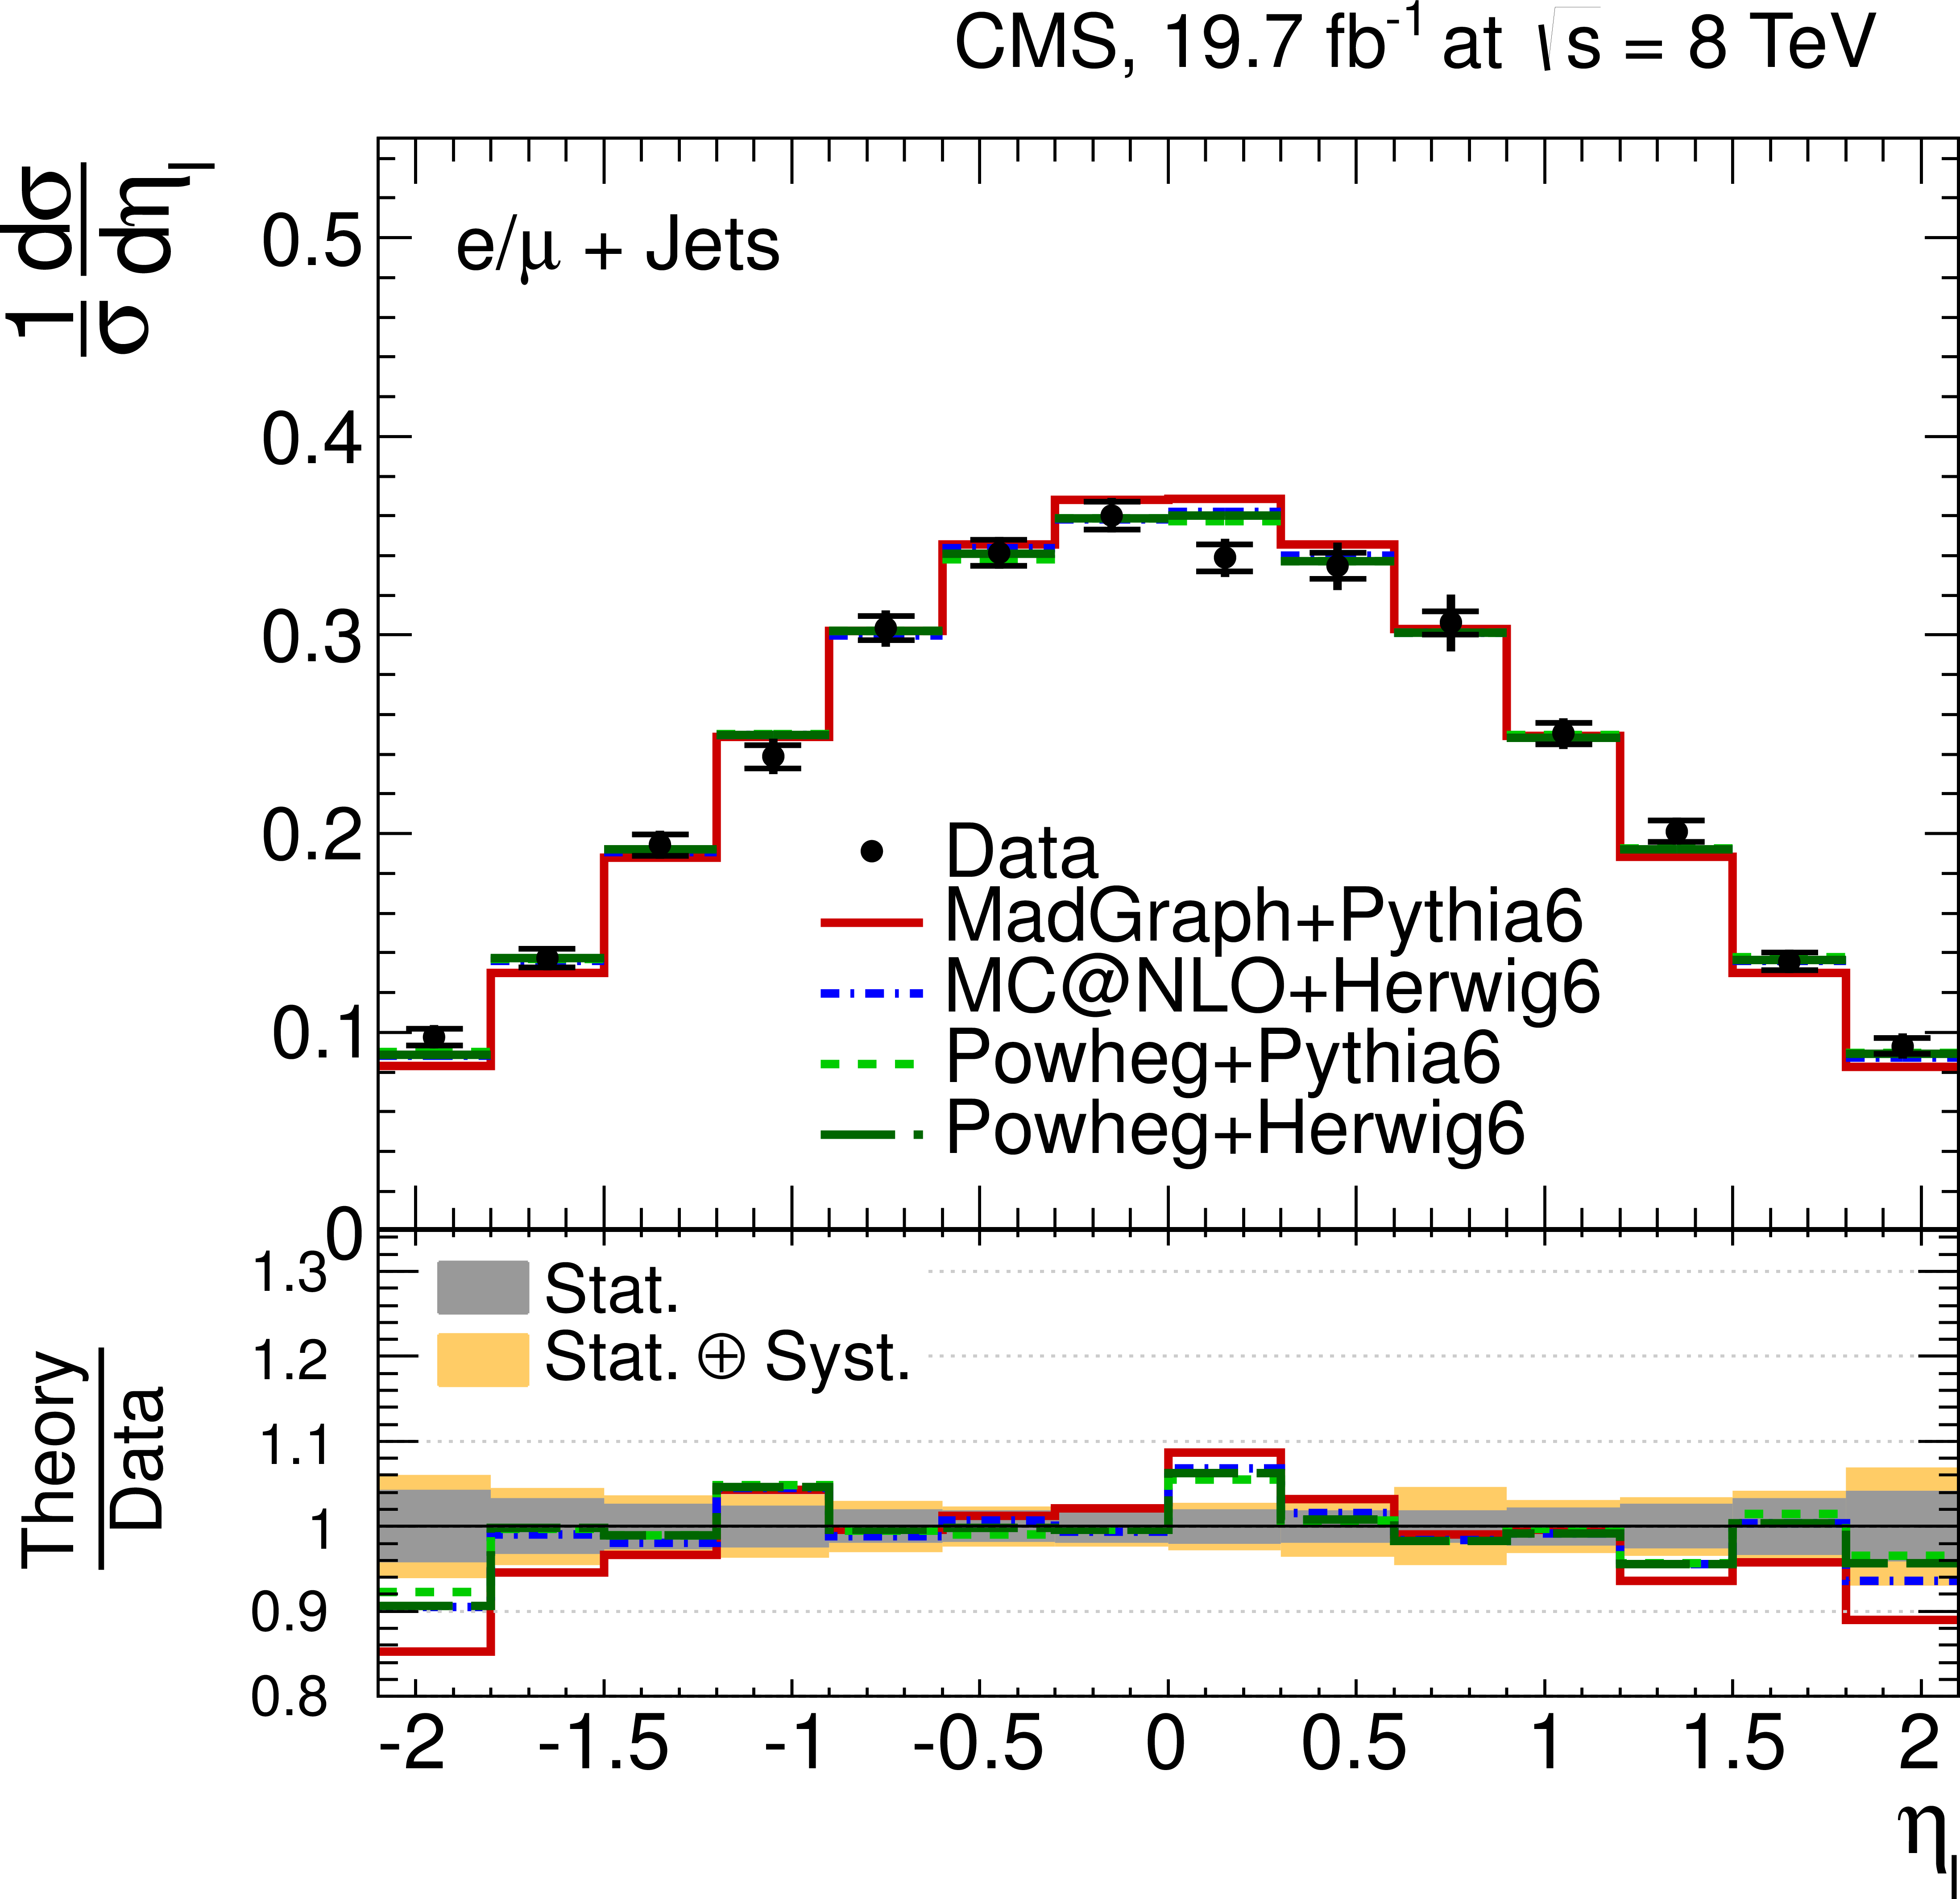
Figure 5-b:
Normalized differential $ {\mathrm {t}\overline {\mathrm {t}}} $ production cross section in the $ {\ell }$+jets channels as a function of the $ {p_{\mathrm {T}}} ^{\ell }$ (a) and $\eta _{\ell }$ (b) of the charged lepton. The data points are placed at the midpoint of the bins. The inner (outer) error bars indicate the statistical (combined statistical and systematic) uncertainties. The measurements are compared to predictions from MadGraph+PYTHIA6, POWHEG+PYTHIA6, POWHEG+HERWIG6 and MCatNLO+HERWIG6. The lower part of each plot shows the ratio of the predictions to data. |

png pdf |
Figure 6-a:
Normalized differential $ {\mathrm {t}\overline {\mathrm {t}}}$ production cross section in the $ {\ell }$+jets channels as a function of the $ {p_{\mathrm {T}}} ^{ {\mathrm {b}} }$ (a) and $\eta _{ {\mathrm {b}} }$ (b) of the b jets, and the $ {p_{\mathrm {T}}} ^{ { {\mathrm {b}} {\overline {\mathrm {b}}}} }$ (c) and $m_{ { {\mathrm {b}} {\overline {\mathrm {b}}}} }$ (d) of the b jet pair. The superscript `b' refers to both b and $ {\overline {\mathrm {b}}} $ jets. The data points are placed at the midpoint of the bins. The inner (outer) error bars indicate the statistical (combined statistical and systematic) uncertainties. The measurements are compared to predictions from MadGraph+PYTHIA6, POWHEG+PYTHIA6, POWHEG+HERWIG6 and MCatNLO+HERWIG6. The lower part of each plot shows the ratio of the predictions to data. |

png pdf |
Figure 6-b:
Normalized differential $ {\mathrm {t}\overline {\mathrm {t}}}$ production cross section in the $ {\ell }$+jets channels as a function of the $ {p_{\mathrm {T}}} ^{ {\mathrm {b}} }$ (a) and $\eta _{ {\mathrm {b}} }$ (b) of the b jets, and the $ {p_{\mathrm {T}}} ^{ { {\mathrm {b}} {\overline {\mathrm {b}}}} }$ (c) and $m_{ { {\mathrm {b}} {\overline {\mathrm {b}}}} }$ (d) of the b jet pair. The superscript `b' refers to both b and $ {\overline {\mathrm {b}}} $ jets. The data points are placed at the midpoint of the bins. The inner (outer) error bars indicate the statistical (combined statistical and systematic) uncertainties. The measurements are compared to predictions from MadGraph+PYTHIA6, POWHEG+PYTHIA6, POWHEG+HERWIG6 and MCatNLO+HERWIG6. The lower part of each plot shows the ratio of the predictions to data. |
png pdf |
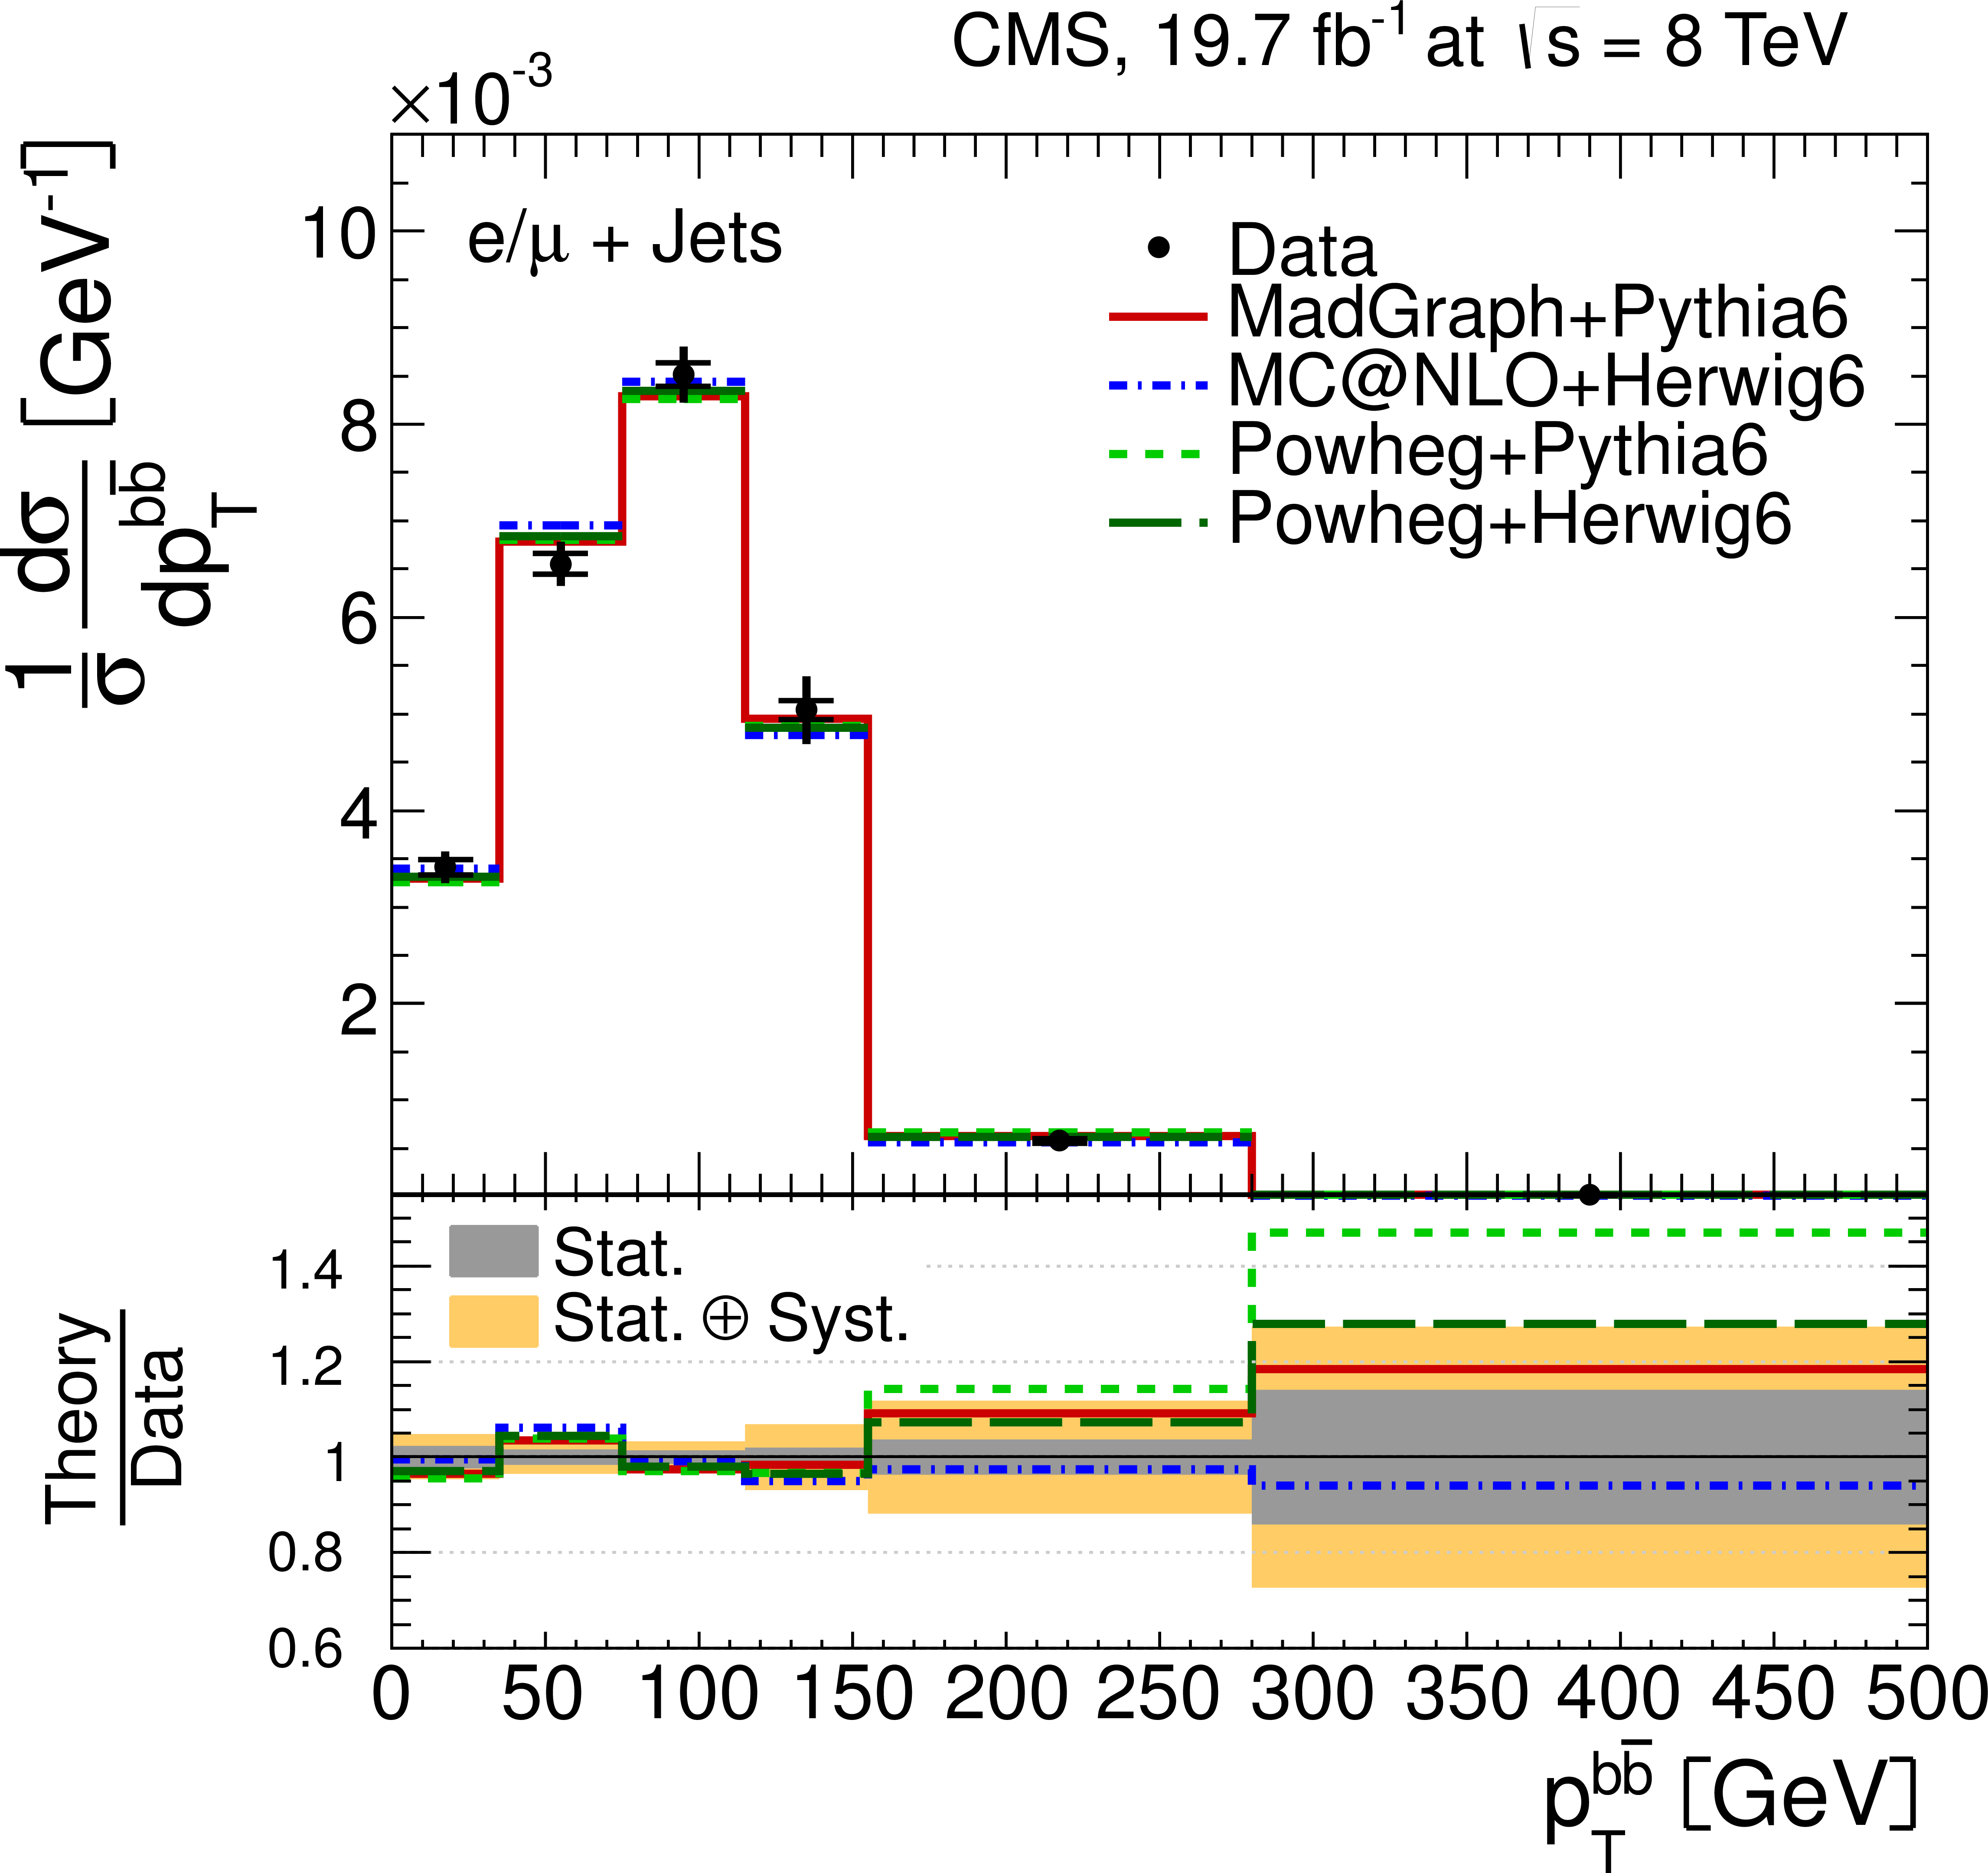
Figure 6-c:
Normalized differential $ {\mathrm {t}\overline {\mathrm {t}}}$ production cross section in the $ {\ell }$+jets channels as a function of the $ {p_{\mathrm {T}}} ^{ {\mathrm {b}} }$ (a) and $\eta _{ {\mathrm {b}} }$ (b) of the b jets, and the $ {p_{\mathrm {T}}} ^{ { {\mathrm {b}} {\overline {\mathrm {b}}}} }$ (c) and $m_{ { {\mathrm {b}} {\overline {\mathrm {b}}}} }$ (d) of the b jet pair. The superscript `b' refers to both b and $ {\overline {\mathrm {b}}} $ jets. The data points are placed at the midpoint of the bins. The inner (outer) error bars indicate the statistical (combined statistical and systematic) uncertainties. The measurements are compared to predictions from MadGraph+PYTHIA6, POWHEG+PYTHIA6, POWHEG+HERWIG6 and MCatNLO+HERWIG6. The lower part of each plot shows the ratio of the predictions to data. |
png pdf |
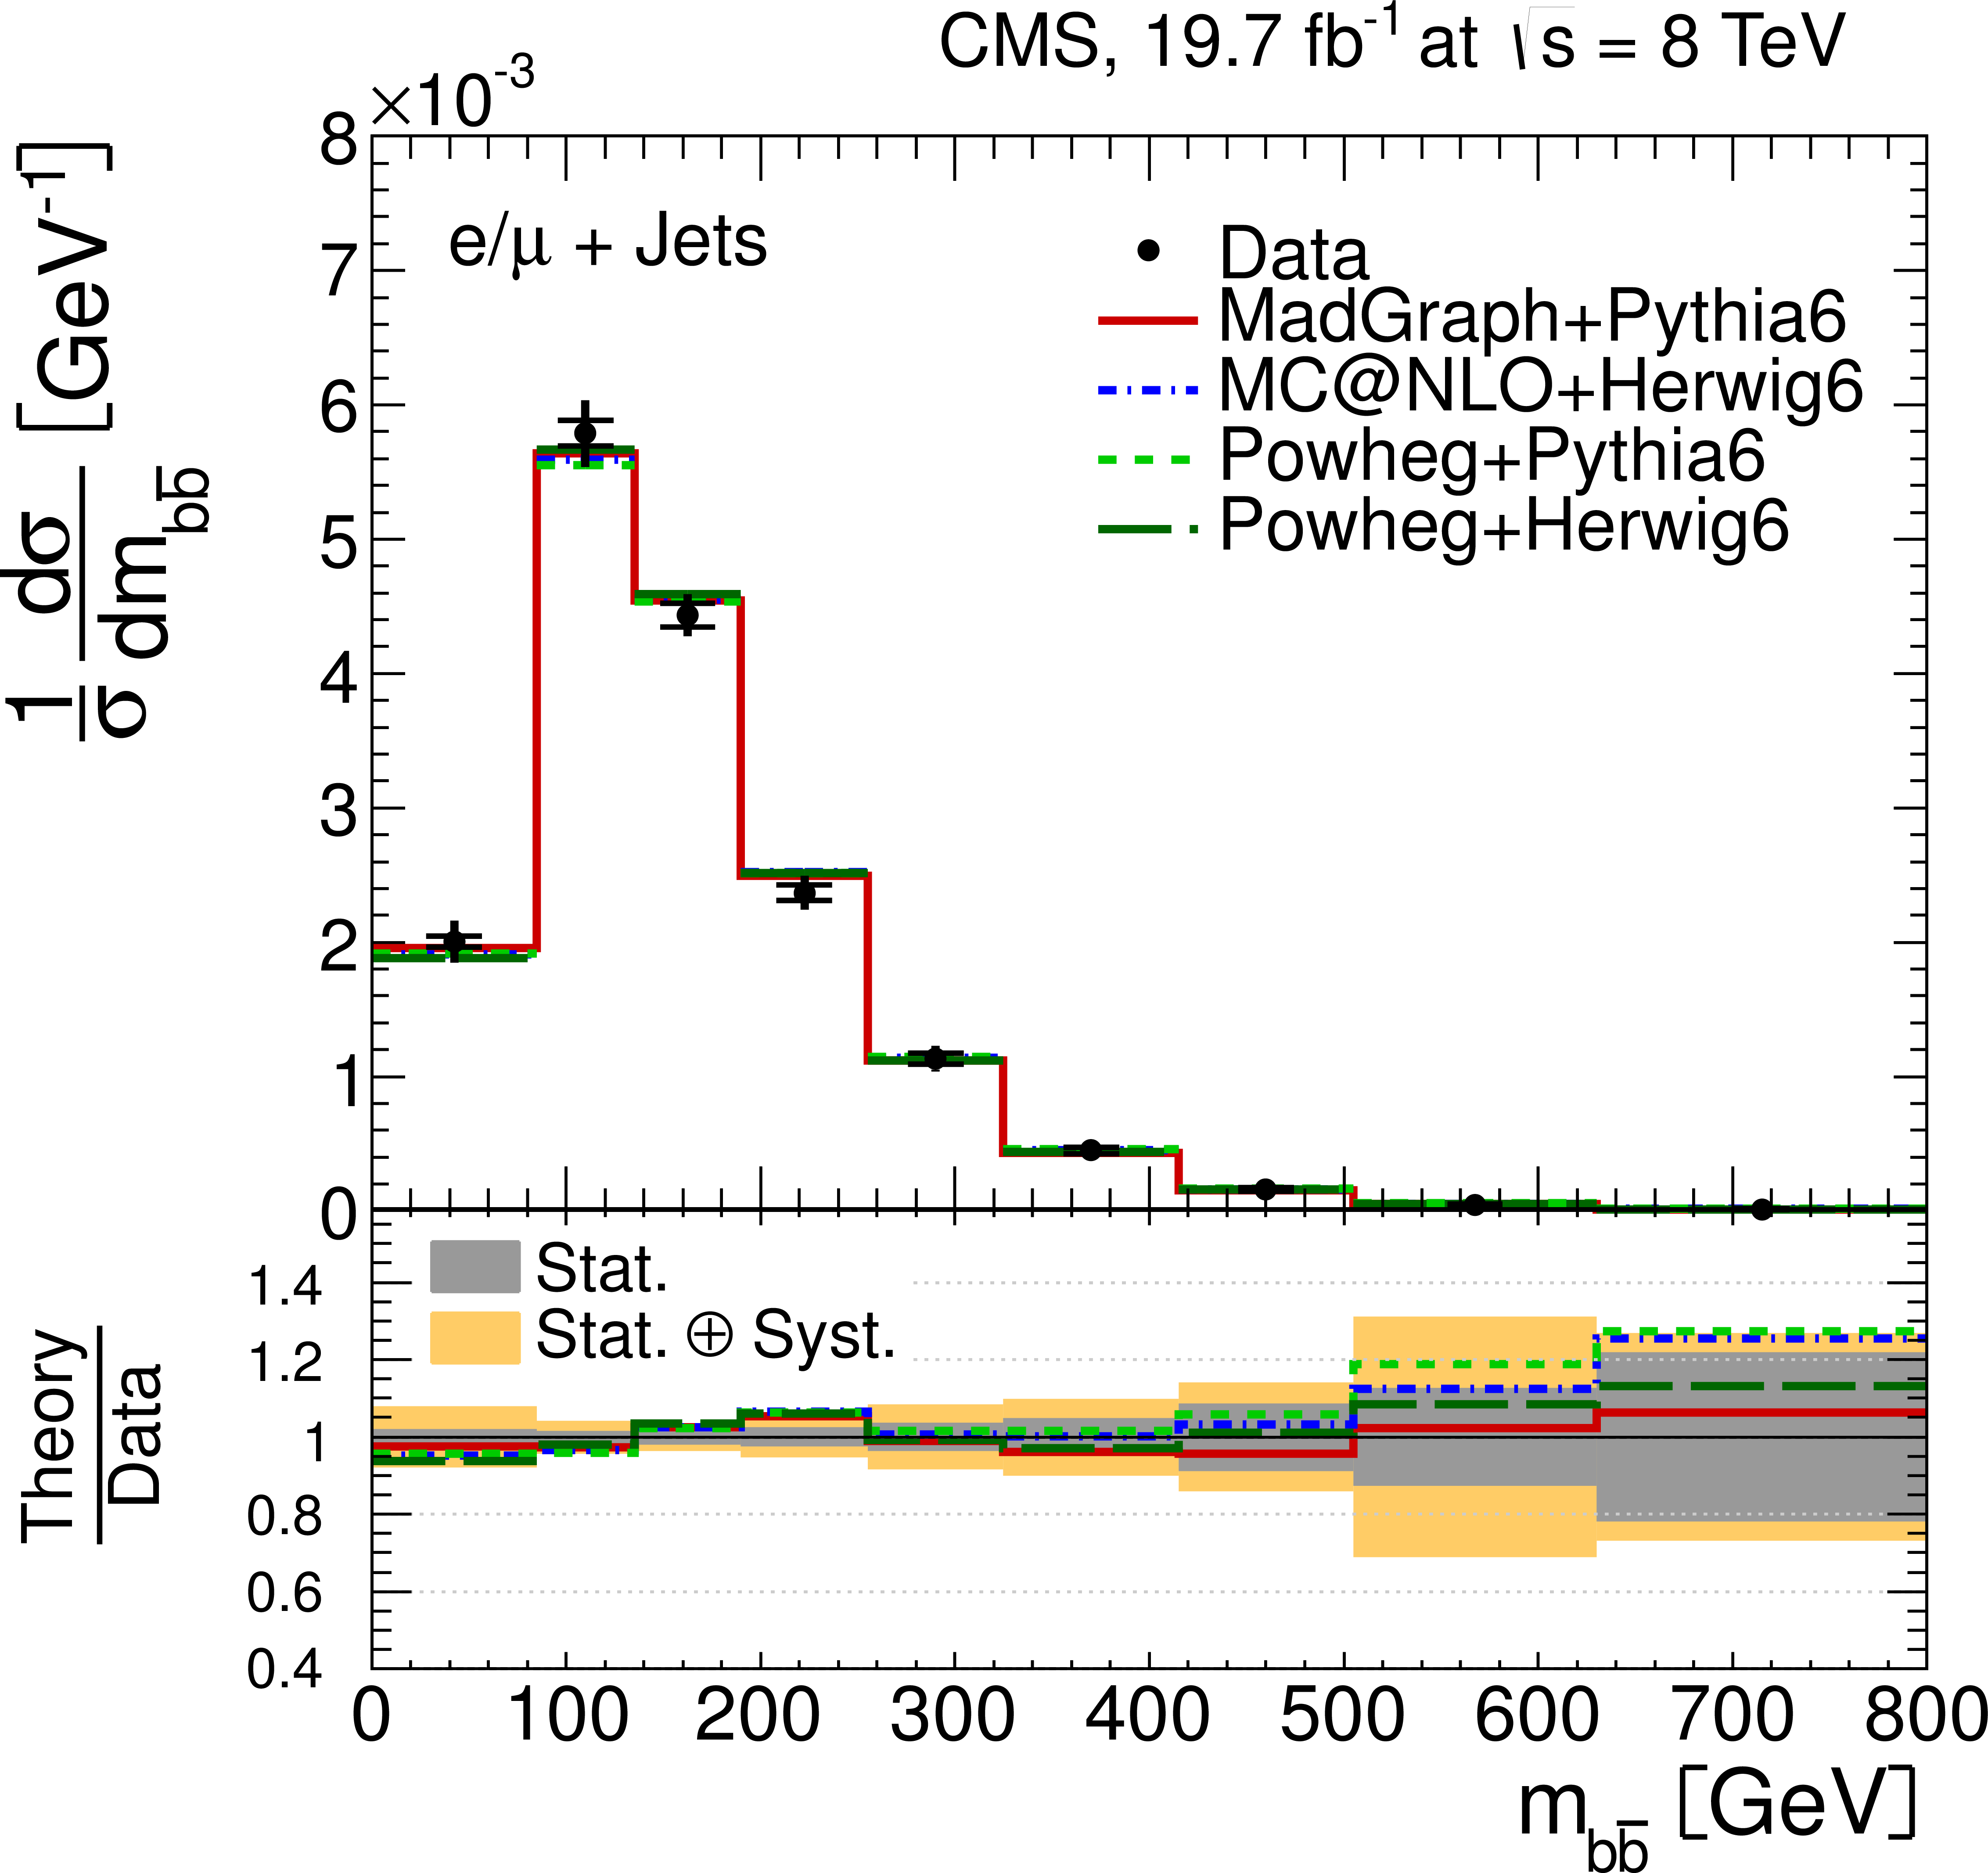
Figure 6-d:
Normalized differential $ {\mathrm {t}\overline {\mathrm {t}}}$ production cross section in the $ {\ell }$+jets channels as a function of the $ {p_{\mathrm {T}}} ^{ {\mathrm {b}} }$ (a) and $\eta _{ {\mathrm {b}} }$ (b) of the b jets, and the $ {p_{\mathrm {T}}} ^{ { {\mathrm {b}} {\overline {\mathrm {b}}}} }$ (c) and $m_{ { {\mathrm {b}} {\overline {\mathrm {b}}}} }$ (d) of the b jet pair. The superscript `b' refers to both b and $ {\overline {\mathrm {b}}} $ jets. The data points are placed at the midpoint of the bins. The inner (outer) error bars indicate the statistical (combined statistical and systematic) uncertainties. The measurements are compared to predictions from MadGraph+PYTHIA6, POWHEG+PYTHIA6, POWHEG+HERWIG6 and MCatNLO+HERWIG6. The lower part of each plot shows the ratio of the predictions to data. |
png pdf |
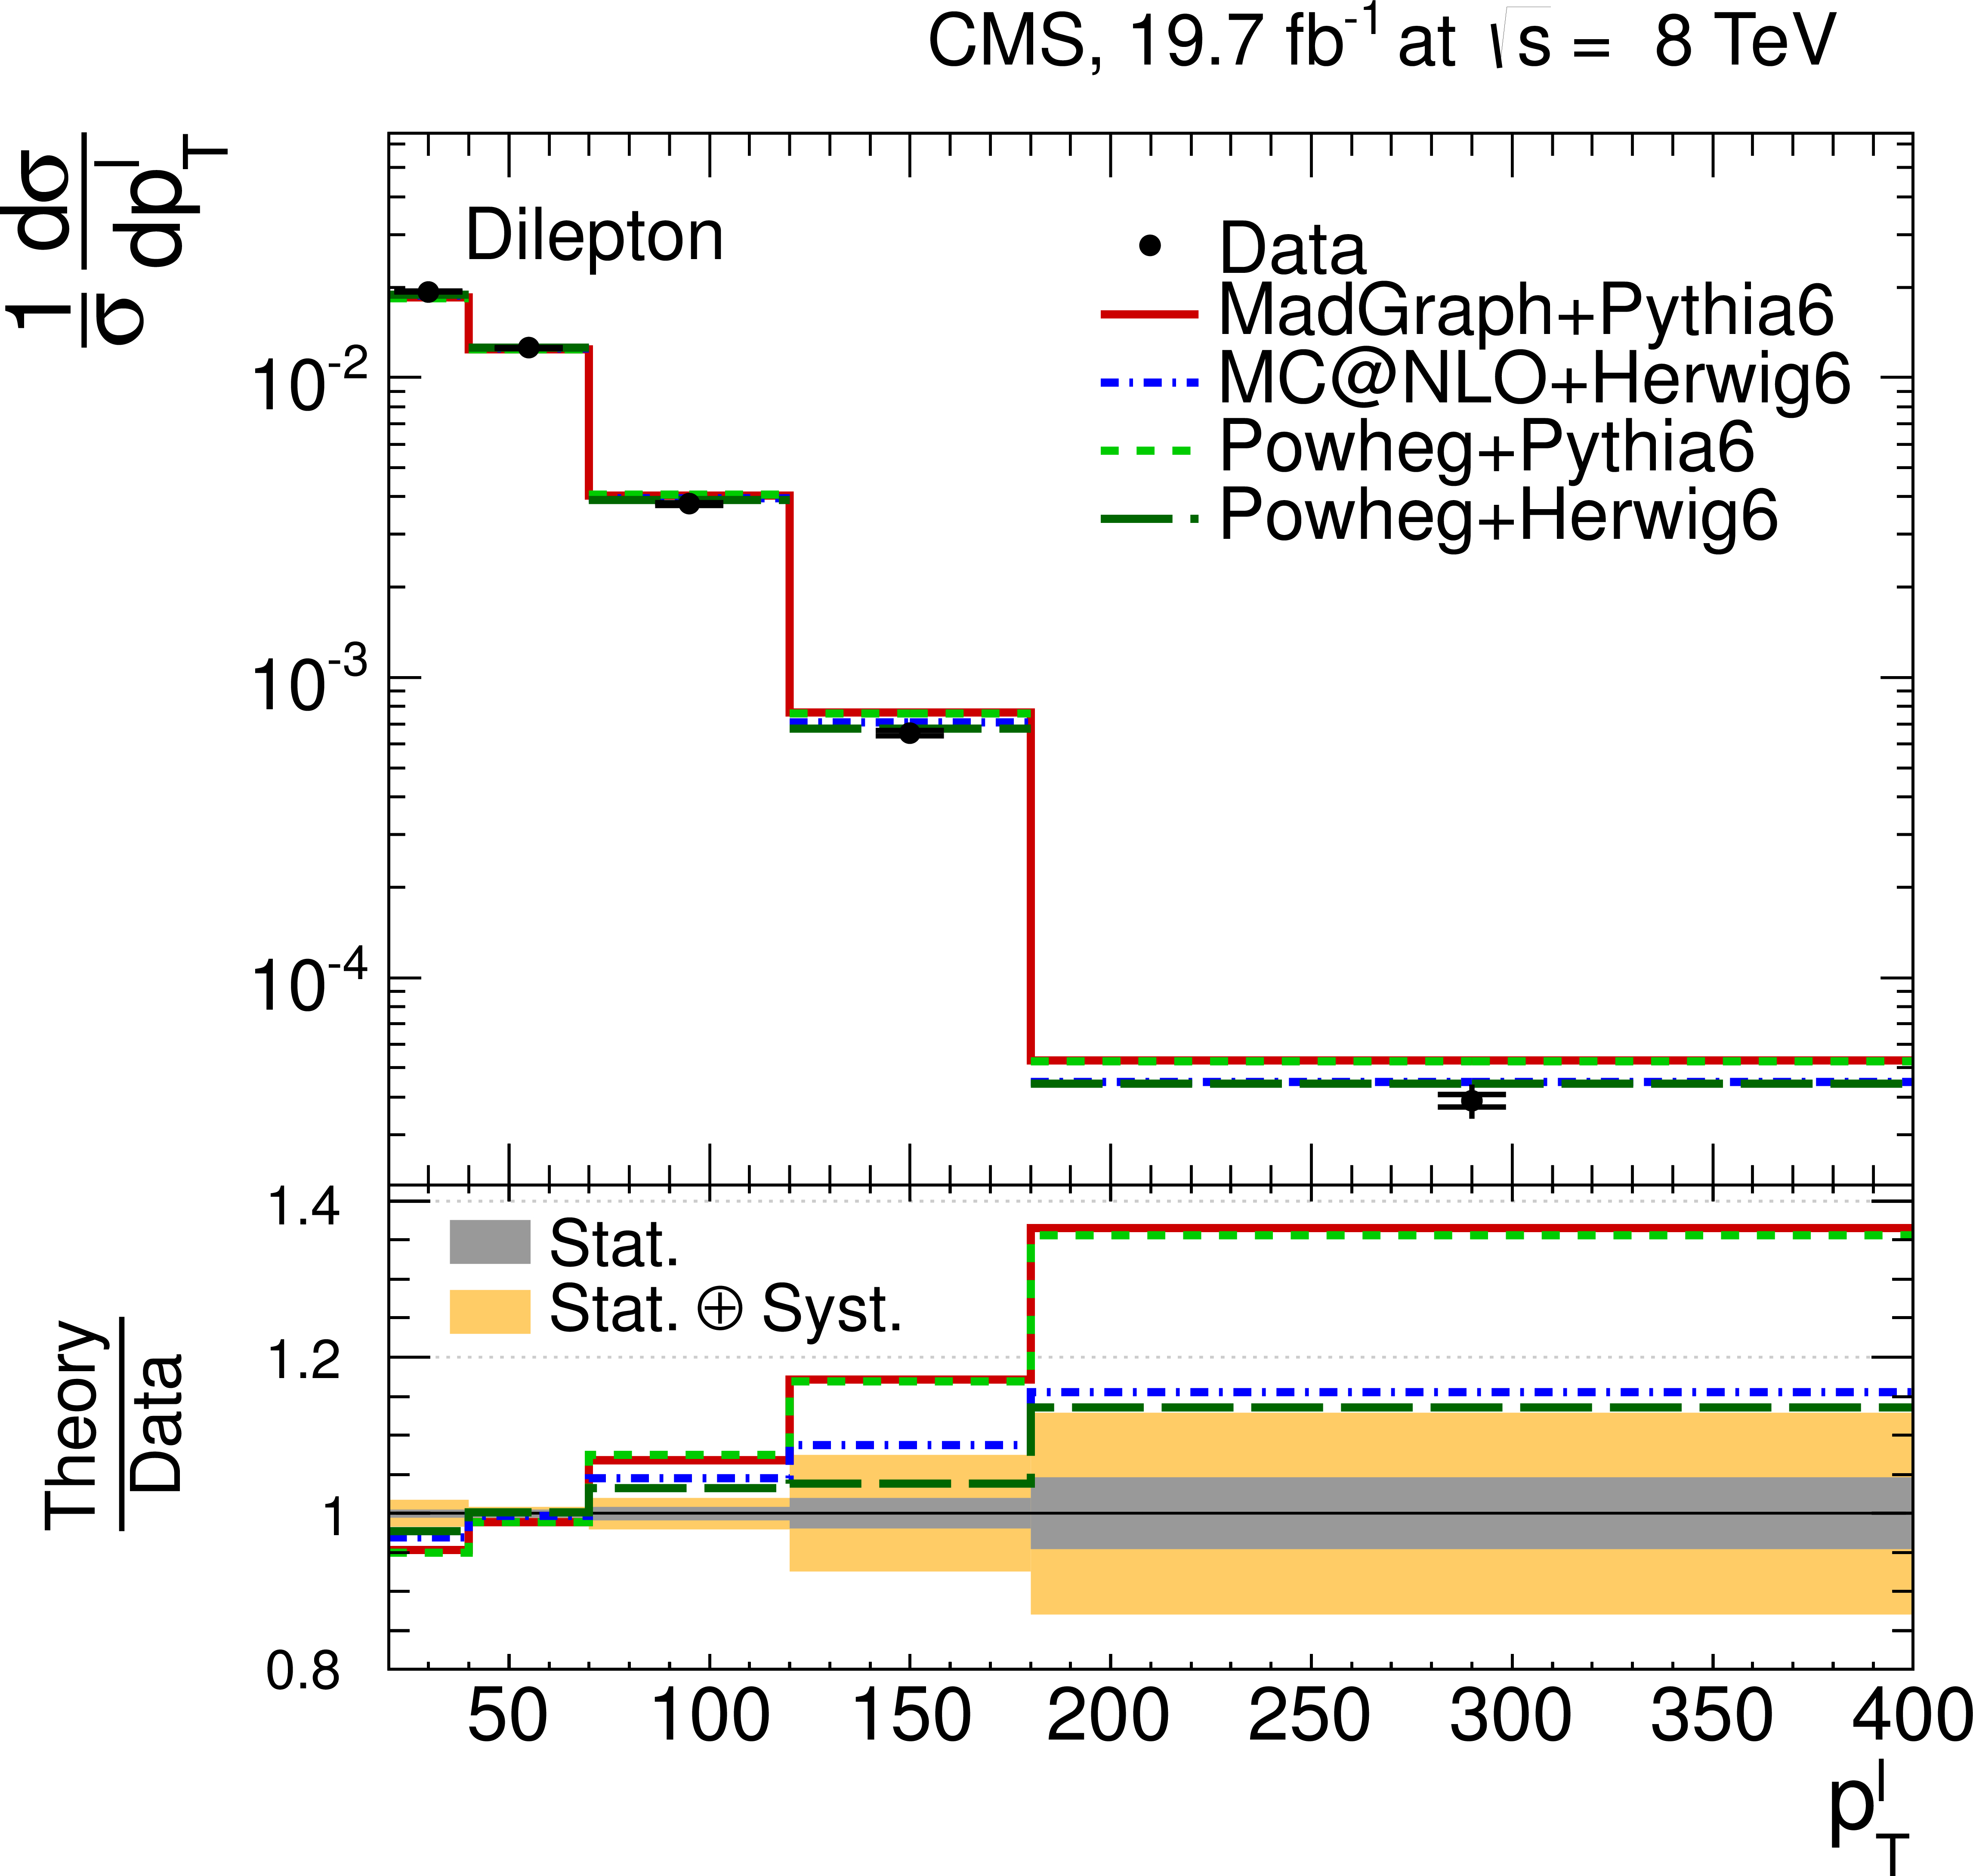
Figure 7-a:
Normalized differential $ {\mathrm {t}\overline {\mathrm {t}}} $ production cross section in the dilepton channels as a function of the $ {p_{\mathrm {T}}} ^{\ell }$ (a) and $\eta _{\ell }$ (b) of the charged leptons, and the $ {p_{\mathrm {T}}} ^{\ell ^{+}\ell ^{-}}$ (c) and $m_{\ell ^{+}\ell ^{-}}$ (d) of the lepton pair. The data points are placed at the midpoint of the bins. The inner (outer) error bars indicate the statistical (combined statistical and systematic) uncertainties. The measurements are compared to predictions from MadGraph+PYTHIA6, POWHEG+PYTHIA6, POWHEG+HERWIG6 and MCatNLO+HERWIG6. The lower part of each plot shows the ratio of the predictions to data. |
png pdf |
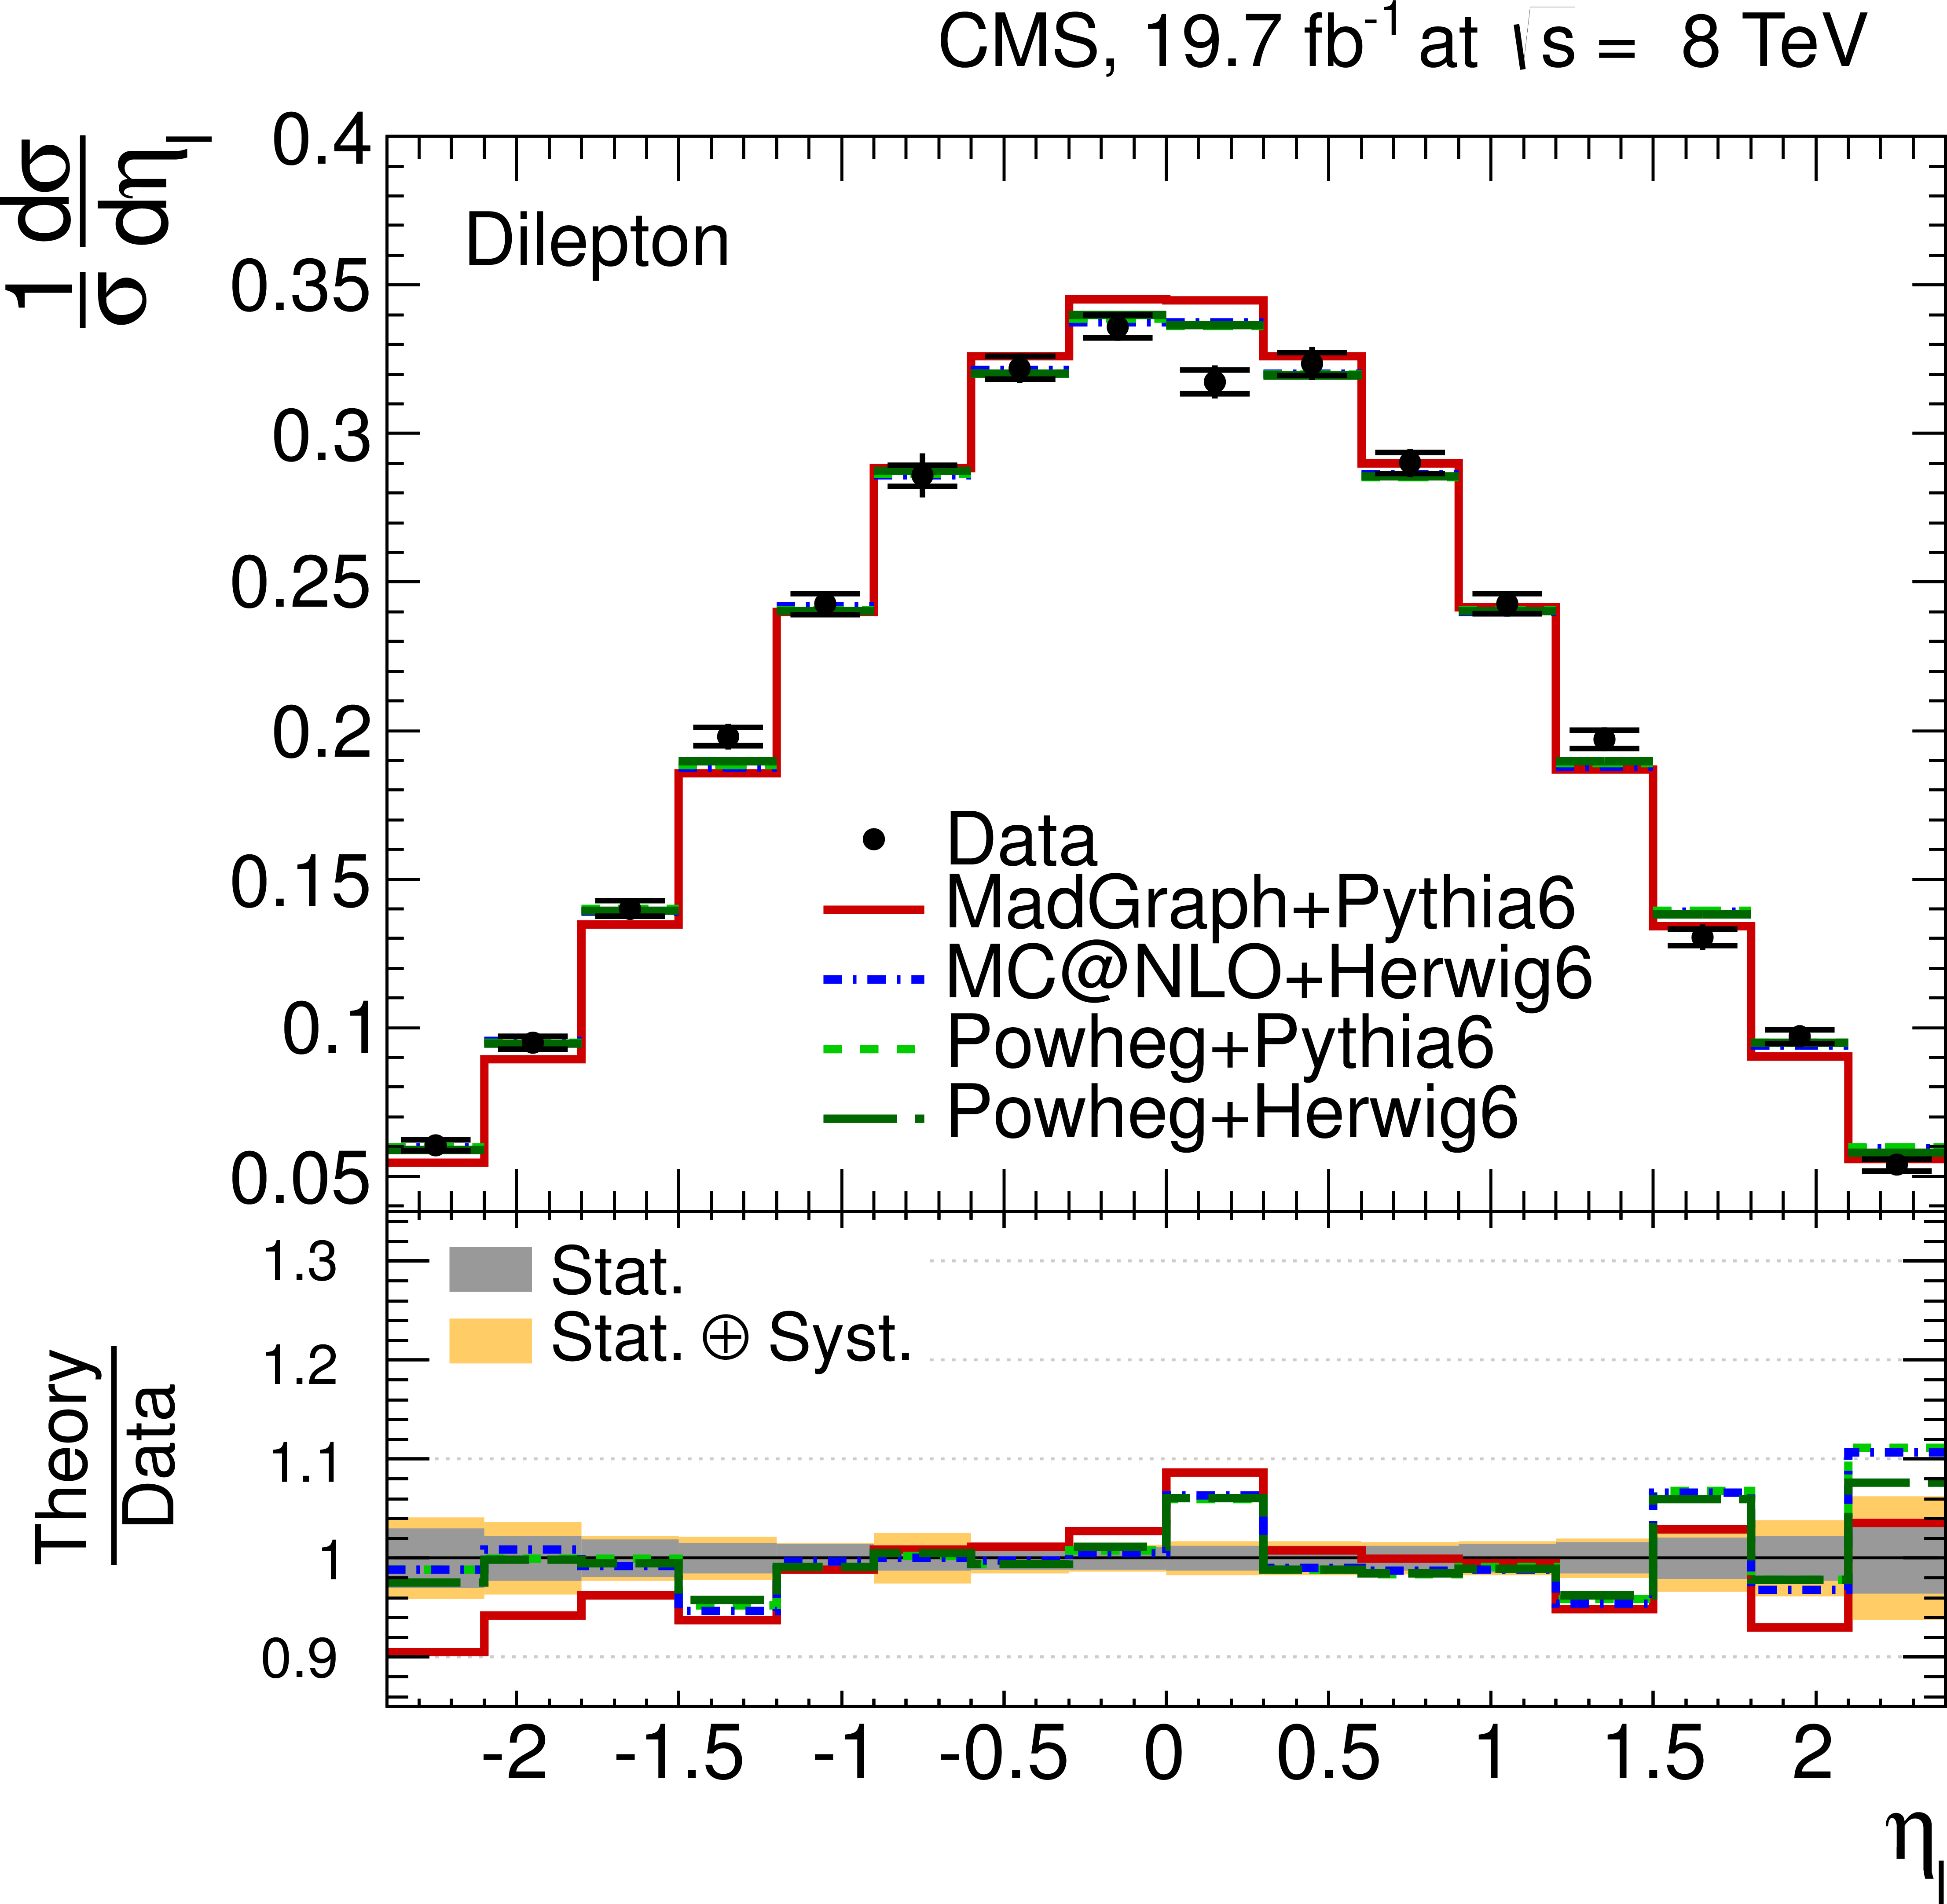
Figure 7-b:
Normalized differential $ {\mathrm {t}\overline {\mathrm {t}}} $ production cross section in the dilepton channels as a function of the $ {p_{\mathrm {T}}} ^{\ell }$ (a) and $\eta _{\ell }$ (b) of the charged leptons, and the $ {p_{\mathrm {T}}} ^{\ell ^{+}\ell ^{-}}$ (c) and $m_{\ell ^{+}\ell ^{-}}$ (d) of the lepton pair. The data points are placed at the midpoint of the bins. The inner (outer) error bars indicate the statistical (combined statistical and systematic) uncertainties. The measurements are compared to predictions from MadGraph+PYTHIA6, POWHEG+PYTHIA6, POWHEG+HERWIG6 and MCatNLO+HERWIG6. The lower part of each plot shows the ratio of the predictions to data. |
png pdf |
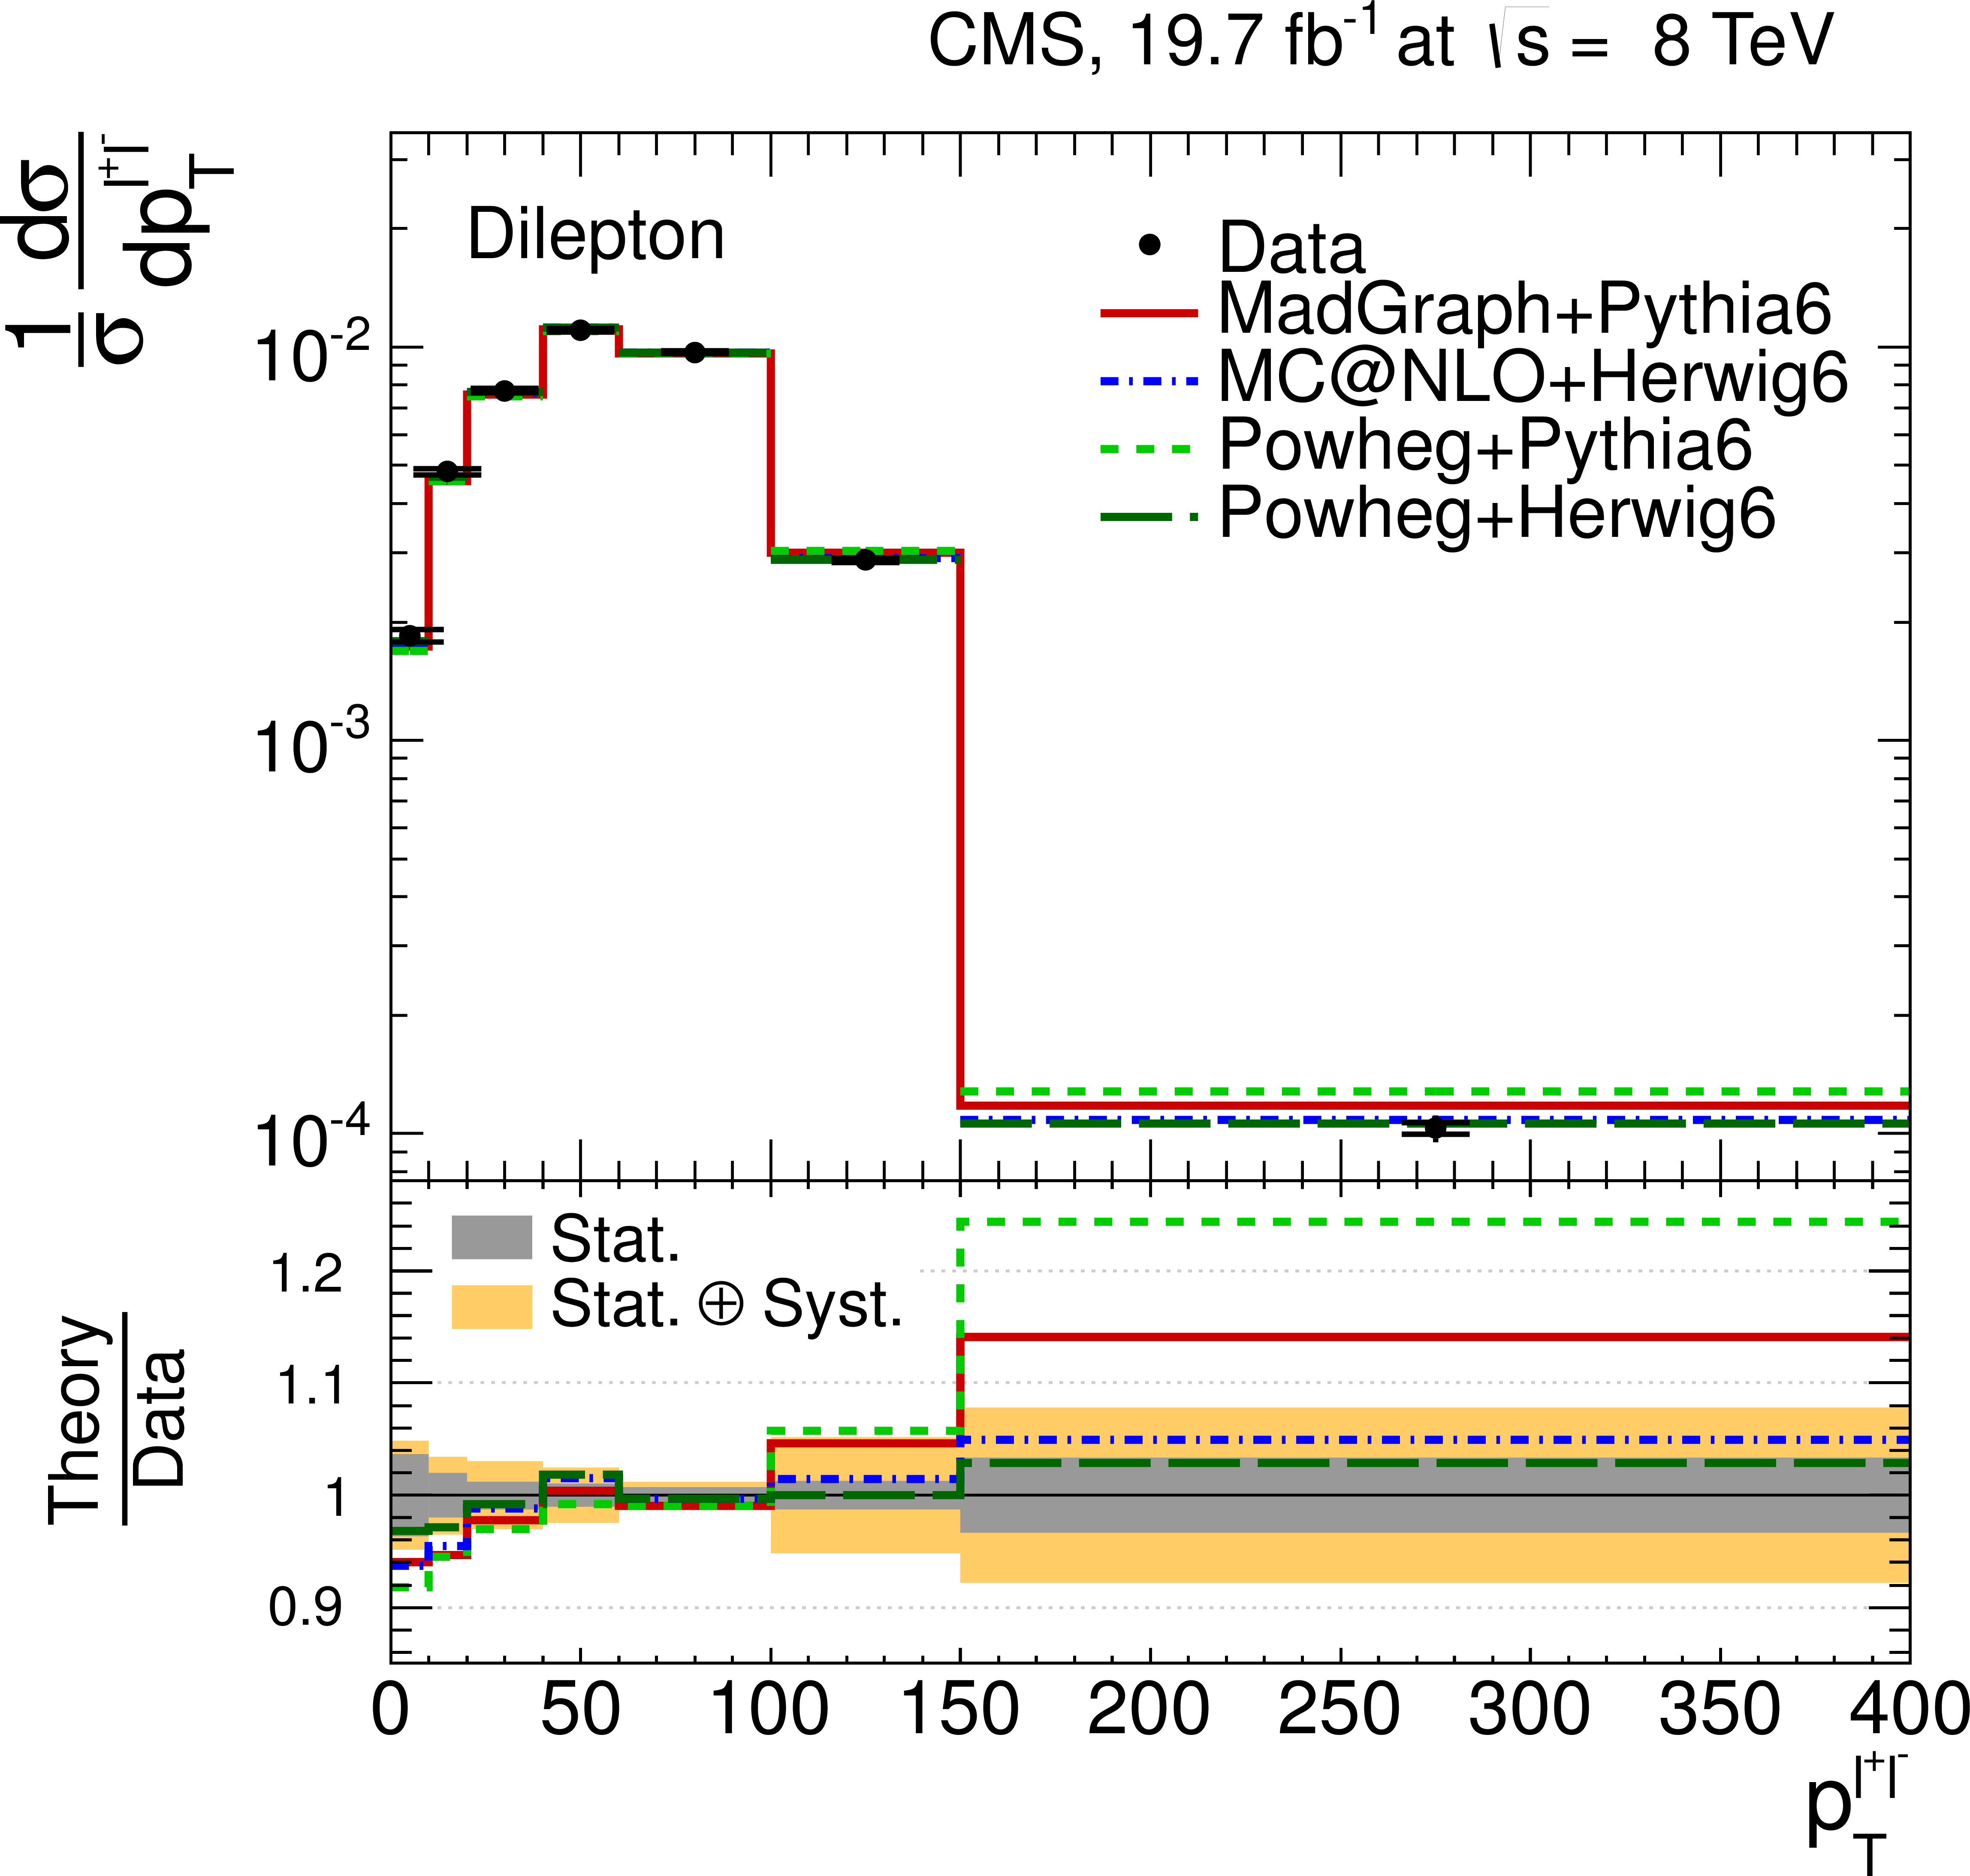
Figure 7-c:
Normalized differential $ {\mathrm {t}\overline {\mathrm {t}}} $ production cross section in the dilepton channels as a function of the $ {p_{\mathrm {T}}} ^{\ell }$ (a) and $\eta _{\ell }$ (b) of the charged leptons, and the $ {p_{\mathrm {T}}} ^{\ell ^{+}\ell ^{-}}$ (c) and $m_{\ell ^{+}\ell ^{-}}$ (d) of the lepton pair. The data points are placed at the midpoint of the bins. The inner (outer) error bars indicate the statistical (combined statistical and systematic) uncertainties. The measurements are compared to predictions from MadGraph+PYTHIA6, POWHEG+PYTHIA6, POWHEG+HERWIG6 and MCatNLO+HERWIG6. The lower part of each plot shows the ratio of the predictions to data. |

png pdf |
Figure 7-d:
Normalized differential $ {\mathrm {t}\overline {\mathrm {t}}} $ production cross section in the dilepton channels as a function of the $ {p_{\mathrm {T}}} ^{\ell }$ (a) and $\eta _{\ell }$ (b) of the charged leptons, and the $ {p_{\mathrm {T}}} ^{\ell ^{+}\ell ^{-}}$ (c) and $m_{\ell ^{+}\ell ^{-}}$ (d) of the lepton pair. The data points are placed at the midpoint of the bins. The inner (outer) error bars indicate the statistical (combined statistical and systematic) uncertainties. The measurements are compared to predictions from MadGraph+PYTHIA6, POWHEG+PYTHIA6, POWHEG+HERWIG6 and MCatNLO+HERWIG6. The lower part of each plot shows the ratio of the predictions to data. |
png pdf |
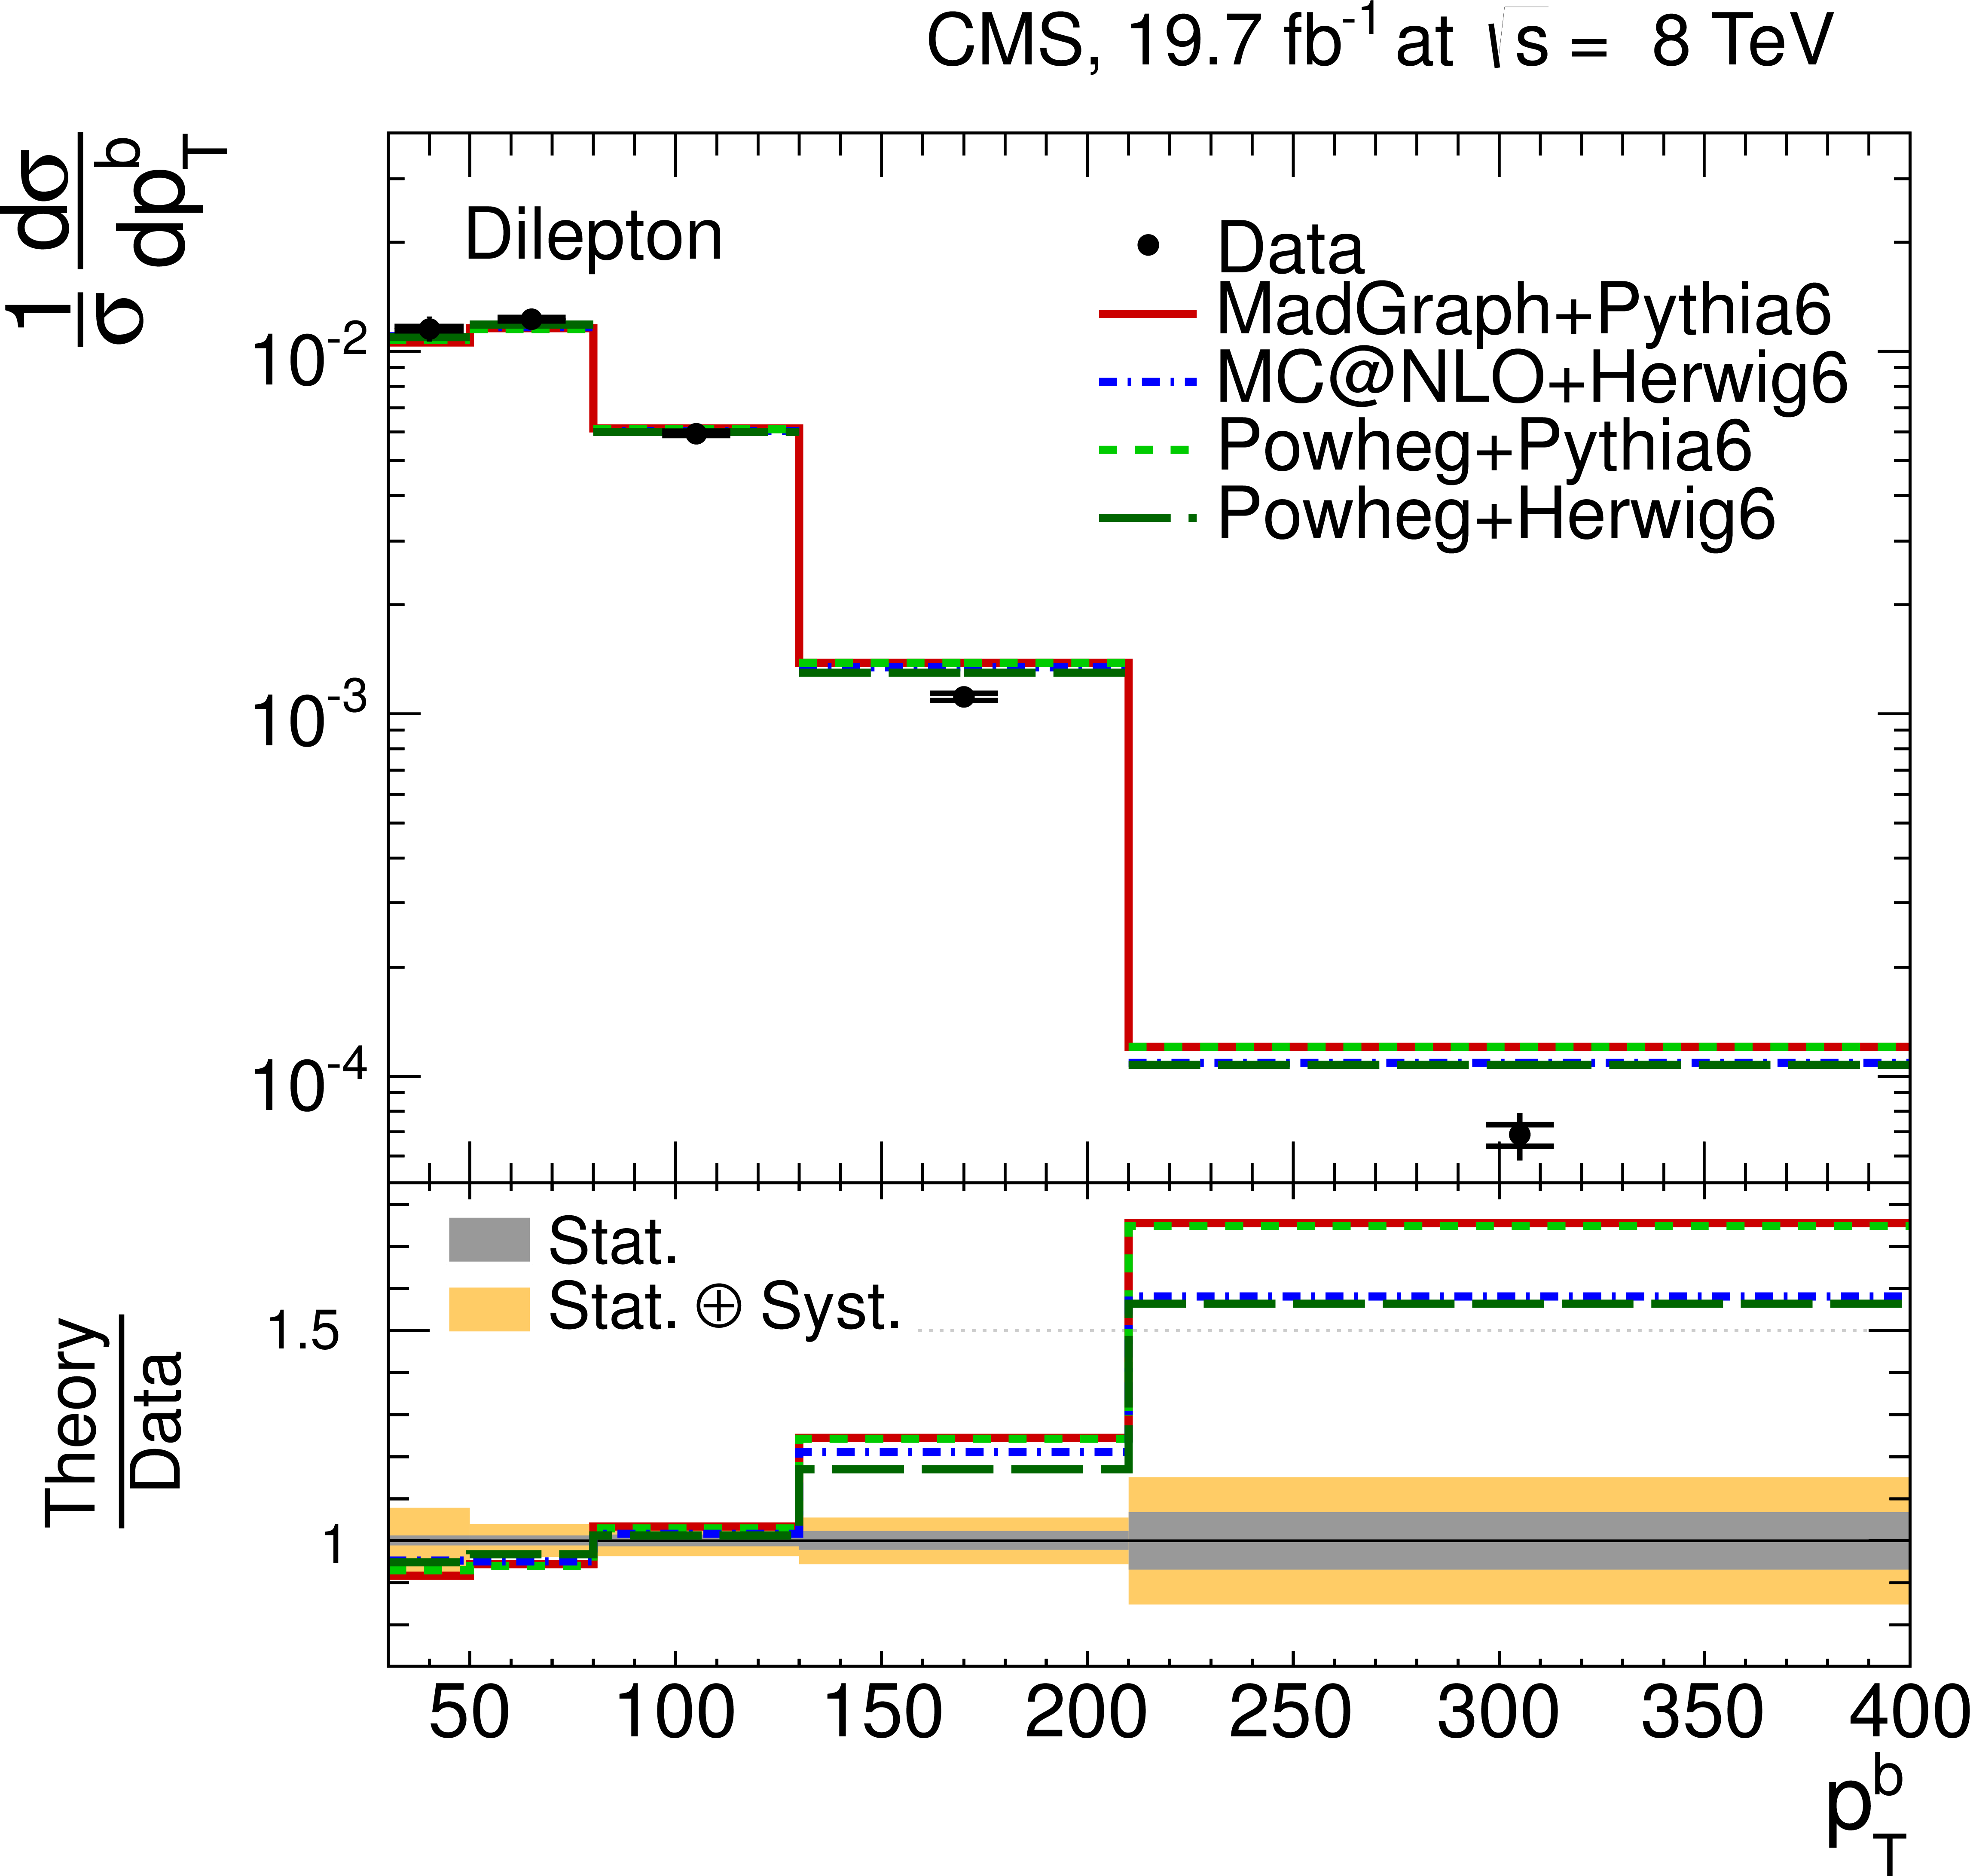
Figure 8-a:
Normalized differential $ {\mathrm {t}\overline {\mathrm {t}}} $ production cross section in the dilepton channels as a function of the $ {p_{\mathrm {T}}} ^{ {\mathrm {b}} }$ (a) and $\eta _{ {\mathrm {b}} }$ (b) of the b jets, and the $ {p_{\mathrm {T}}} ^{ { {\mathrm {b}} {\overline {\mathrm {b}}}} }$ (c) and $m_{ { {\mathrm {b}} {\overline {\mathrm {b}}}} }$ (d) of the b jet pair. The superscript `b' refers to both b and $ {\overline {\mathrm {b}}} $ jets. The data points are placed at the midpoint of the bins. The inner (outer) error bars indicate the statistical (combined statistical and systematic) uncertainties. The measurements are compared to predictions from MadGraph+PYTHIA6, POWHEG+PYTHIA6, POWHEG+HERWIG6 and MCatNLO+HERWIG6. The lower part of each plot shows the ratio of the predictions to data. |
png pdf |
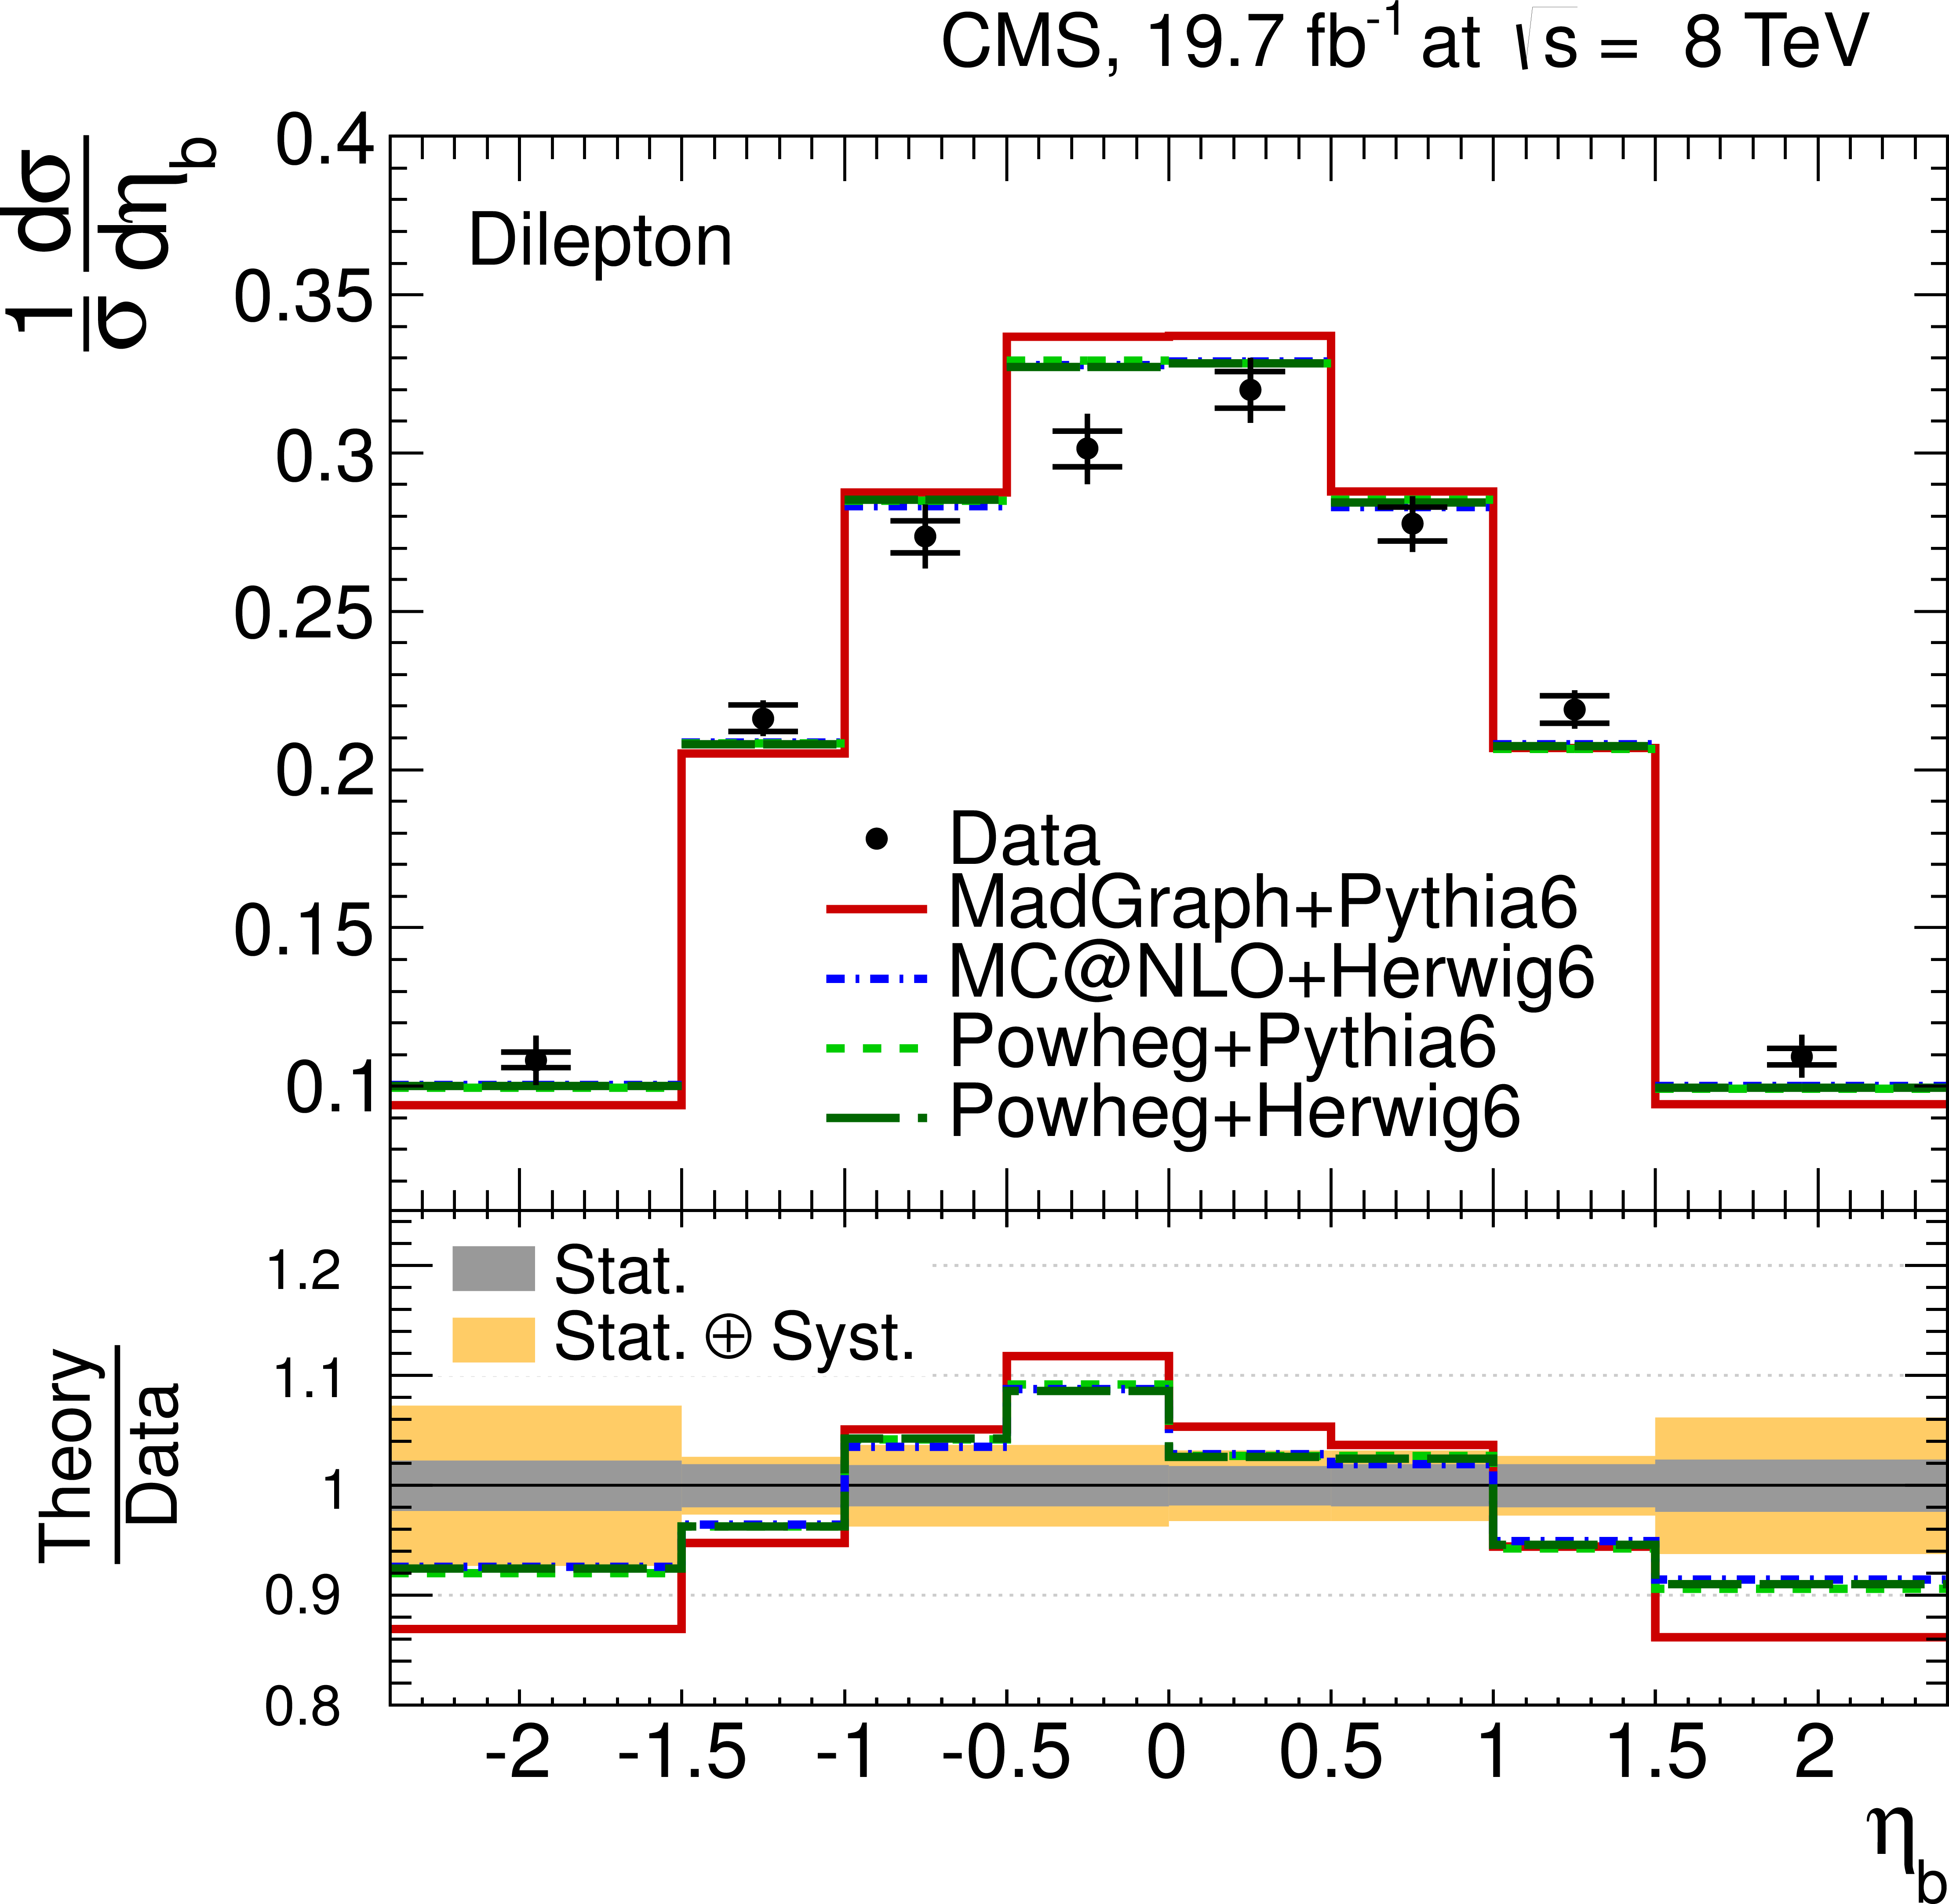
Figure 8-b:
Normalized differential $ {\mathrm {t}\overline {\mathrm {t}}} $ production cross section in the dilepton channels as a function of the $ {p_{\mathrm {T}}} ^{ {\mathrm {b}} }$ (a) and $\eta _{ {\mathrm {b}} }$ (b) of the b jets, and the $ {p_{\mathrm {T}}} ^{ { {\mathrm {b}} {\overline {\mathrm {b}}}} }$ (c) and $m_{ { {\mathrm {b}} {\overline {\mathrm {b}}}} }$ (d) of the b jet pair. The superscript `b' refers to both b and $ {\overline {\mathrm {b}}} $ jets. The data points are placed at the midpoint of the bins. The inner (outer) error bars indicate the statistical (combined statistical and systematic) uncertainties. The measurements are compared to predictions from MadGraph+PYTHIA6, POWHEG+PYTHIA6, POWHEG+HERWIG6 and MCatNLO+HERWIG6. The lower part of each plot shows the ratio of the predictions to data. |

png pdf |
Figure 8-c:
Normalized differential $ {\mathrm {t}\overline {\mathrm {t}}} $ production cross section in the dilepton channels as a function of the $ {p_{\mathrm {T}}} ^{ {\mathrm {b}} }$ (a) and $\eta _{ {\mathrm {b}} }$ (b) of the b jets, and the $ {p_{\mathrm {T}}} ^{ { {\mathrm {b}} {\overline {\mathrm {b}}}} }$ (c) and $m_{ { {\mathrm {b}} {\overline {\mathrm {b}}}} }$ (d) of the b jet pair. The superscript `b' refers to both b and $ {\overline {\mathrm {b}}} $ jets. The data points are placed at the midpoint of the bins. The inner (outer) error bars indicate the statistical (combined statistical and systematic) uncertainties. The measurements are compared to predictions from MadGraph+PYTHIA6, POWHEG+PYTHIA6, POWHEG+HERWIG6 and MCatNLO+HERWIG6. The lower part of each plot shows the ratio of the predictions to data. |
png pdf |
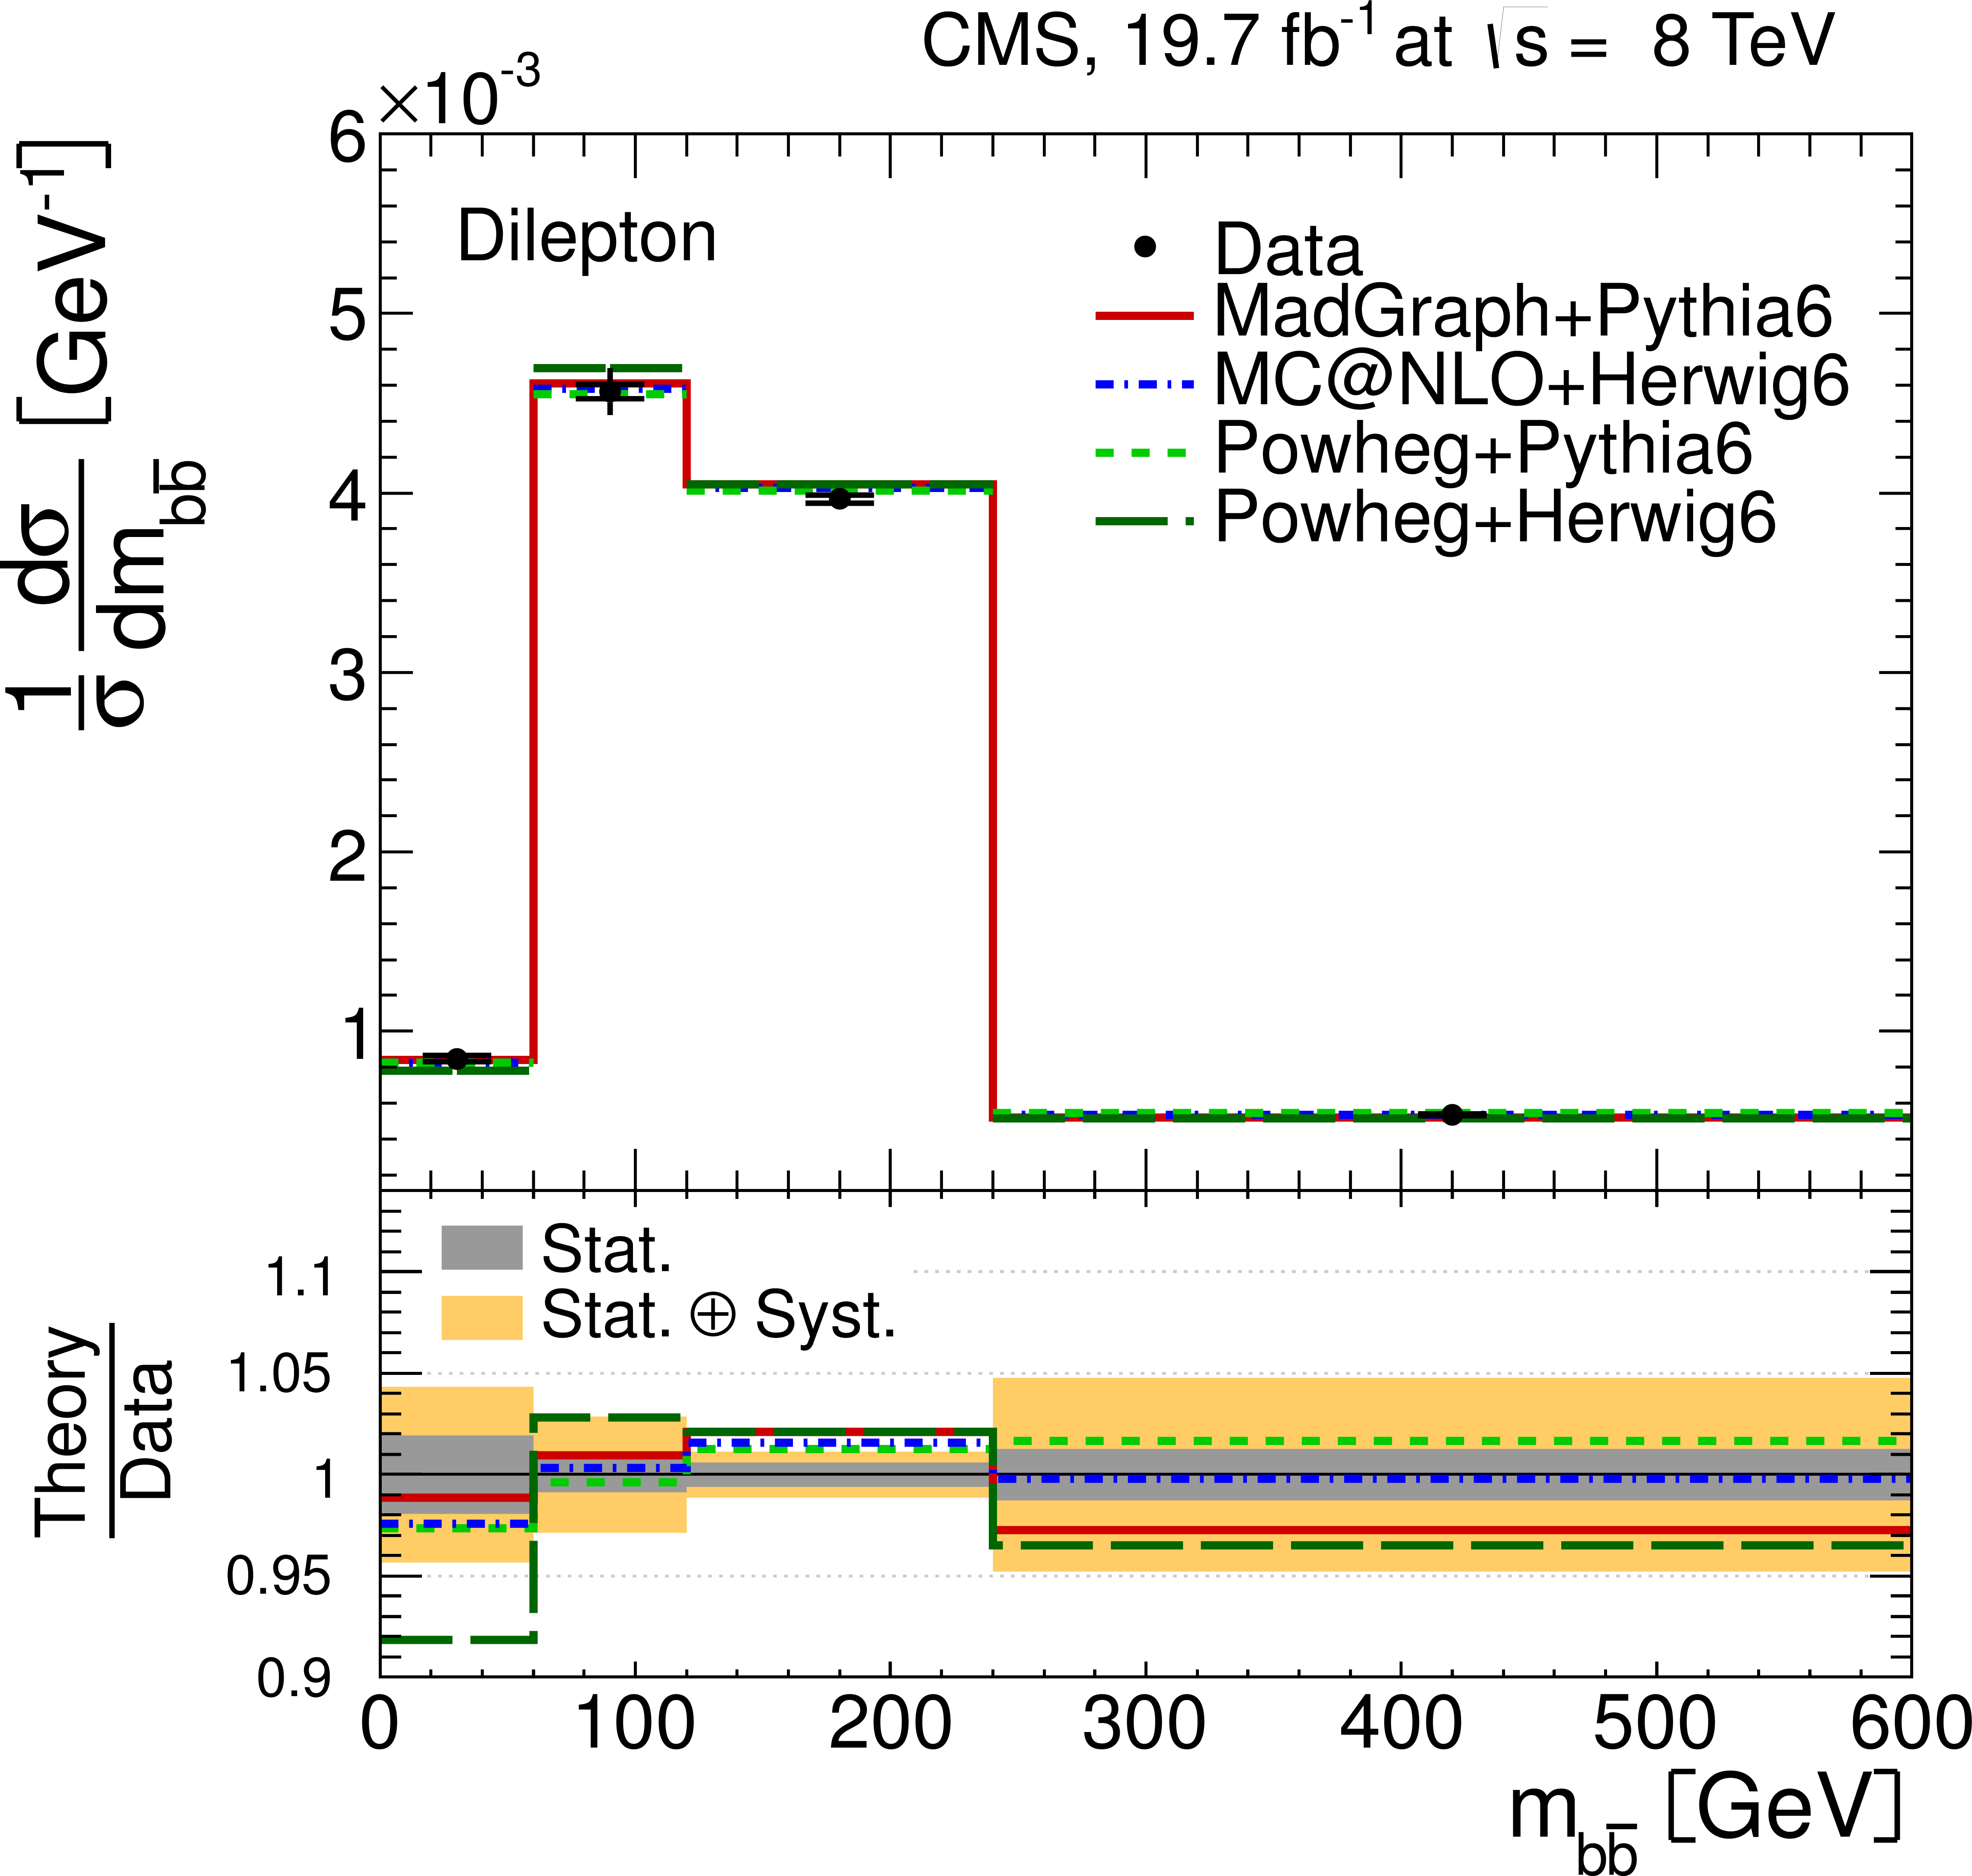
Figure 8-d:
Normalized differential $ {\mathrm {t}\overline {\mathrm {t}}} $ production cross section in the dilepton channels as a function of the $ {p_{\mathrm {T}}} ^{ {\mathrm {b}} }$ (a) and $\eta _{ {\mathrm {b}} }$ (b) of the b jets, and the $ {p_{\mathrm {T}}} ^{ { {\mathrm {b}} {\overline {\mathrm {b}}}} }$ (c) and $m_{ { {\mathrm {b}} {\overline {\mathrm {b}}}} }$ (d) of the b jet pair. The superscript `b' refers to both b and $ {\overline {\mathrm {b}}} $ jets. The data points are placed at the midpoint of the bins. The inner (outer) error bars indicate the statistical (combined statistical and systematic) uncertainties. The measurements are compared to predictions from MadGraph+PYTHIA6, POWHEG+PYTHIA6, POWHEG+HERWIG6 and MCatNLO+HERWIG6. The lower part of each plot shows the ratio of the predictions to data. |
png pdf |
Figure 9-a:
Normalized differential $ {\mathrm {t}\overline {\mathrm {t}}} $ production cross section in the $ {\ell }$+jets channels as a function of the $ {p_{\mathrm {T}}} ^{ {\mathrm {t}} }$ (a), the $ {\mathrm {t}\overline {\mathrm {t}}} $ rest frame $ {p_{\mathrm {T}}} ^{ {\mathrm {t}} \ast }$ (b), and the rapidity $y_{ {\mathrm {t}} }$ (c) of the top quarks or antiquarks, and the difference in the azimuthal angle between the top quark and the antiquark $\Delta \phi ( {\mathrm {t , \bar{t}}} )$ (d). The data points are placed at the midpoint of the bins. The inner (outer) error bars indicate the statistical (combined statistical and systematic) uncertainties. The measurements are compared to predictions from MadGraph+PYTHIA6, POWHEG+PYTHIA6, POWHEG+HERWIG6 and MCatNLO+HERWIG6 and to approximate NNLO [16 (N. Kidonakis, PPN 45 (2014) 714)] calculations, when available. The lower part of each plot shows the ratio of the predictions to data. |
png pdf |
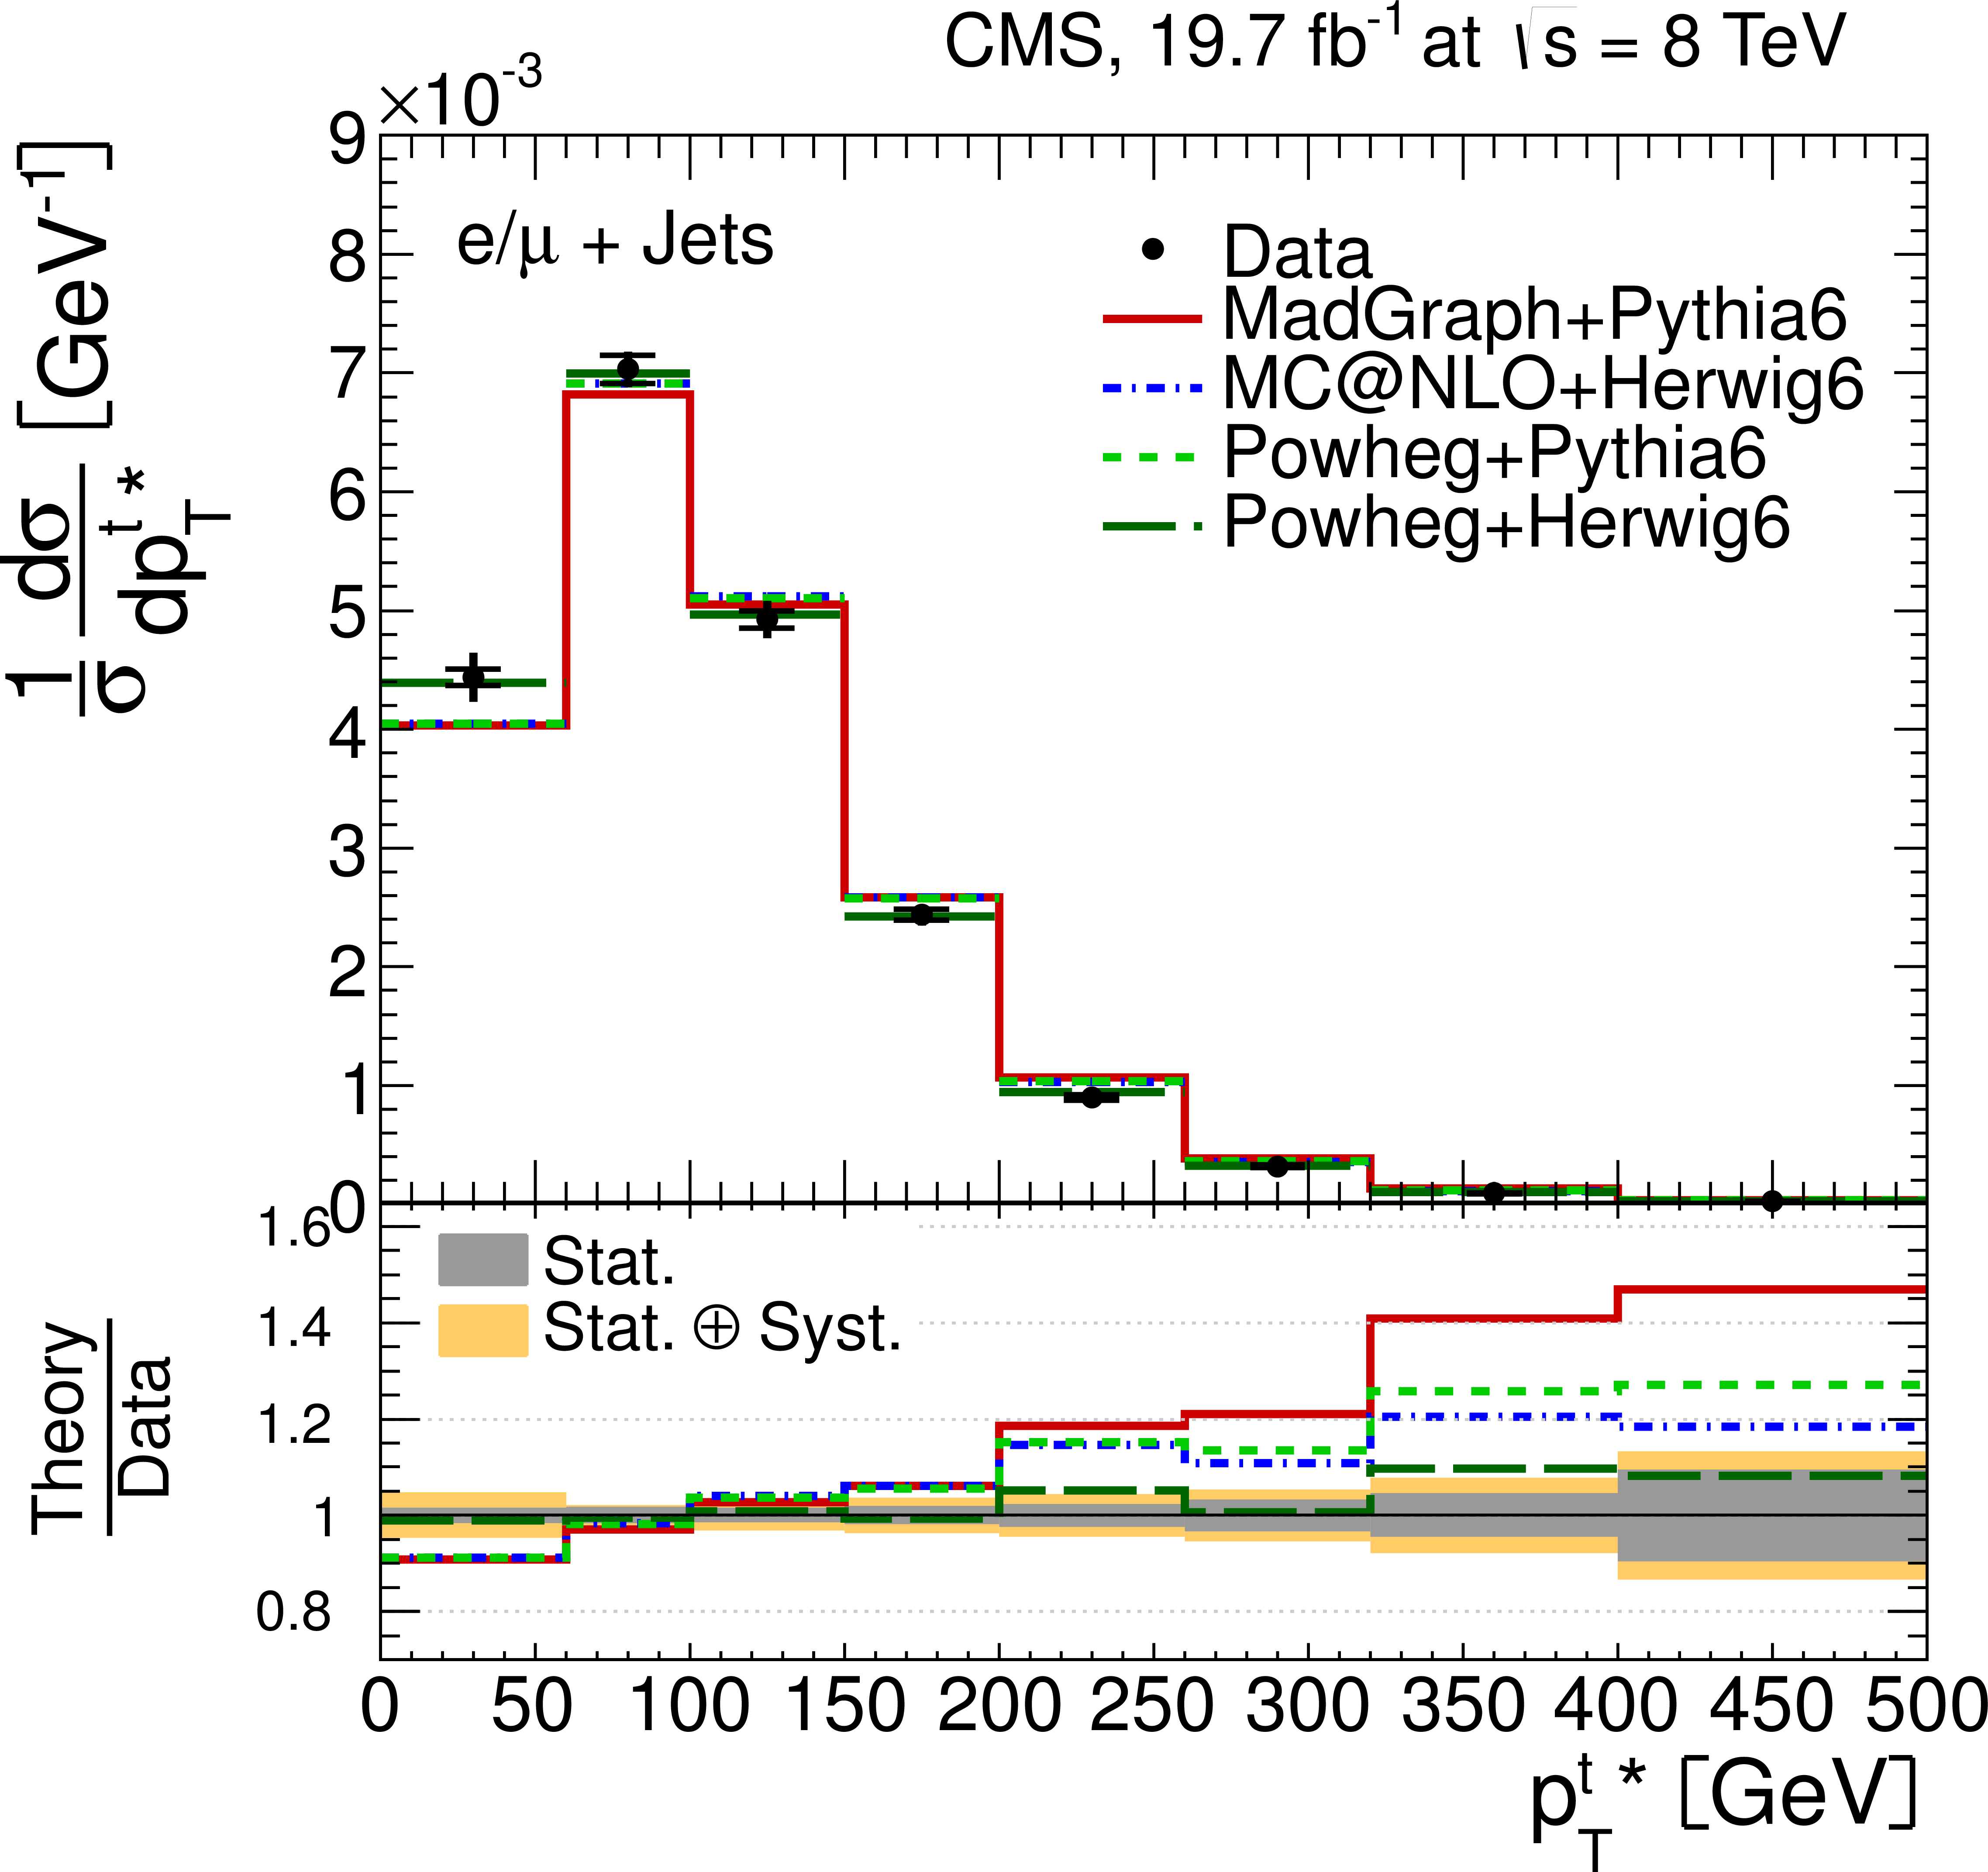
Figure 9-b:
Normalized differential $ {\mathrm {t}\overline {\mathrm {t}}} $ production cross section in the $ {\ell }$+jets channels as a function of the $ {p_{\mathrm {T}}} ^{ {\mathrm {t}} }$ (a), the $ {\mathrm {t}\overline {\mathrm {t}}} $ rest frame $ {p_{\mathrm {T}}} ^{ {\mathrm {t}} \ast }$ (b), and the rapidity $y_{ {\mathrm {t}} }$ (c) of the top quarks or antiquarks, and the difference in the azimuthal angle between the top quark and the antiquark $\Delta \phi ( {\mathrm {t , \bar{t}}} )$ (d). The data points are placed at the midpoint of the bins. The inner (outer) error bars indicate the statistical (combined statistical and systematic) uncertainties. The measurements are compared to predictions from MadGraph+PYTHIA6, POWHEG+PYTHIA6, POWHEG+HERWIG6 and MCatNLO+HERWIG6 and to approximate NNLO [16 (N. Kidonakis, PPN 45 (2014) 714)] calculations, when available. The lower part of each plot shows the ratio of the predictions to data. |

png pdf |
Figure 9-c:
Normalized differential $ {\mathrm {t}\overline {\mathrm {t}}} $ production cross section in the $ {\ell }$+jets channels as a function of the $ {p_{\mathrm {T}}} ^{ {\mathrm {t}} }$ (a), the $ {\mathrm {t}\overline {\mathrm {t}}} $ rest frame $ {p_{\mathrm {T}}} ^{ {\mathrm {t}} \ast }$ (b), and the rapidity $y_{ {\mathrm {t}} }$ (c) of the top quarks or antiquarks, and the difference in the azimuthal angle between the top quark and the antiquark $\Delta \phi ( {\mathrm {t , \bar{t}}} )$ (d). The data points are placed at the midpoint of the bins. The inner (outer) error bars indicate the statistical (combined statistical and systematic) uncertainties. The measurements are compared to predictions from MadGraph+PYTHIA6, POWHEG+PYTHIA6, POWHEG+HERWIG6 and MCatNLO+HERWIG6 and to approximate NNLO [16 (N. Kidonakis, PPN 45 (2014) 714)] calculations, when available. The lower part of each plot shows the ratio of the predictions to data. |
png pdf |
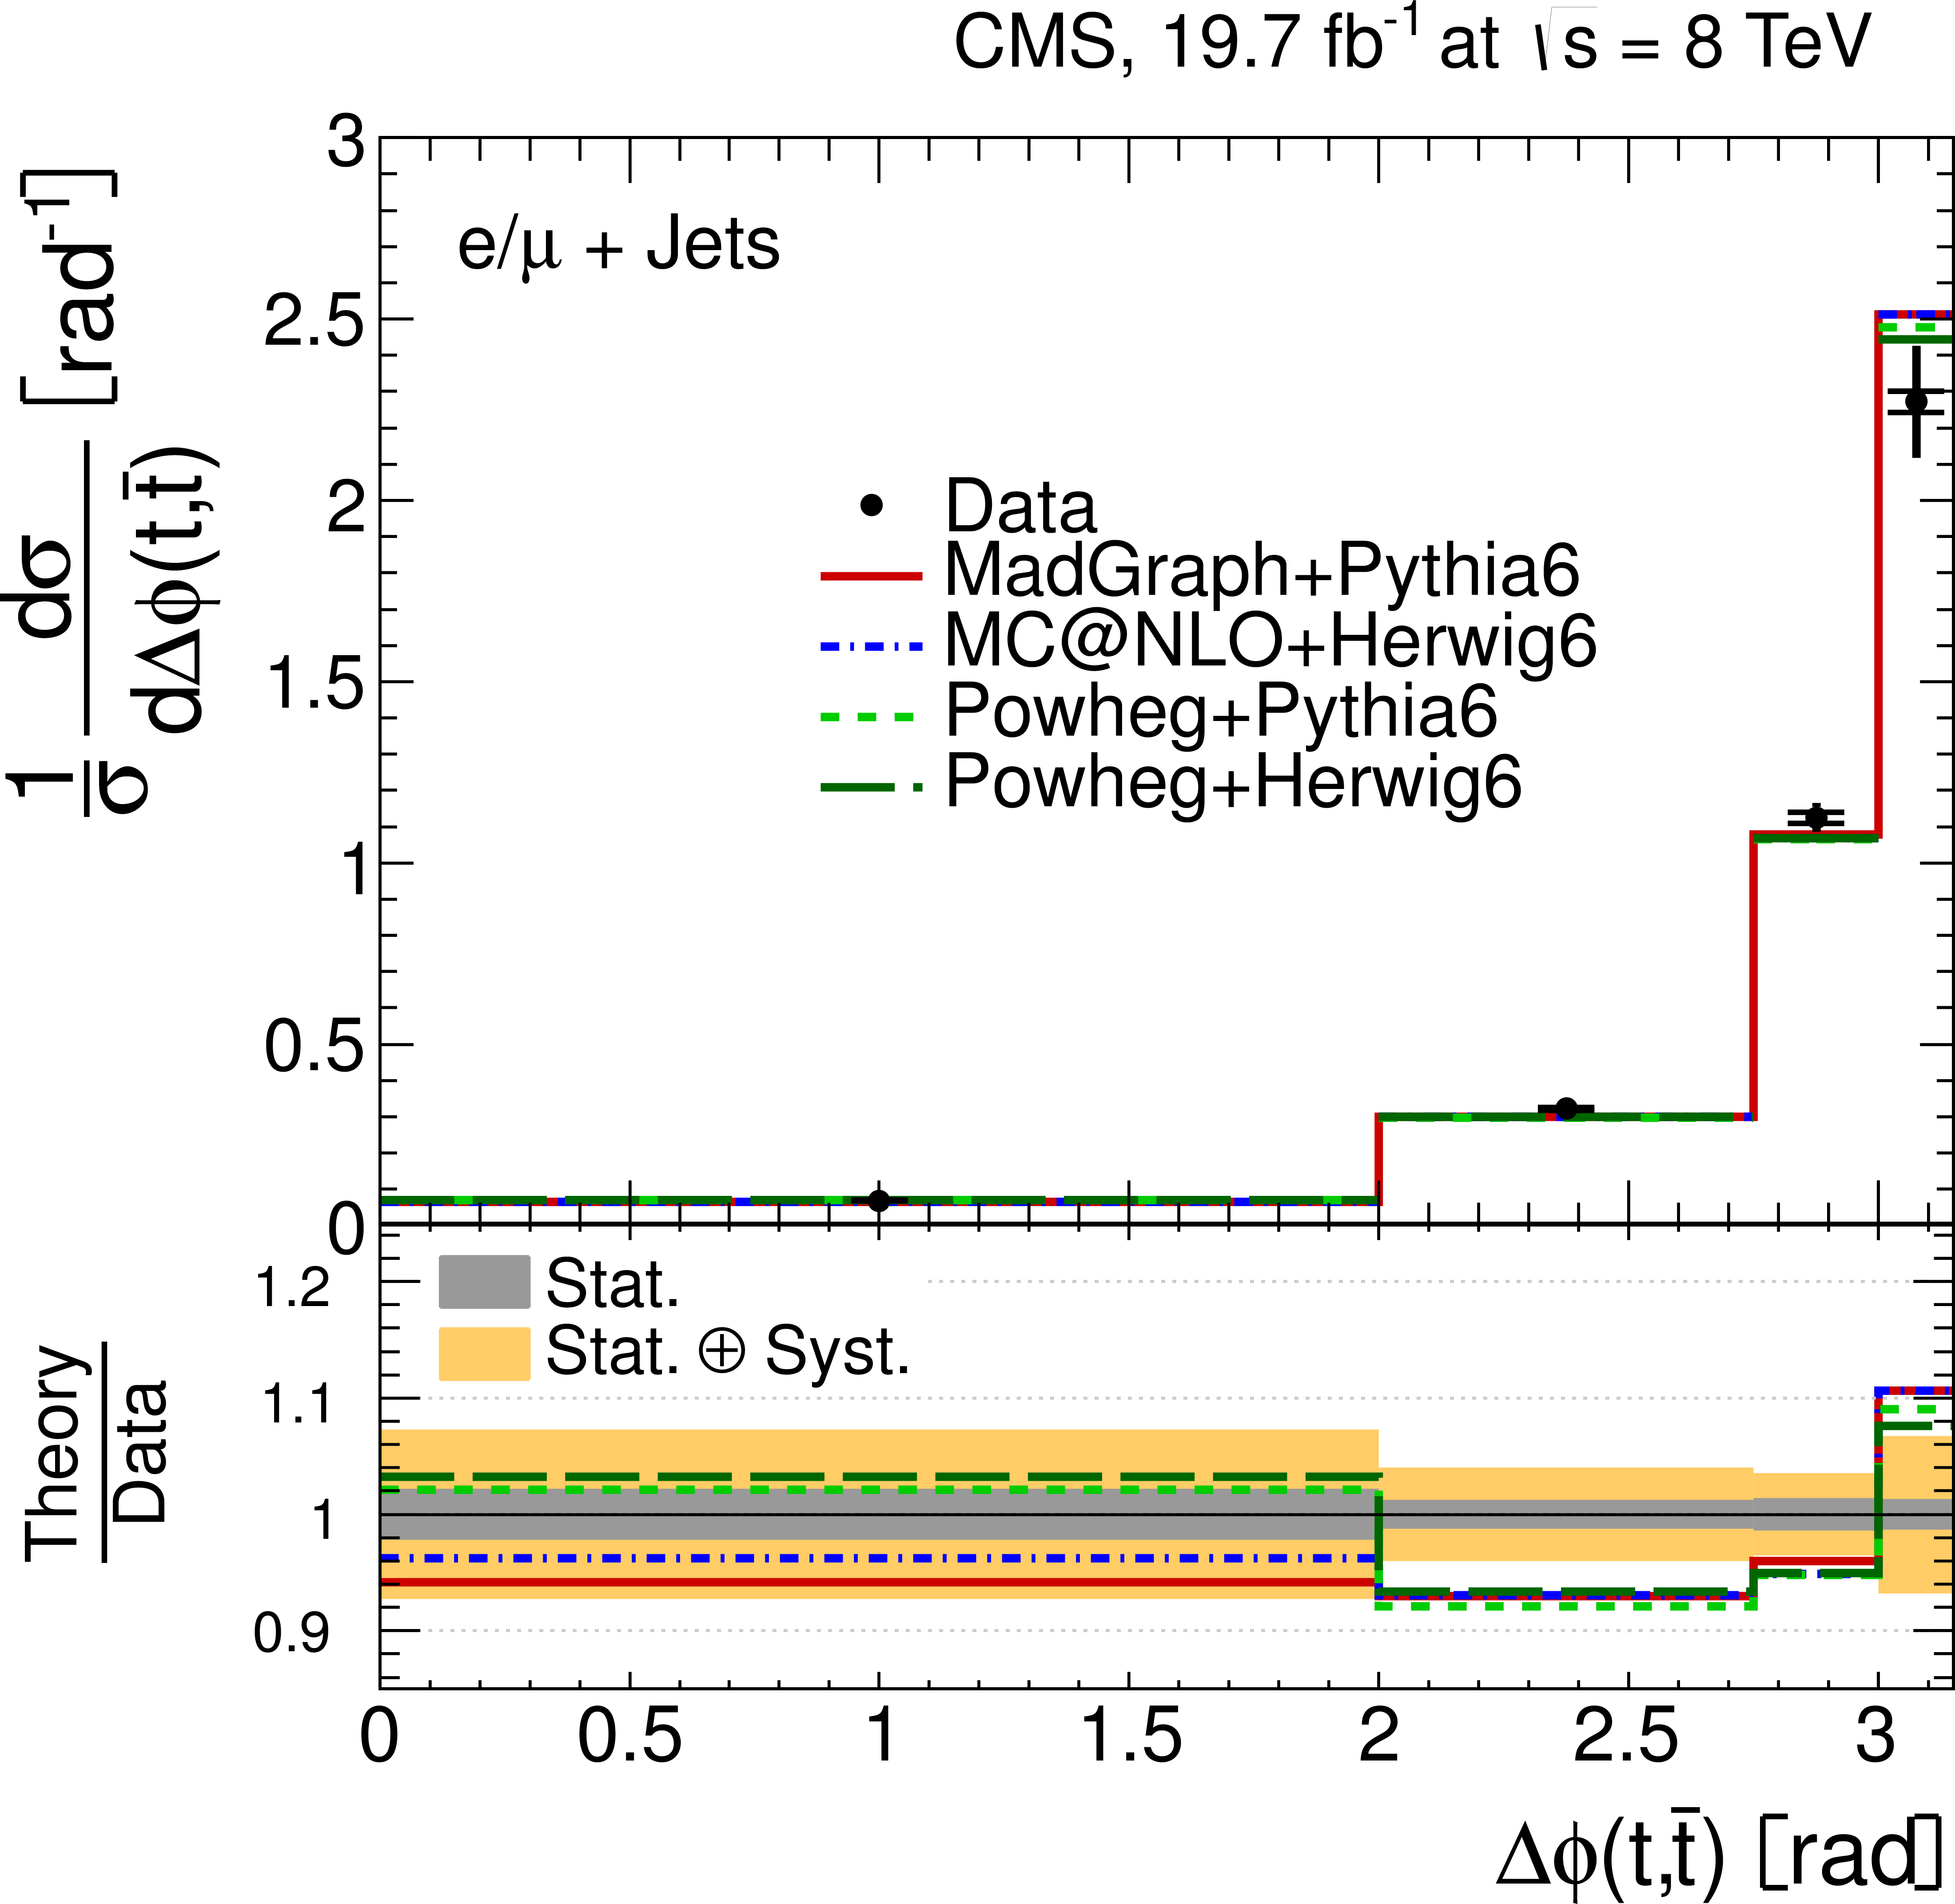
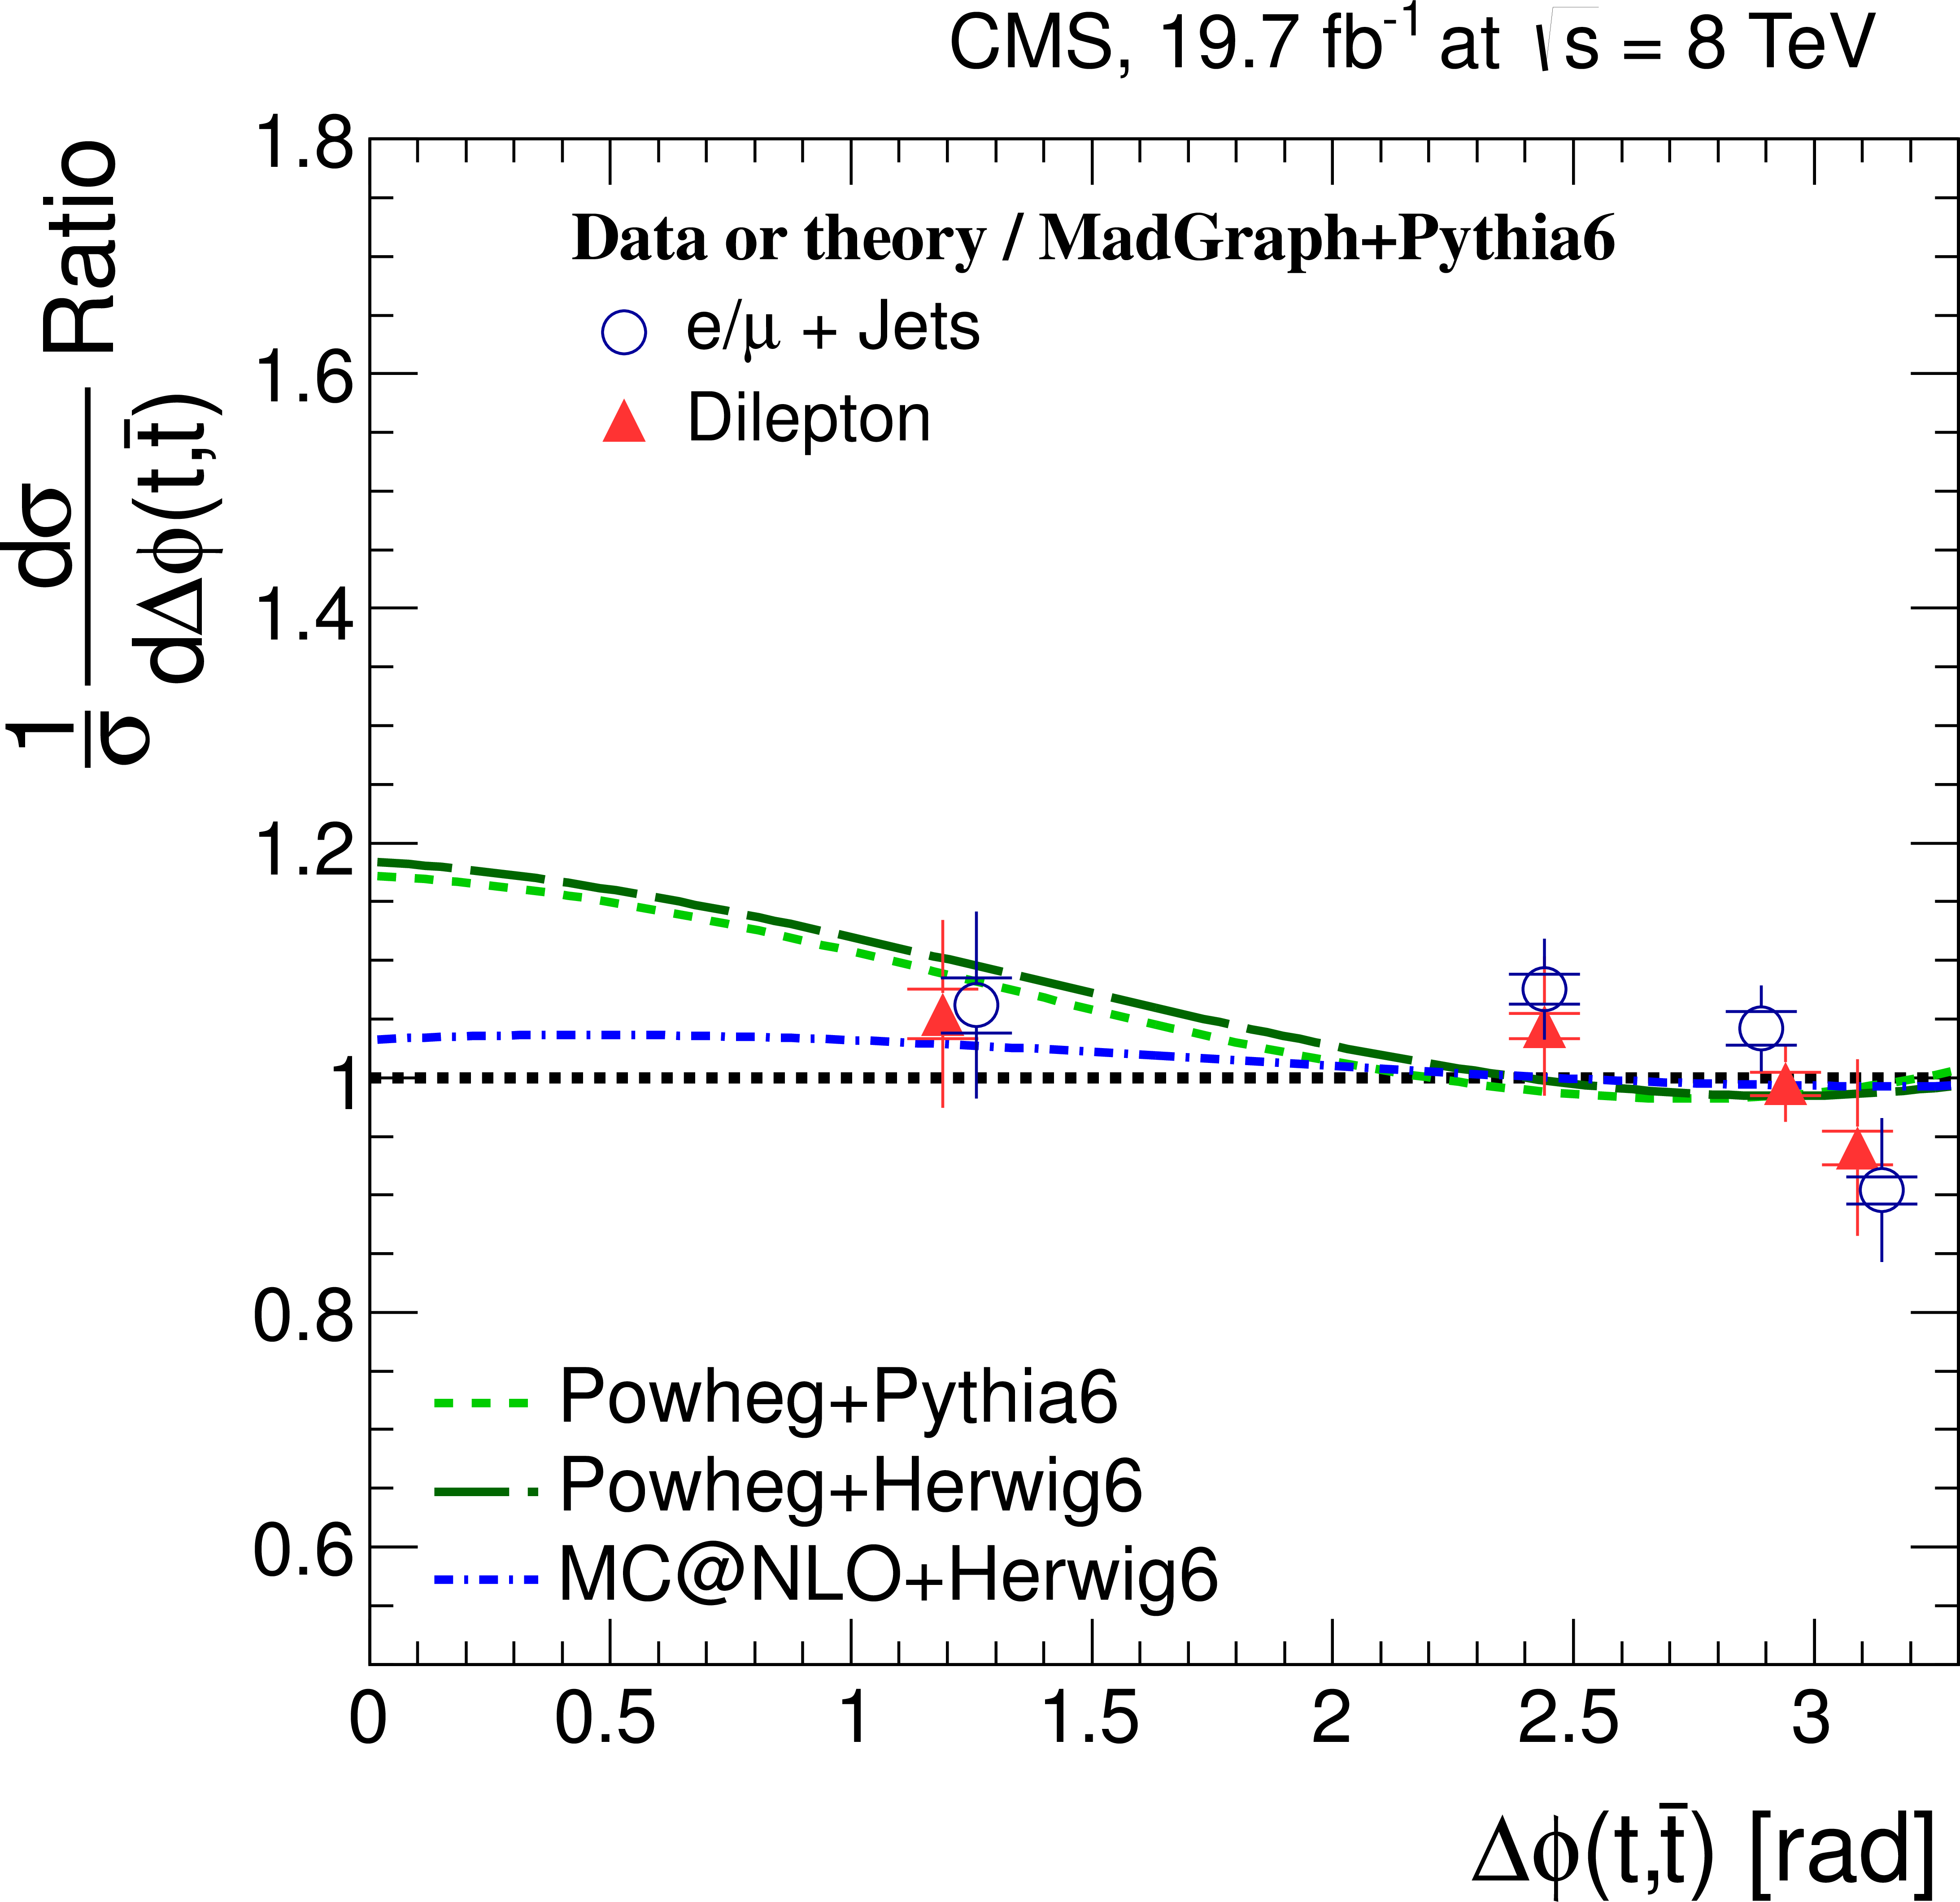
Figure 9-d:
Normalized differential $ {\mathrm {t}\overline {\mathrm {t}}} $ production cross section in the $ {\ell }$+jets channels as a function of the $ {p_{\mathrm {T}}} ^{ {\mathrm {t}} }$ (a), the $ {\mathrm {t}\overline {\mathrm {t}}} $ rest frame $ {p_{\mathrm {T}}} ^{ {\mathrm {t}} \ast }$ (b), and the rapidity $y_{ {\mathrm {t}} }$ (c) of the top quarks or antiquarks, and the difference in the azimuthal angle between the top quark and the antiquark $\Delta \phi ( {\mathrm {t , \bar{t}}} )$ (d). The data points are placed at the midpoint of the bins. The inner (outer) error bars indicate the statistical (combined statistical and systematic) uncertainties. The measurements are compared to predictions from MadGraph+PYTHIA6, POWHEG+PYTHIA6, POWHEG+HERWIG6 and MCatNLO+HERWIG6 and to approximate NNLO [16 (N. Kidonakis, PPN 45 (2014) 714)] calculations, when available. The lower part of each plot shows the ratio of the predictions to data. |
png pdf |
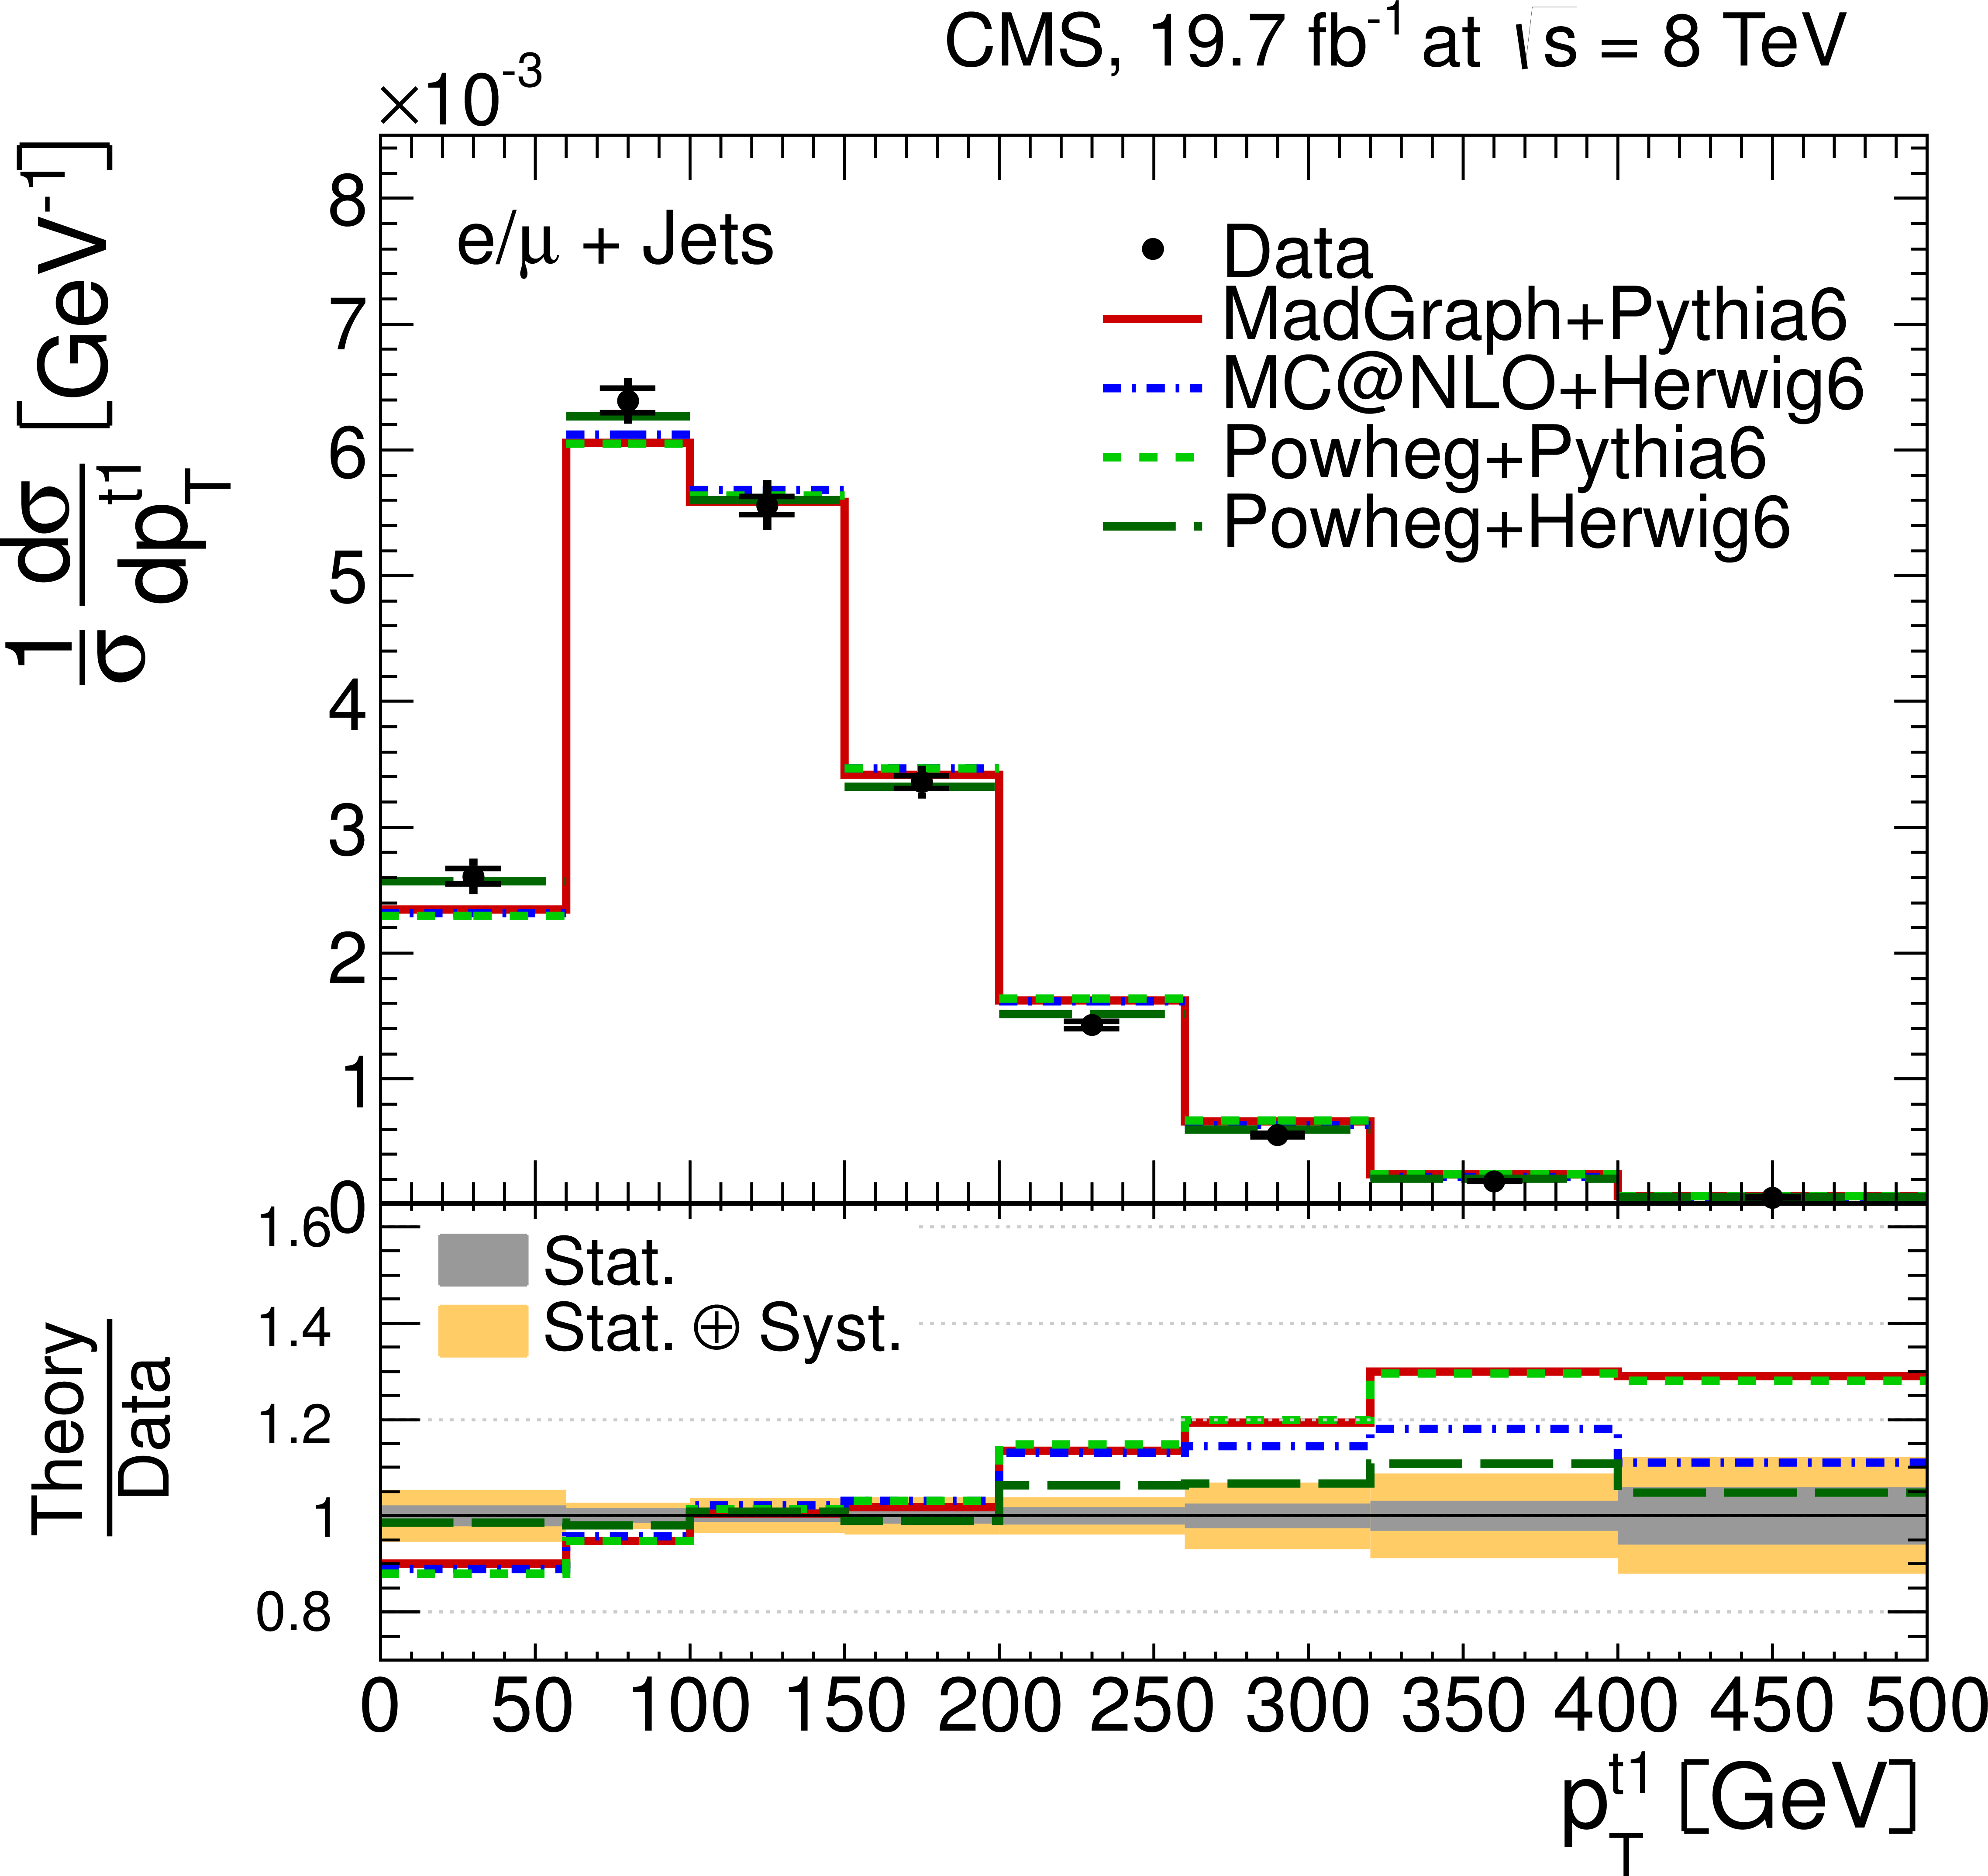
Figure 10-a:
Normalized differential $ {\mathrm {t}\overline {\mathrm {t}}} $ production cross section in the $ {\ell }$+jets channels as a function of the $ {p_{\mathrm {T}}} $ of the leading (a) and trailing (b) top quarks or antiquarks. The data points are placed at the midpoint of the bins. The inner (outer) error bars indicate the statistical (combined statistical and systematic) uncertainties. The measurements are compared to predictions from MadGraph+PYTHIA6, POWHEG+PYTHIA6, POWHEG+HERWIG6 and MCatNLO+HERWIG6. The lower part of each plot shows the ratio of the predictions to data. |

png pdf |
Figure 10-b:
Normalized differential $ {\mathrm {t}\overline {\mathrm {t}}} $ production cross section in the $ {\ell }$+jets channels as a function of the $ {p_{\mathrm {T}}} $ of the leading (a) and trailing (b) top quarks or antiquarks. The data points are placed at the midpoint of the bins. The inner (outer) error bars indicate the statistical (combined statistical and systematic) uncertainties. The measurements are compared to predictions from MadGraph+PYTHIA6, POWHEG+PYTHIA6, POWHEG+HERWIG6 and MCatNLO+HERWIG6. The lower part of each plot shows the ratio of the predictions to data. |

png pdf |
Figure 11-a:
Normalized differential $ {\mathrm {t}\overline {\mathrm {t}}} $ production cross section in the $ {\ell }$+jets channels as a function of the $ {p_{\mathrm {T}}} ^{ {\mathrm {t}\overline {\mathrm {t}}} }$ (a), $y_{ {\mathrm {t}\overline {\mathrm {t}}} }$ (b), and $m_{ {\mathrm {t}\overline {\mathrm {t}}} }$ (c) of the $ {\mathrm {t}\overline {\mathrm {t}}} $ system. The data points are placed at the midpoint of the bins. The inner (outer) error bars indicate the statistical (combined statistical and systematic) uncertainties. The measurements are compared to predictions from MadGraph+PYTHIA6, POWHEG+PYTHIA6, POWHEG+HERWIG6 and MCatNLO+HERWIG6, and to NLO+NNLL [14 (A. Ferroglia et al., JHEP 09 (2013) 032)-15 (H. T. Li et al., PRD 88 (2013) 074004)] calculations, when available. The lower part of each plot shows the ratio of the predictions to data. |
png pdf |
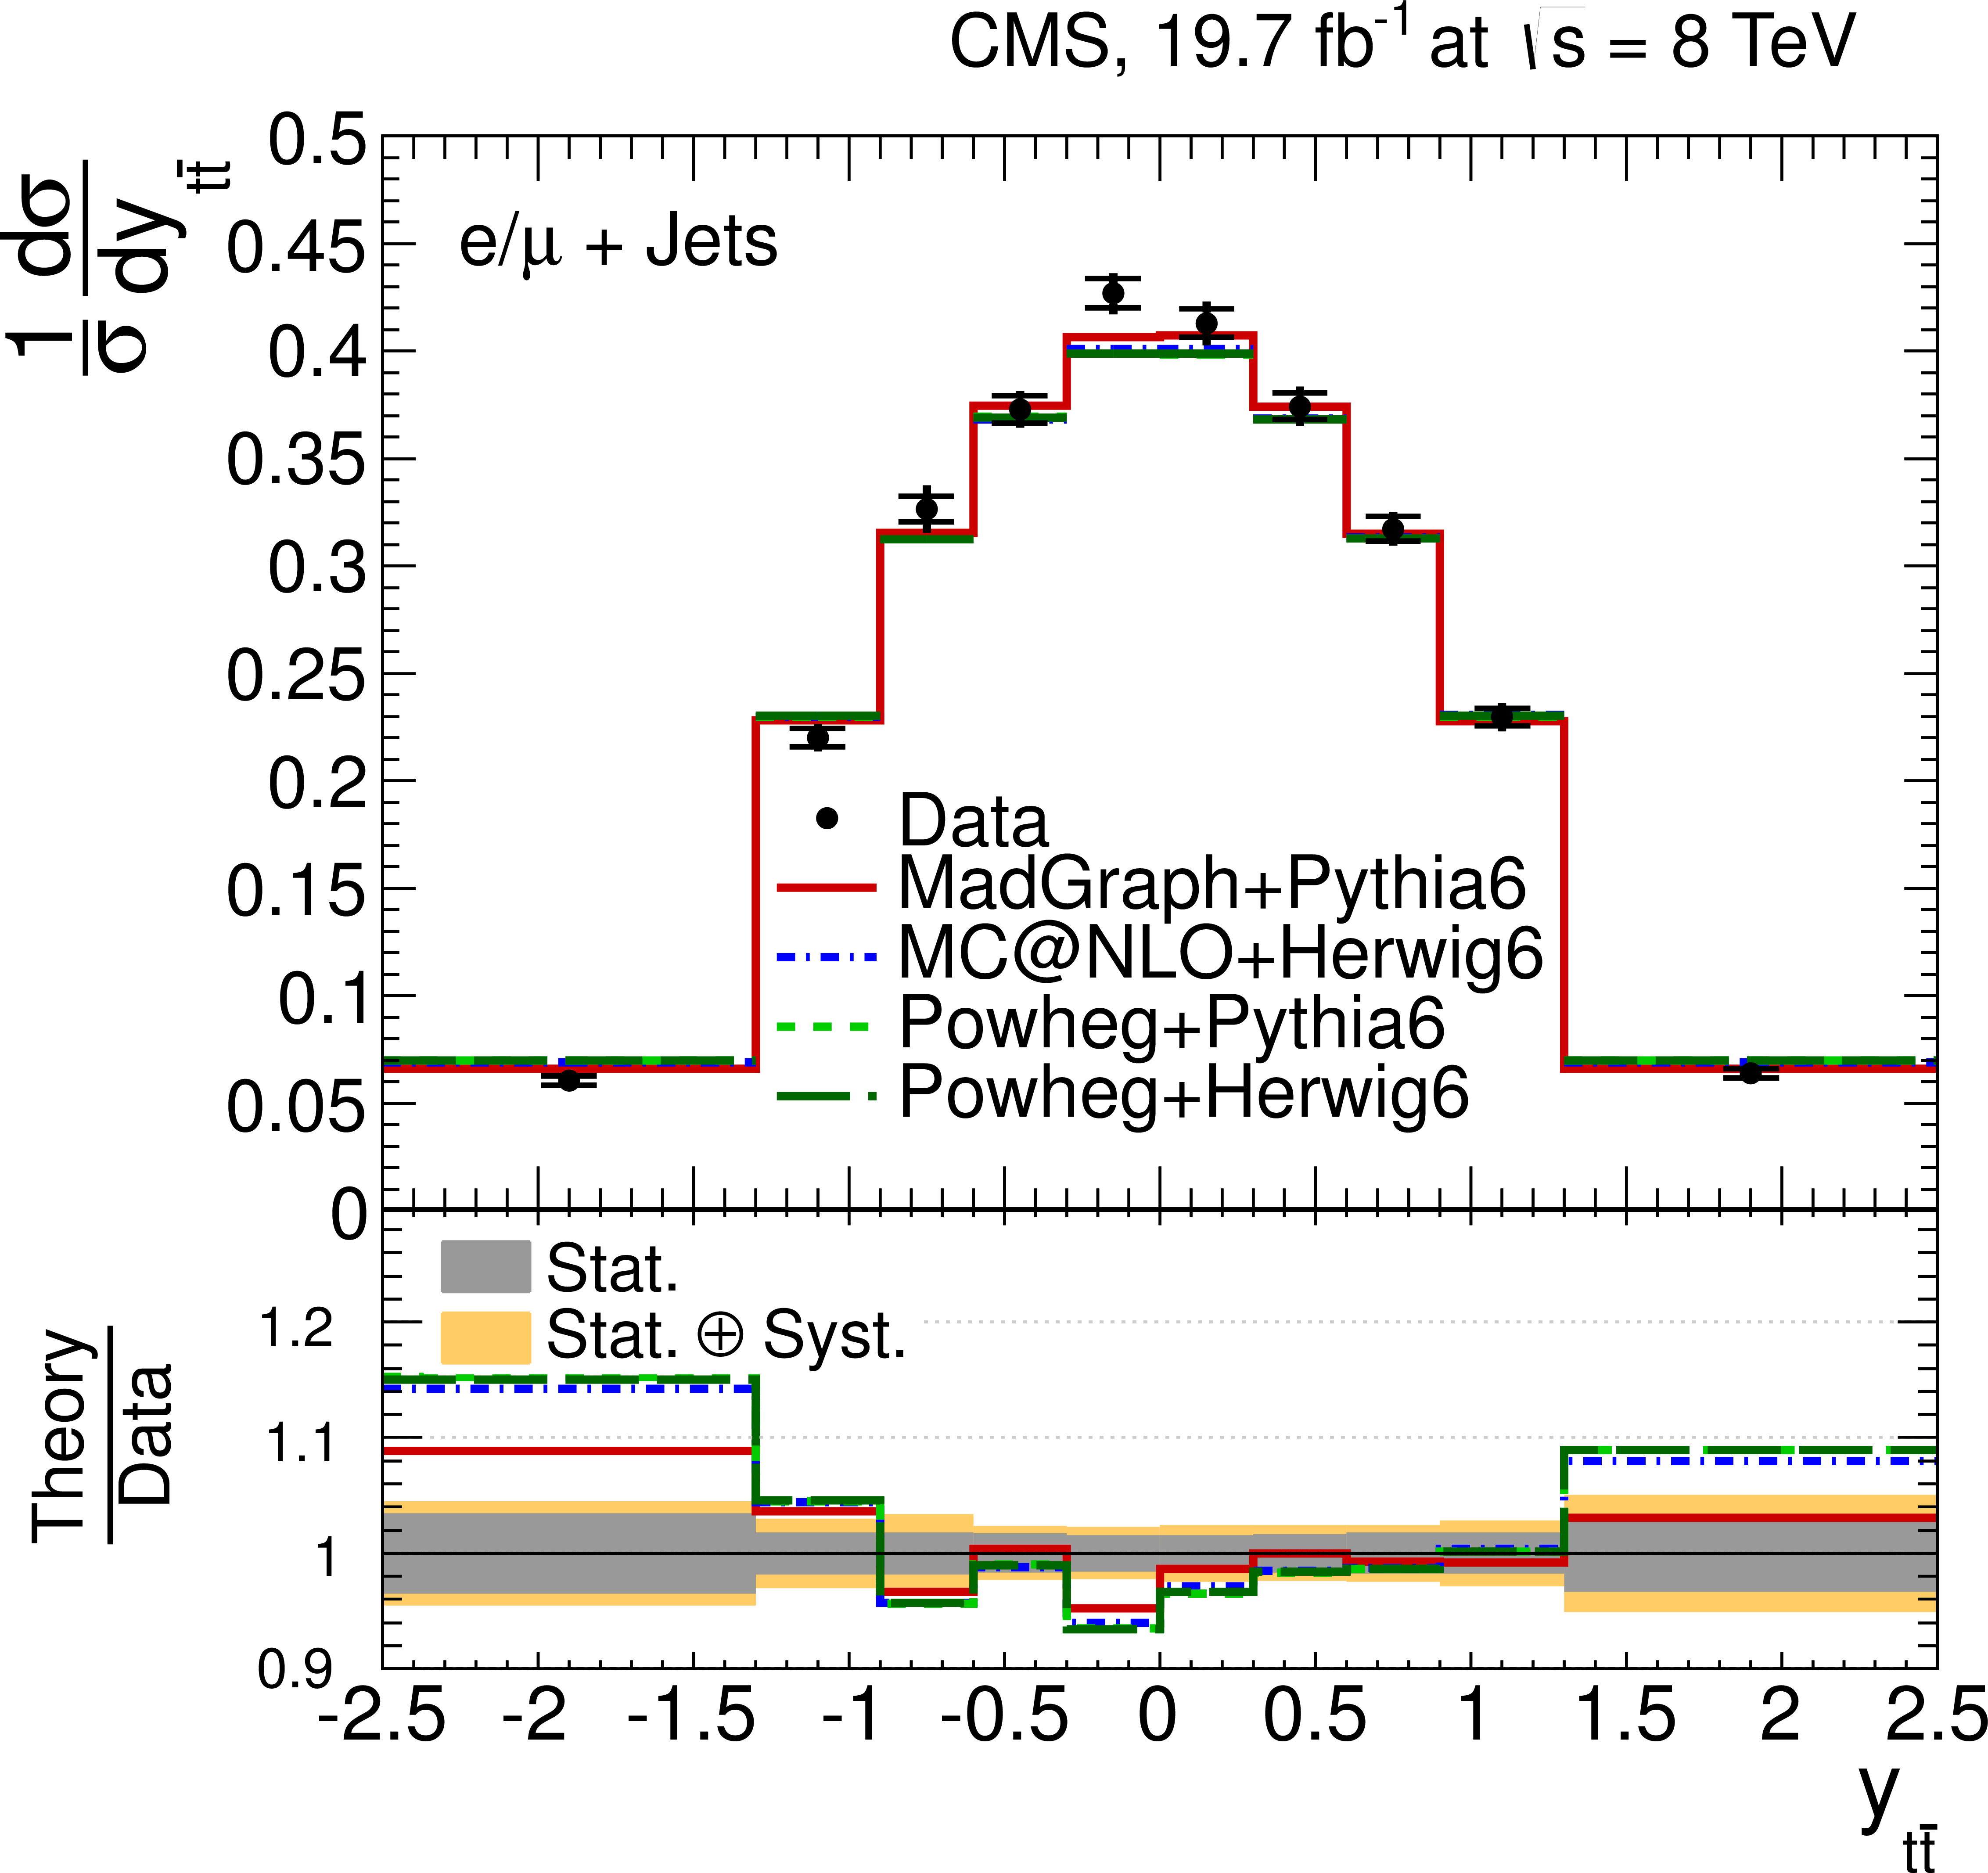
Figure 11-b:
Normalized differential $ {\mathrm {t}\overline {\mathrm {t}}} $ production cross section in the $ {\ell }$+jets channels as a function of the $ {p_{\mathrm {T}}} ^{ {\mathrm {t}\overline {\mathrm {t}}} }$ (a), $y_{ {\mathrm {t}\overline {\mathrm {t}}} }$ (b), and $m_{ {\mathrm {t}\overline {\mathrm {t}}} }$ (c) of the $ {\mathrm {t}\overline {\mathrm {t}}} $ system. The data points are placed at the midpoint of the bins. The inner (outer) error bars indicate the statistical (combined statistical and systematic) uncertainties. The measurements are compared to predictions from MadGraph+PYTHIA6, POWHEG+PYTHIA6, POWHEG+HERWIG6 and MCatNLO+HERWIG6, and to NLO+NNLL [14 (A. Ferroglia et al., JHEP 09 (2013) 032)-15 (H. T. Li et al., PRD 88 (2013) 074004)] calculations, when available. The lower part of each plot shows the ratio of the predictions to data. |

png pdf |
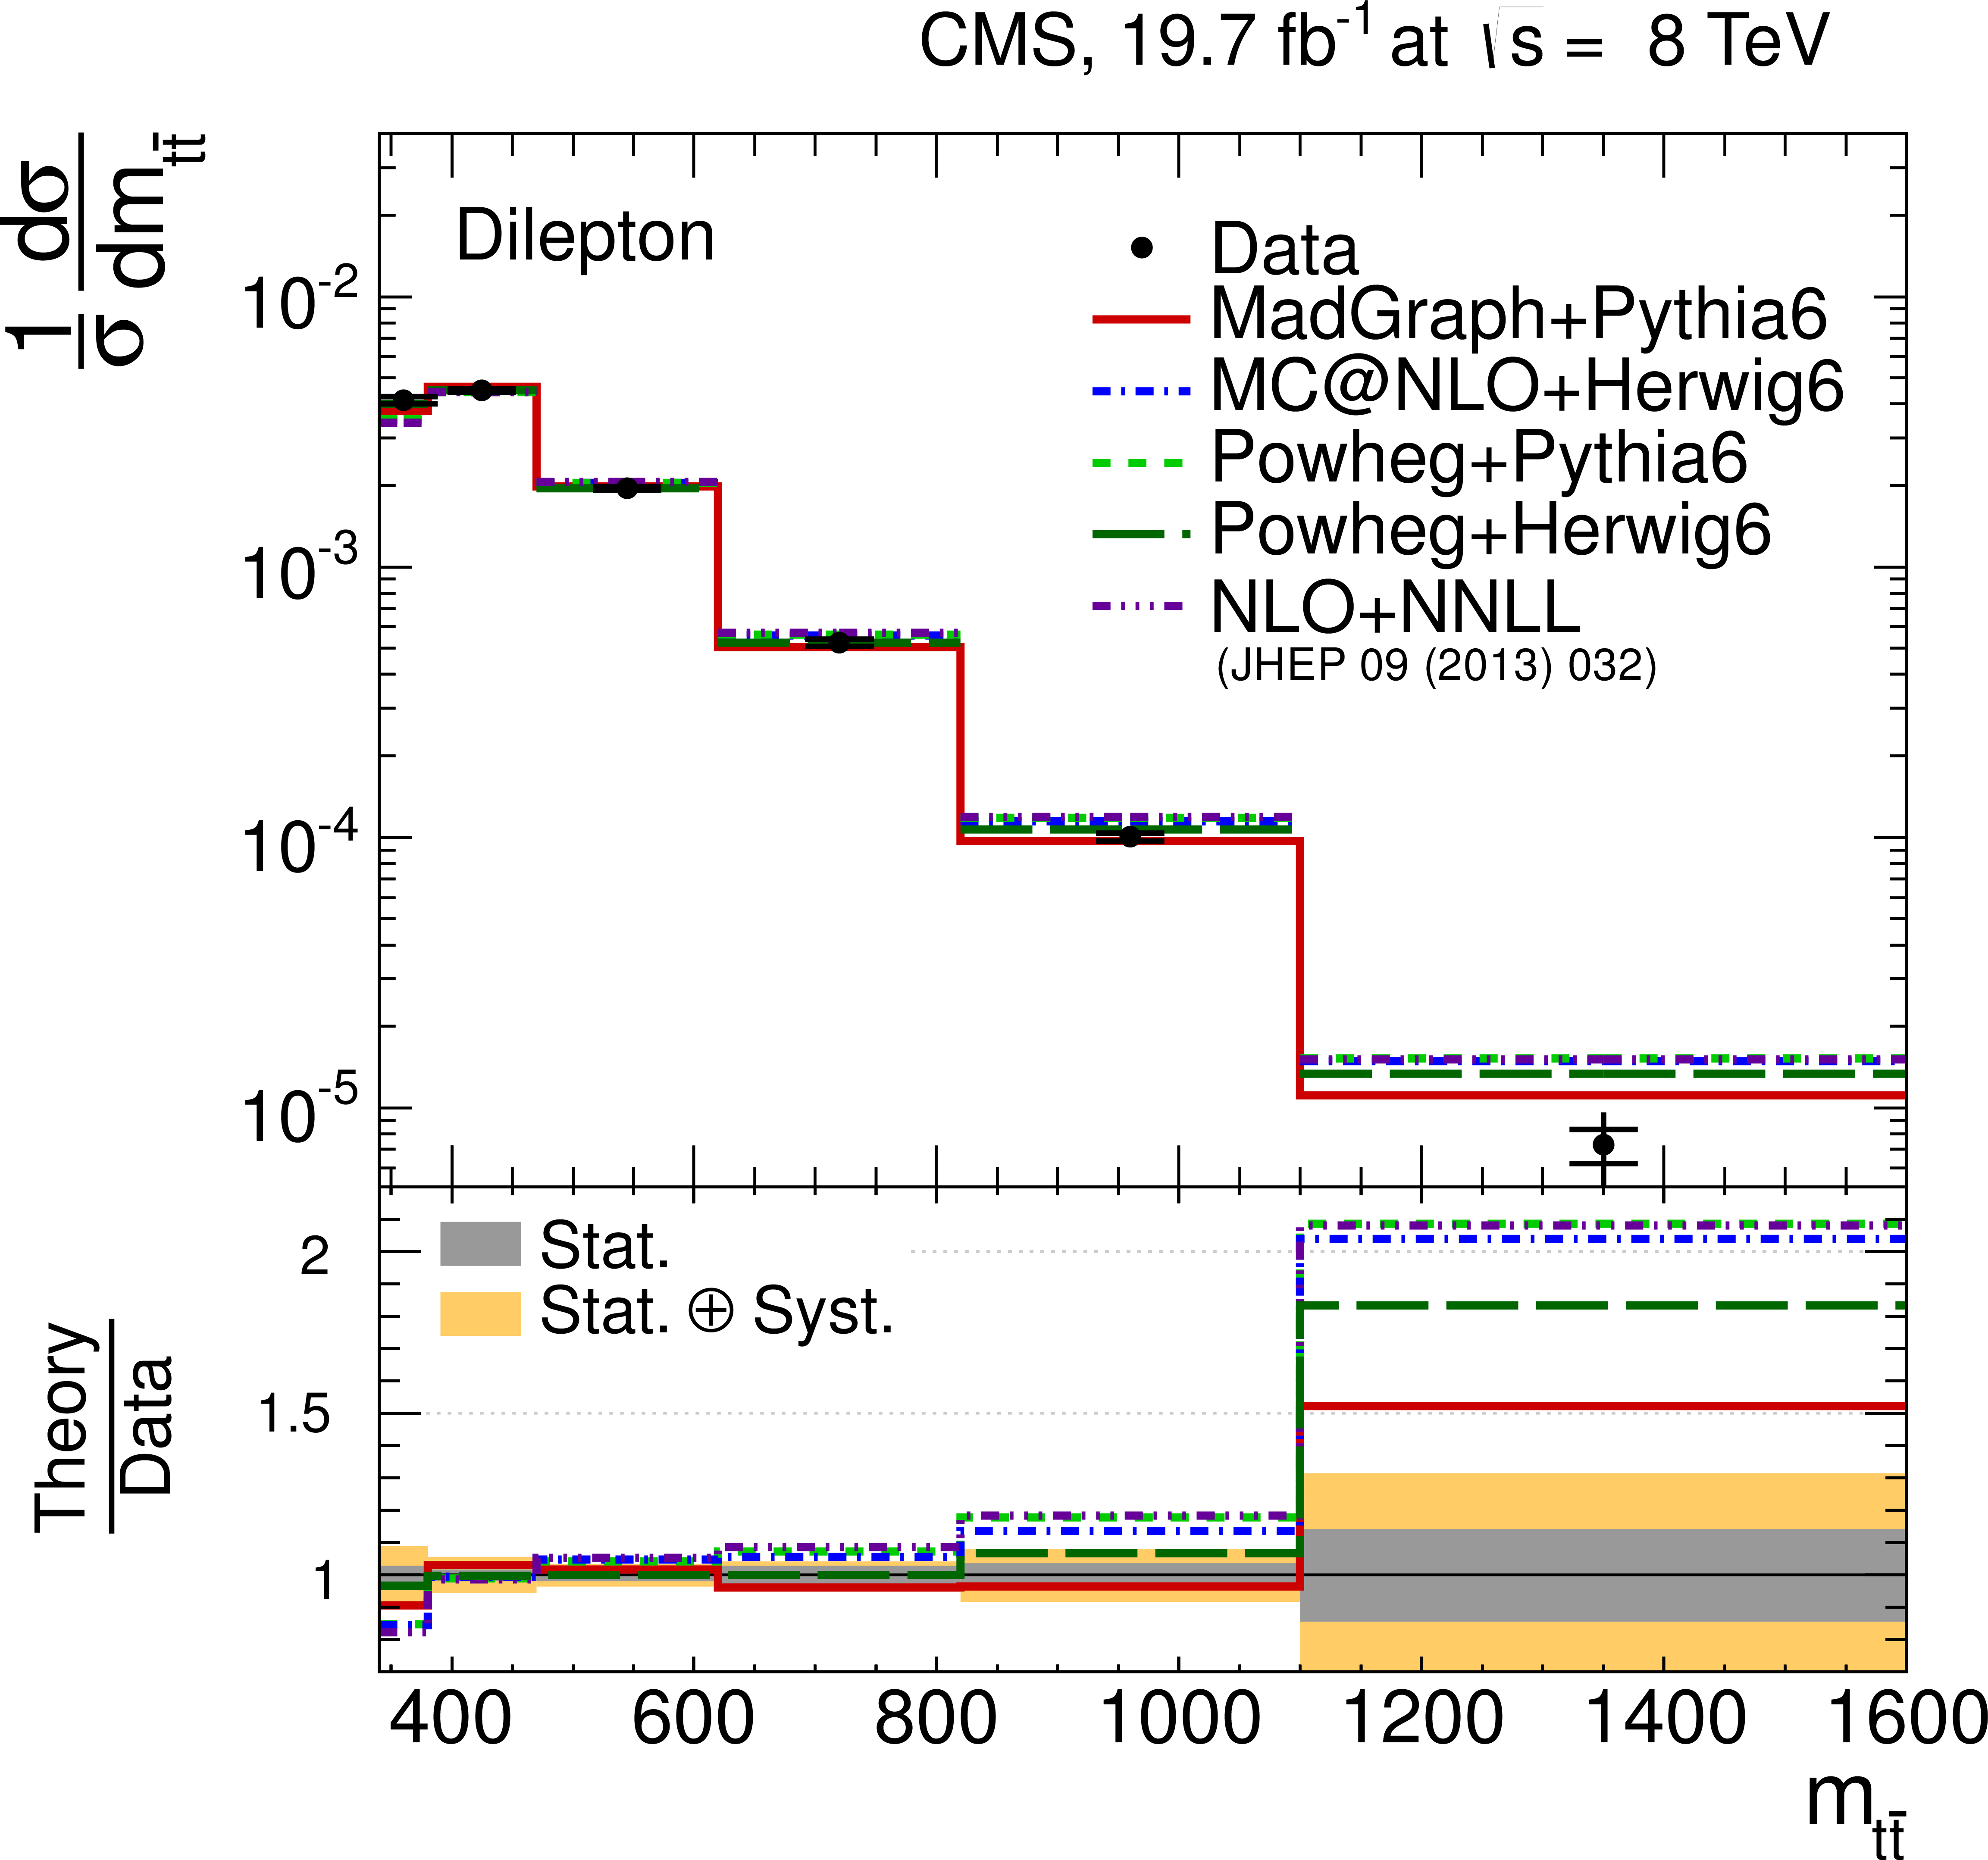
Figure 11-c:
Normalized differential $ {\mathrm {t}\overline {\mathrm {t}}} $ production cross section in the $ {\ell }$+jets channels as a function of the $ {p_{\mathrm {T}}} ^{ {\mathrm {t}\overline {\mathrm {t}}} }$ (a), $y_{ {\mathrm {t}\overline {\mathrm {t}}} }$ (b), and $m_{ {\mathrm {t}\overline {\mathrm {t}}} }$ (c) of the $ {\mathrm {t}\overline {\mathrm {t}}} $ system. The data points are placed at the midpoint of the bins. The inner (outer) error bars indicate the statistical (combined statistical and systematic) uncertainties. The measurements are compared to predictions from MadGraph+PYTHIA6, POWHEG+PYTHIA6, POWHEG+HERWIG6 and MCatNLO+HERWIG6, and to NLO+NNLL [14 (A. Ferroglia et al., JHEP 09 (2013) 032)-15 (H. T. Li et al., PRD 88 (2013) 074004)] calculations, when available. The lower part of each plot shows the ratio of the predictions to data. |

png pdf |
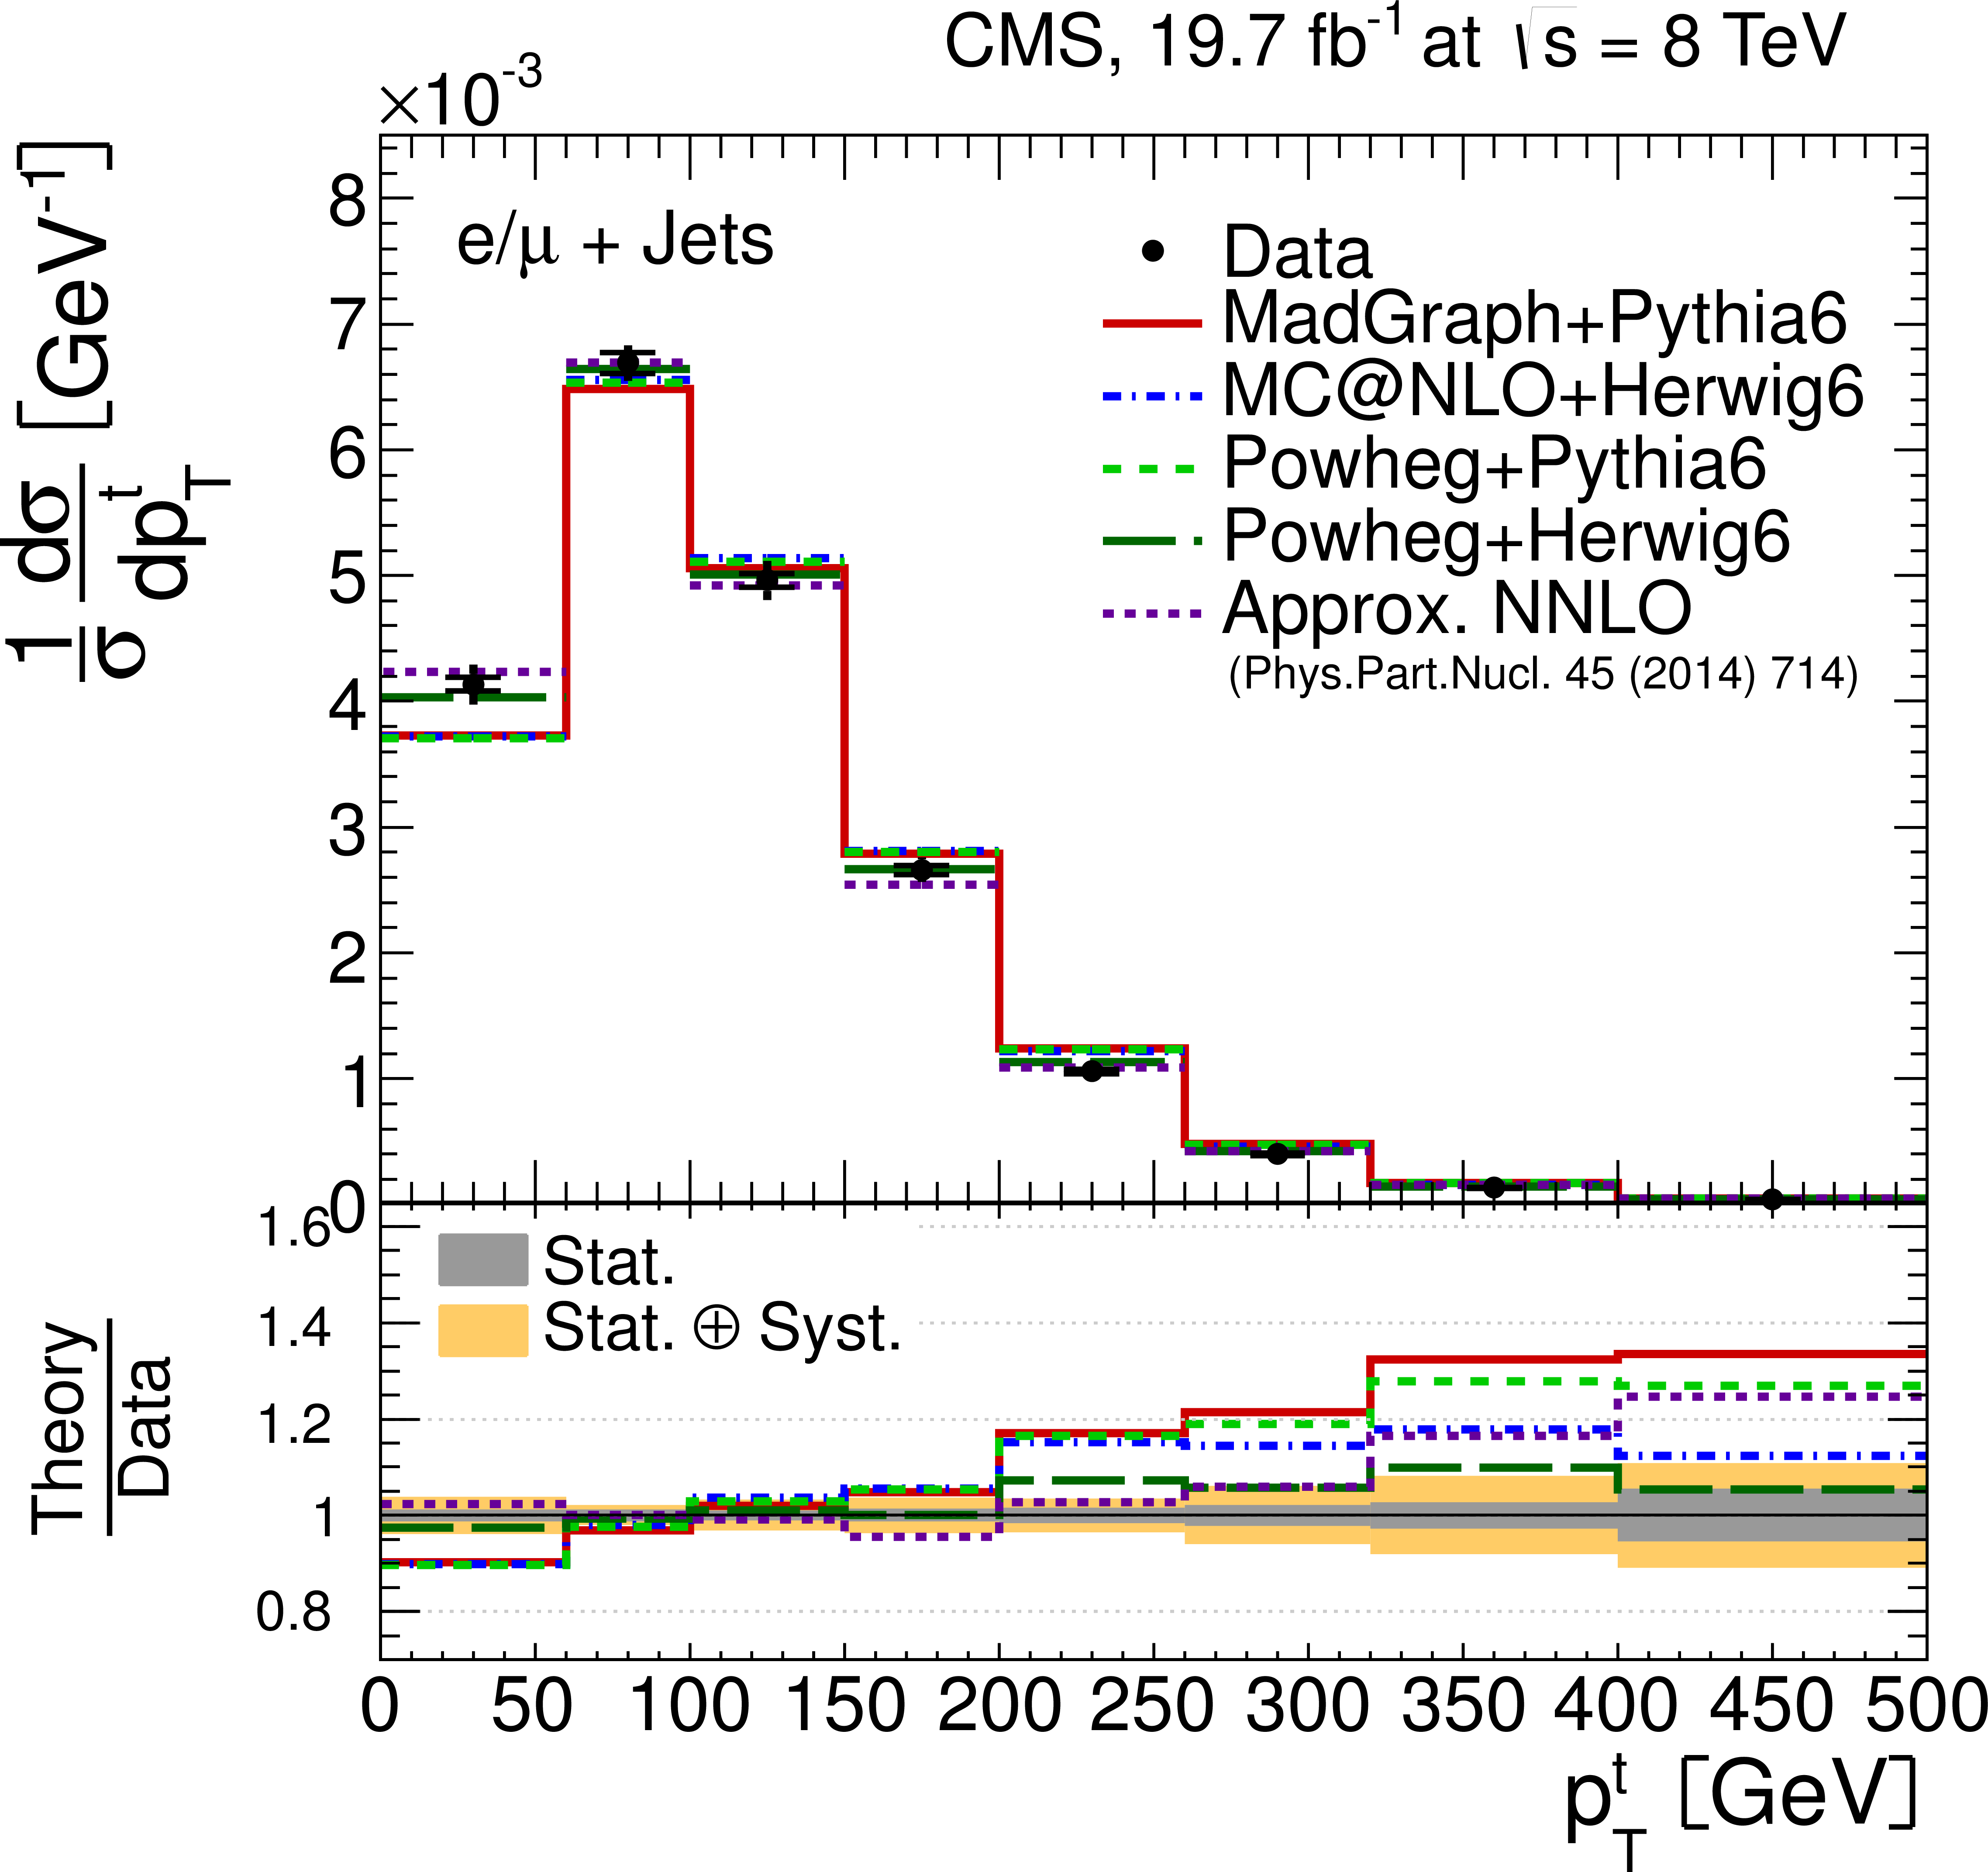
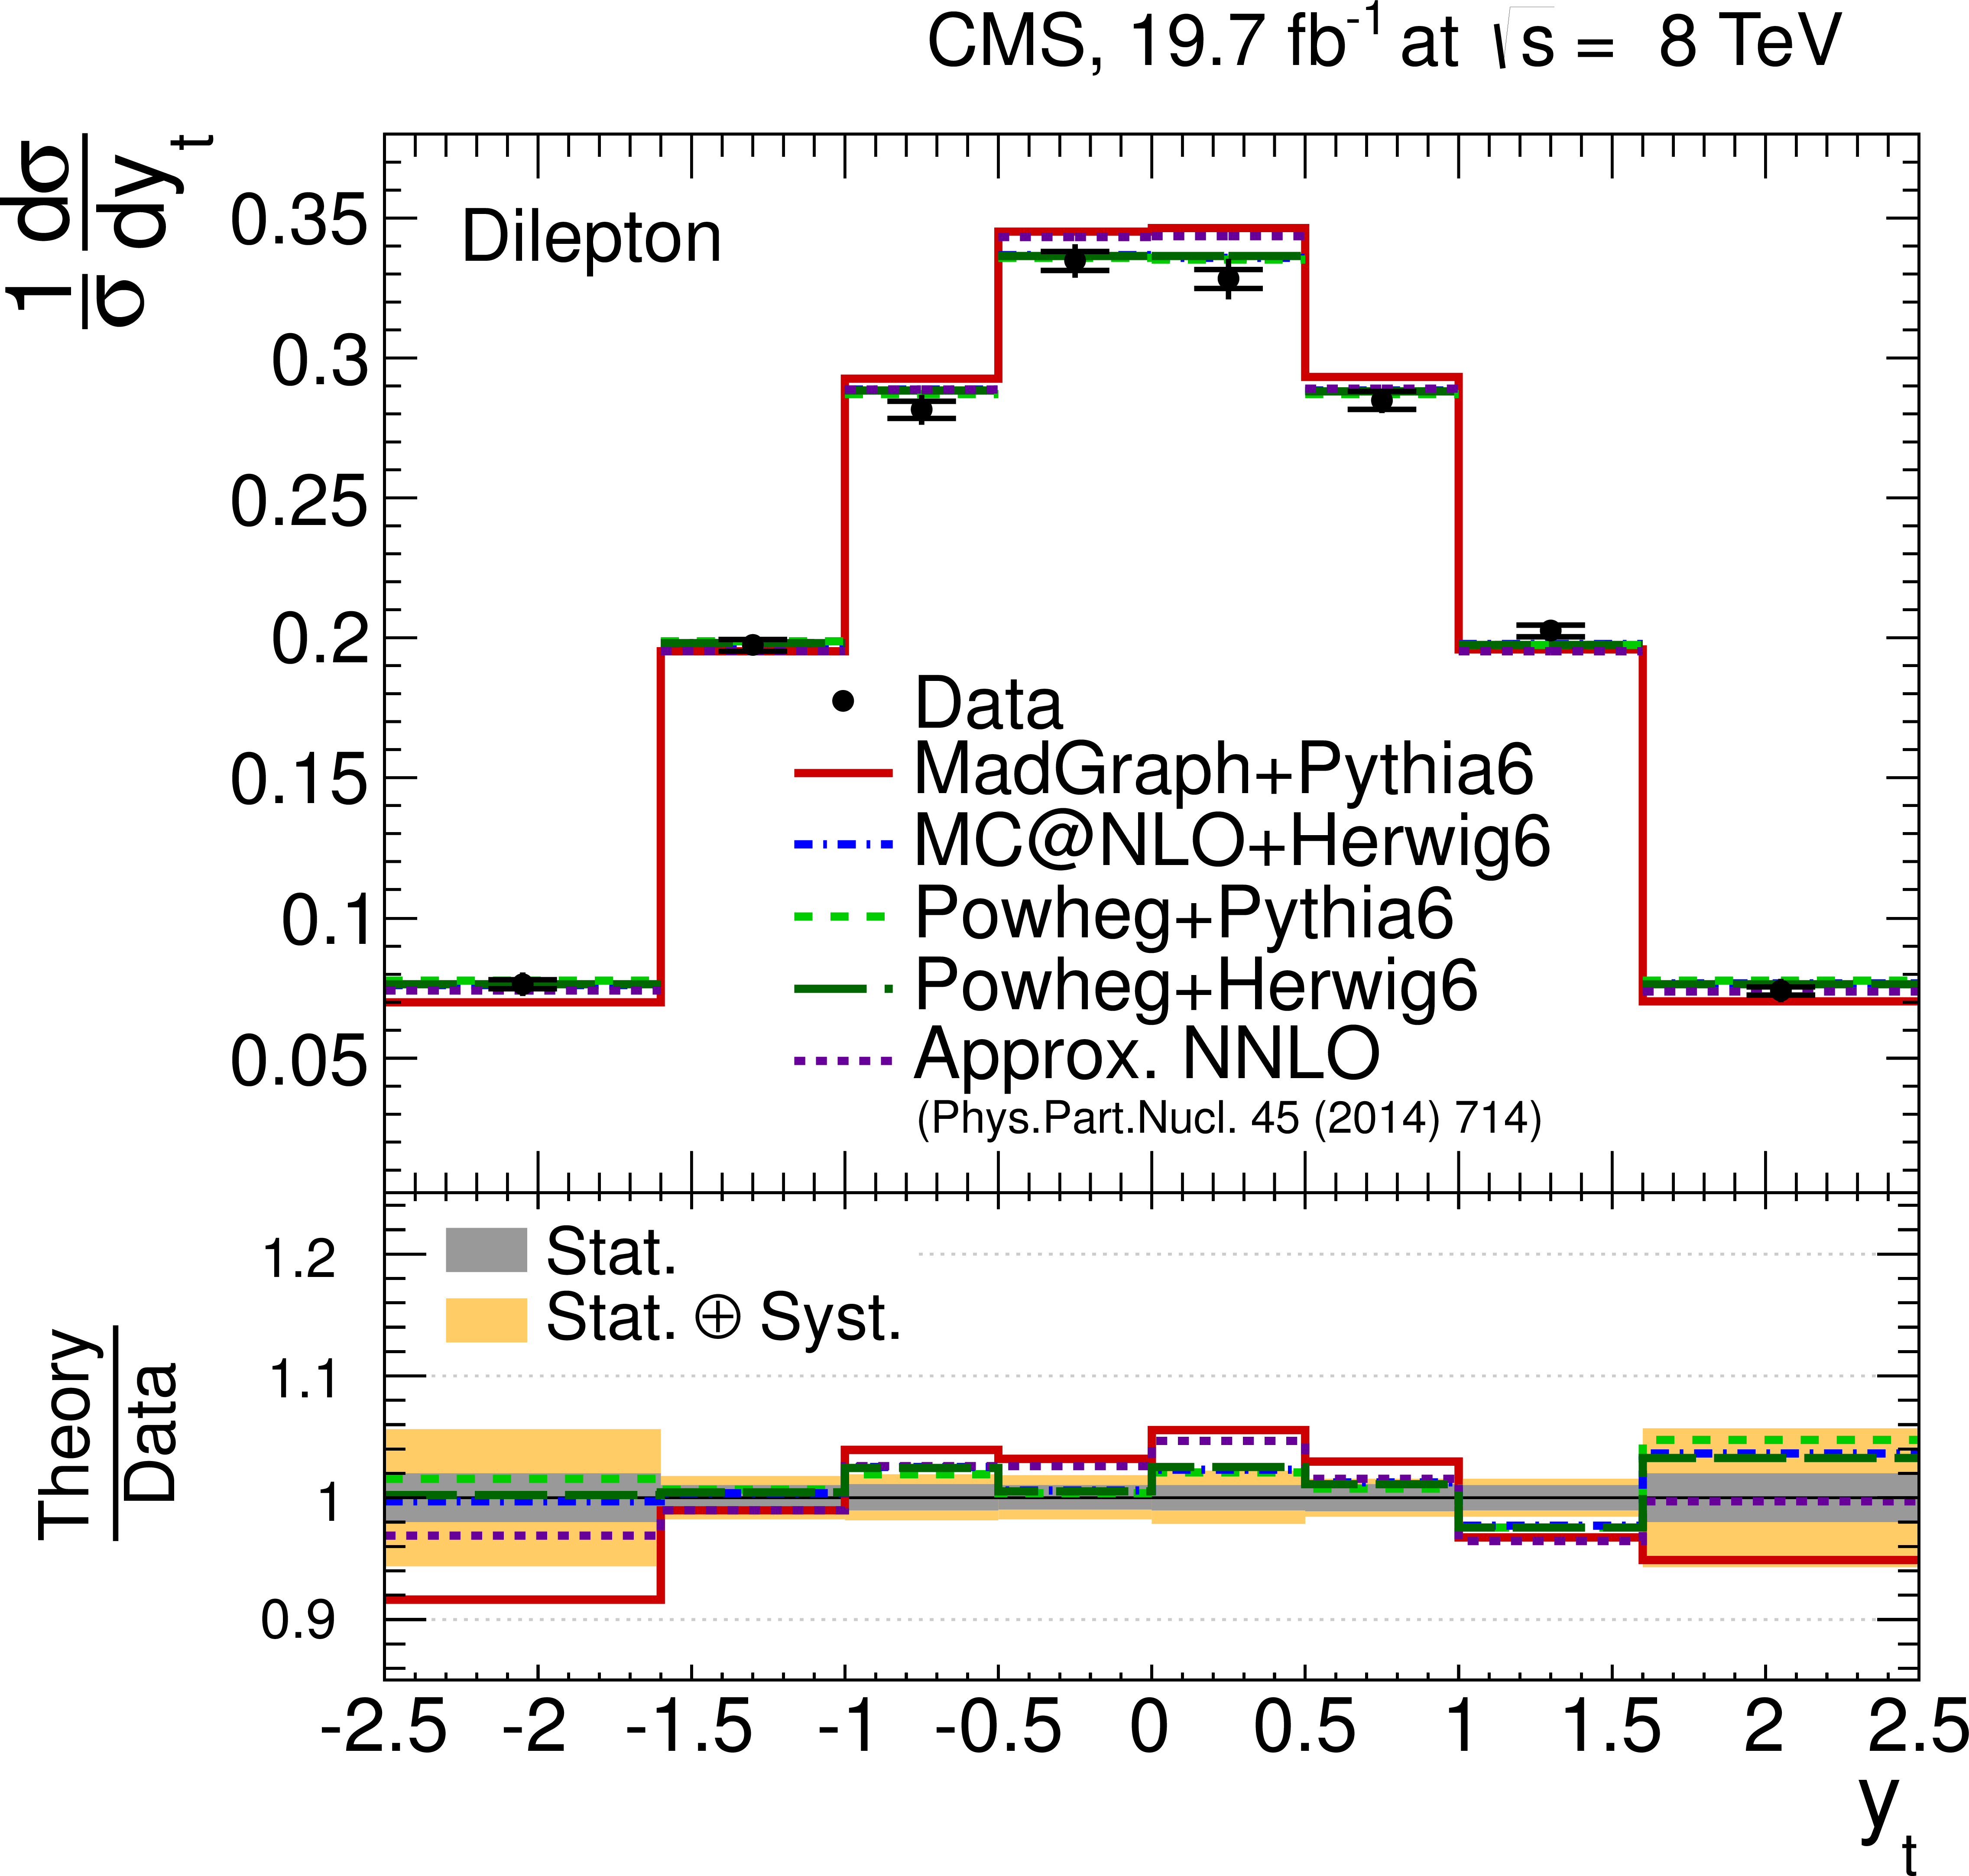
Figure 12-a:
Normalized differential $ {\mathrm {t}\overline {\mathrm {t}}} $ production cross section in the dilepton channels as a function of the $ {p_{\mathrm {T}}} ^{ {\mathrm {t}} }$ (a), the $ {\mathrm {t}\overline {\mathrm {t}}} $ rest frame $ {p_{\mathrm {T}}} ^{ {\mathrm {t}} \ast }$ (b), and the rapidity $y_{ {\mathrm {t}} }$ (c) of the top quarks or antiquarks, and the difference in the azimuthal angle between the top quark and the antiquark $\Delta \phi (\mathrm{ t , \bar{t} })$ (d). The data points are placed at the midpoint of the bins. The inner (outer) error bars indicate the statistical (combined statistical and systematic) uncertainties. The measurements are compared to predictions from MadGraph+PYTHIA6, POWHEG+PYTHIA6, POWHEG+HERWIG6 and MCatNLO+HERWIG6, and to approximate NNLO [16 (N. Kidonakis, PPN 45 (2014) 714)] calculations, when available. The lower part of each plot shows the ratio of the predictions to data. |

png pdf |
Figure 12-b:
Normalized differential $ {\mathrm {t}\overline {\mathrm {t}}} $ production cross section in the dilepton channels as a function of the $ {p_{\mathrm {T}}} ^{ {\mathrm {t}} }$ (a), the $ {\mathrm {t}\overline {\mathrm {t}}} $ rest frame $ {p_{\mathrm {T}}} ^{ {\mathrm {t}} \ast }$ (b), and the rapidity $y_{ {\mathrm {t}} }$ (c) of the top quarks or antiquarks, and the difference in the azimuthal angle between the top quark and the antiquark $\Delta \phi (\mathrm{ t , \bar{t} })$ (d). The data points are placed at the midpoint of the bins. The inner (outer) error bars indicate the statistical (combined statistical and systematic) uncertainties. The measurements are compared to predictions from MadGraph+PYTHIA6, POWHEG+PYTHIA6, POWHEG+HERWIG6 and MCatNLO+HERWIG6, and to approximate NNLO [16 (N. Kidonakis, PPN 45 (2014) 714)] calculations, when available. The lower part of each plot shows the ratio of the predictions to data. |
png pdf |
Figure 12-c:
Normalized differential $ {\mathrm {t}\overline {\mathrm {t}}} $ production cross section in the dilepton channels as a function of the $ {p_{\mathrm {T}}} ^{ {\mathrm {t}} }$ (a), the $ {\mathrm {t}\overline {\mathrm {t}}} $ rest frame $ {p_{\mathrm {T}}} ^{ {\mathrm {t}} \ast }$ (b), and the rapidity $y_{ {\mathrm {t}} }$ (c) of the top quarks or antiquarks, and the difference in the azimuthal angle between the top quark and the antiquark $\Delta \phi (\mathrm{ t , \bar{t} })$ (d). The data points are placed at the midpoint of the bins. The inner (outer) error bars indicate the statistical (combined statistical and systematic) uncertainties. The measurements are compared to predictions from MadGraph+PYTHIA6, POWHEG+PYTHIA6, POWHEG+HERWIG6 and MCatNLO+HERWIG6, and to approximate NNLO [16 (N. Kidonakis, PPN 45 (2014) 714)] calculations, when available. The lower part of each plot shows the ratio of the predictions to data. |
png pdf |
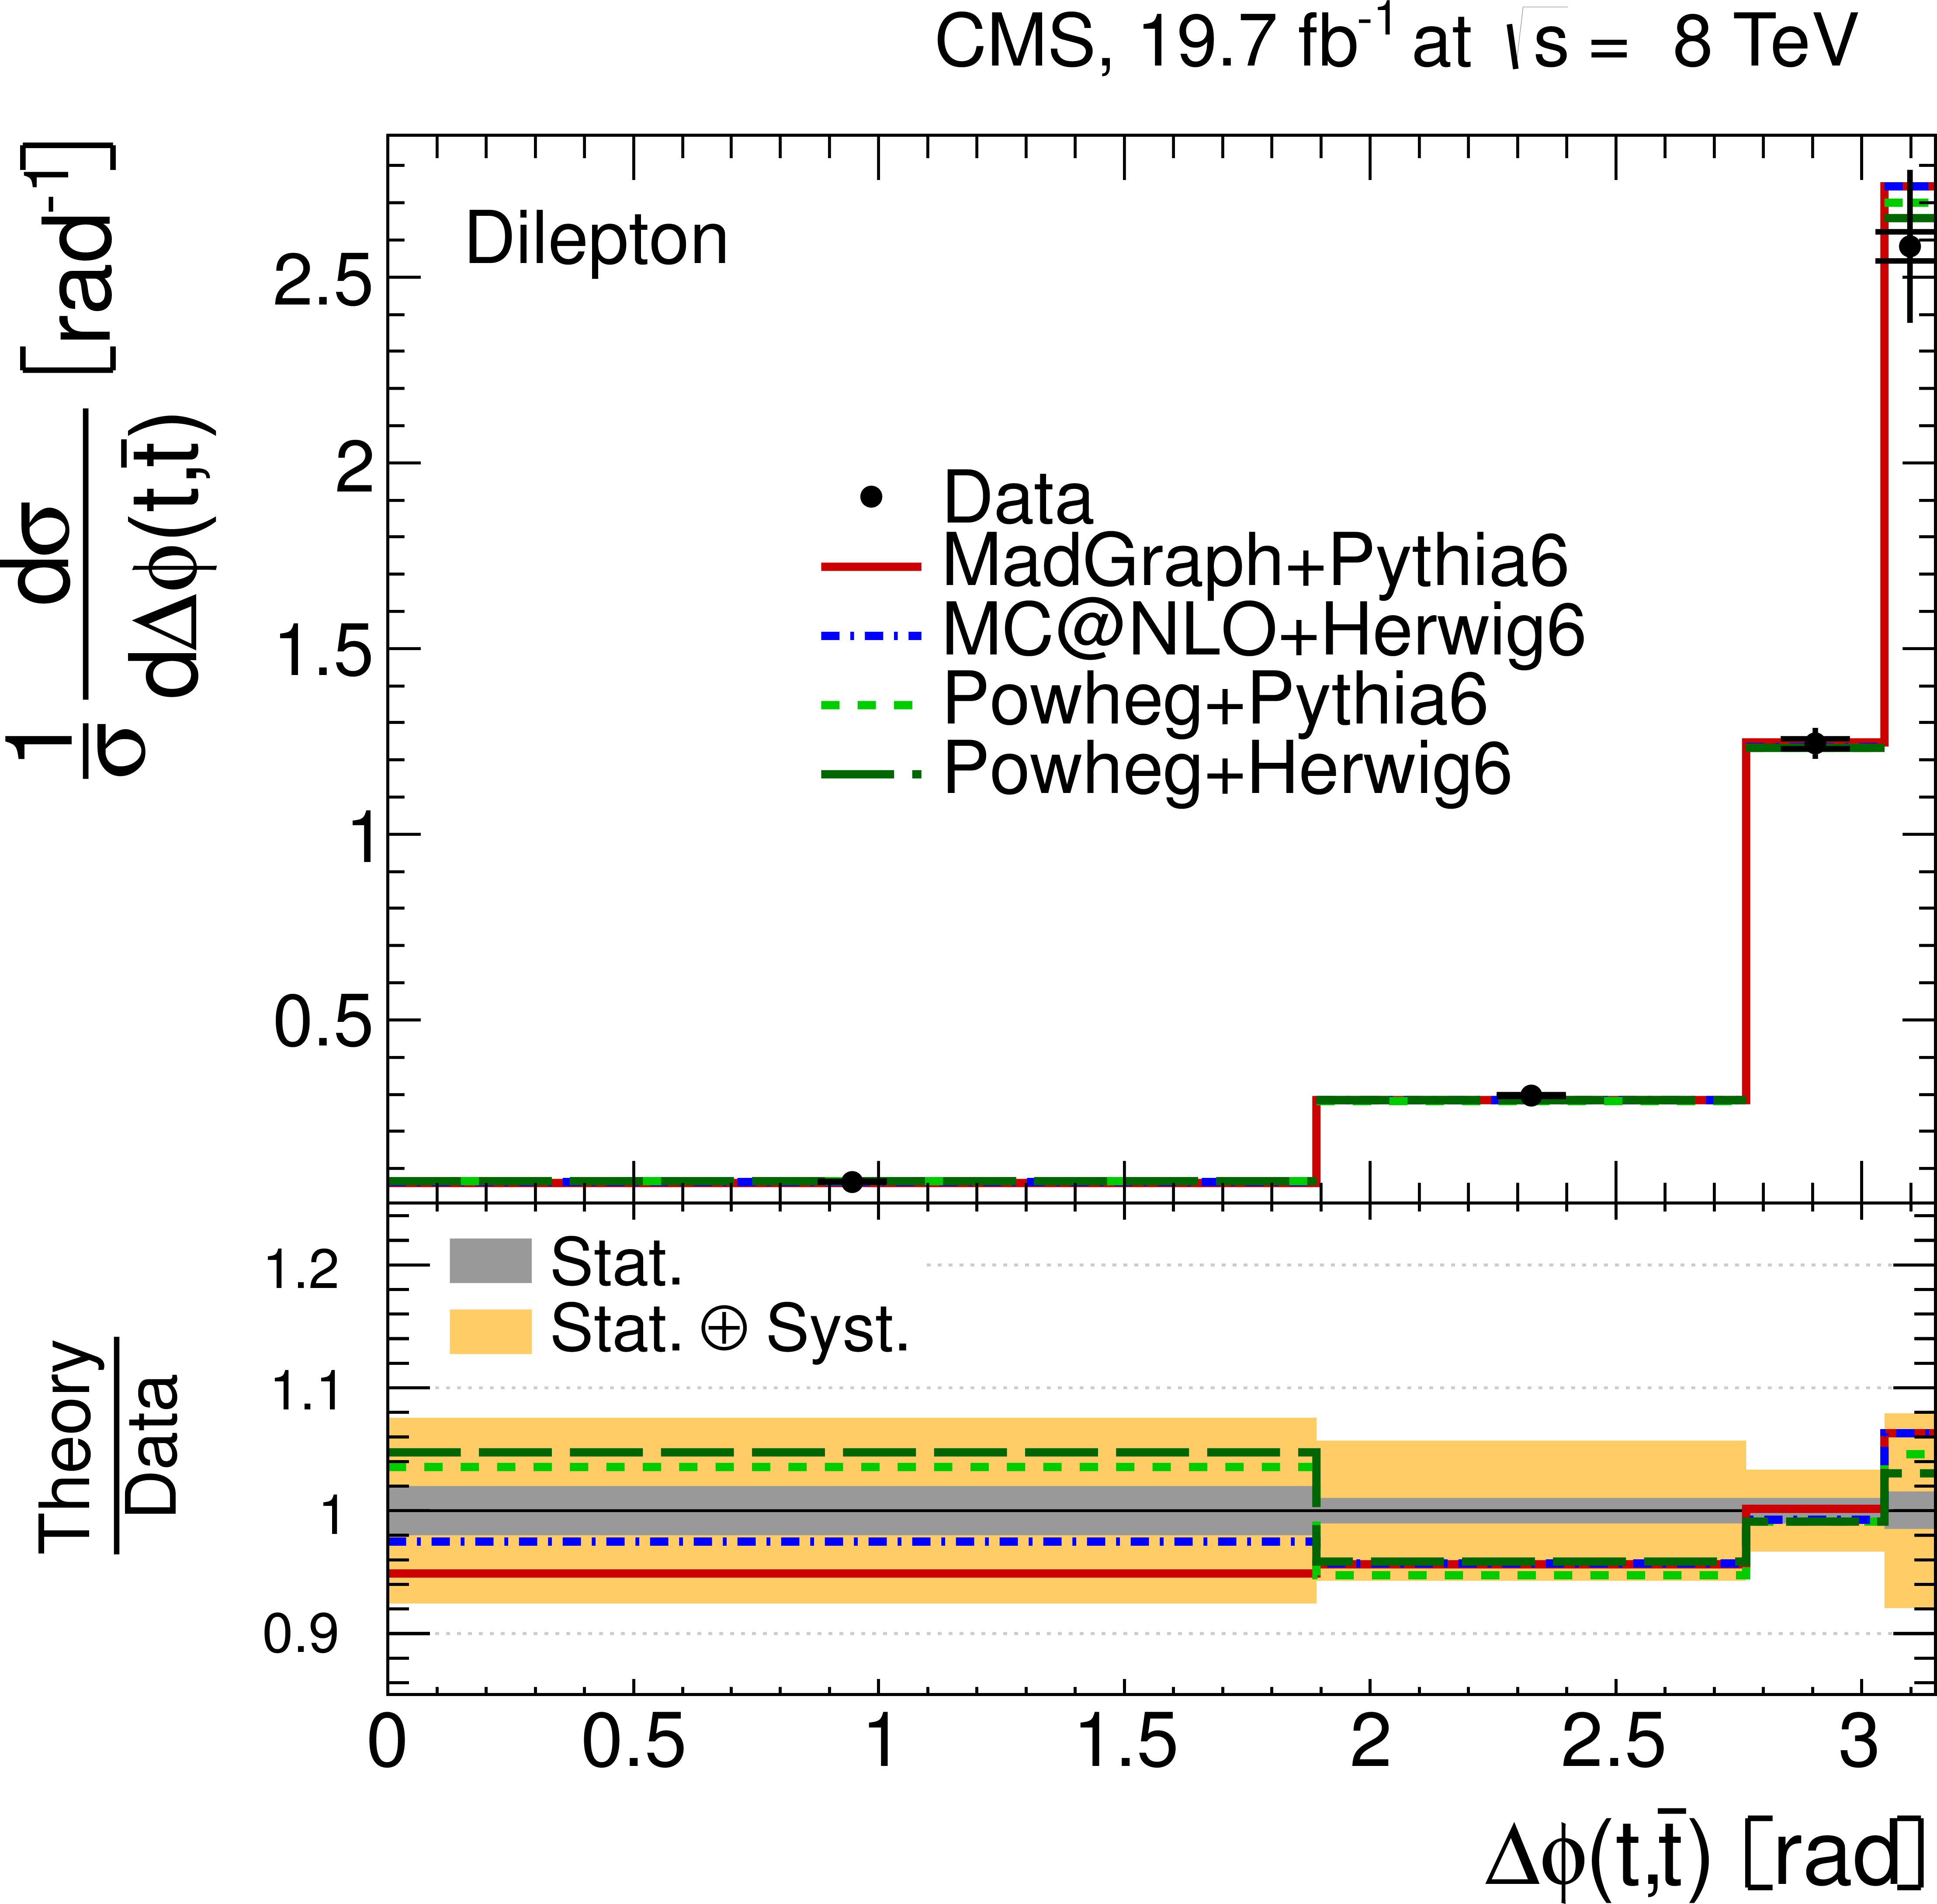
Figure 12-d:
Normalized differential $ {\mathrm {t}\overline {\mathrm {t}}} $ production cross section in the dilepton channels as a function of the $ {p_{\mathrm {T}}} ^{ {\mathrm {t}} }$ (a), the $ {\mathrm {t}\overline {\mathrm {t}}} $ rest frame $ {p_{\mathrm {T}}} ^{ {\mathrm {t}} \ast }$ (b), and the rapidity $y_{ {\mathrm {t}} }$ (c) of the top quarks or antiquarks, and the difference in the azimuthal angle between the top quark and the antiquark $\Delta \phi (\mathrm{ t , \bar{t} })$ (d). The data points are placed at the midpoint of the bins. The inner (outer) error bars indicate the statistical (combined statistical and systematic) uncertainties. The measurements are compared to predictions from MadGraph+PYTHIA6, POWHEG+PYTHIA6, POWHEG+HERWIG6 and MCatNLO+HERWIG6, and to approximate NNLO [16 (N. Kidonakis, PPN 45 (2014) 714)] calculations, when available. The lower part of each plot shows the ratio of the predictions to data. |

png pdf |
Figure 13-a:
Normalized differential $ {\mathrm {t}\overline {\mathrm {t}}} $ production cross section in the dilepton channels as a function of the $ {p_{\mathrm {T}}} $ of the leading (a) and trailing (b) top quarks or antiquarks. The data points are placed at the midpoint of the bins. The inner (outer) error bars indicate the statistical (combined statistical and systematic) uncertainties. The measurements are compared to predictions from MadGraph+PYTHIA6, POWHEG+PYTHIA6, POWHEG+HERWIG6 and MCatNLO+HERWIG6. The lower part of each plot shows the ratio of the predictions to data. |
png pdf |
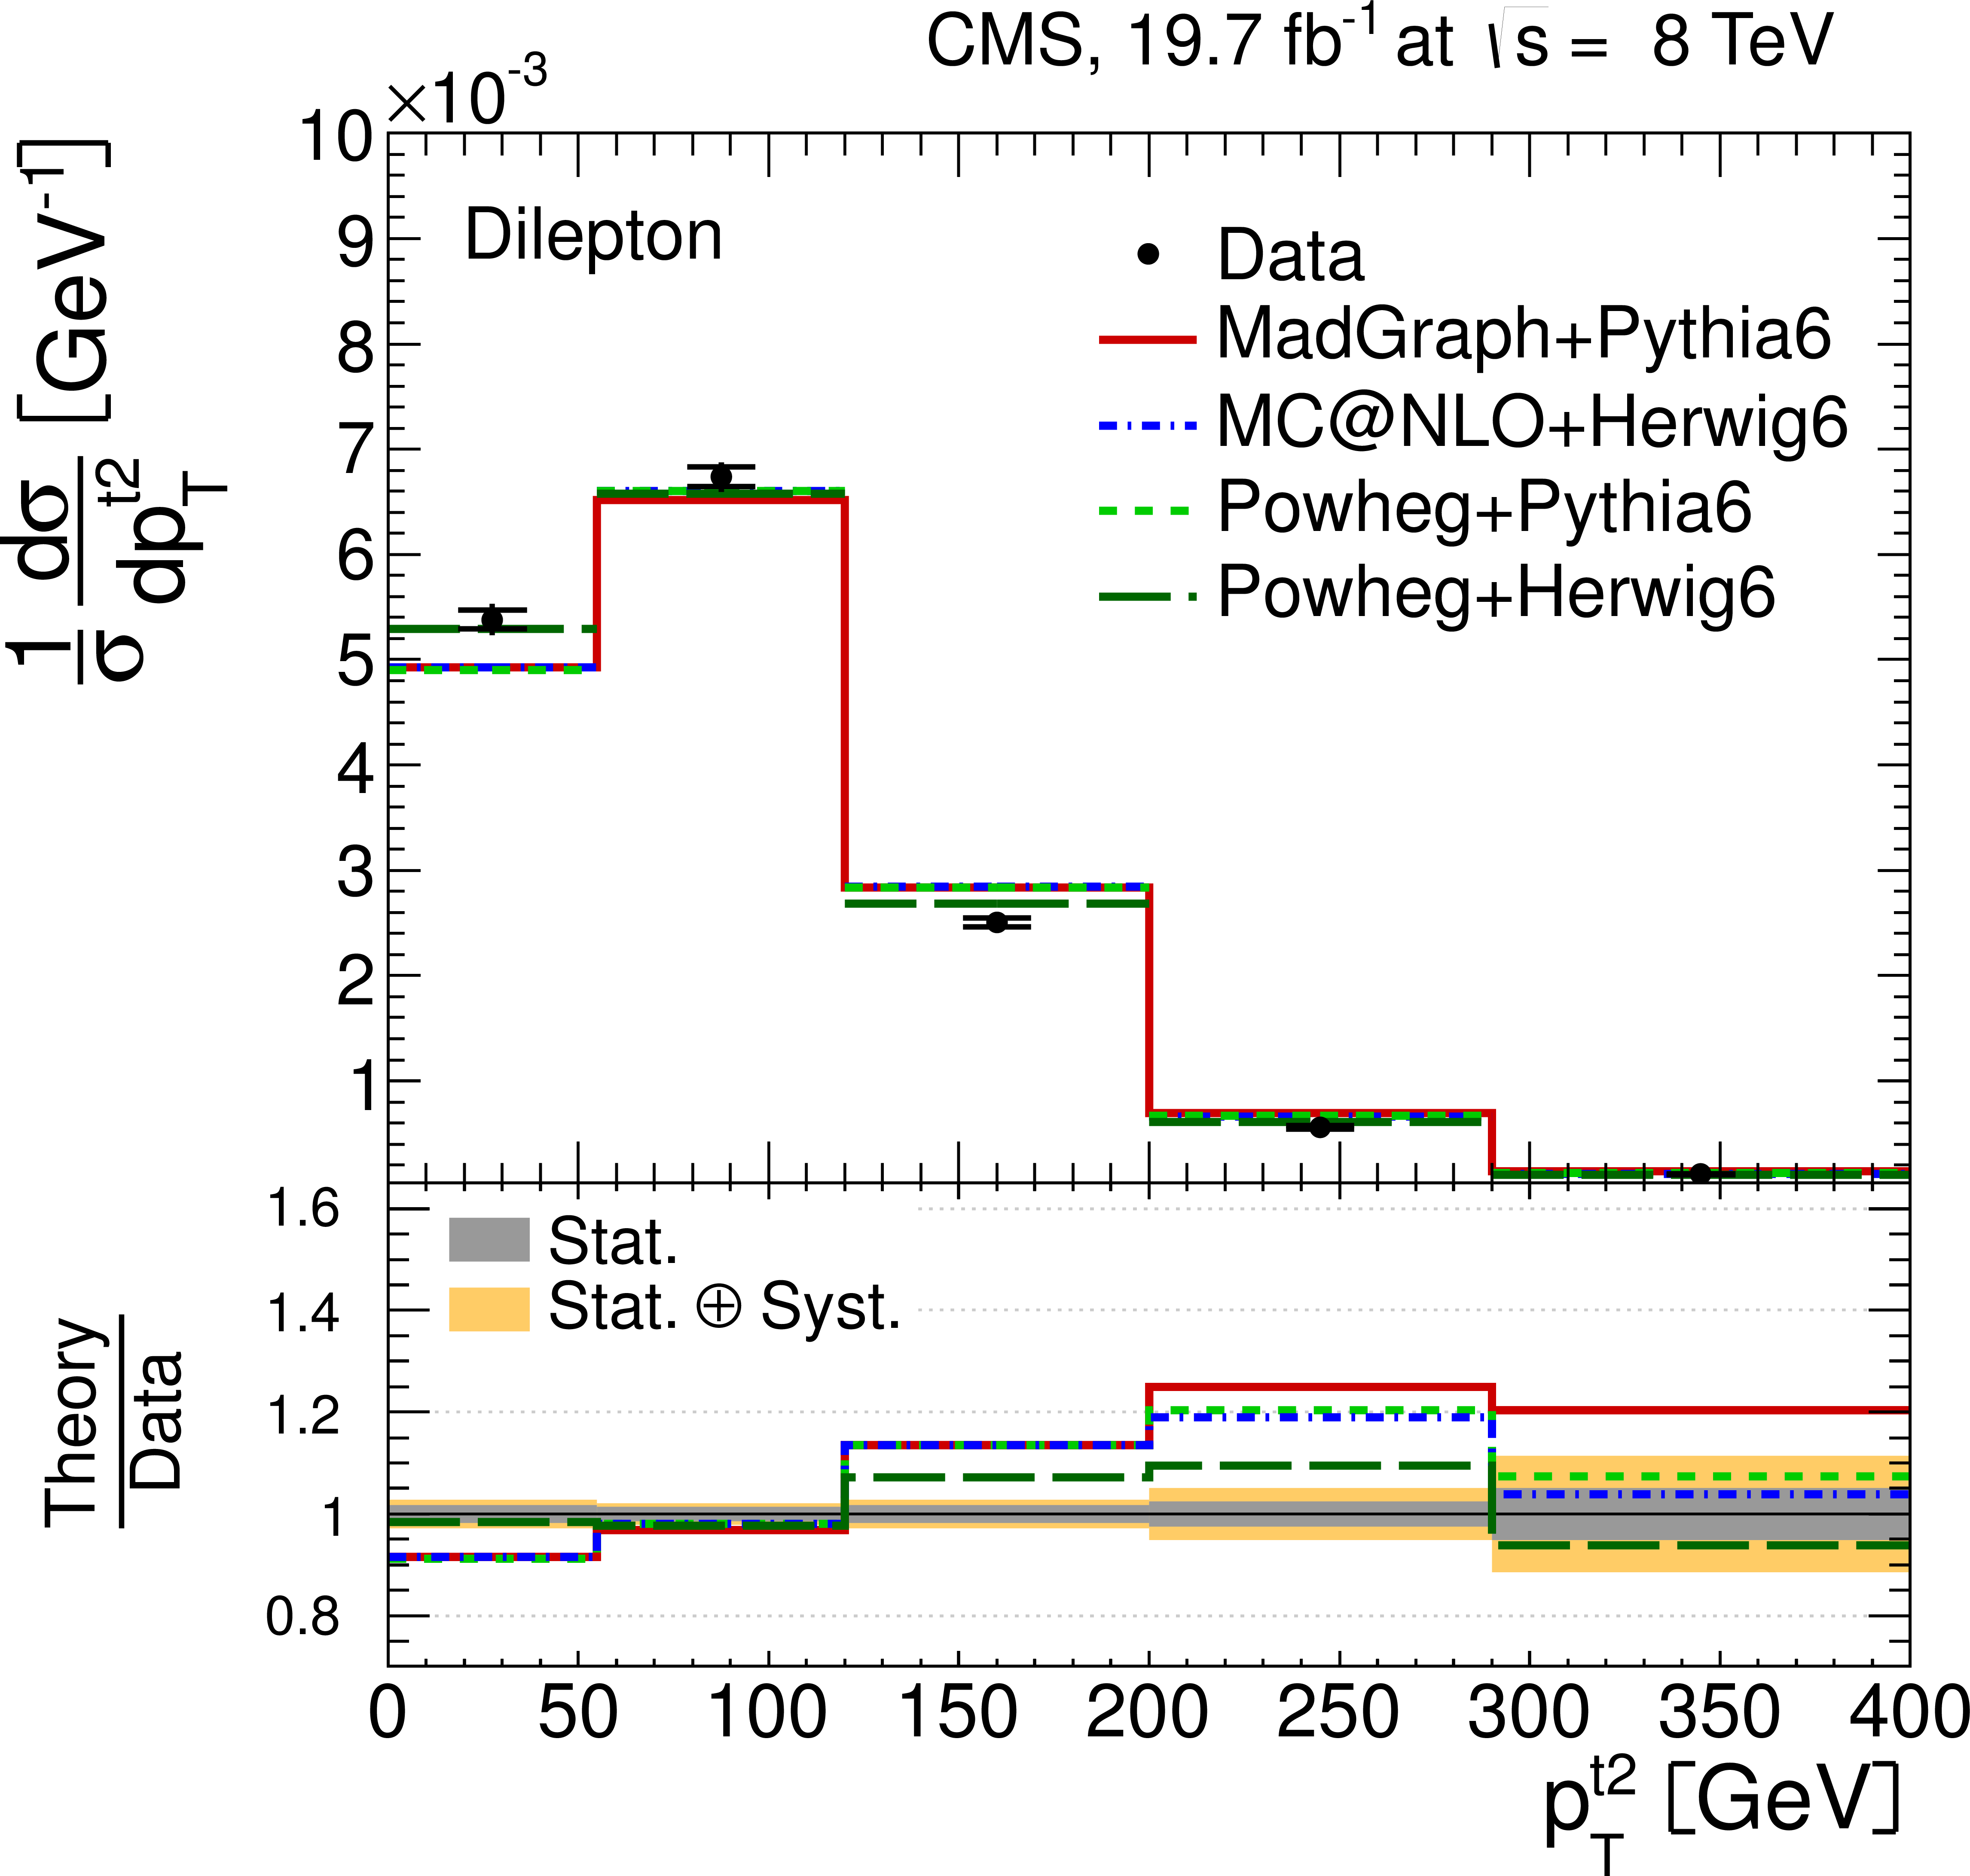
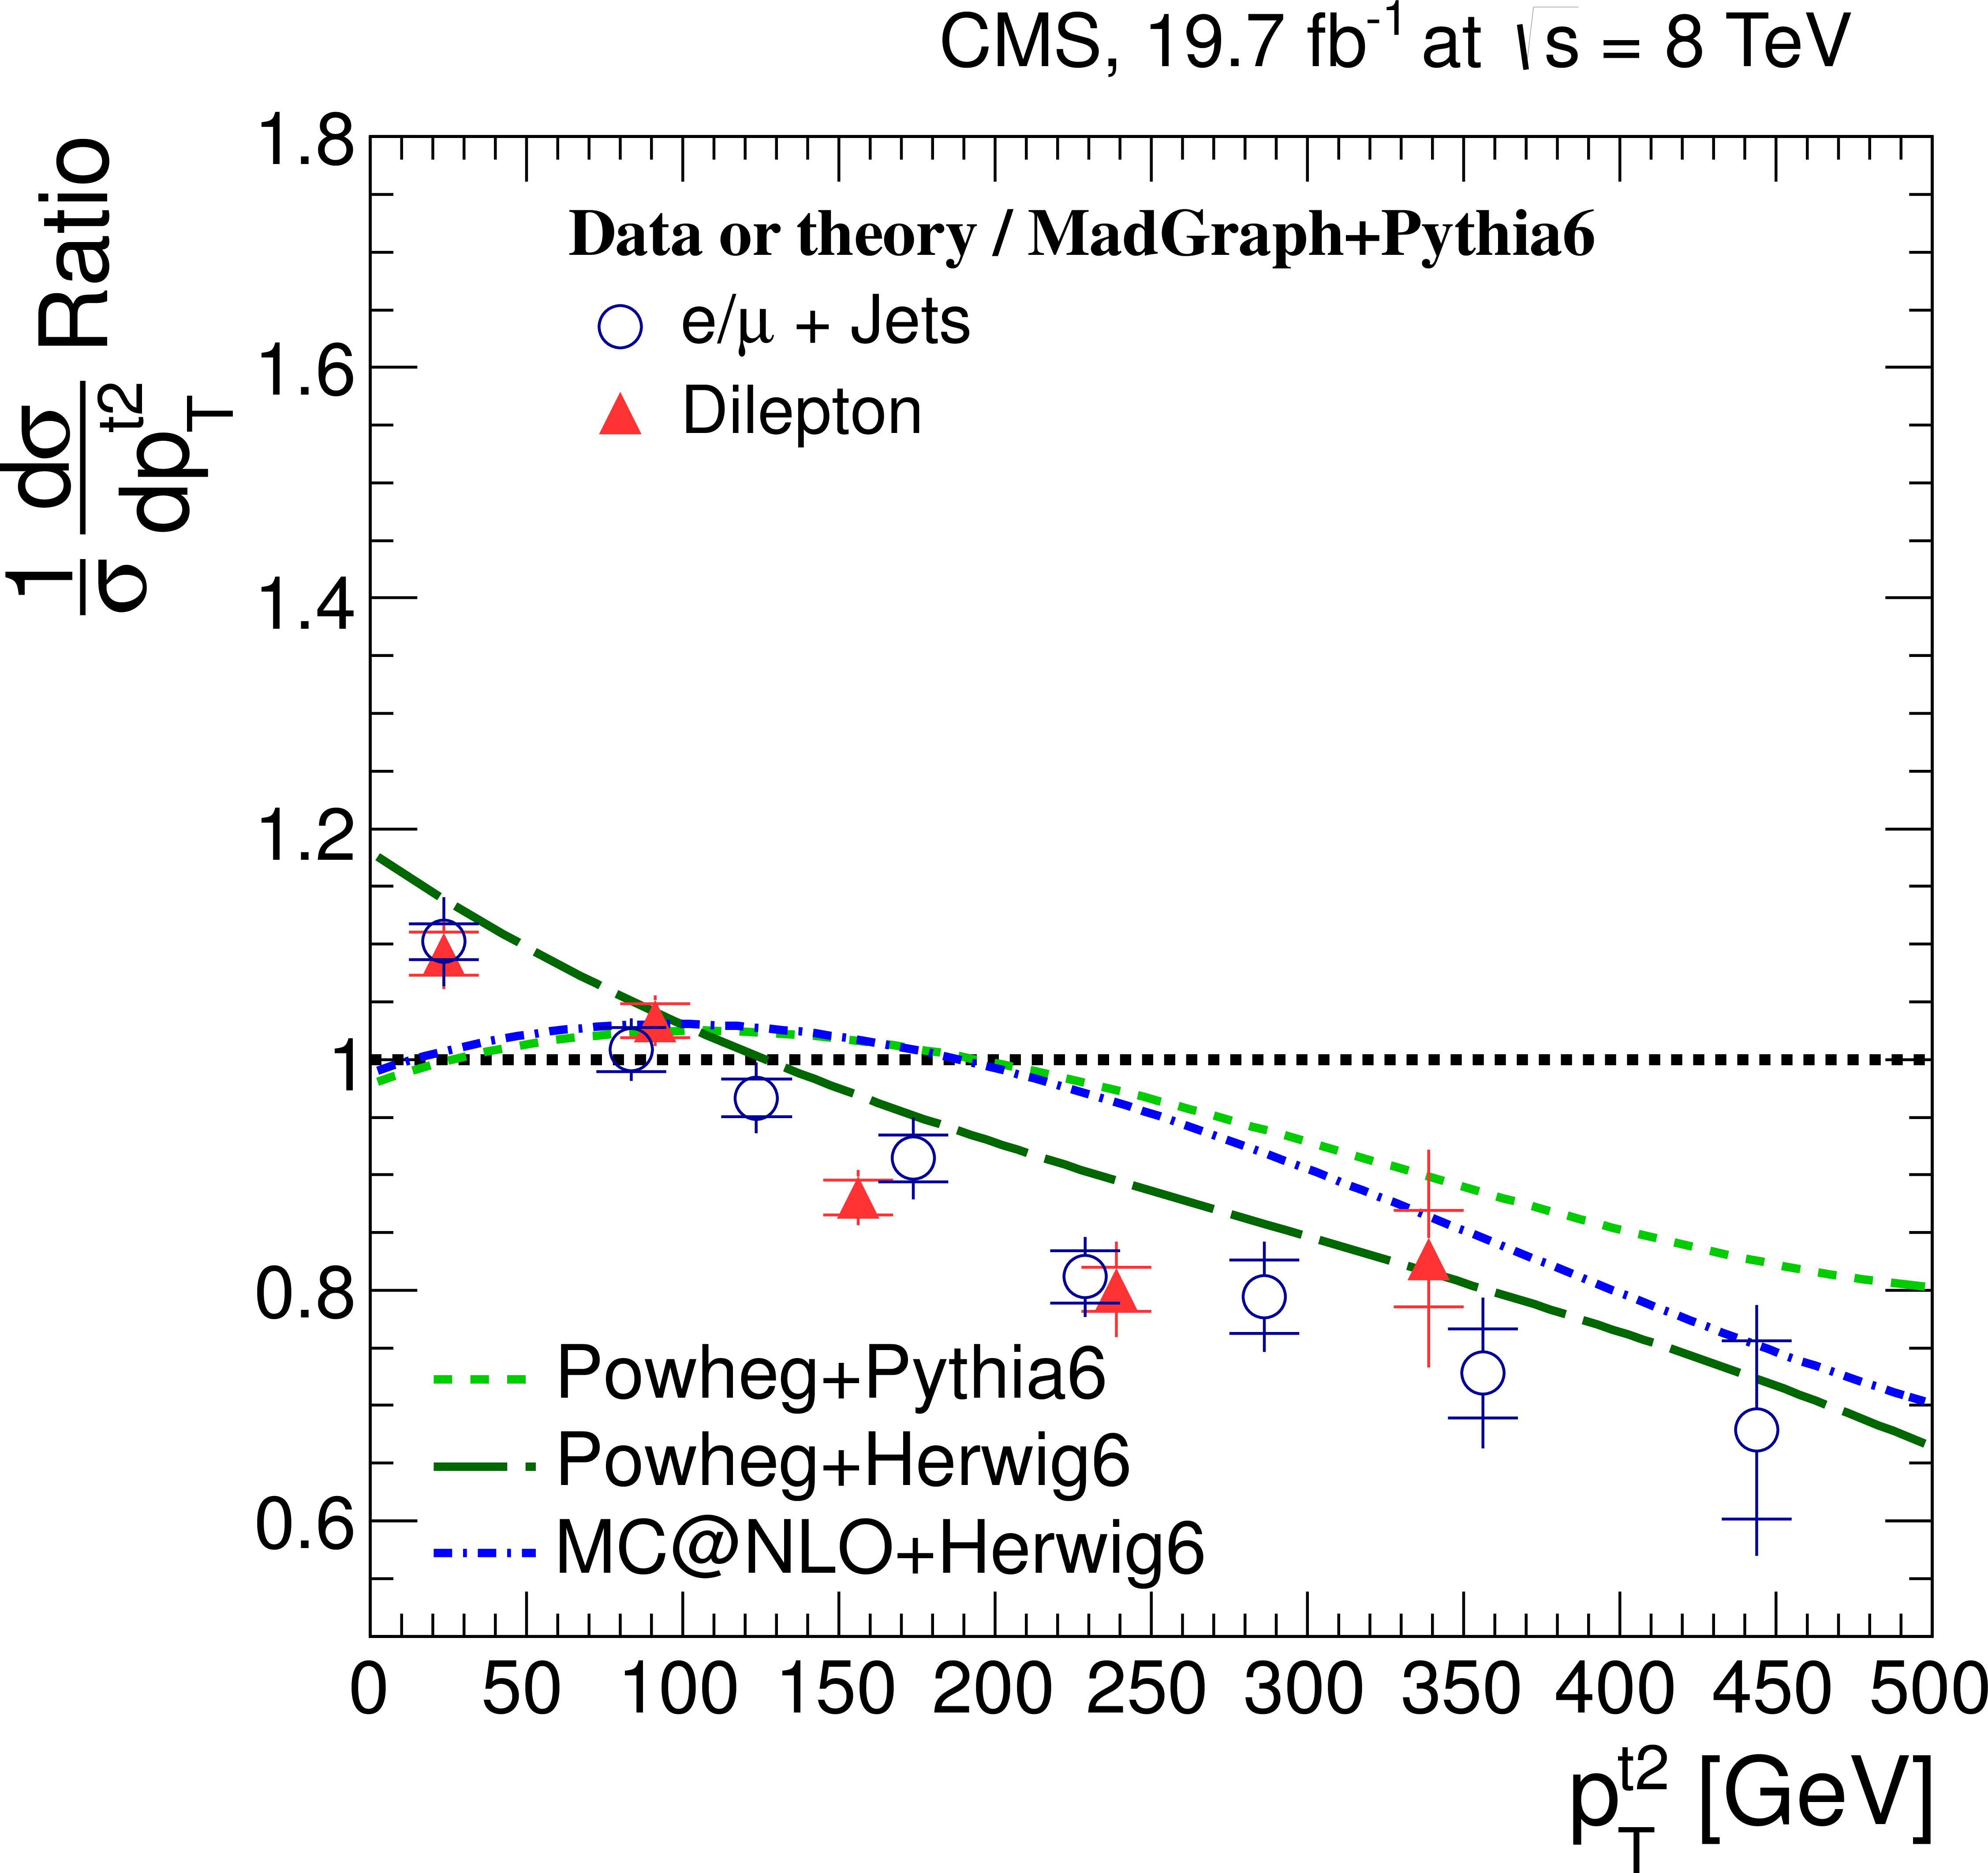
Figure 13-b:
Normalized differential $ {\mathrm {t}\overline {\mathrm {t}}} $ production cross section in the dilepton channels as a function of the $ {p_{\mathrm {T}}} $ of the leading (a) and trailing (b) top quarks or antiquarks. The data points are placed at the midpoint of the bins. The inner (outer) error bars indicate the statistical (combined statistical and systematic) uncertainties. The measurements are compared to predictions from MadGraph+PYTHIA6, POWHEG+PYTHIA6, POWHEG+HERWIG6 and MCatNLO+HERWIG6. The lower part of each plot shows the ratio of the predictions to data. |

png pdf |
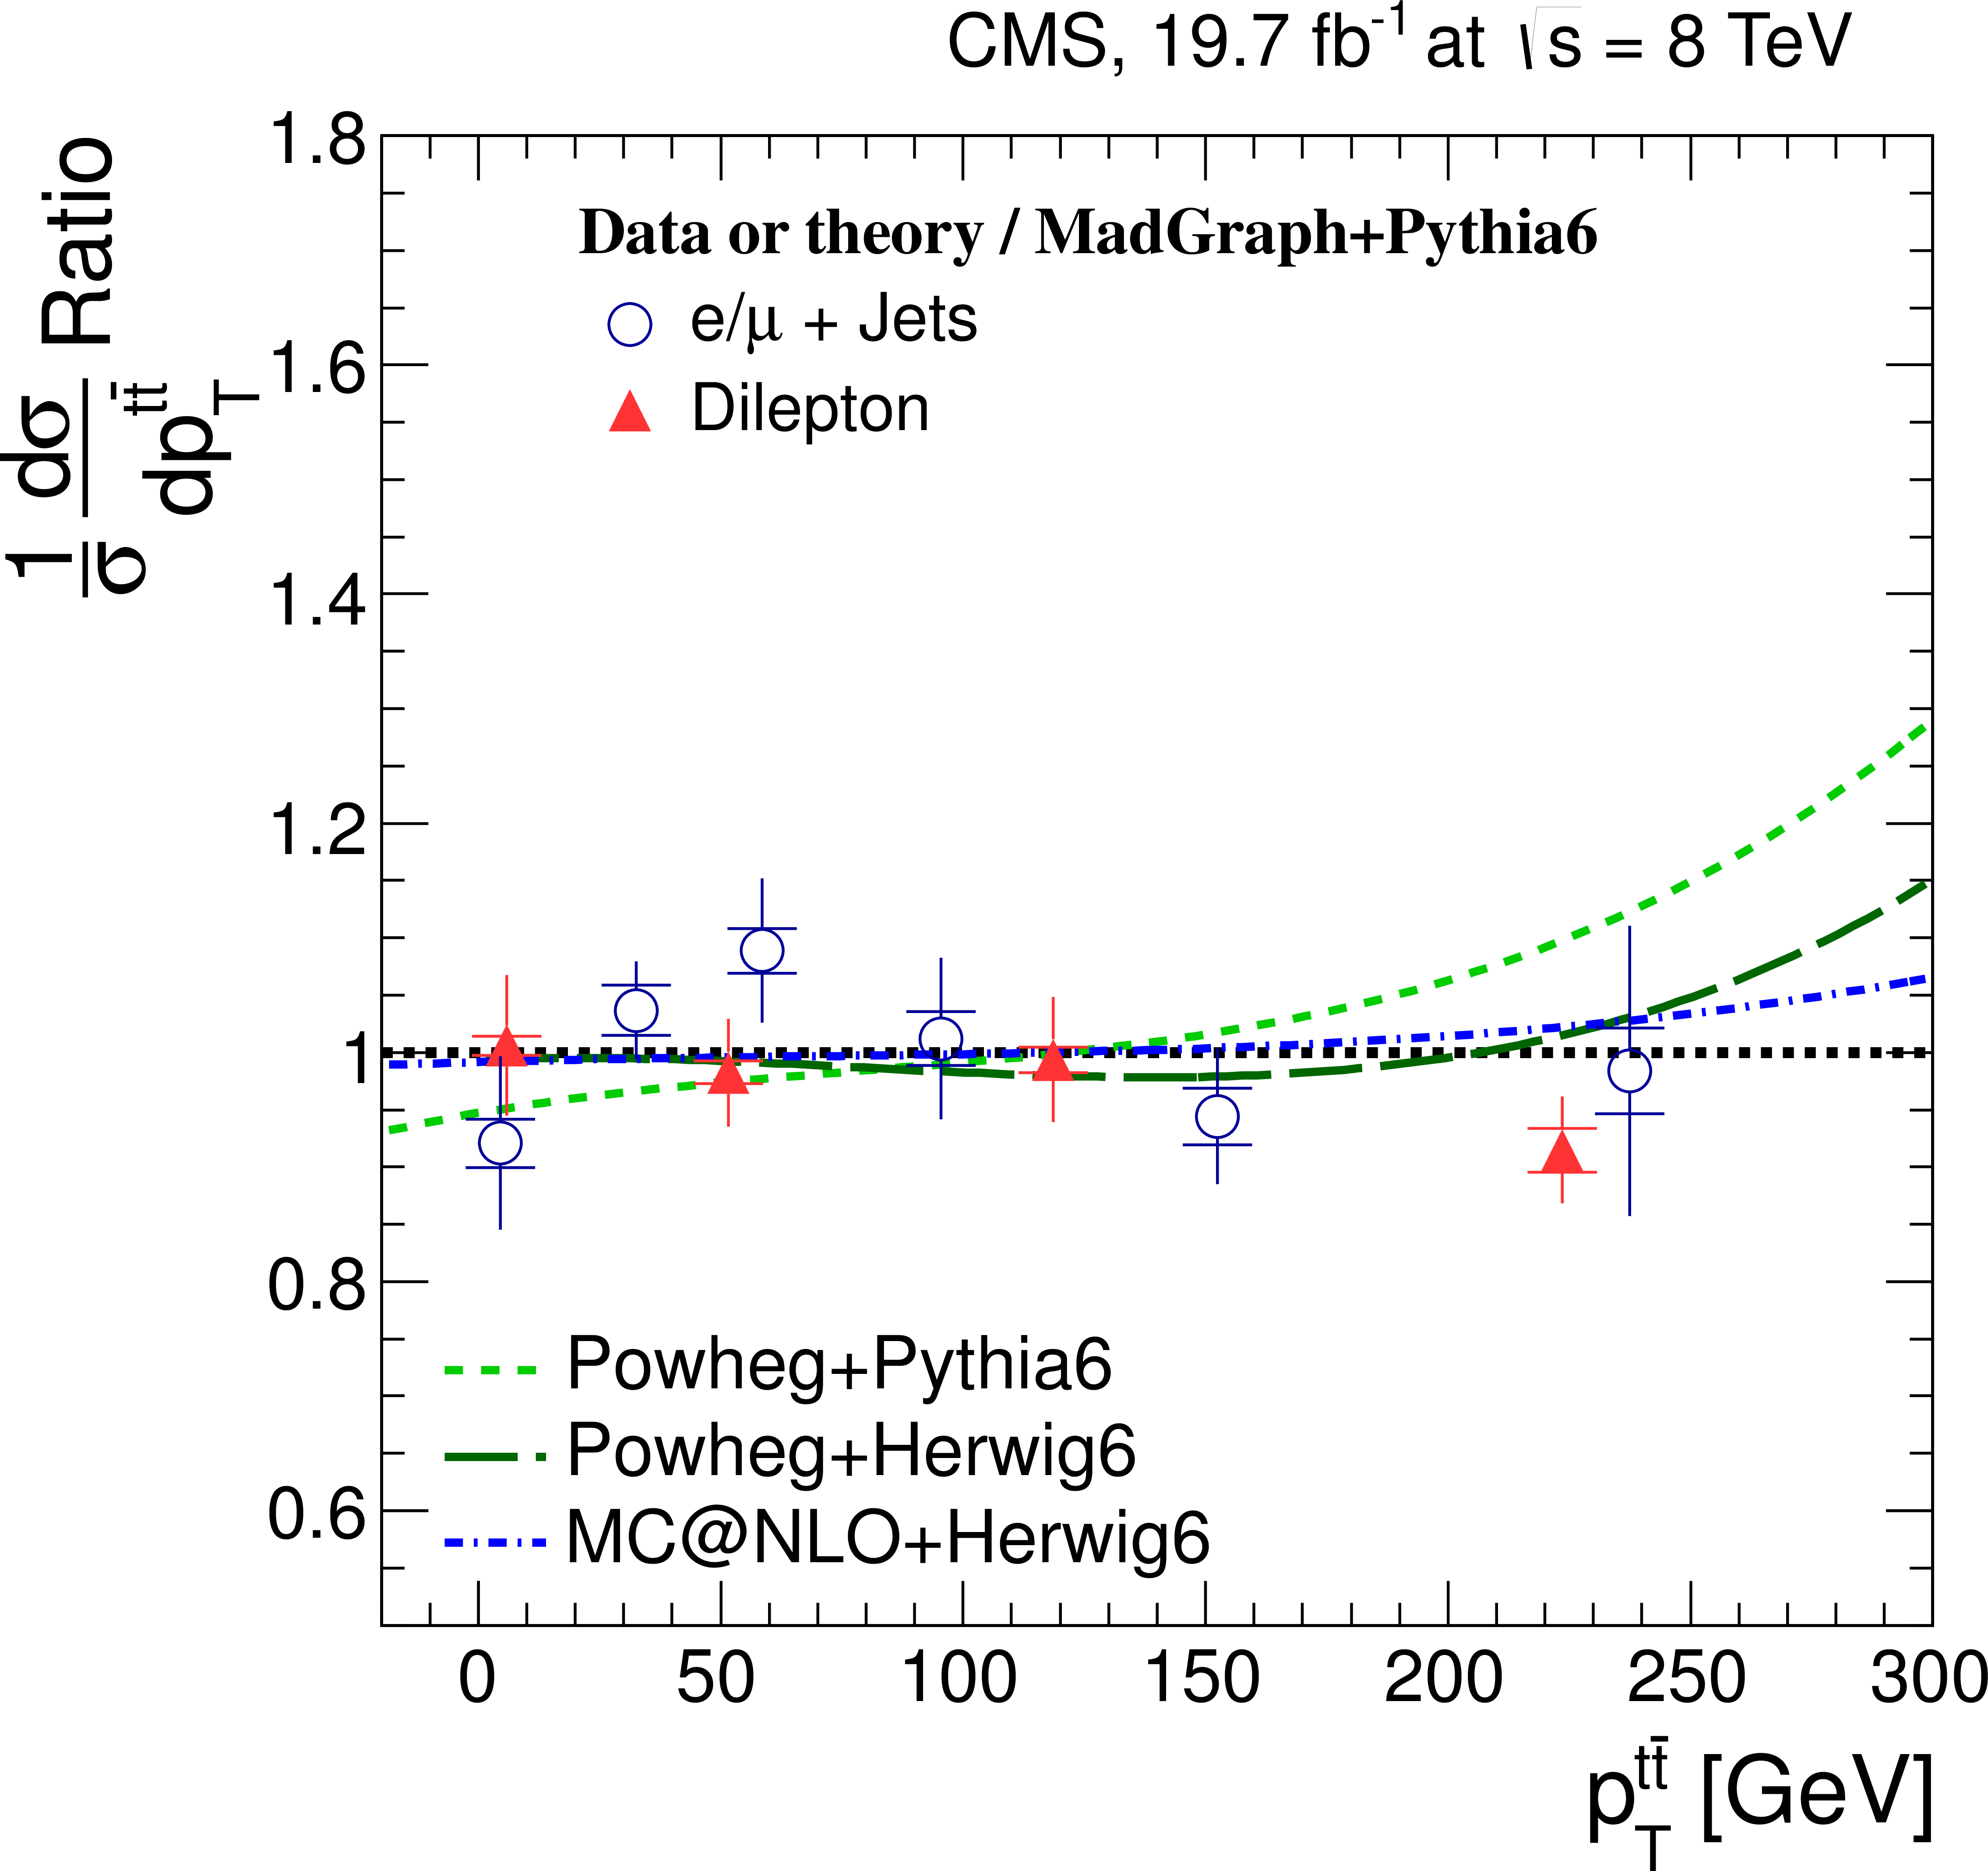
Figure 14-a:
Normalized differential $ {\mathrm {t}\overline {\mathrm {t}}} $ production cross section in the dilepton channels as a function of the $ {p_{\mathrm {T}}} ^{ {\mathrm {t}\overline {\mathrm {t}}} }$ (a), $y_{ {\mathrm {t}\overline {\mathrm {t}}} }$ (b), and $m_{ {\mathrm {t}\overline {\mathrm {t}}} }$ (c) of the $ {\mathrm {t}\overline {\mathrm {t}}} $ system. The data points are placed at the midpoint of the bins. The inner (outer) error bars indicate the statistical (combined statistical and systematic) uncertainties. The measurements are compared to predictions from MadGraph+PYTHIA6, POWHEG+PYTHIA6, POWHEG+HERWIG6 and MCatNLO+HERWIG6, and to NLO+NNLL [14 (A. Ferroglia et al., JHEP 09 (2013) 032)-15 (H. T. Li et al., PRD 88 (2013) 074004)] calculations, when available. The lower part of each plot shows the ratio of the predictions to data. |
png pdf |
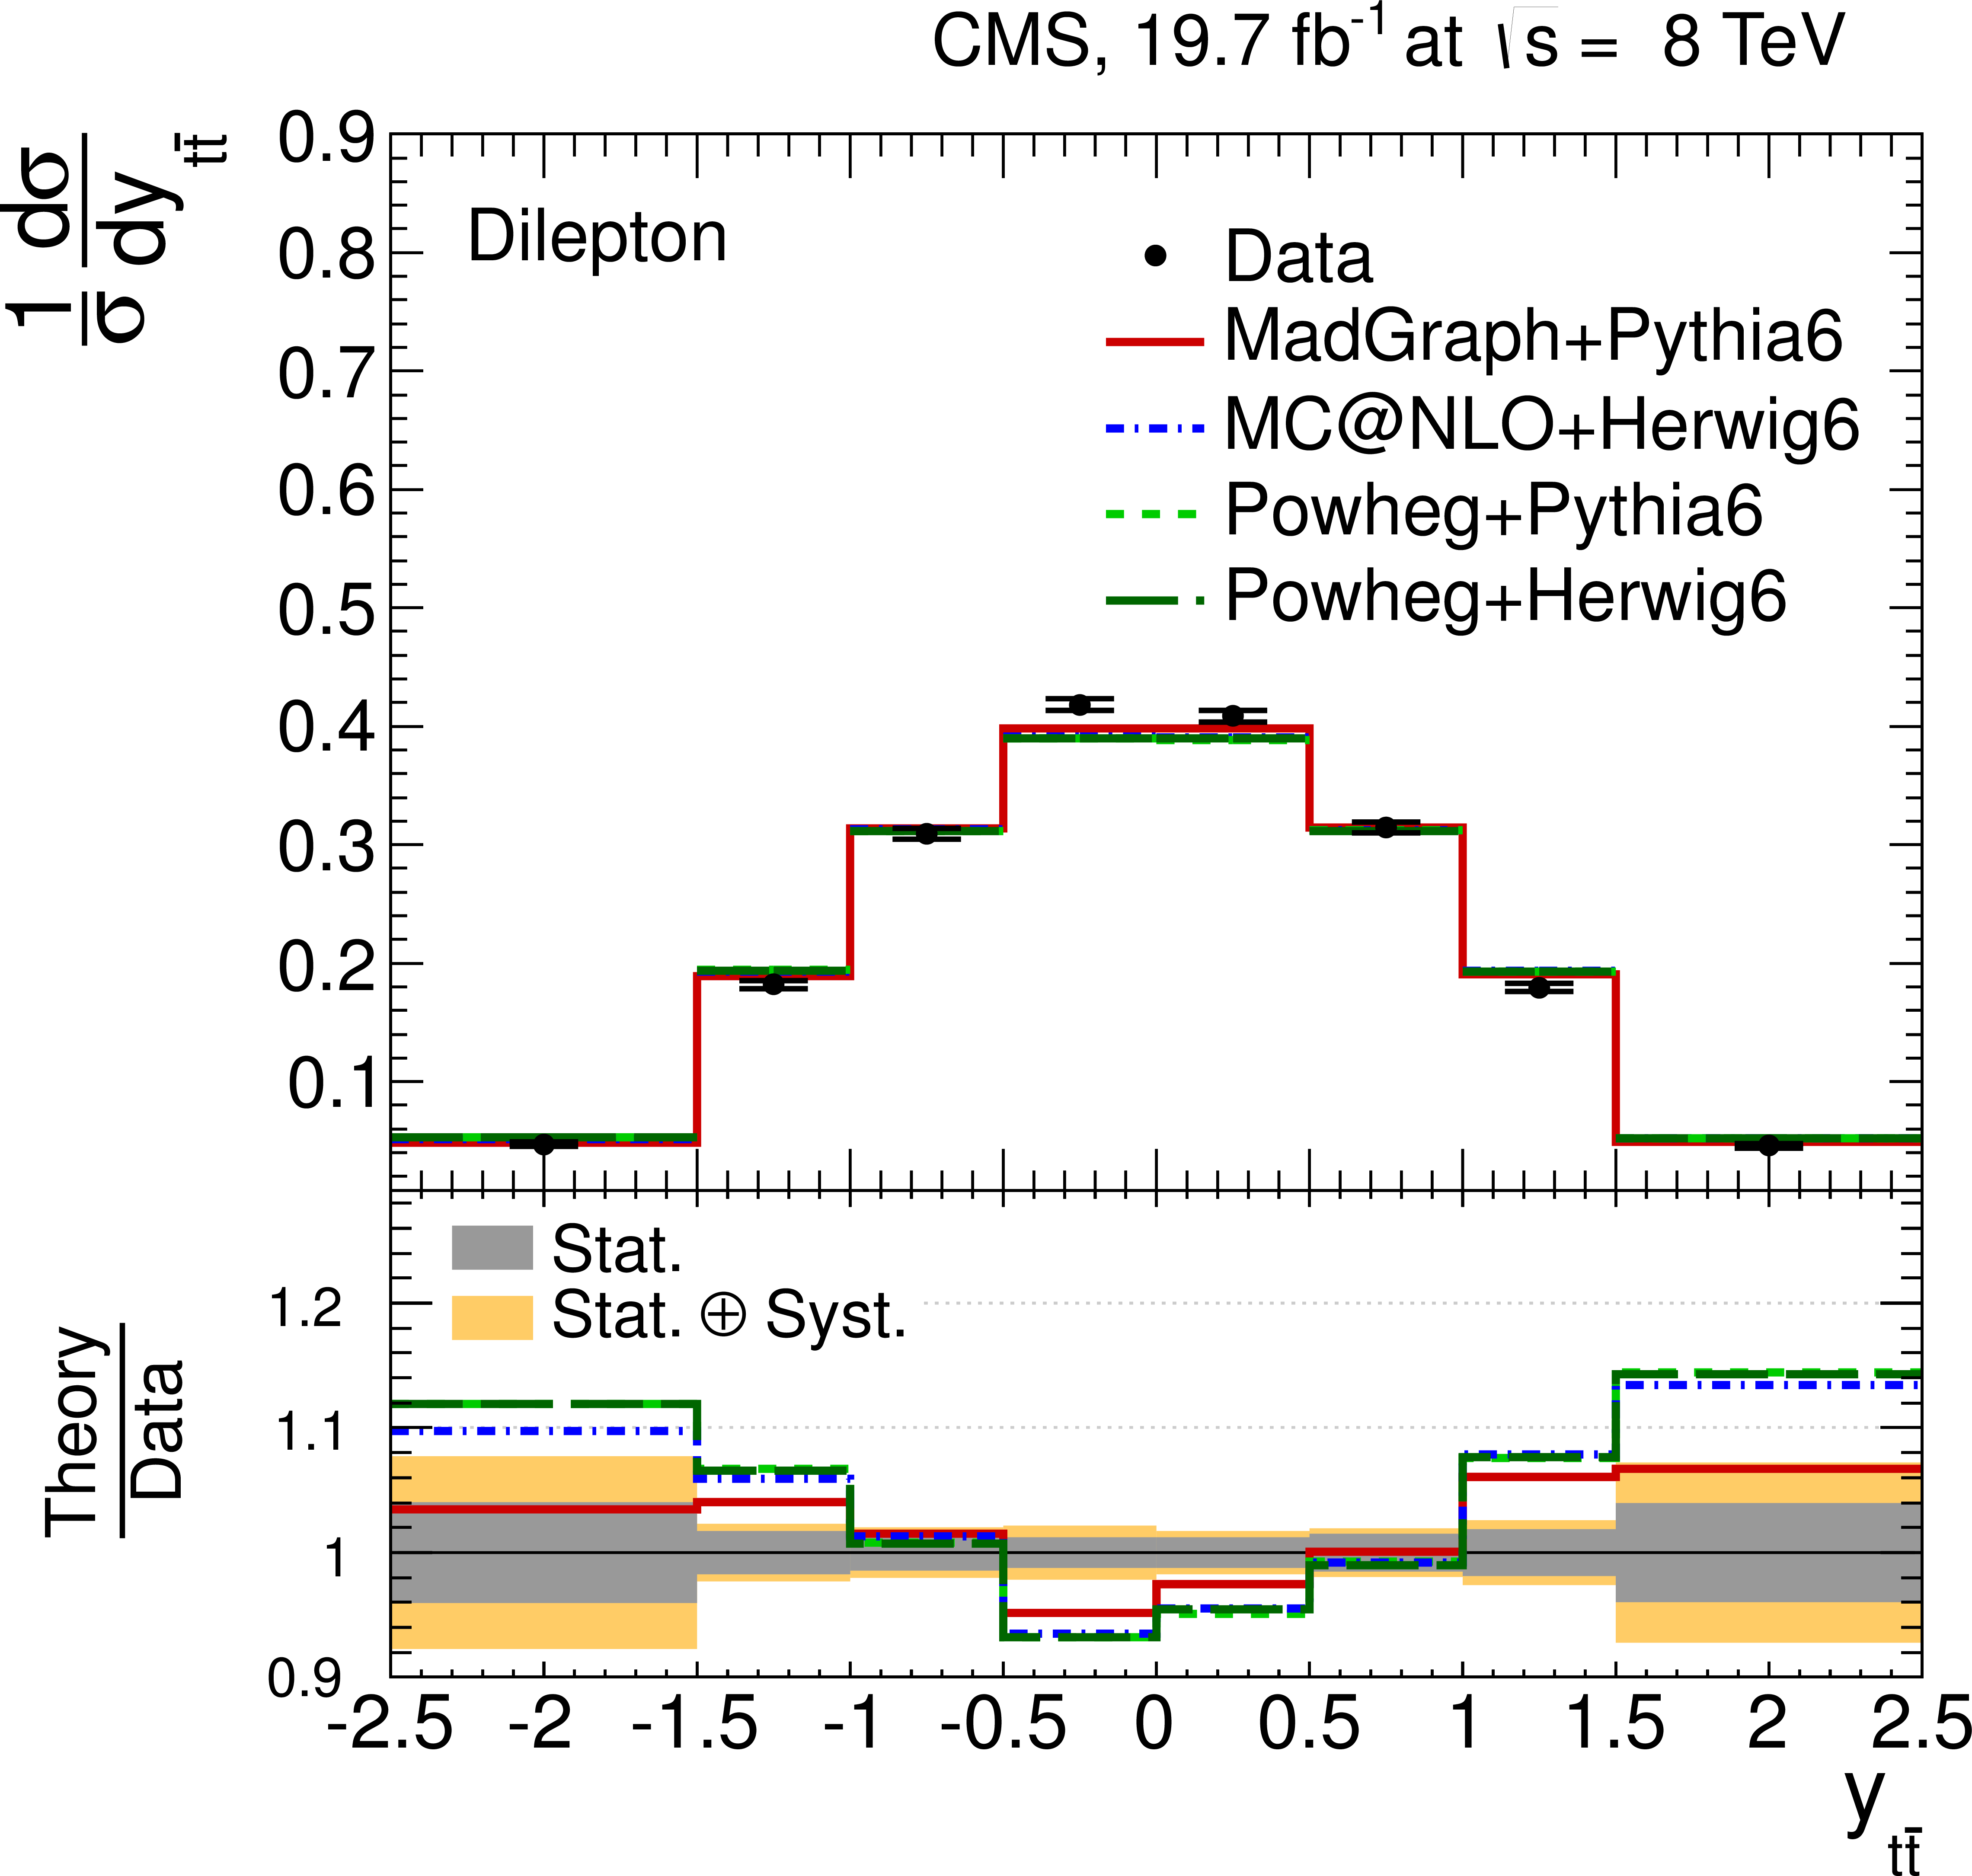
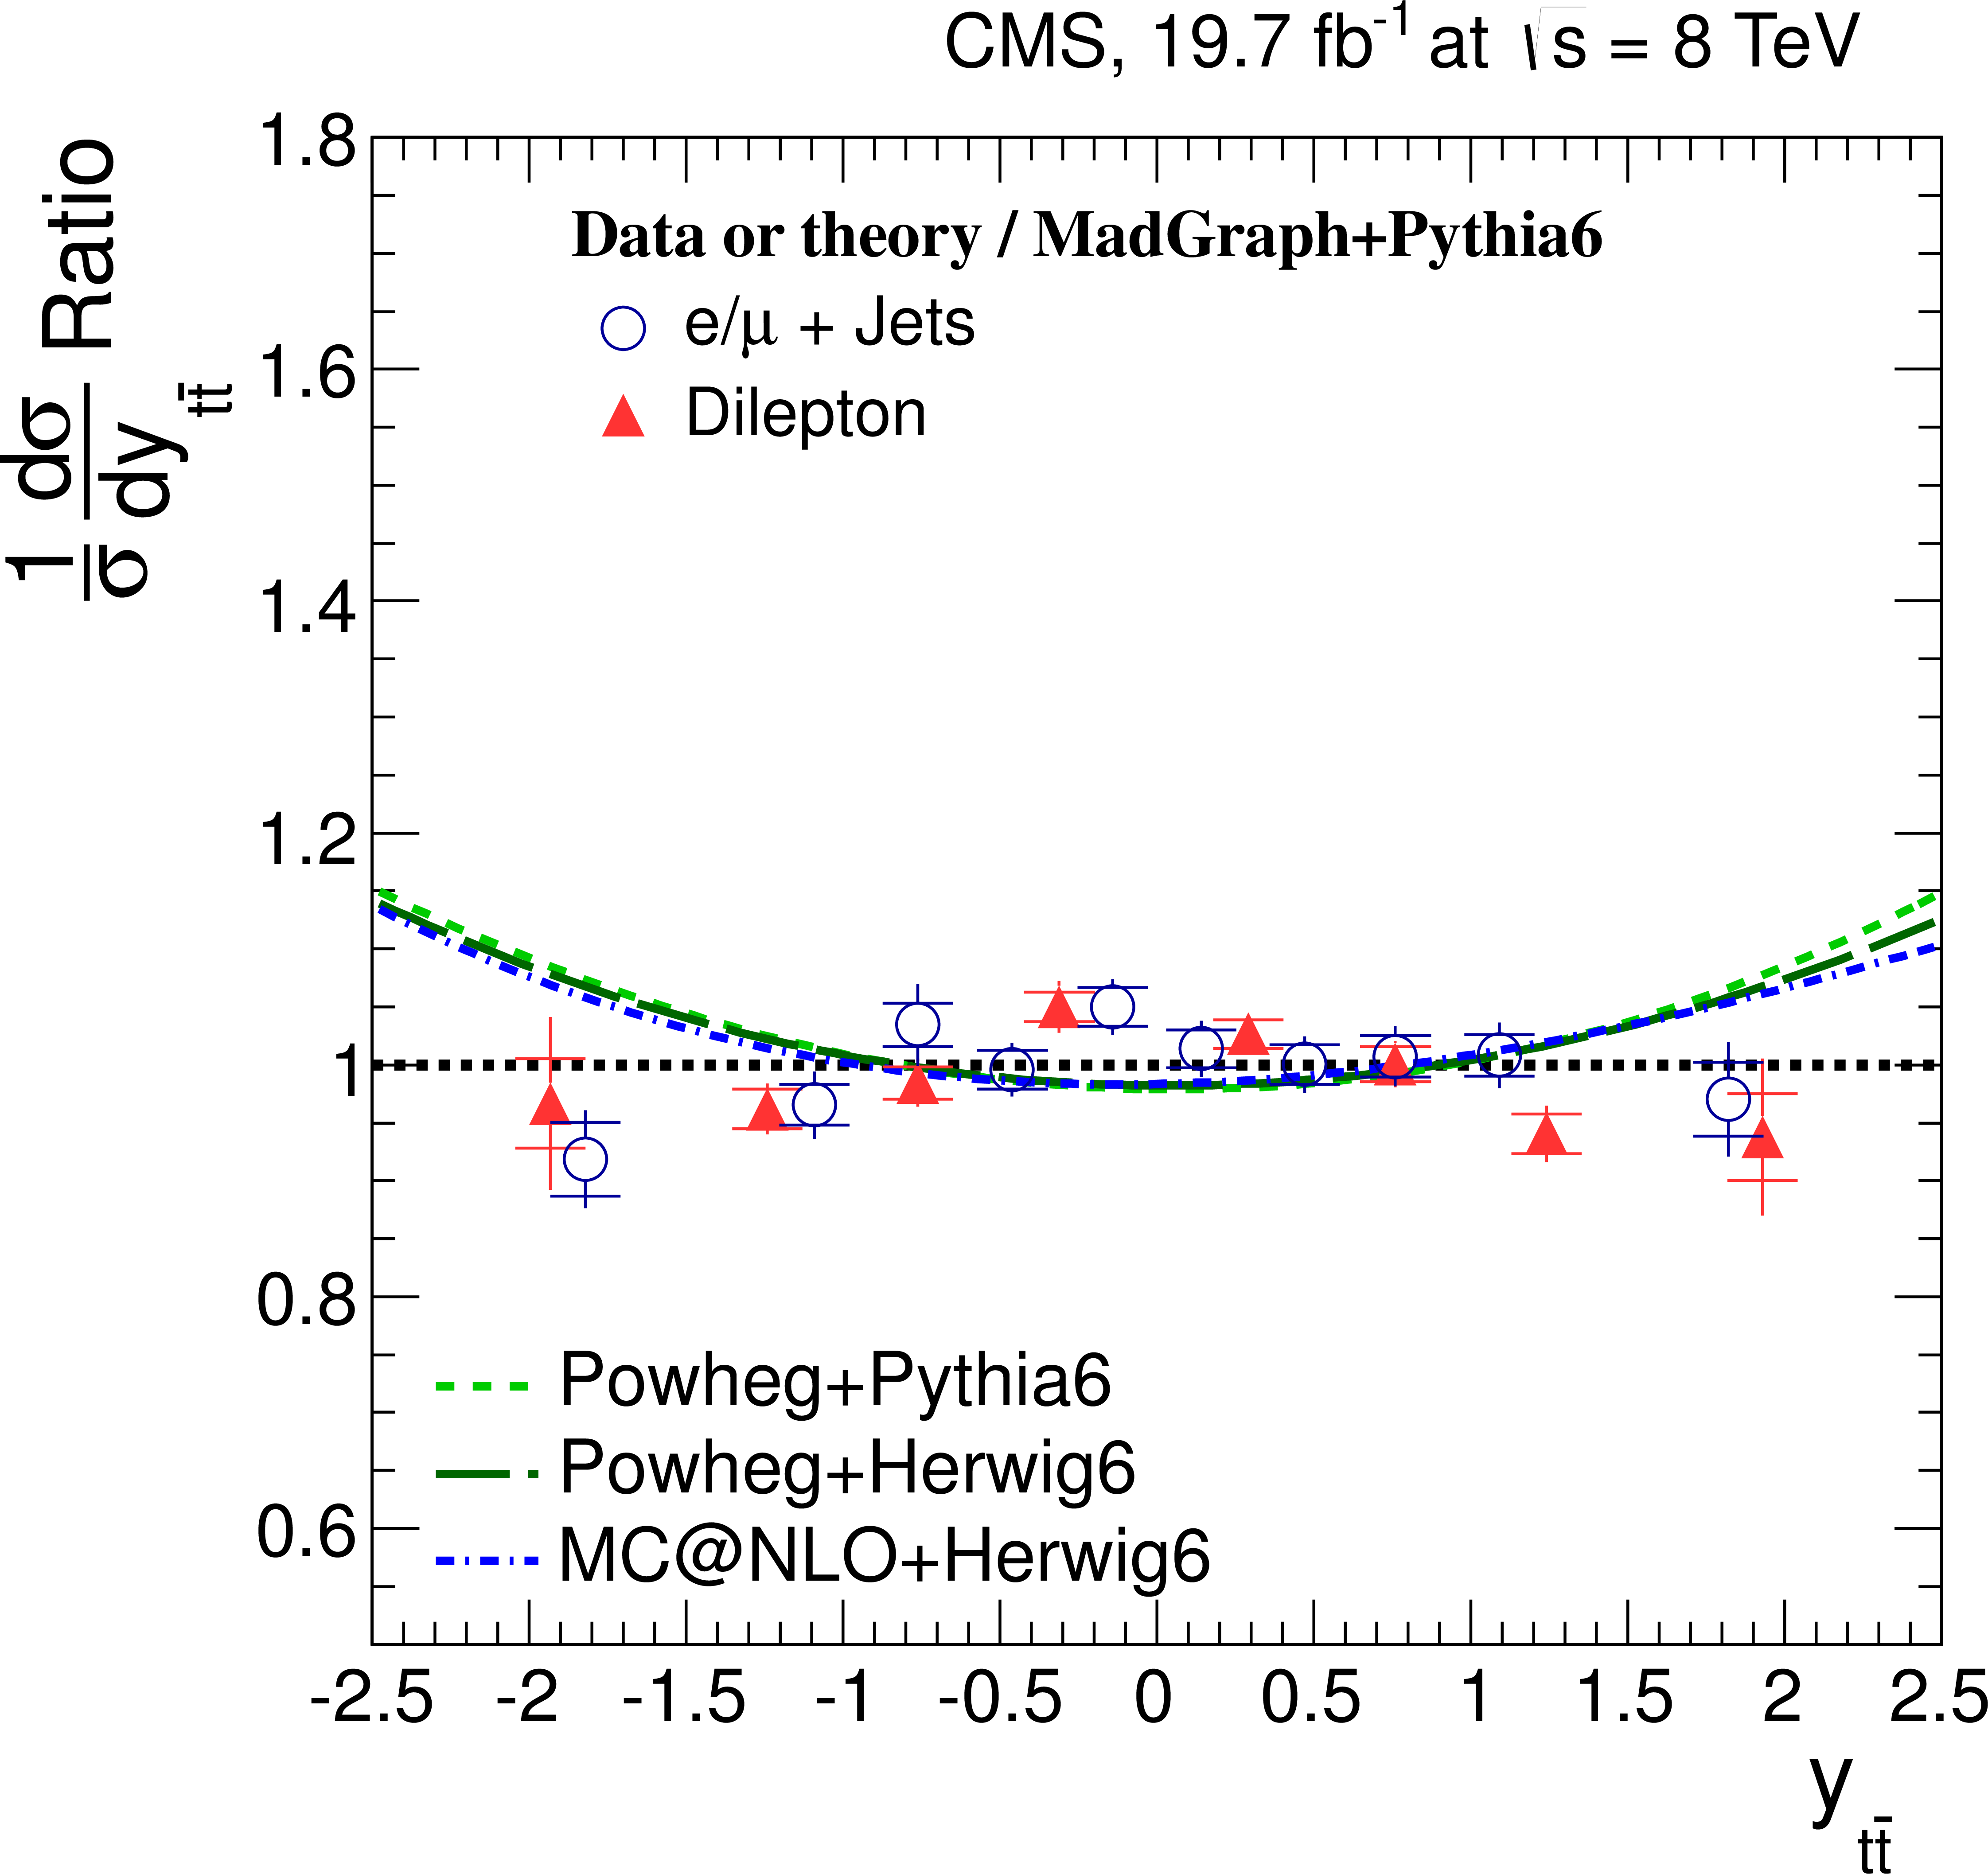
Figure 14-b:
Normalized differential $ {\mathrm {t}\overline {\mathrm {t}}} $ production cross section in the dilepton channels as a function of the $ {p_{\mathrm {T}}} ^{ {\mathrm {t}\overline {\mathrm {t}}} }$ (a), $y_{ {\mathrm {t}\overline {\mathrm {t}}} }$ (b), and $m_{ {\mathrm {t}\overline {\mathrm {t}}} }$ (c) of the $ {\mathrm {t}\overline {\mathrm {t}}} $ system. The data points are placed at the midpoint of the bins. The inner (outer) error bars indicate the statistical (combined statistical and systematic) uncertainties. The measurements are compared to predictions from MadGraph+PYTHIA6, POWHEG+PYTHIA6, POWHEG+HERWIG6 and MCatNLO+HERWIG6, and to NLO+NNLL [14 (A. Ferroglia et al., JHEP 09 (2013) 032)-15 (H. T. Li et al., PRD 88 (2013) 074004)] calculations, when available. The lower part of each plot shows the ratio of the predictions to data. |
png pdf |
Figure 14-c:
Normalized differential $ {\mathrm {t}\overline {\mathrm {t}}} $ production cross section in the dilepton channels as a function of the $ {p_{\mathrm {T}}} ^{ {\mathrm {t}\overline {\mathrm {t}}} }$ (a), $y_{ {\mathrm {t}\overline {\mathrm {t}}} }$ (b), and $m_{ {\mathrm {t}\overline {\mathrm {t}}} }$ (c) of the $ {\mathrm {t}\overline {\mathrm {t}}} $ system. The data points are placed at the midpoint of the bins. The inner (outer) error bars indicate the statistical (combined statistical and systematic) uncertainties. The measurements are compared to predictions from MadGraph+PYTHIA6, POWHEG+PYTHIA6, POWHEG+HERWIG6 and MCatNLO+HERWIG6, and to NLO+NNLL [14 (A. Ferroglia et al., JHEP 09 (2013) 032)-15 (H. T. Li et al., PRD 88 (2013) 074004)] calculations, when available. The lower part of each plot shows the ratio of the predictions to data. |
png pdf |
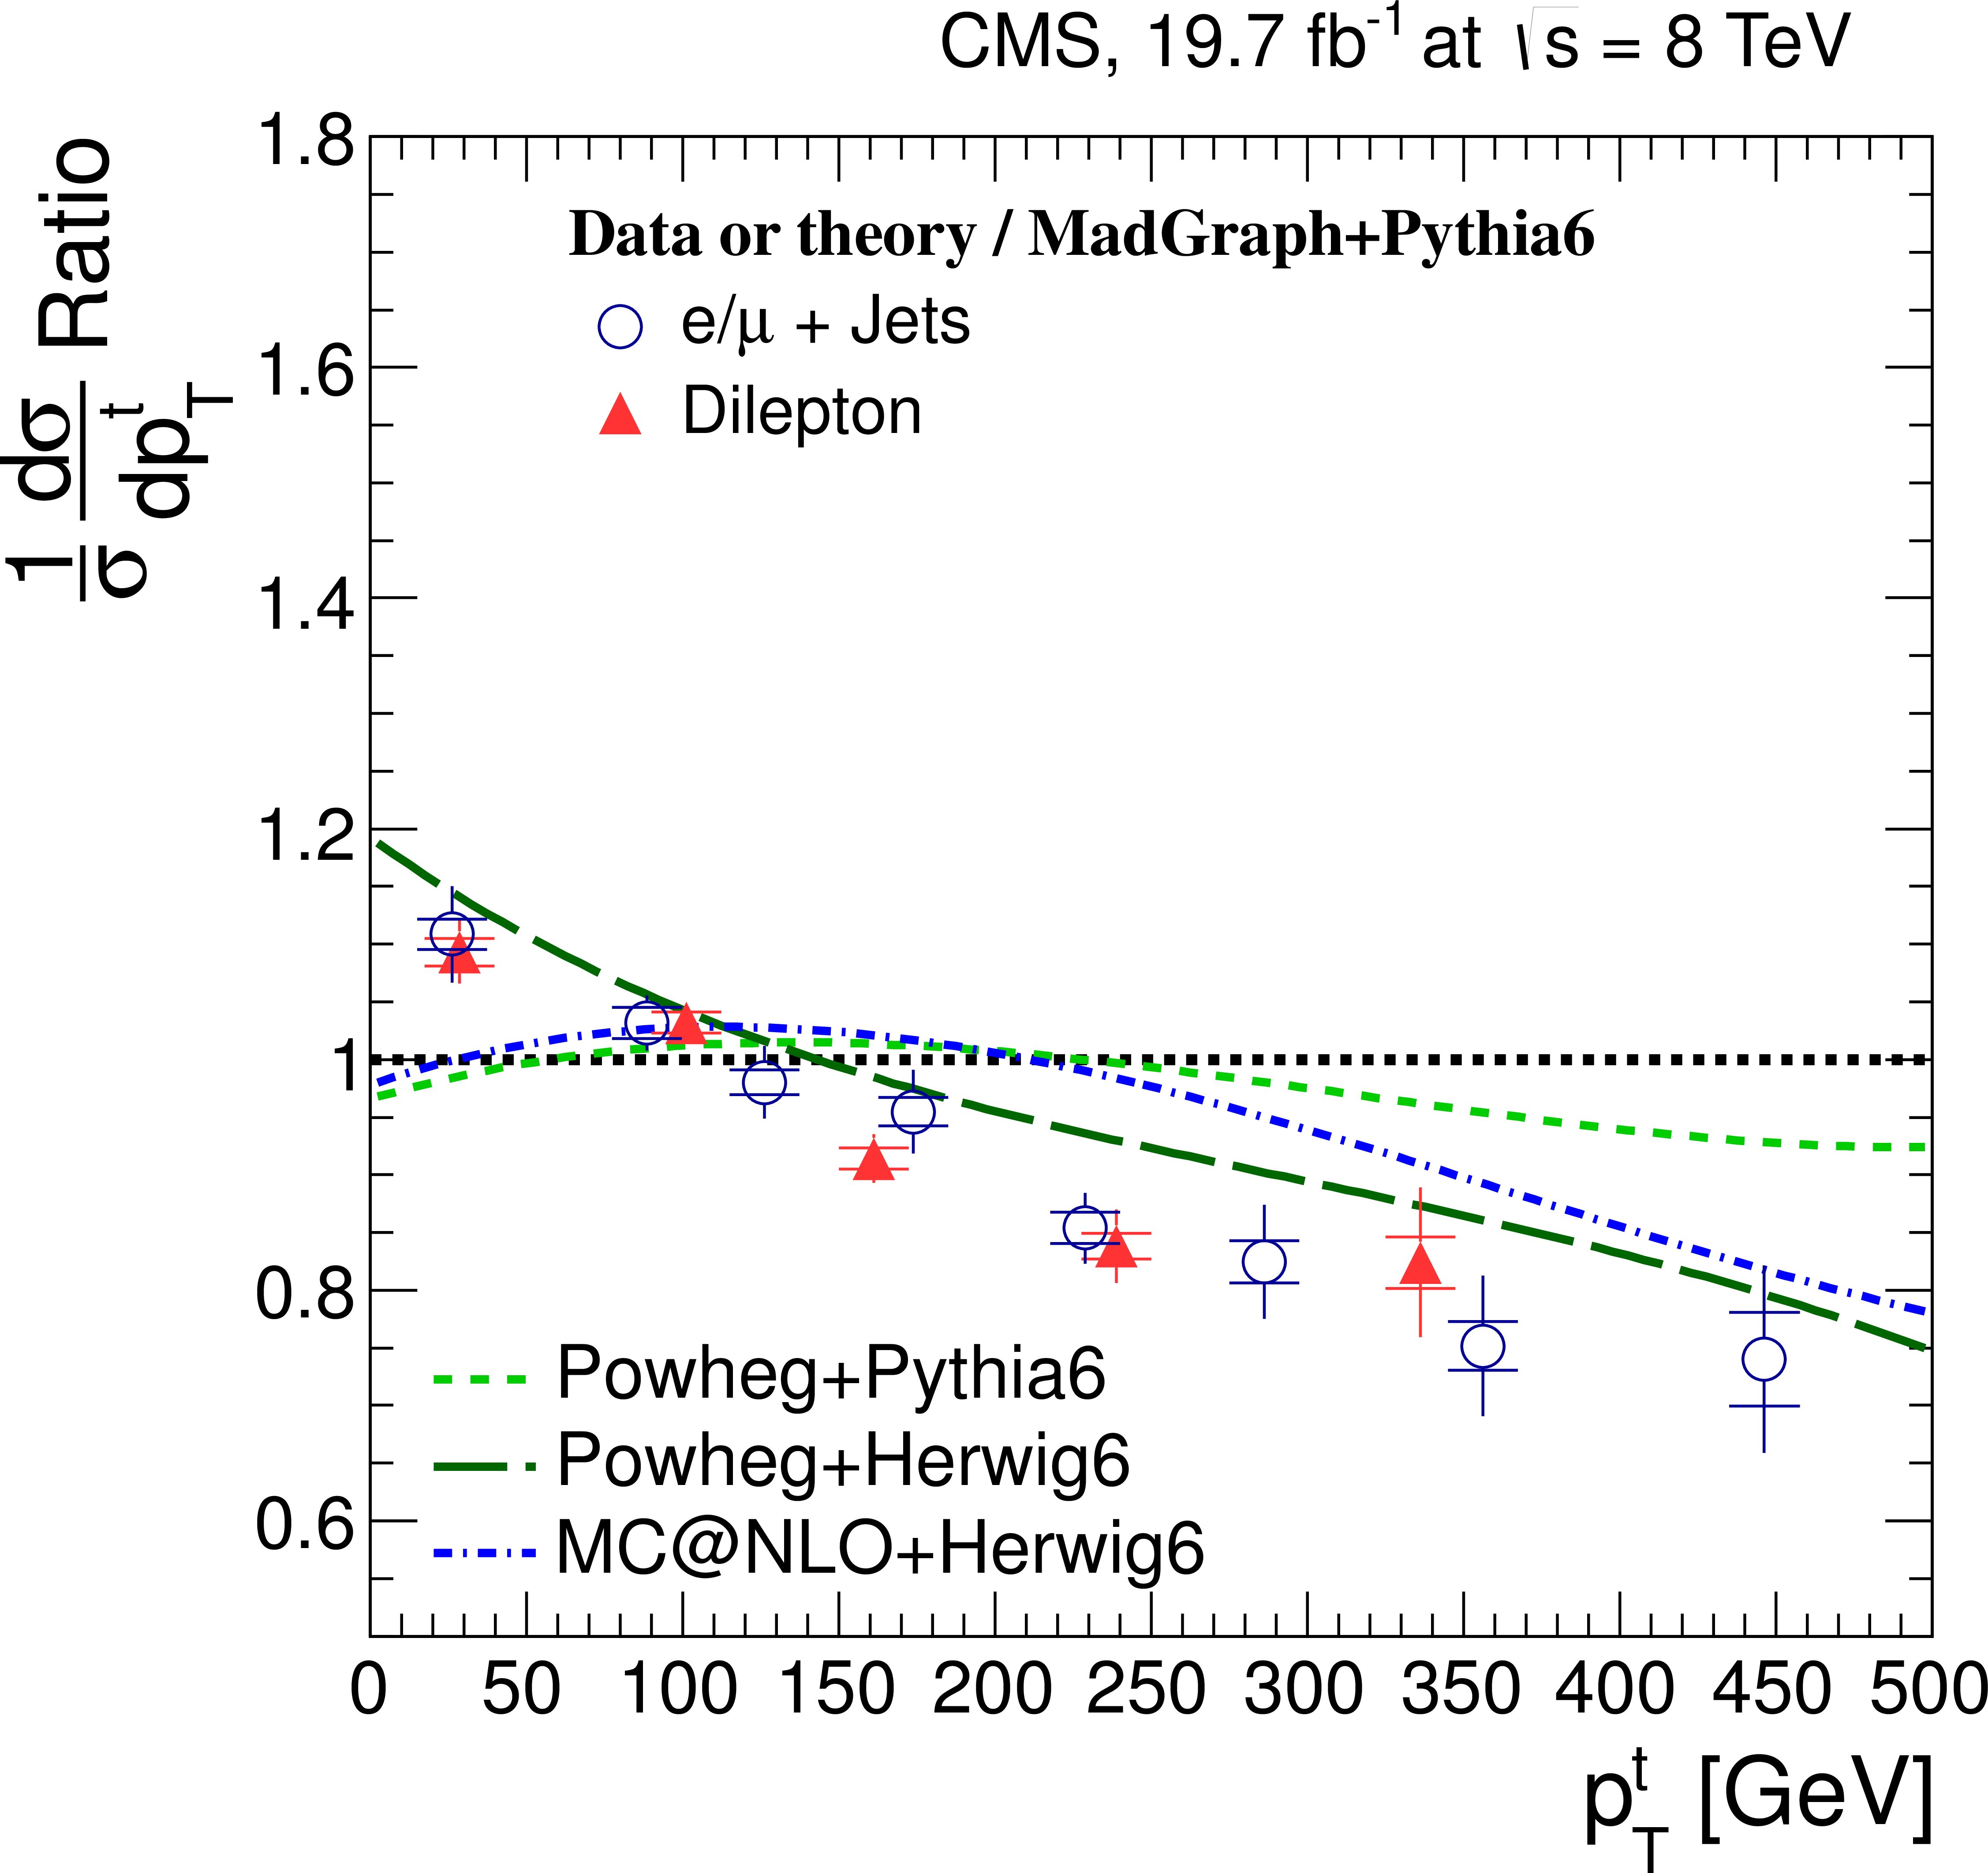
Figure 15-a:
Comparison of normalized differential $ {\mathrm {t}\overline {\mathrm {t}}} $ production cross section in the dilepton and $ {\ell }$+jets channels as a function of the $ {p_{\mathrm {T}}} ^{ {\mathrm {t}} }$ (a), the $ {\mathrm {t}\overline {\mathrm {t}}} $ rest frame $ {p_{\mathrm {T}}} ^{ {\mathrm {t}} \ast }$ (b), and the rapidity $y_{ {\mathrm {t}} }$ (c) of the top quarks or antiquarks, and the difference in the azimuthal angle between the top quark and the antiquark $\Delta \phi (\mathrm{ t , \bar{t} })$ (d). The measurements are presented relative to the MadGraph+PYTHIA6 prediction. A horizontal bin-centre correction is applied to all data points (cf. Section 6.2, Top quark and $ {\mathrm {t}\overline {\mathrm {t}}} $ differential cross sections). The inner (outer) error bars indicate the statistical (combined statistical and systematic) uncertainties. The predictions from MadGraph+PYTHIA6, POWHEG+PYTHIA6, POWHEG+HERWIG6 and MCatNLO+HERWIG6, also presented relative to MadGraph+PYTHIA6, are shown for comparison. |
png pdf |
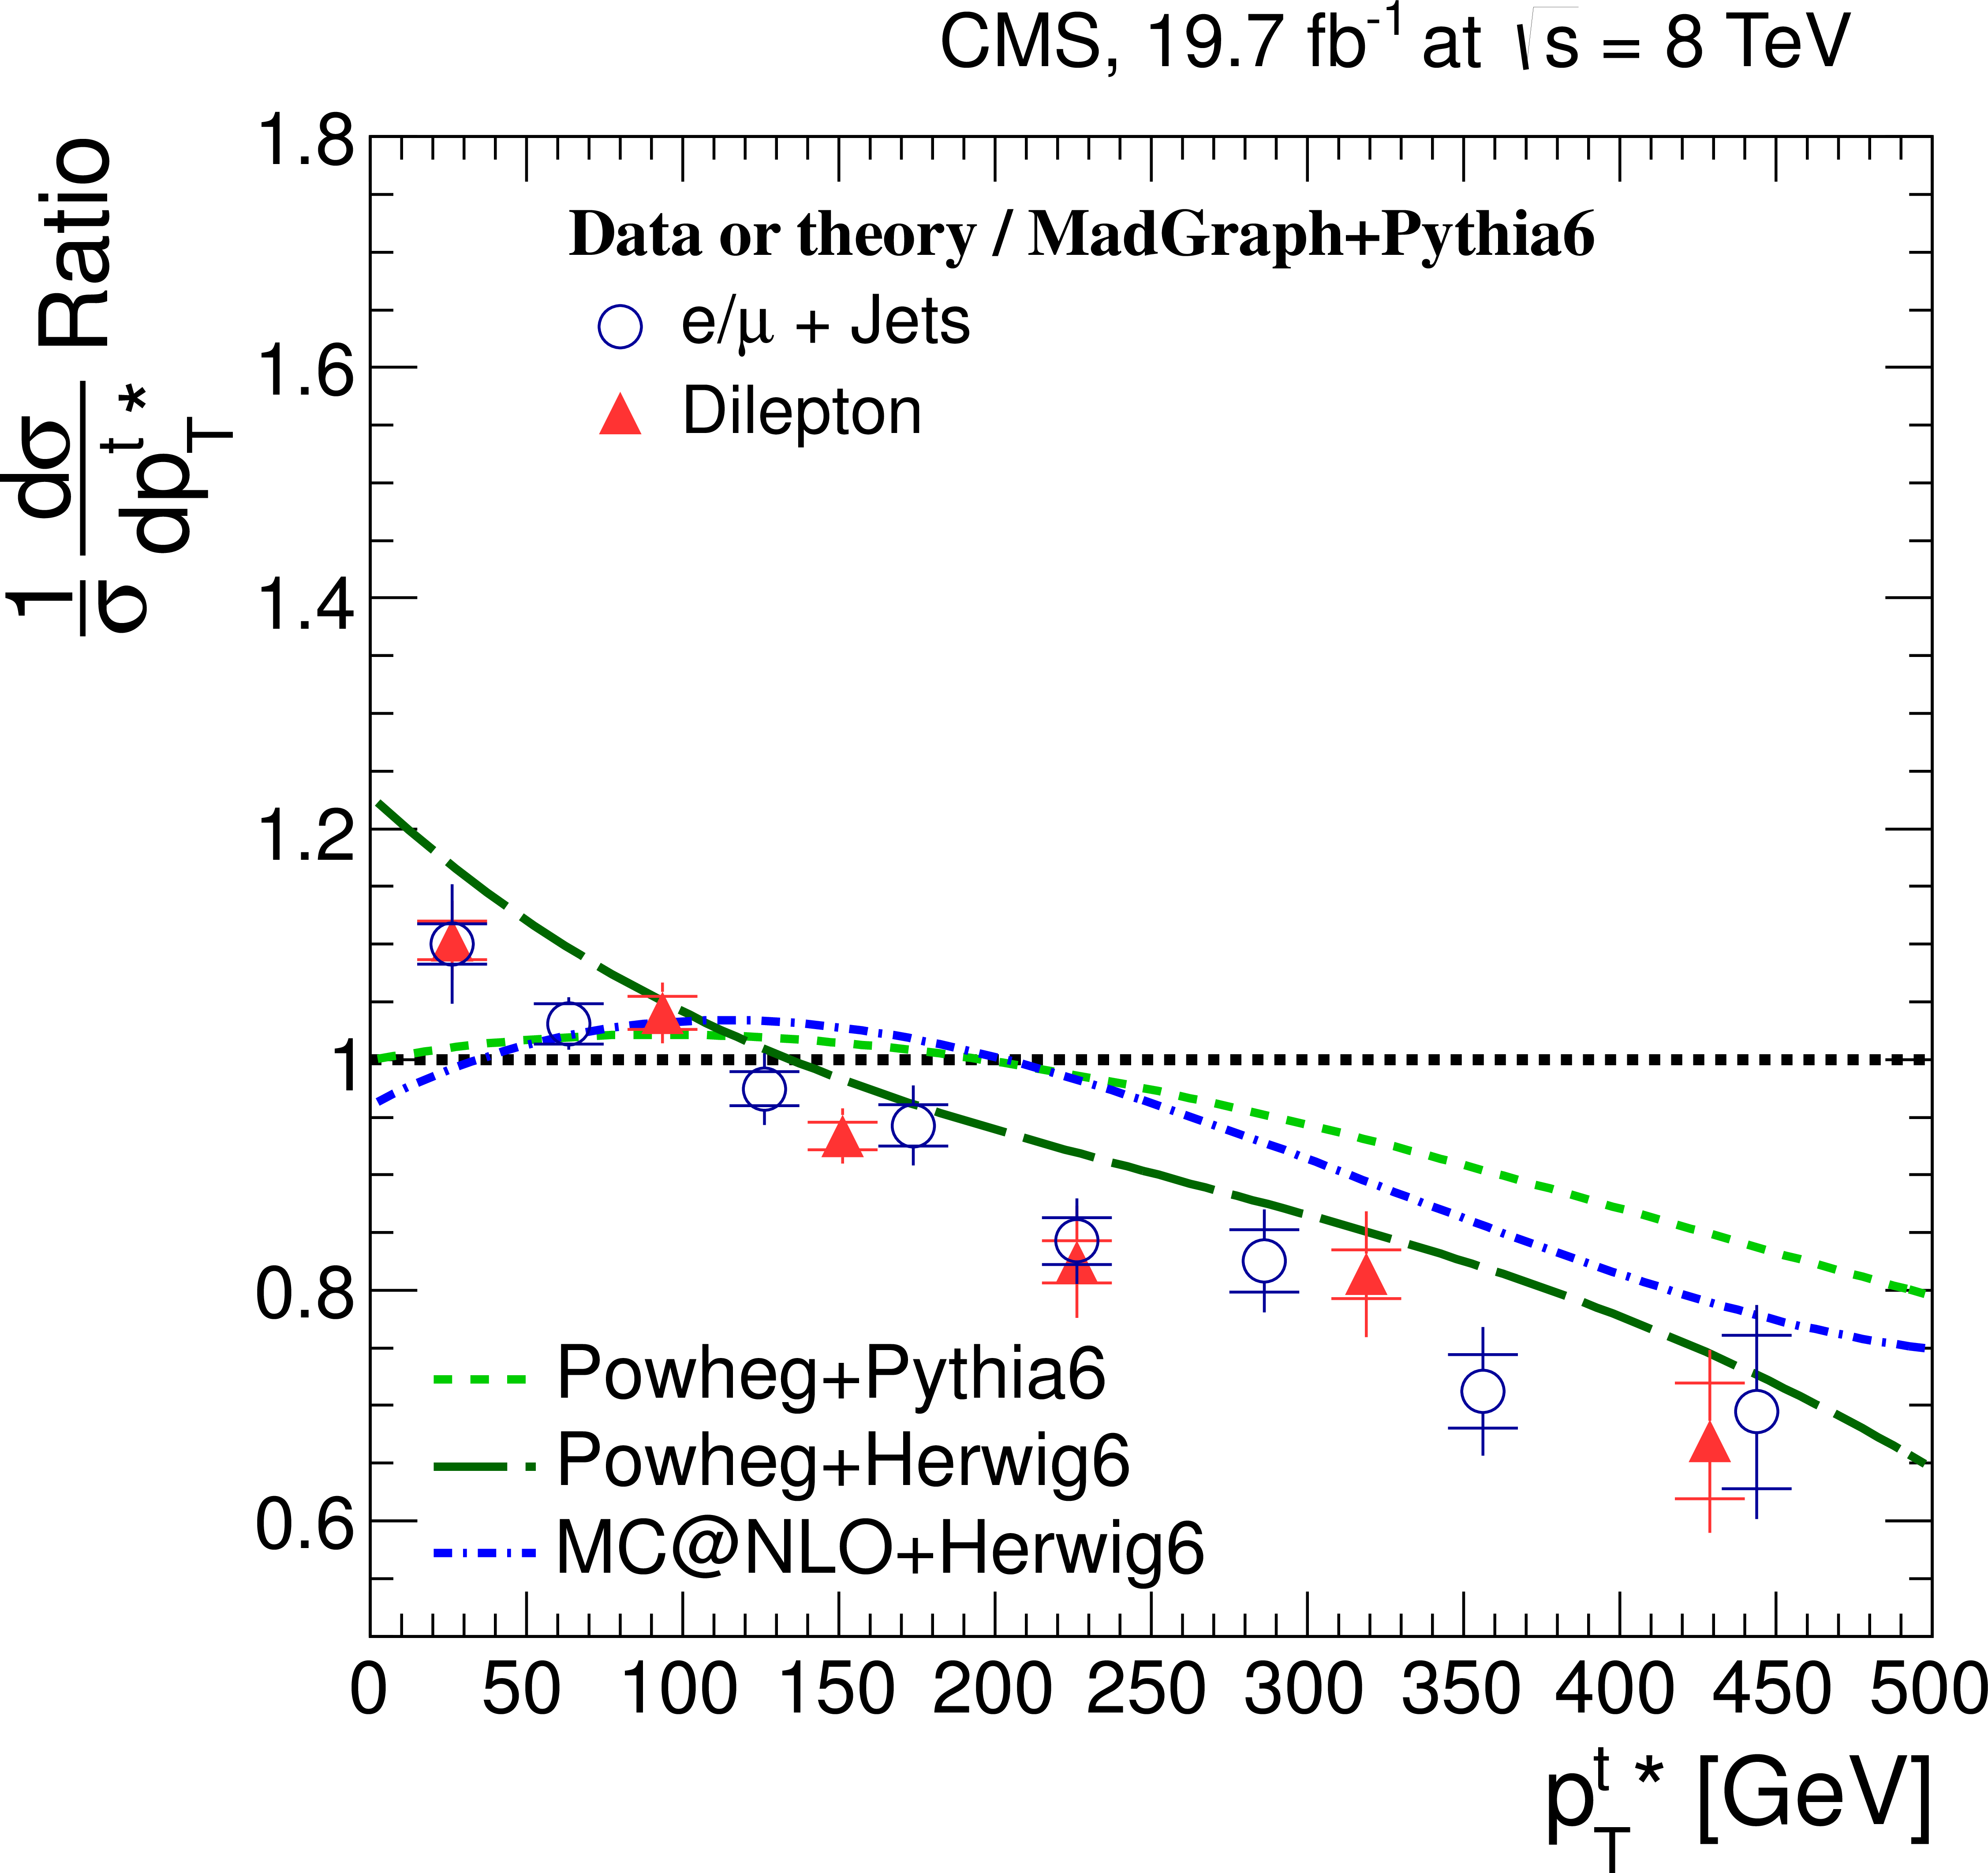
Figure 15-b:
Comparison of normalized differential $ {\mathrm {t}\overline {\mathrm {t}}} $ production cross section in the dilepton and $ {\ell }$+jets channels as a function of the $ {p_{\mathrm {T}}} ^{ {\mathrm {t}} }$ (a), the $ {\mathrm {t}\overline {\mathrm {t}}} $ rest frame $ {p_{\mathrm {T}}} ^{ {\mathrm {t}} \ast }$ (b), and the rapidity $y_{ {\mathrm {t}} }$ (c) of the top quarks or antiquarks, and the difference in the azimuthal angle between the top quark and the antiquark $\Delta \phi (\mathrm{ t , \bar{t} })$ (d). The measurements are presented relative to the MadGraph+PYTHIA6 prediction. A horizontal bin-centre correction is applied to all data points (cf. Section 6.2, Top quark and $ {\mathrm {t}\overline {\mathrm {t}}} $ differential cross sections). The inner (outer) error bars indicate the statistical (combined statistical and systematic) uncertainties. The predictions from MadGraph+PYTHIA6, POWHEG+PYTHIA6, POWHEG+HERWIG6 and MCatNLO+HERWIG6, also presented relative to MadGraph+PYTHIA6, are shown for comparison. |
png pdf |
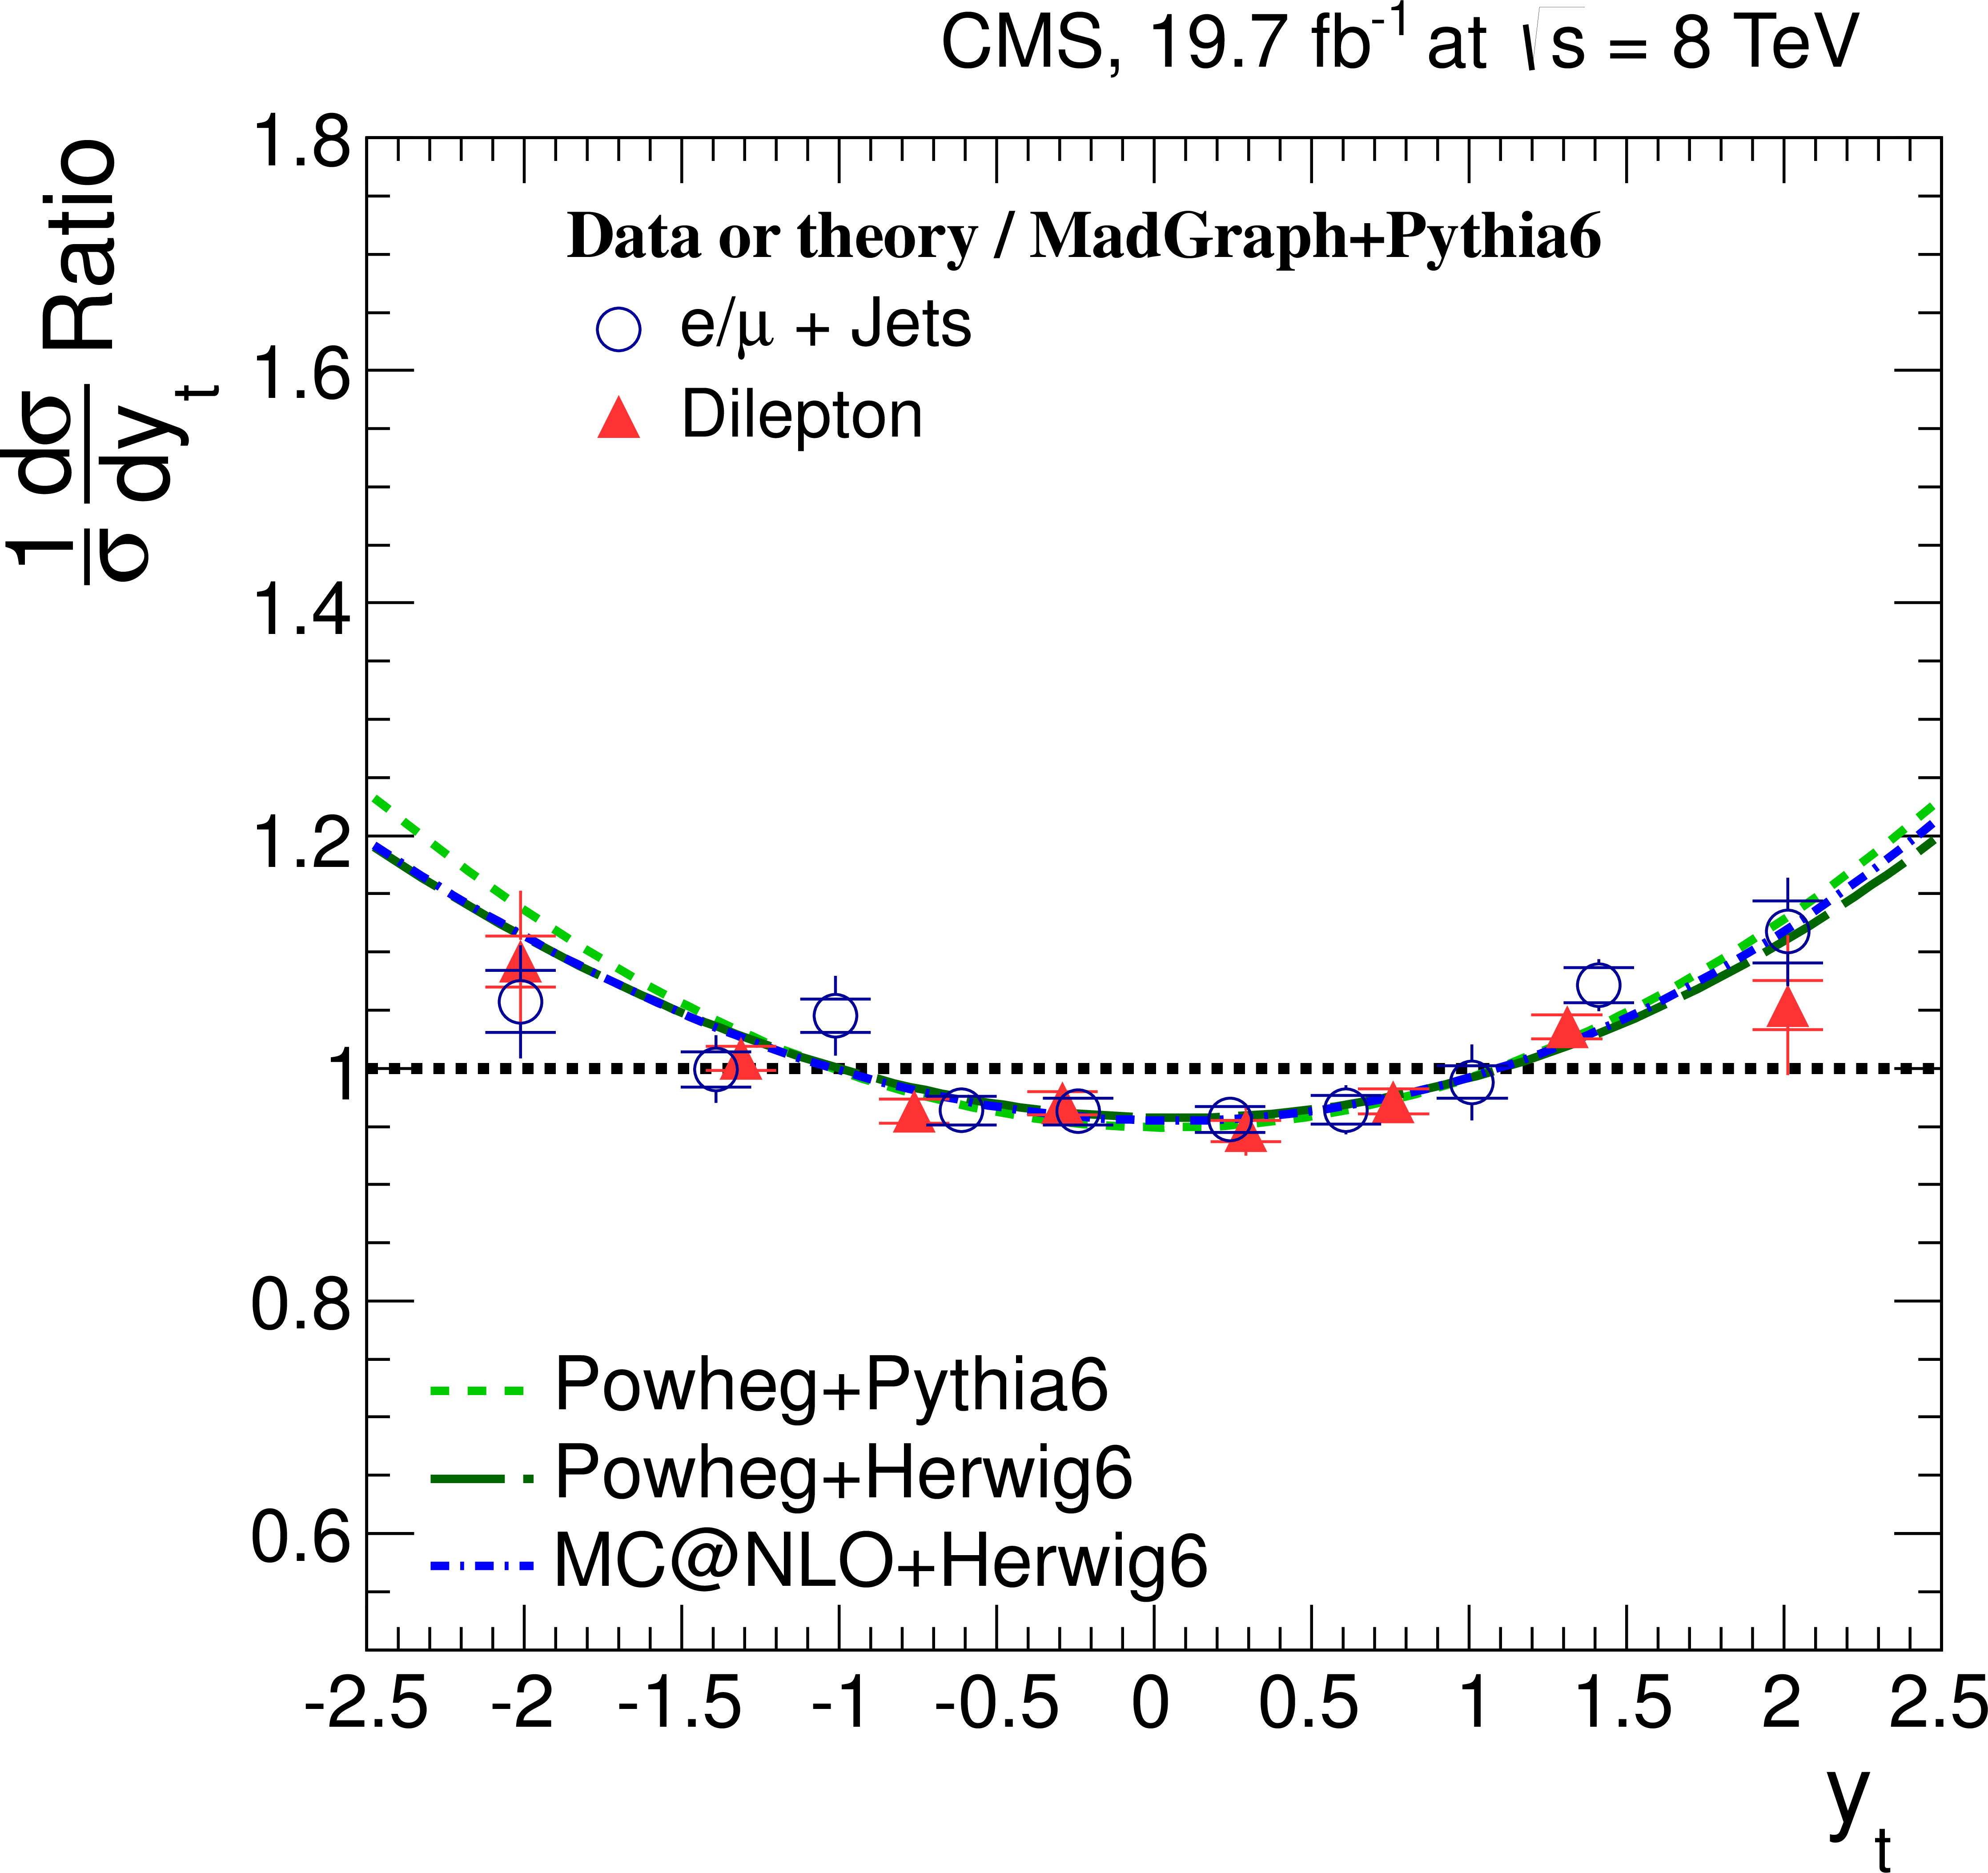
Figure 15-c:
Comparison of normalized differential $ {\mathrm {t}\overline {\mathrm {t}}} $ production cross section in the dilepton and $ {\ell }$+jets channels as a function of the $ {p_{\mathrm {T}}} ^{ {\mathrm {t}} }$ (a), the $ {\mathrm {t}\overline {\mathrm {t}}} $ rest frame $ {p_{\mathrm {T}}} ^{ {\mathrm {t}} \ast }$ (b), and the rapidity $y_{ {\mathrm {t}} }$ (c) of the top quarks or antiquarks, and the difference in the azimuthal angle between the top quark and the antiquark $\Delta \phi (\mathrm{ t , \bar{t} })$ (d). The measurements are presented relative to the MadGraph+PYTHIA6 prediction. A horizontal bin-centre correction is applied to all data points (cf. Section 6.2, Top quark and $ {\mathrm {t}\overline {\mathrm {t}}} $ differential cross sections). The inner (outer) error bars indicate the statistical (combined statistical and systematic) uncertainties. The predictions from MadGraph+PYTHIA6, POWHEG+PYTHIA6, POWHEG+HERWIG6 and MCatNLO+HERWIG6, also presented relative to MadGraph+PYTHIA6, are shown for comparison. |
png pdf |
Figure 15-d:
Comparison of normalized differential $ {\mathrm {t}\overline {\mathrm {t}}} $ production cross section in the dilepton and $ {\ell }$+jets channels as a function of the $ {p_{\mathrm {T}}} ^{ {\mathrm {t}} }$ (a), the $ {\mathrm {t}\overline {\mathrm {t}}} $ rest frame $ {p_{\mathrm {T}}} ^{ {\mathrm {t}} \ast }$ (b), and the rapidity $y_{ {\mathrm {t}} }$ (c) of the top quarks or antiquarks, and the difference in the azimuthal angle between the top quark and the antiquark $\Delta \phi (\mathrm{ t , \bar{t} })$ (d). The measurements are presented relative to the MadGraph+PYTHIA6 prediction. A horizontal bin-centre correction is applied to all data points (cf. Section 6.2, Top quark and $ {\mathrm {t}\overline {\mathrm {t}}} $ differential cross sections). The inner (outer) error bars indicate the statistical (combined statistical and systematic) uncertainties. The predictions from MadGraph+PYTHIA6, POWHEG+PYTHIA6, POWHEG+HERWIG6 and MCatNLO+HERWIG6, also presented relative to MadGraph+PYTHIA6, are shown for comparison. |

png pdf |
Figure 16-a:
Comparison of normalized differential $ {\mathrm {t}\overline {\mathrm {t}}} $ production cross section in the dilepton and $ {\ell }$+jets channels as a function of the $ {p_{\mathrm {T}}} $ of the leading (a) and trailing (b) top quarks or antiquarks. The measurements are presented relative to the MadGraph+PYTHIA6 prediction. A horizontal bin-centre correction is applied to all data points (cf. Section 6.2, Top quark and $ {\mathrm {t}\overline {\mathrm {t}}} $ differential cross sections). The inner (outer) error bars indicate the statistical (combined statistical and systematic) uncertainties. The predictions from POWHEG+PYTHIA6, POWHEG+HERWIG6 and MCatNLO+HERWIG6, also presented relative to MadGraph+PYTHIA6, are shown for comparison. |
png pdf |
Figure 16-b:
Comparison of normalized differential $ {\mathrm {t}\overline {\mathrm {t}}} $ production cross section in the dilepton and $ {\ell }$+jets channels as a function of the $ {p_{\mathrm {T}}} $ of the leading (a) and trailing (b) top quarks or antiquarks. The measurements are presented relative to the MadGraph+PYTHIA6 prediction. A horizontal bin-centre correction is applied to all data points (cf. Section 6.2, Top quark and $ {\mathrm {t}\overline {\mathrm {t}}} $ differential cross sections). The inner (outer) error bars indicate the statistical (combined statistical and systematic) uncertainties. The predictions from POWHEG+PYTHIA6, POWHEG+HERWIG6 and MCatNLO+HERWIG6, also presented relative to MadGraph+PYTHIA6, are shown for comparison. |
png pdf |
Figure 17-a:
Comparison of normalized differential $ {\mathrm {t}\overline {\mathrm {t}}} $ production cross section in the dilepton and $ {\ell }$+jets channels as a function of the $ {p_{\mathrm {T}}} ^{ {\mathrm {t}\overline {\mathrm {t}}} }$ (a), $y_{ {\mathrm {t}\overline {\mathrm {t}}} }$ (b), and $m_{ {\mathrm {t}\overline {\mathrm {t}}} }$ (c) of the $ {\mathrm {t}\overline {\mathrm {t}}} $ system. The measurements are presented relative to theMadGraph+HERWIG6 prediction. A horizontal bin-centre correction is applied to all data points (cf. Section 6.2, Top quark and $ {\mathrm {t}\overline {\mathrm {t}}} $ differential cross sections). The inner (outer) error bars indicate the statistical (combined statistical and systematic) uncertainties. The predictions from POWHEG+PYTHIA6, POWHEG+HERWIG6 and MCatNLO+HERWIG6, also presented relative to MadGraph+PYTHIA6, are shown for comparison. For better visibility, data points with identical bin centres are shifted horizontally by a negligible amount. |
png pdf |
Figure 17-b:
Comparison of normalized differential $ {\mathrm {t}\overline {\mathrm {t}}} $ production cross section in the dilepton and $ {\ell }$+jets channels as a function of the $ {p_{\mathrm {T}}} ^{ {\mathrm {t}\overline {\mathrm {t}}} }$ (a), $y_{ {\mathrm {t}\overline {\mathrm {t}}} }$ (b), and $m_{ {\mathrm {t}\overline {\mathrm {t}}} }$ (c) of the $ {\mathrm {t}\overline {\mathrm {t}}} $ system. The measurements are presented relative to theMadGraph+HERWIG6 prediction. A horizontal bin-centre correction is applied to all data points (cf. Section 6.2, Top quark and $ {\mathrm {t}\overline {\mathrm {t}}} $ differential cross sections). The inner (outer) error bars indicate the statistical (combined statistical and systematic) uncertainties. The predictions from POWHEG+PYTHIA6, POWHEG+HERWIG6 and MCatNLO+HERWIG6, also presented relative to MadGraph+PYTHIA6, are shown for comparison. For better visibility, data points with identical bin centres are shifted horizontally by a negligible amount. |

png pdf |
Figure 17-c:
Comparison of normalized differential $ {\mathrm {t}\overline {\mathrm {t}}} $ production cross section in the dilepton and $ {\ell }$+jets channels as a function of the $ {p_{\mathrm {T}}} ^{ {\mathrm {t}\overline {\mathrm {t}}} }$ (a), $y_{ {\mathrm {t}\overline {\mathrm {t}}} }$ (b), and $m_{ {\mathrm {t}\overline {\mathrm {t}}} }$ (c) of the $ {\mathrm {t}\overline {\mathrm {t}}} $ system. The measurements are presented relative to theMadGraph+HERWIG6 prediction. A horizontal bin-centre correction is applied to all data points (cf. Section 6.2, Top quark and $ {\mathrm {t}\overline {\mathrm {t}}} $ differential cross sections). The inner (outer) error bars indicate the statistical (combined statistical and systematic) uncertainties. The predictions from POWHEG+PYTHIA6, POWHEG+HERWIG6 and MCatNLO+HERWIG6, also presented relative to MadGraph+PYTHIA6, are shown for comparison. For better visibility, data points with identical bin centres are shifted horizontally by a negligible amount. |
png pdf |
Figure 18-a:
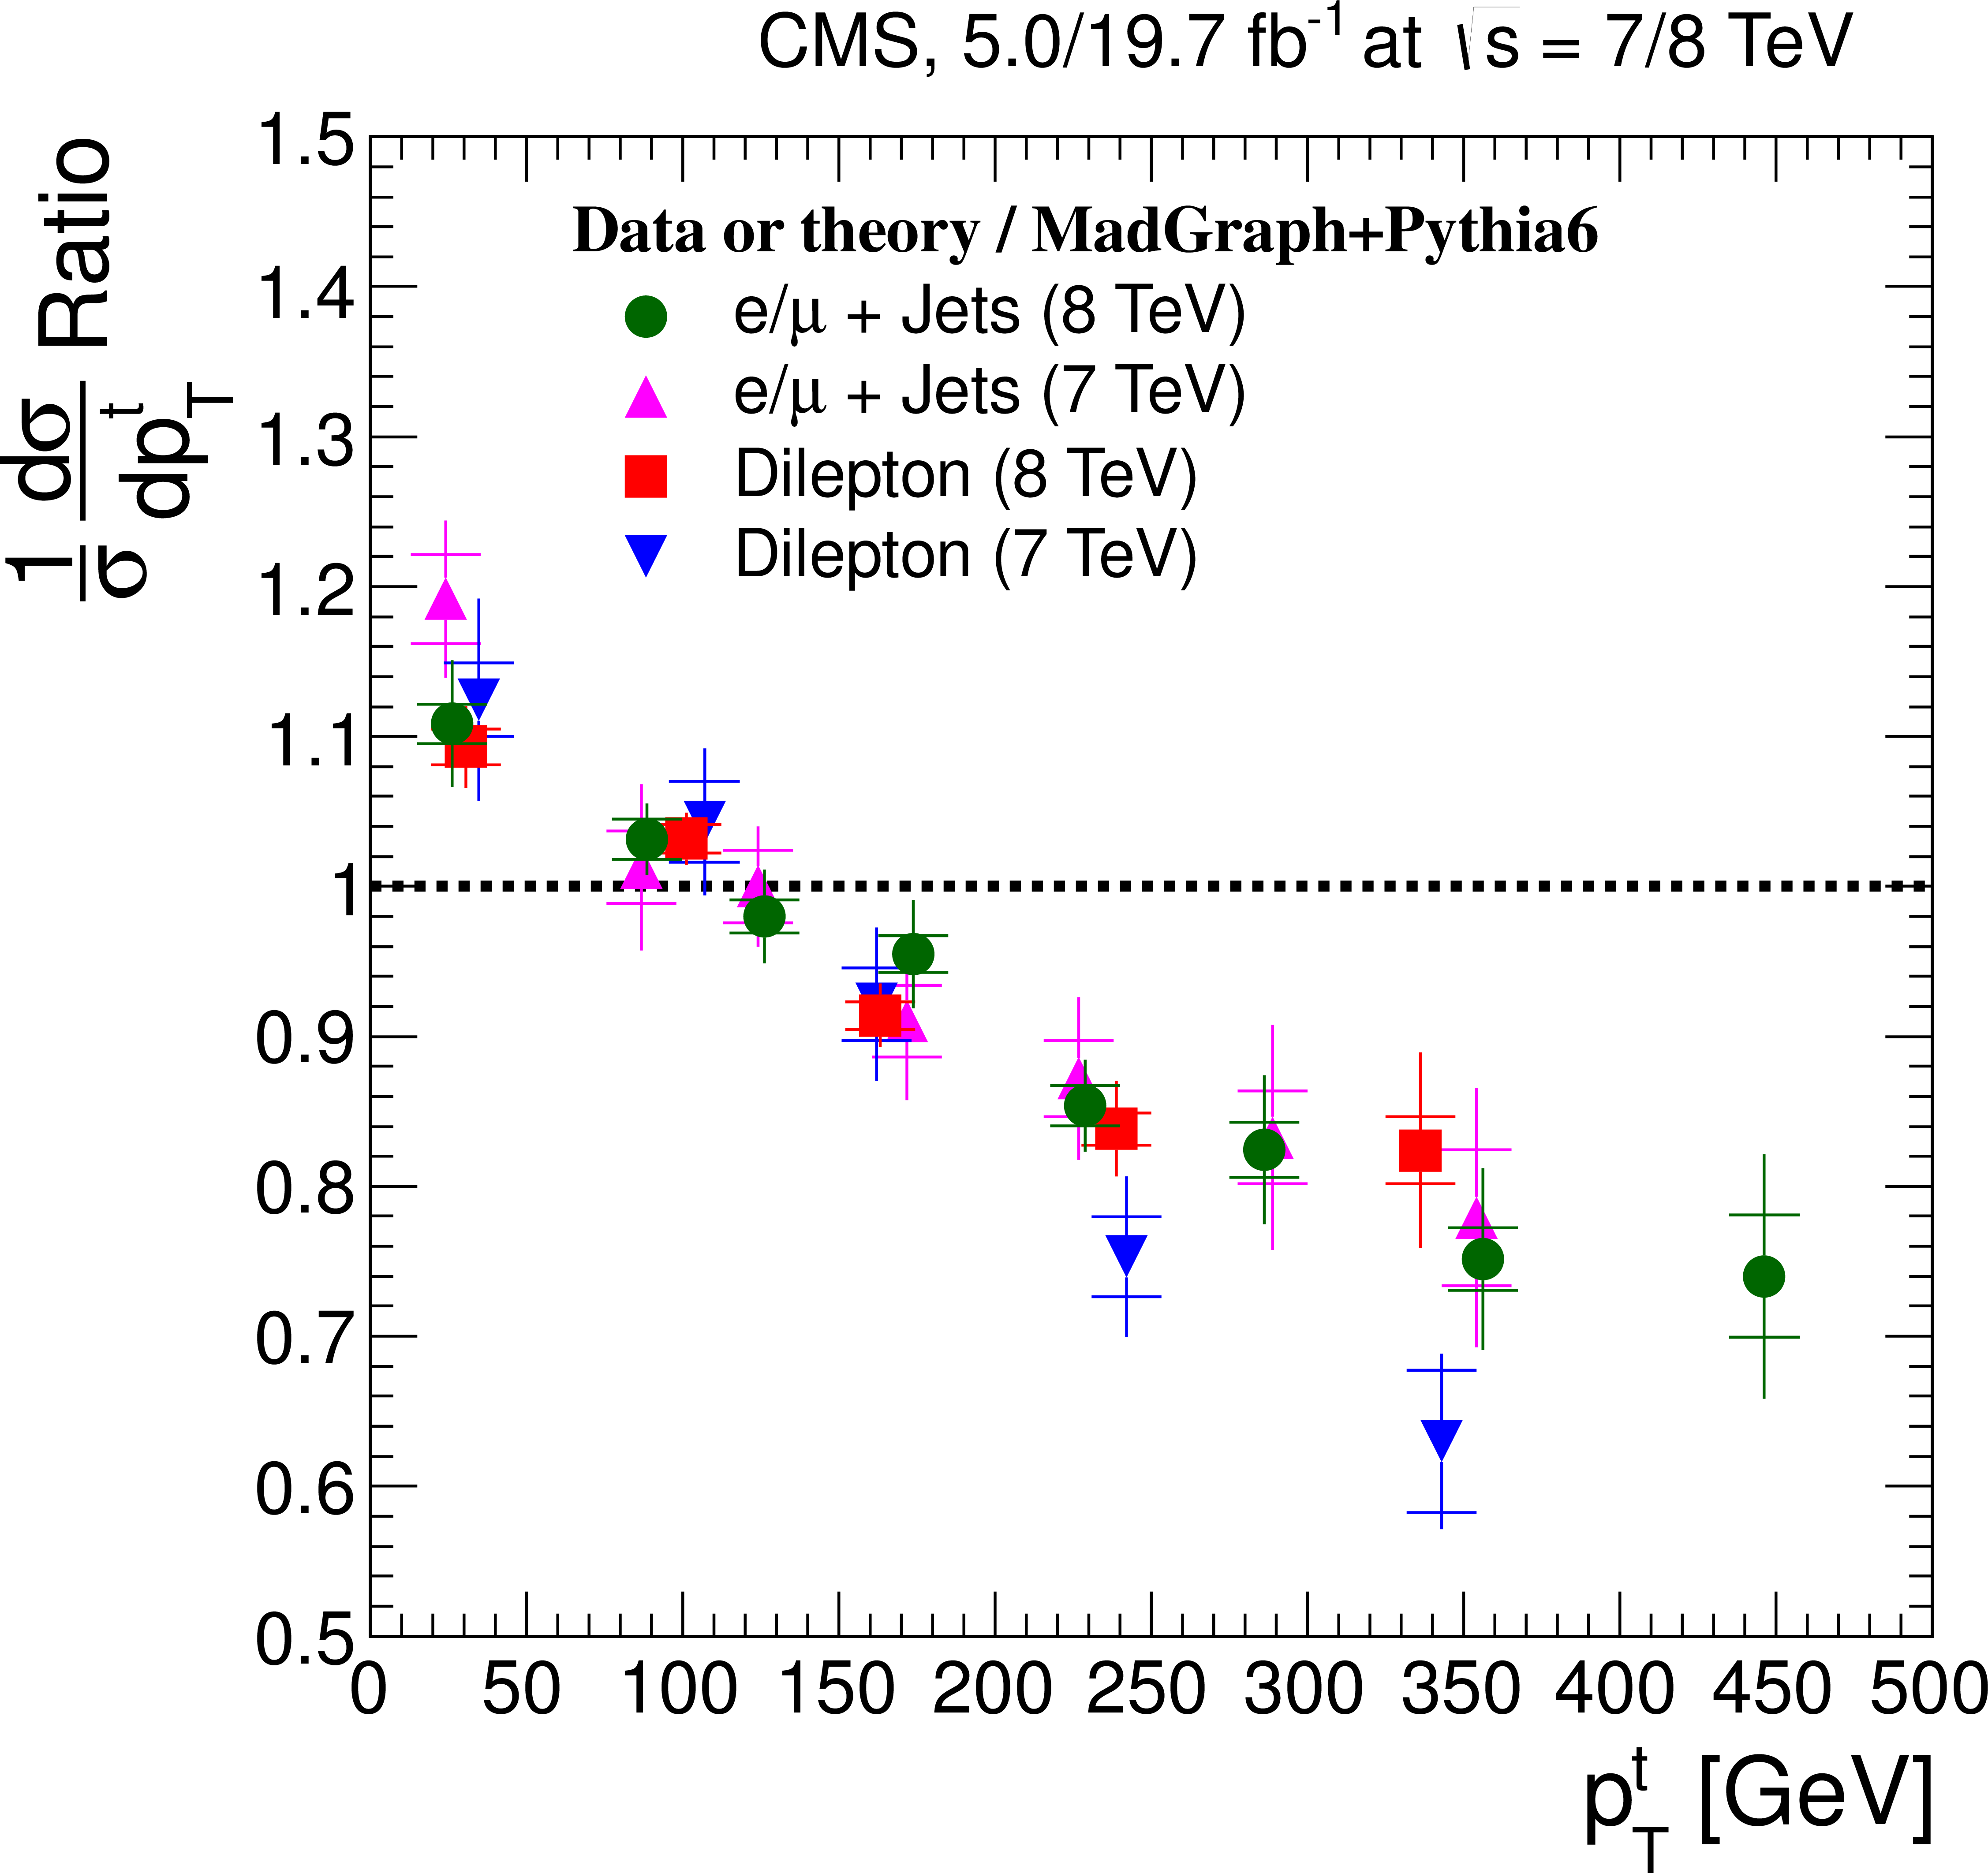
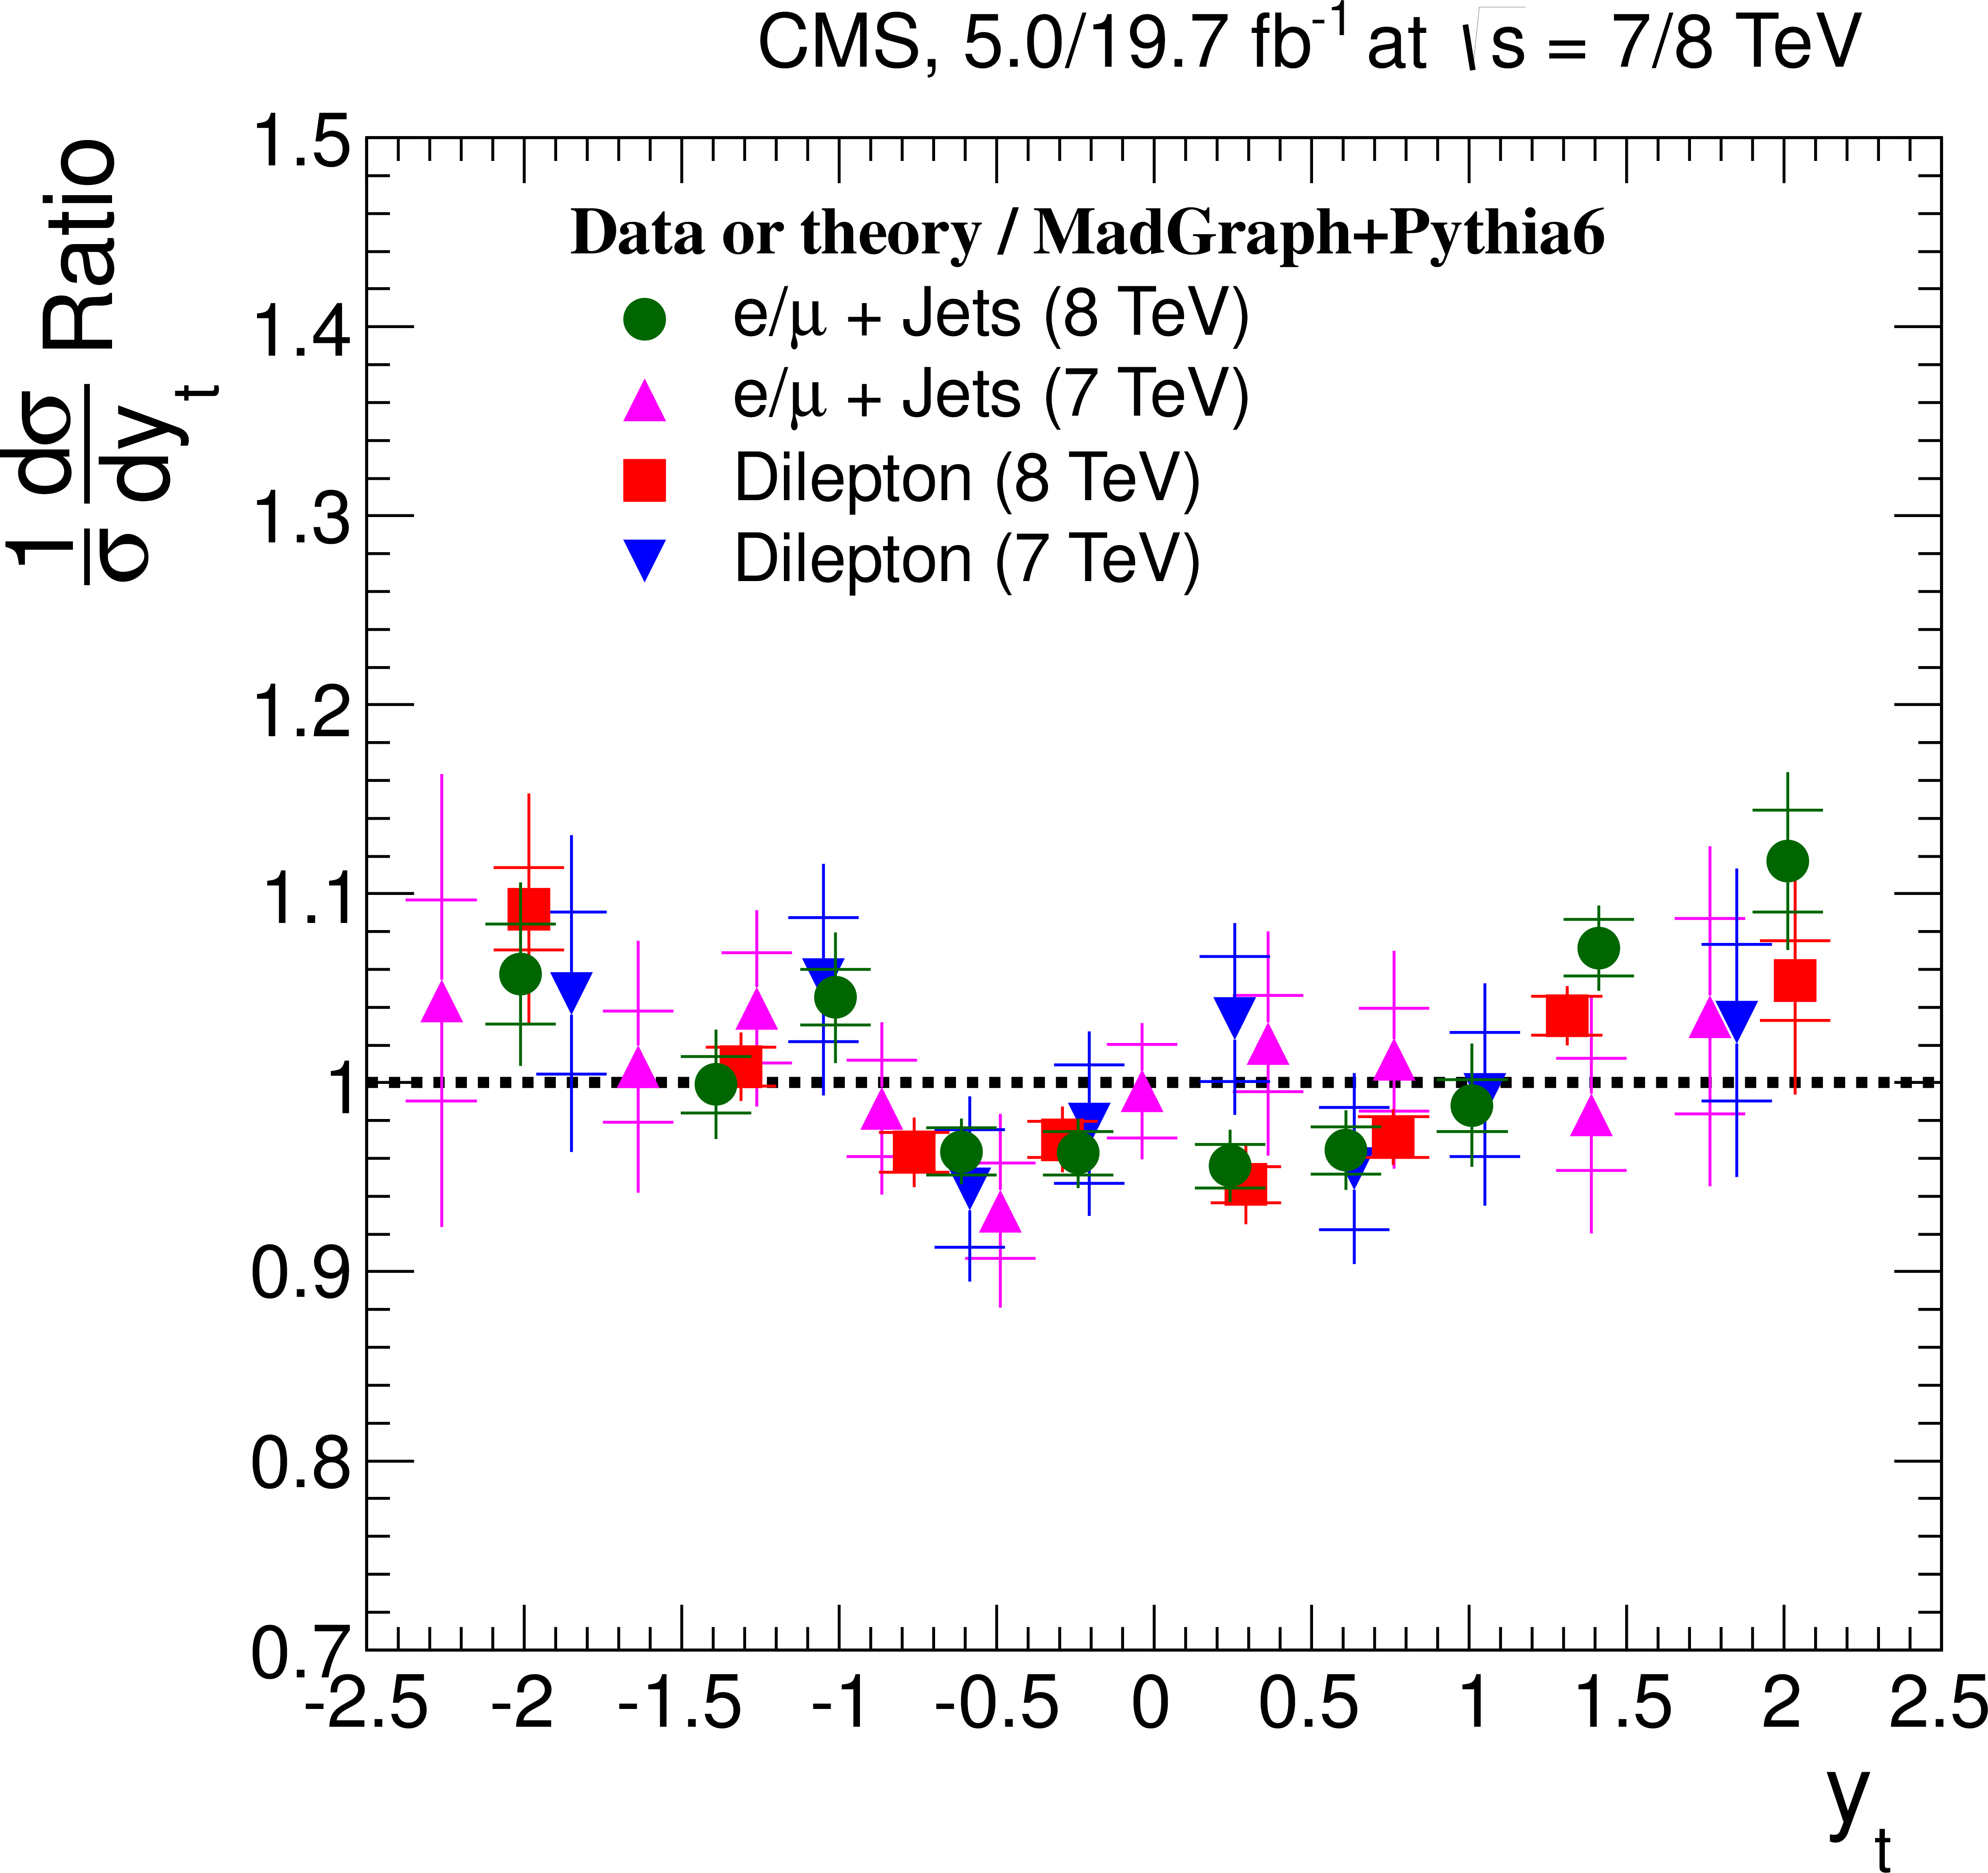
Comparison of normalized differential $ {\mathrm {t}\overline {\mathrm {t}}} $ production cross section in the dilepton and $ {\ell }$+jets channels at 7 TeV and 8 TeV , as a function of the $ {p_{\mathrm {T}}} ^{ {\mathrm {t}} }$ (a) and rapidity $y_{ {\mathrm {t}} }$ (b) of the top quarks or antiquarks. The measurements are presented relative to the corresponding MadGraph+PYTHIA6 predictions. A horizontal bin-centre correction is applied to all data points (cf. Section 6.2, Top quark and $ {\mathrm {t}\overline {\mathrm {t}}} $ differential cross sections). The inner (outer) error bars indicate the statistical (combined statistical and systematic) uncertainties. For better visibility, data points with identical bin centres are shifted horizontally by a negligible amount. |
png pdf |
Figure 18-b:
Comparison of normalized differential $ {\mathrm {t}\overline {\mathrm {t}}} $ production cross section in the dilepton and $ {\ell }$+jets channels at 7 TeV and 8 TeV , as a function of the $ {p_{\mathrm {T}}} ^{ {\mathrm {t}} }$ (a) and rapidity $y_{ {\mathrm {t}} }$ (b) of the top quarks or antiquarks. The measurements are presented relative to the corresponding MadGraph+PYTHIA6 predictions. A horizontal bin-centre correction is applied to all data points (cf. Section 6.2, Top quark and $ {\mathrm {t}\overline {\mathrm {t}}} $ differential cross sections). The inner (outer) error bars indicate the statistical (combined statistical and systematic) uncertainties. For better visibility, data points with identical bin centres are shifted horizontally by a negligible amount. |
png pdf |
Figure 19-a:
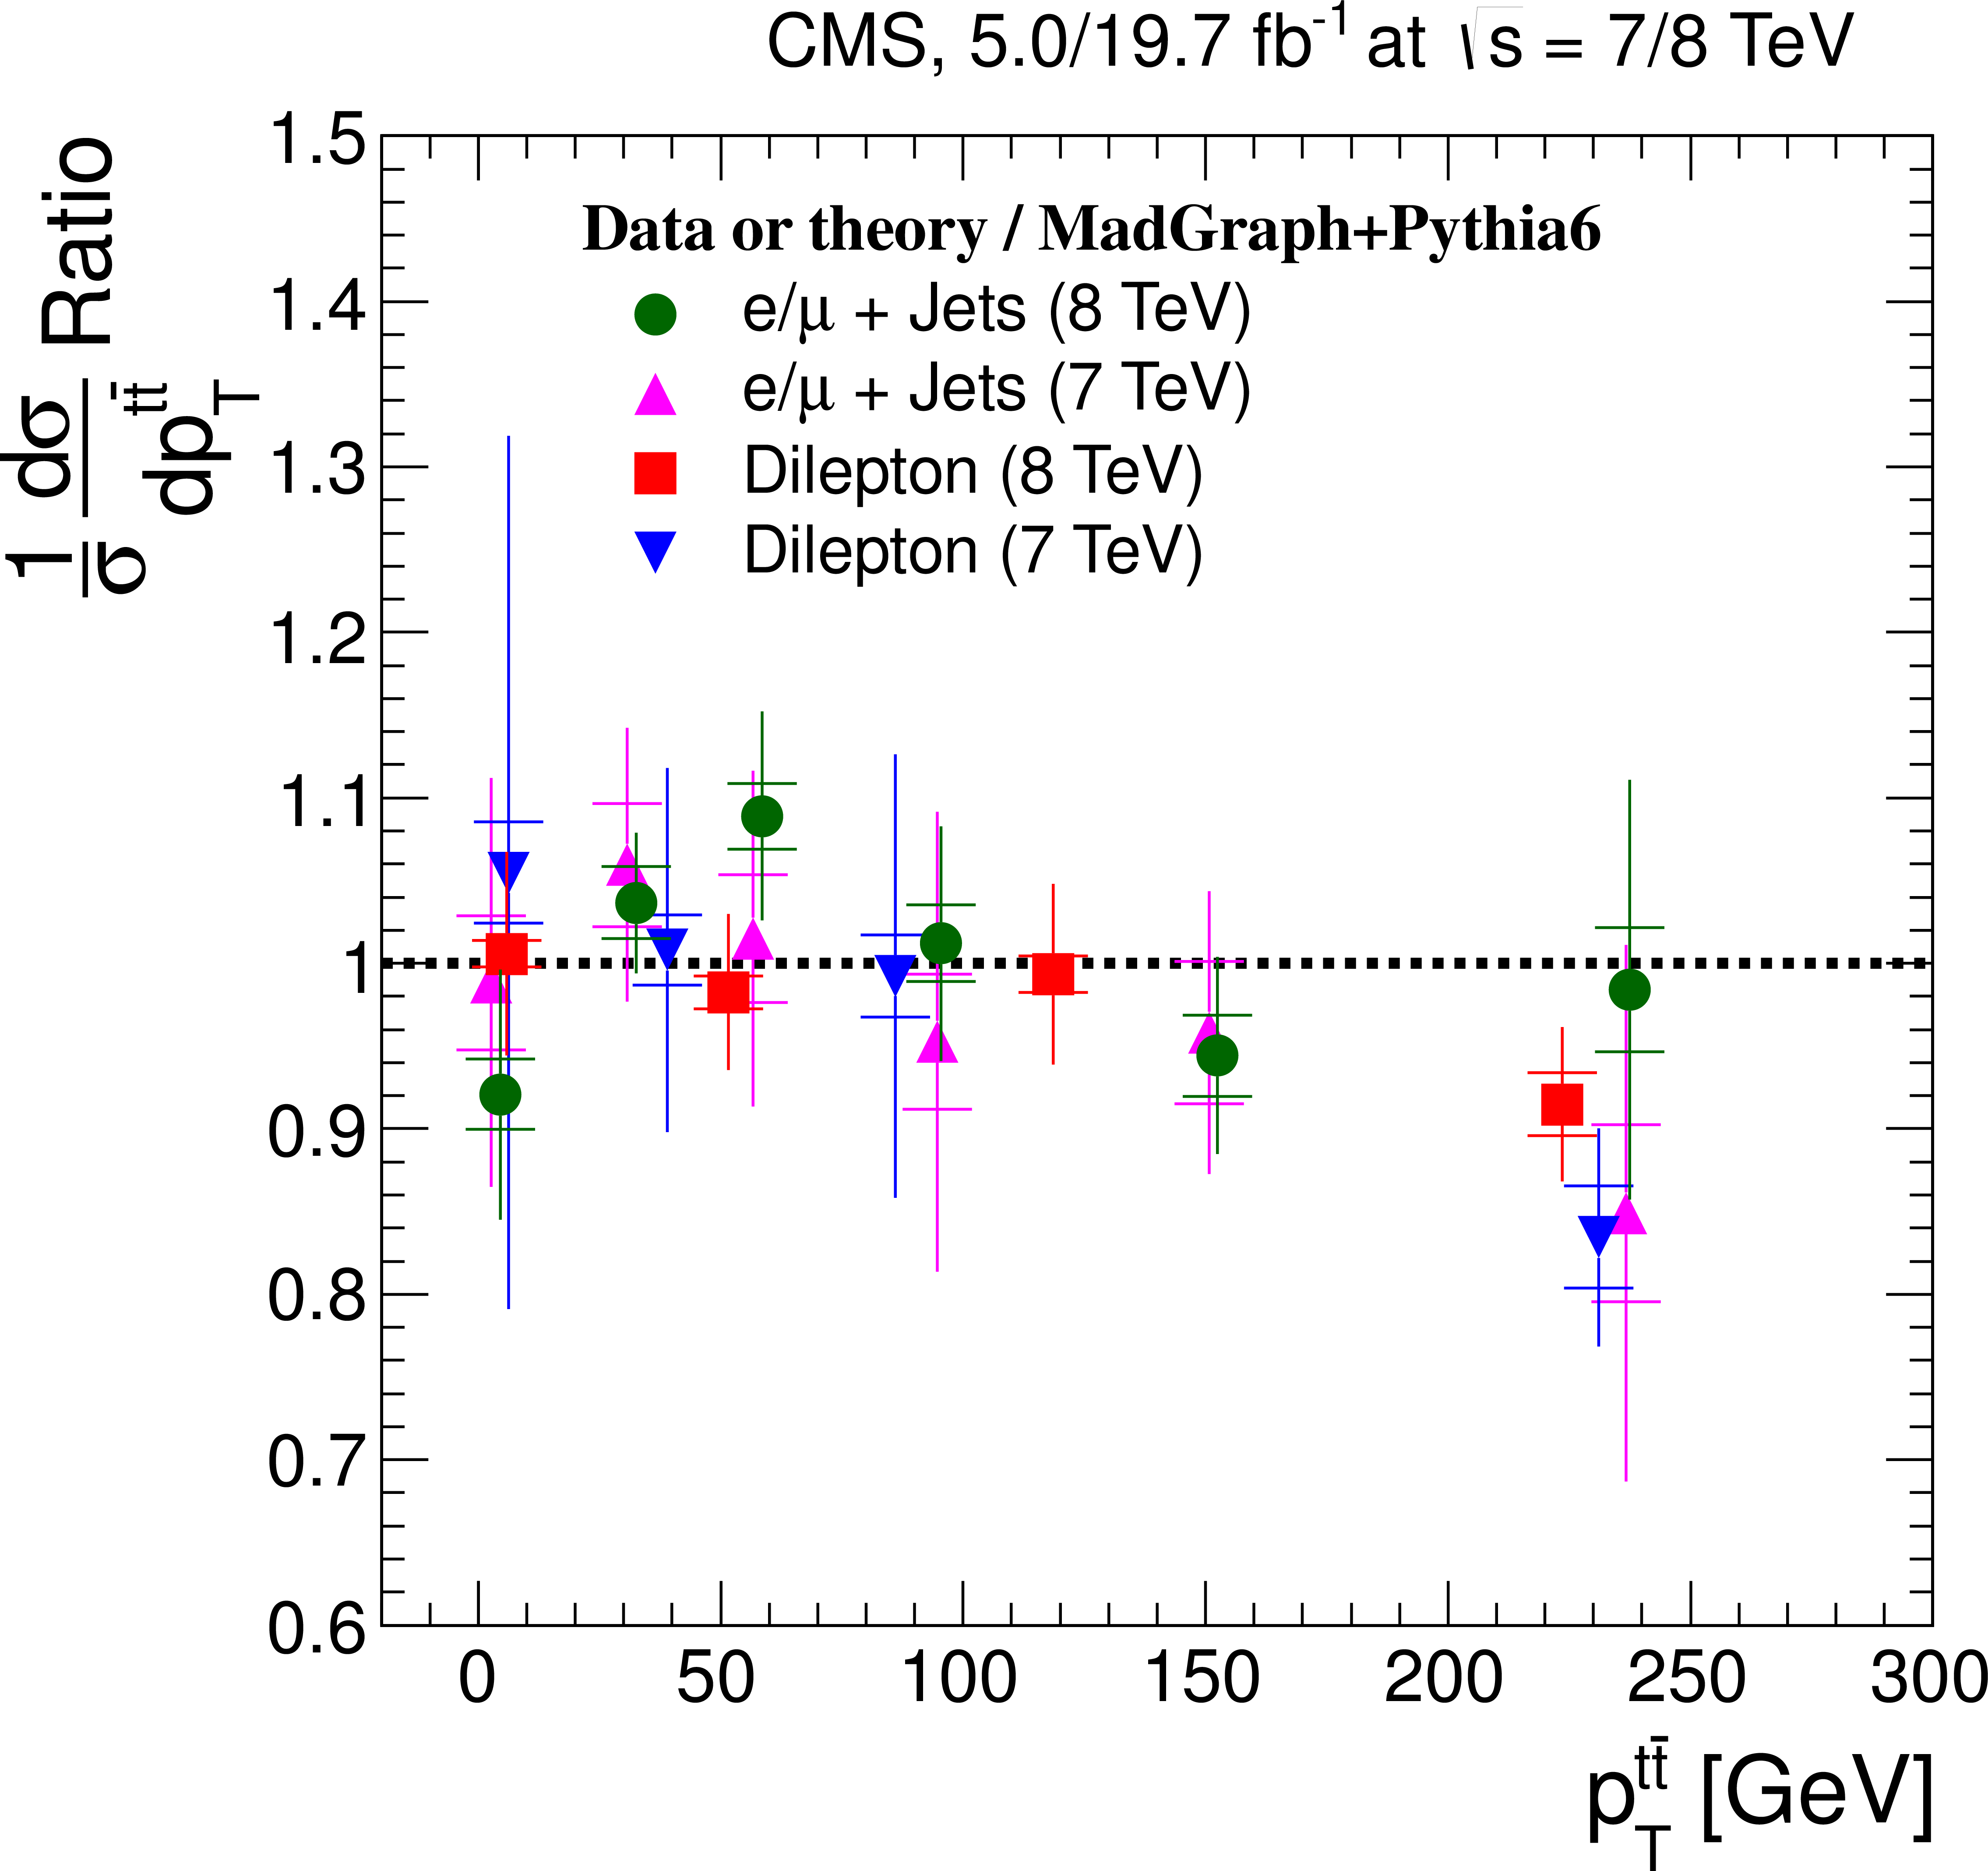
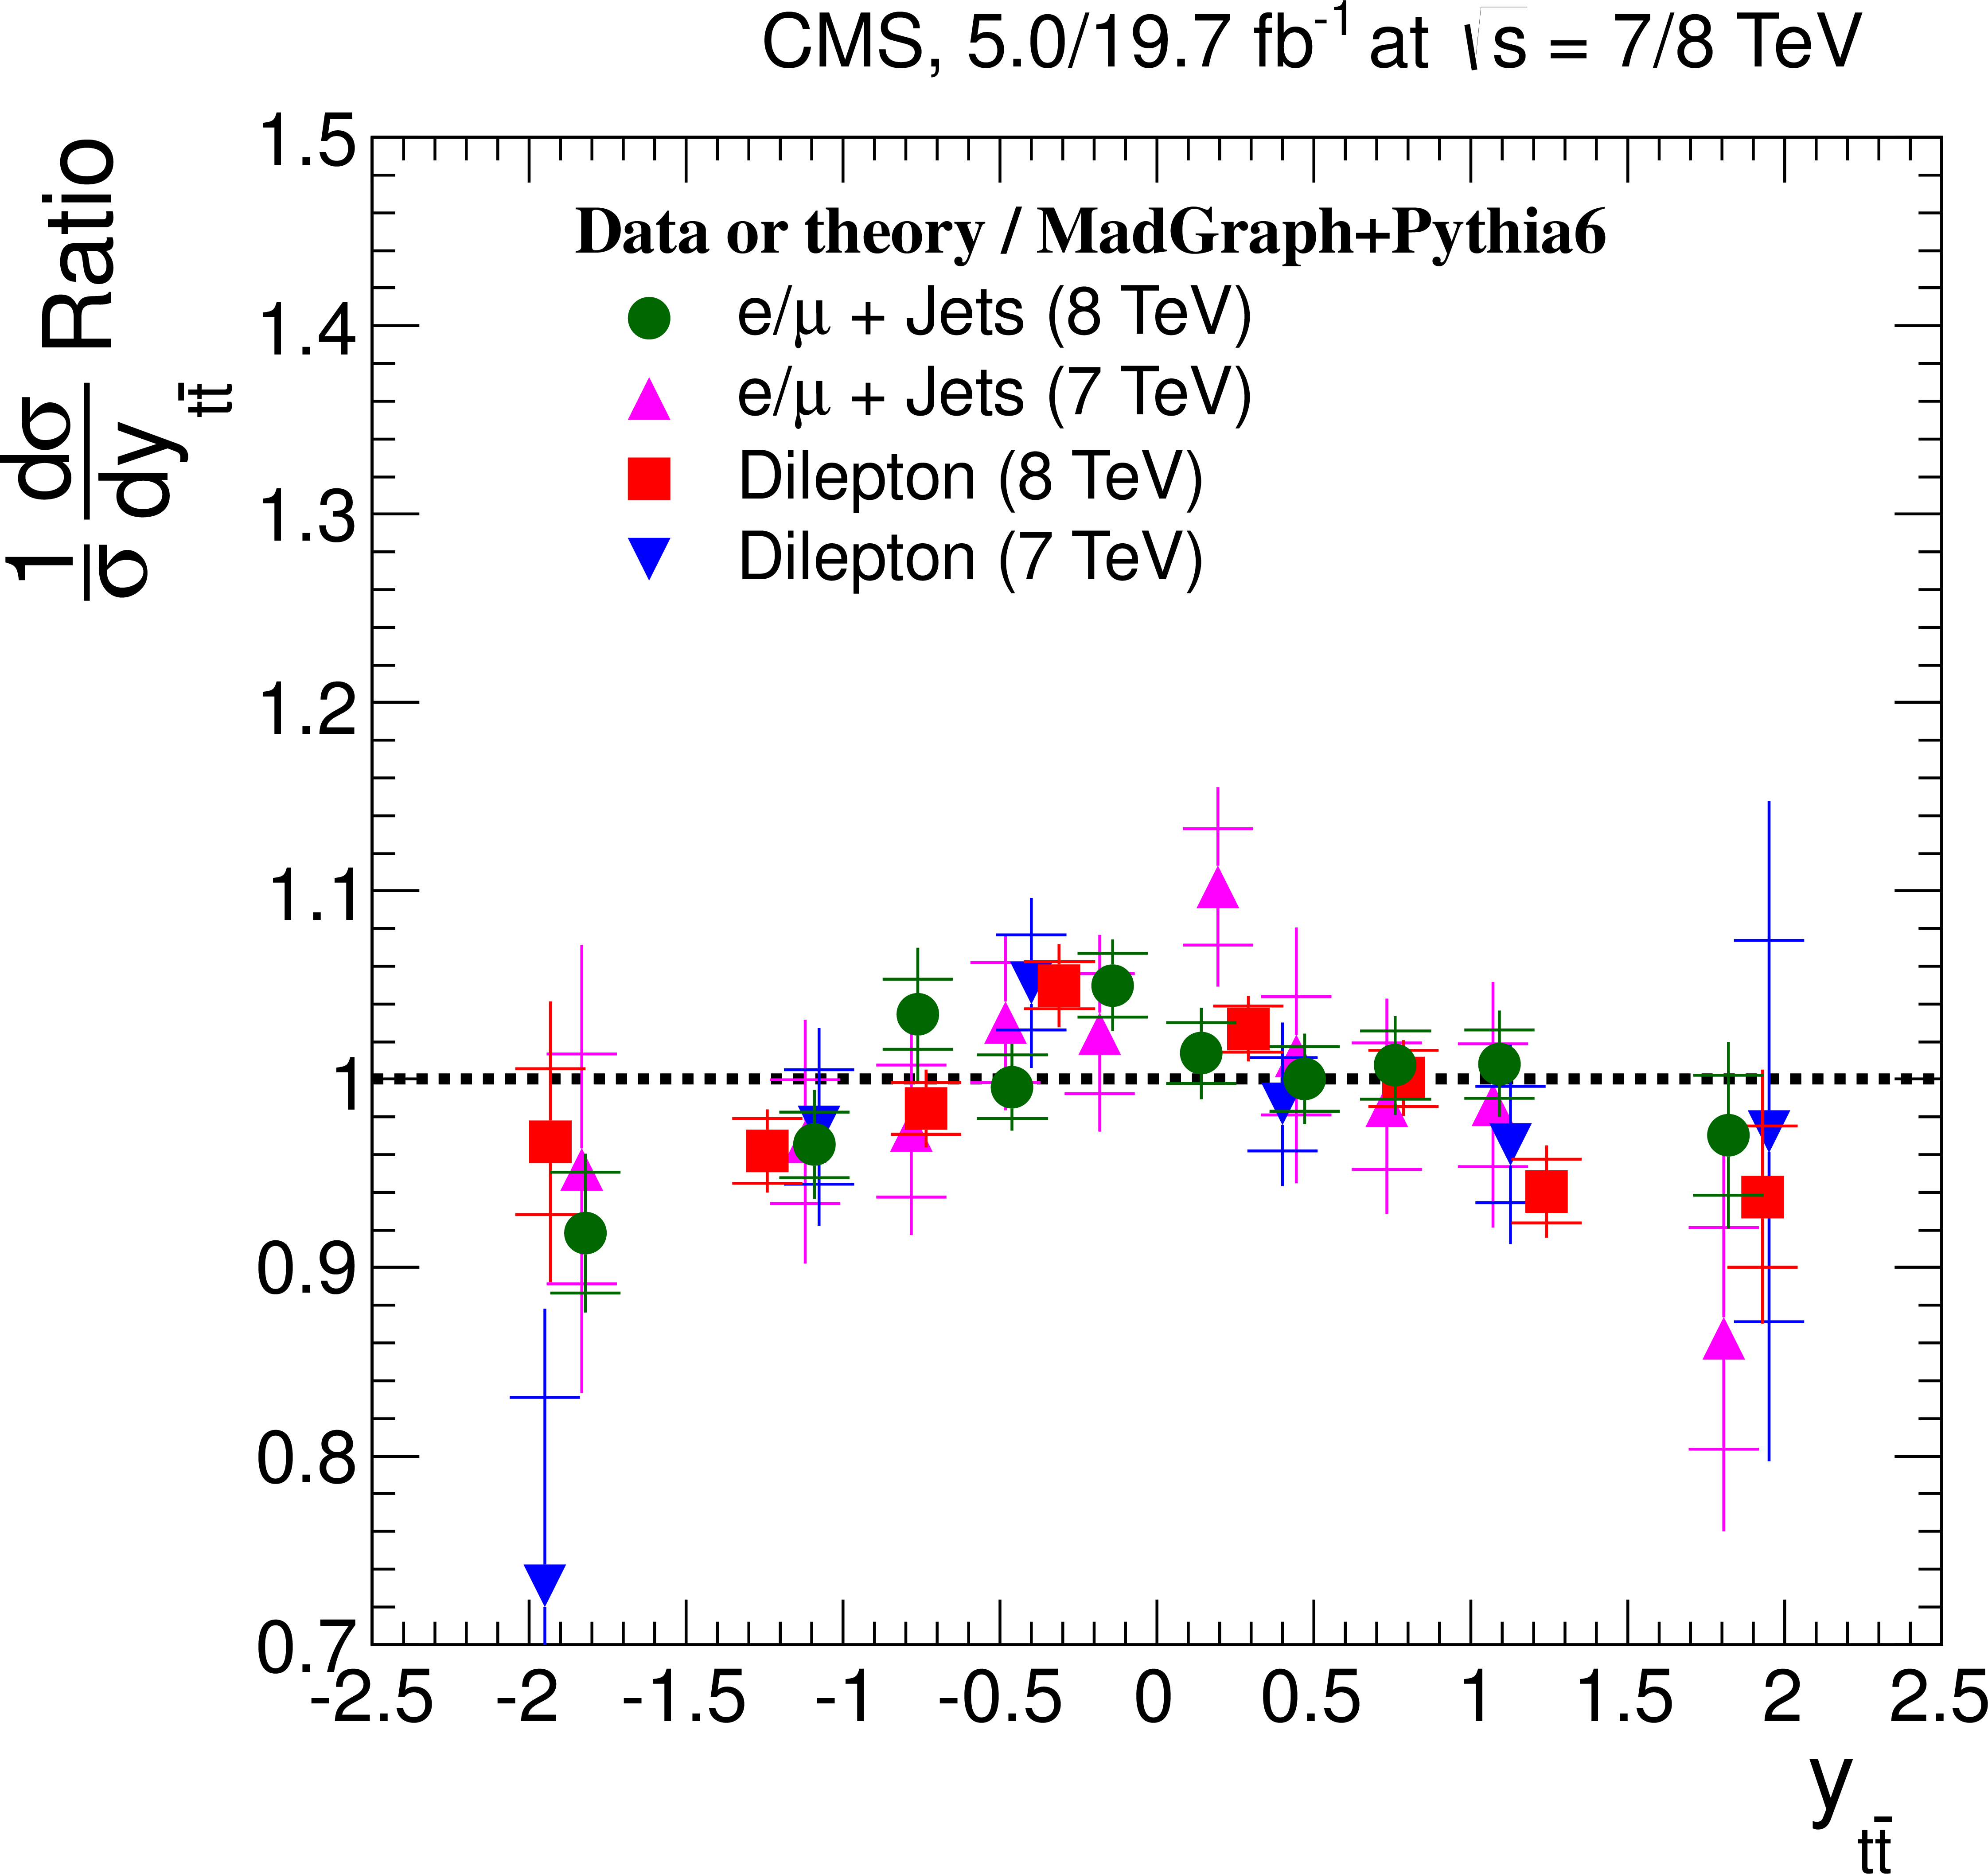
Comparison of normalized differential $ {\mathrm {t}\overline {\mathrm {t}}} $ production cross section in the dilepton and $ {\ell }$+jets channels at 7 TeV and 8 TeV , as a function of the $ {p_{\mathrm {T}}} ^{ {\mathrm {t}\overline {\mathrm {t}}} }$ (a), $y_{ {\mathrm {t}\overline {\mathrm {t}}} }$ (b), and $m_{ {\mathrm {t}\overline {\mathrm {t}}} }$ (c) of the $ {\mathrm {t}\overline {\mathrm {t}}} $ system. The measurements are presented relative to the corresponding MadGraph+PYTHIA6 predictions. A horizontal bin-centre correction is applied to all data points (cf. Section 6.2, Top quark and $ {\mathrm {t}\overline {\mathrm {t}}} $ differential cross sections). The inner (outer) error bars indicate the statistical (combined statistical and systematic) uncertainties. For better visibility, data points with identical bin centres are shifted horizontally by a negligible amount. |
png pdf |
Figure 19-b:
Comparison of normalized differential $ {\mathrm {t}\overline {\mathrm {t}}} $ production cross section in the dilepton and $ {\ell }$+jets channels at 7 TeV and 8 TeV , as a function of the $ {p_{\mathrm {T}}} ^{ {\mathrm {t}\overline {\mathrm {t}}} }$ (a), $y_{ {\mathrm {t}\overline {\mathrm {t}}} }$ (b), and $m_{ {\mathrm {t}\overline {\mathrm {t}}} }$ (c) of the $ {\mathrm {t}\overline {\mathrm {t}}} $ system. The measurements are presented relative to the corresponding MadGraph+PYTHIA6 predictions. A horizontal bin-centre correction is applied to all data points (cf. Section 6.2, Top quark and $ {\mathrm {t}\overline {\mathrm {t}}} $ differential cross sections). The inner (outer) error bars indicate the statistical (combined statistical and systematic) uncertainties. For better visibility, data points with identical bin centres are shifted horizontally by a negligible amount. |
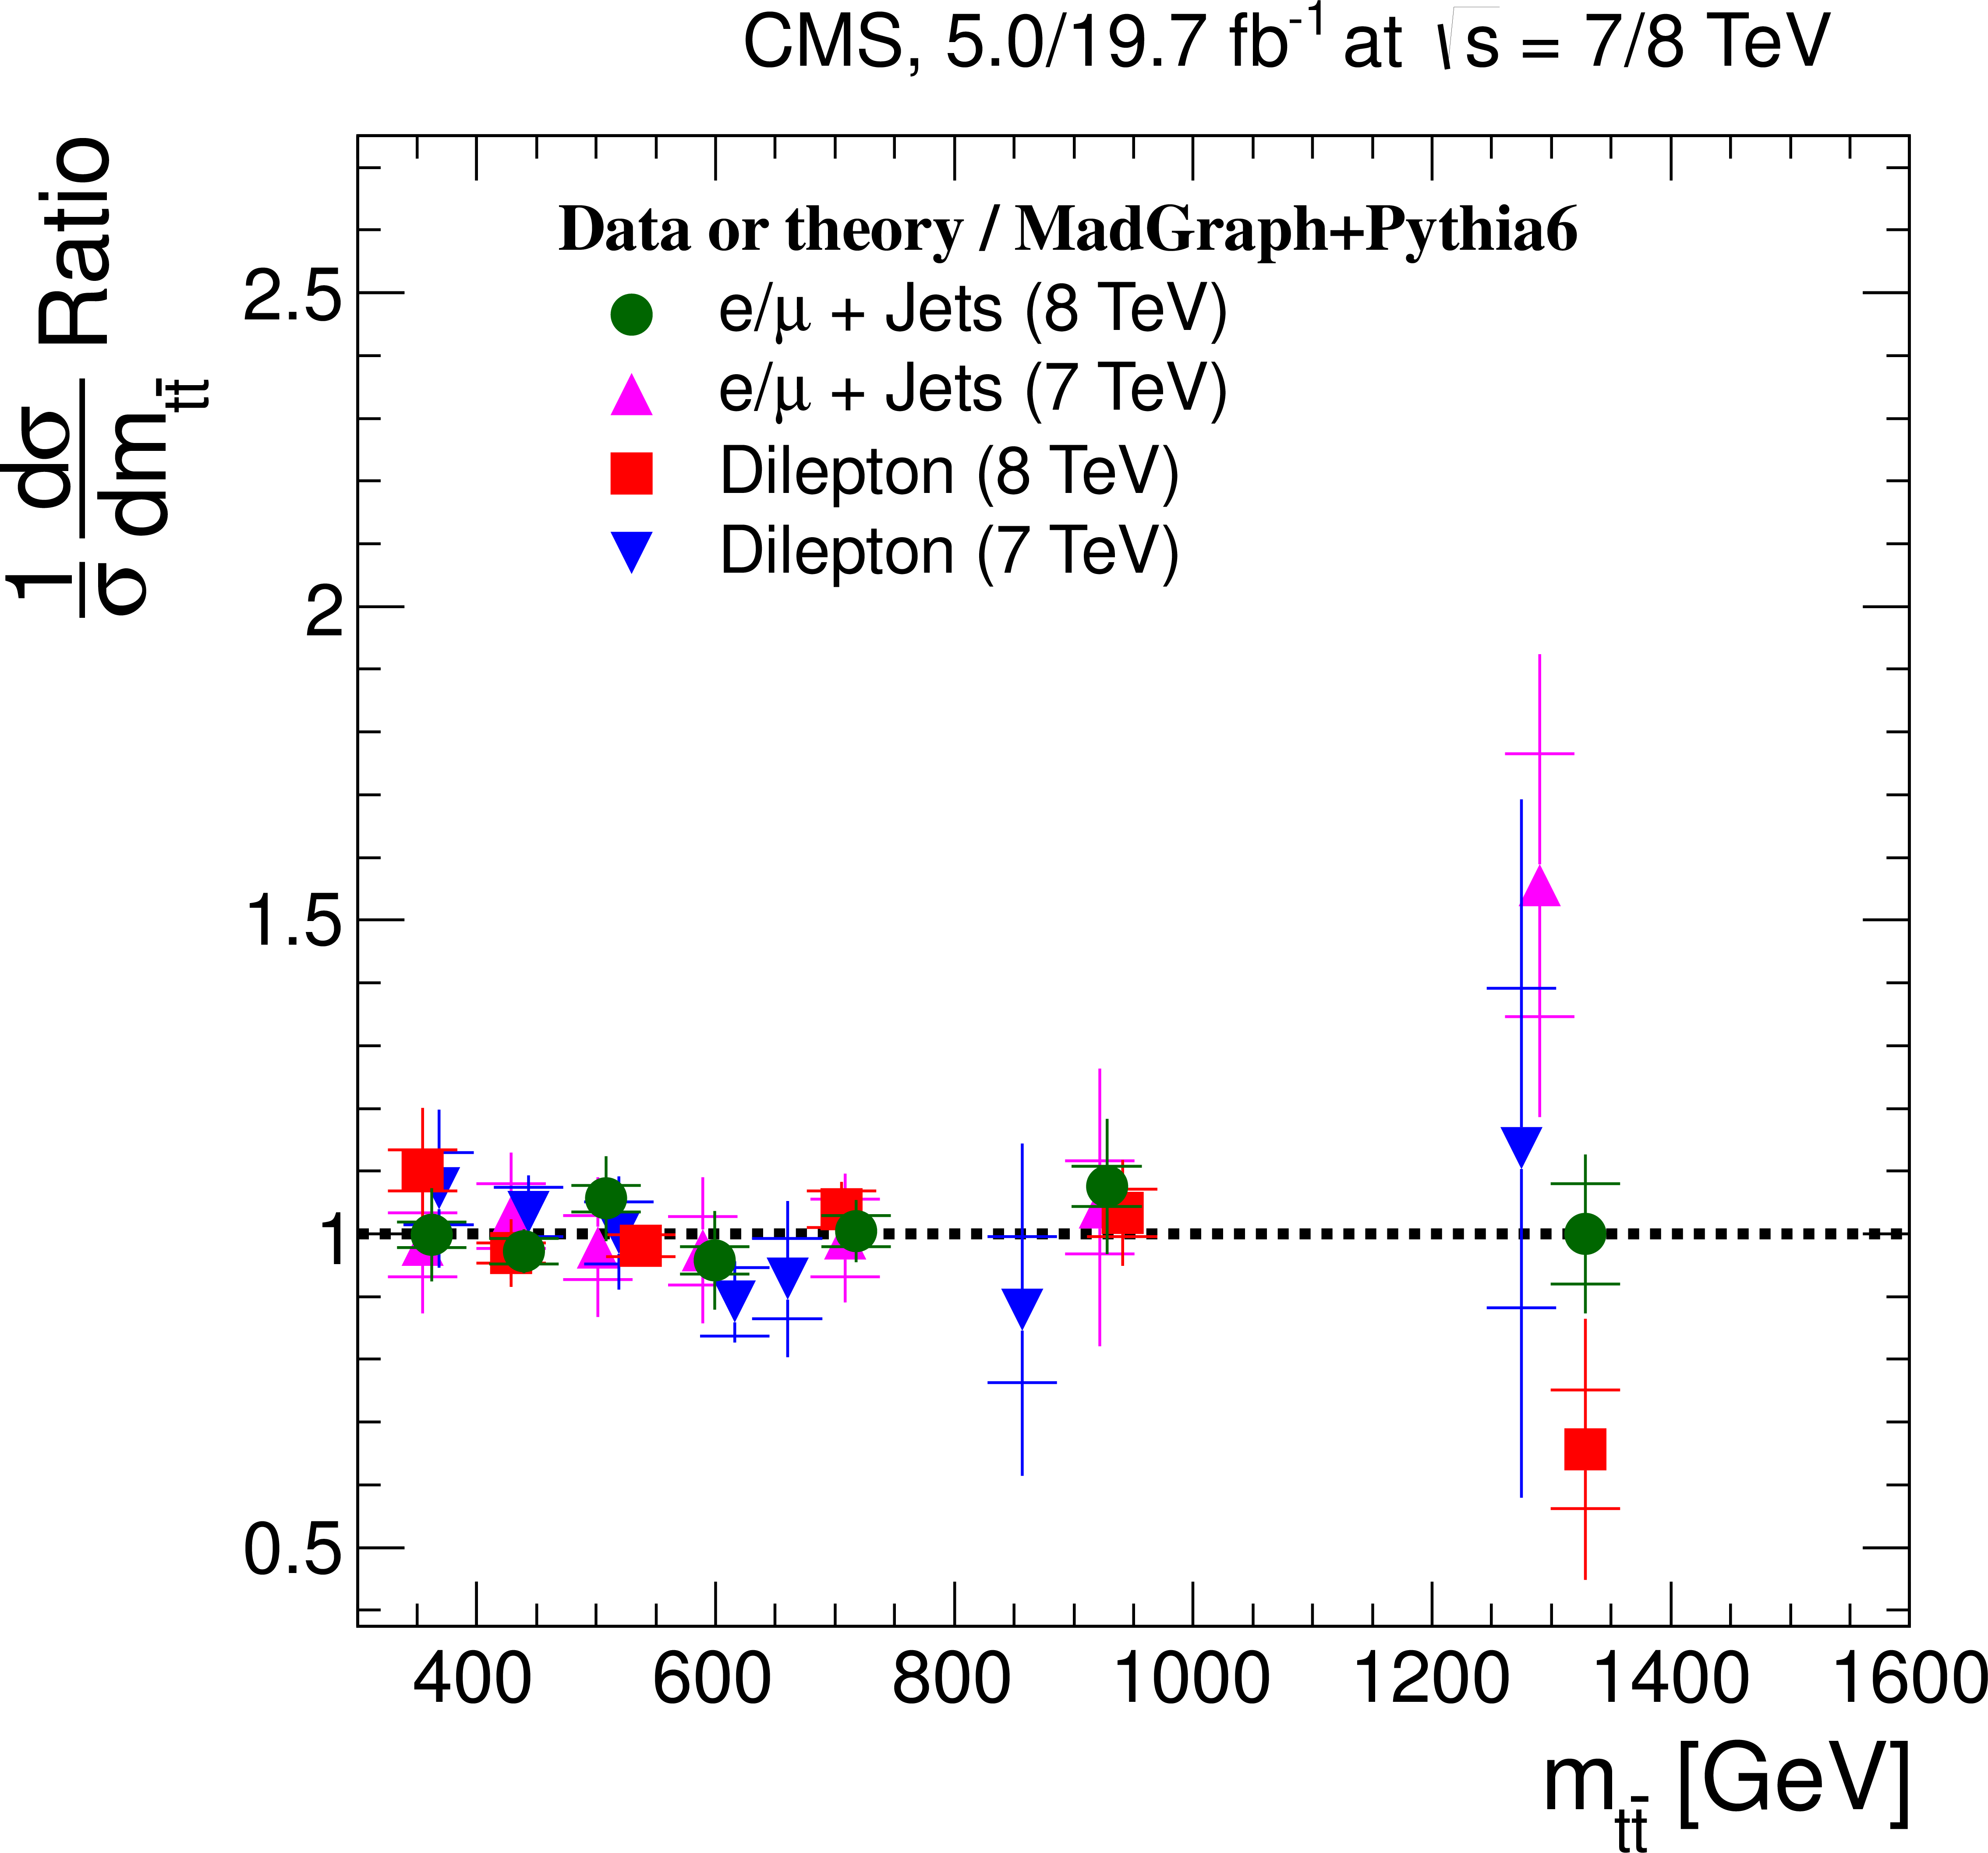
png pdf |
Figure 19-c:
Comparison of normalized differential $ {\mathrm {t}\overline {\mathrm {t}}} $ production cross section in the dilepton and $ {\ell }$+jets channels at 7 TeV and 8 TeV , as a function of the $ {p_{\mathrm {T}}} ^{ {\mathrm {t}\overline {\mathrm {t}}} }$ (a), $y_{ {\mathrm {t}\overline {\mathrm {t}}} }$ (b), and $m_{ {\mathrm {t}\overline {\mathrm {t}}} }$ (c) of the $ {\mathrm {t}\overline {\mathrm {t}}} $ system. The measurements are presented relative to the corresponding MadGraph+PYTHIA6 predictions. A horizontal bin-centre correction is applied to all data points (cf. Section 6.2, Top quark and $ {\mathrm {t}\overline {\mathrm {t}}} $ differential cross sections). The inner (outer) error bars indicate the statistical (combined statistical and systematic) uncertainties. For better visibility, data points with identical bin centres are shifted horizontally by a negligible amount. |
| Tables | |
png pdf |
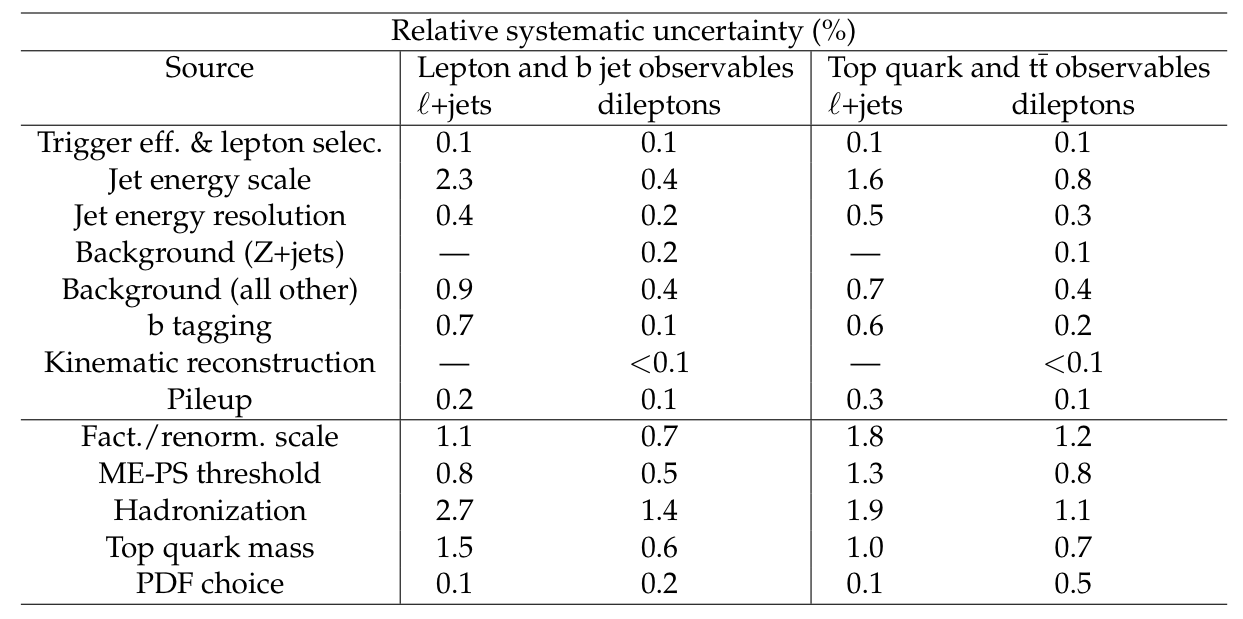
Table 1:
Breakdown of typical systematic uncertainties for the normalized differential cross sections. The uncertainty on the jet-parton matching threshold is indicated as ?ME-PS threshold?. The medians of the distribution of uncertainties over all bins of the measurement are quoted. For the $ \ell $+jets channels, the background from Z+jets is negligible and included in the ?Background (all other)? category. |
png |
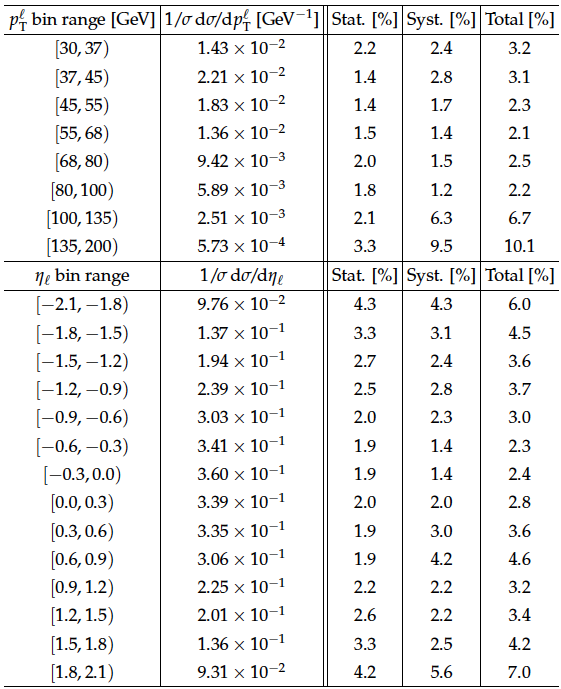
Table A1:
Normalized differential $ \mathrm{ t \bar{t} } $ cross section in the $ \ell $+jets channels as a function of the charged lepton transverse momentum ($ p_{ \mathrm{T} }^{ \ell } $) and pseudorapidity ($ \eta^{ \ell } $). The results are presented at particle level in the fiducial phase space. The statistical and systematic uncertainties are added in quadrature to yield the total uncertainty. |

png |
Table A2:
Normalized differential $\mathrm{ t \bar{t} }$ cross section in the $ \ell $+jets channels as a function of the b jet transverse momentum ($ {p_{\mathrm {T}}} ^{\mathrm{b} }$) and pseudorapidity ($\eta _{\mathrm{b} }$), and the transverse momentum ($ {p_{\mathrm {T}}} ^{ {\mathrm{b} \mathrm{ \bar{b} } } }$) and the invariant mass ($m_{ {\mathrm{b} \mathrm{ \bar{b} } } }$) of the $ {\mathrm{b} \mathrm{ \bar{b} } } $ system. The superscript `b' refers to both b and $\mathrm{ \bar{b} } $ jets. The results are presented at particle level in the fiducial phase space. The statistical and systematic uncertainties are added in quadrature to yield the total uncertainty. |
png |
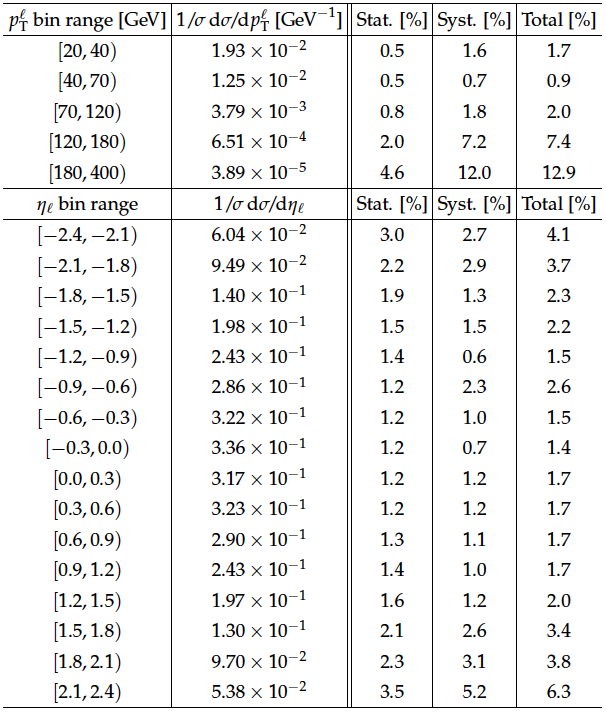
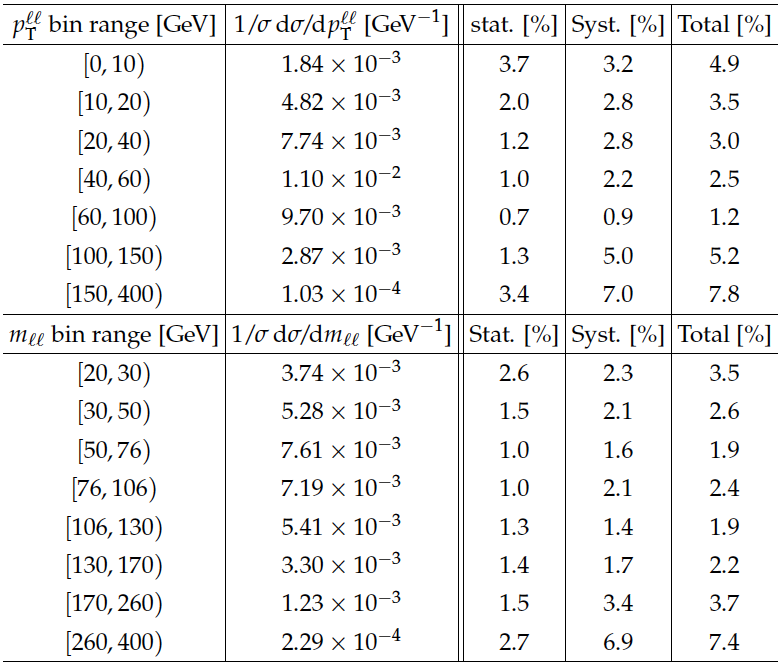
Table A3:
Normalized differential $\mathrm{ t \bar{t} }$ cross section in the dilepton channels as a function of the charged lepton transverse momentum ($ {p_{\mathrm {T}}} ^{\ell }$) and pseudorapidity ($\eta _{\ell }$). The superscript `$\ell $' refers to both $\ell ^{+}$ and $\ell ^{-}$. The results are presented at particle level in the fiducial phase space. The statistical and systematic uncertainties are added in quadrature to yield the total uncertainty. |
png |
Table A4:
Normalized differential $\mathrm{ t \bar{t} }$ cross section in the dilepton channels as a function of the transverse momentum ($ {p_{\mathrm {T}}} ^{\ell \ell }$) and the invariant mass ($m_{\ell \ell }$) of the dilepton pair. The superscript `$\ell $' refers to both $\ell ^{+}$ and $\ell ^{-}$. The results are presented at particle level in the fiducial phase space. The statistical and systematic uncertainties are added in quadrature to yield the total uncertainty. |
png |
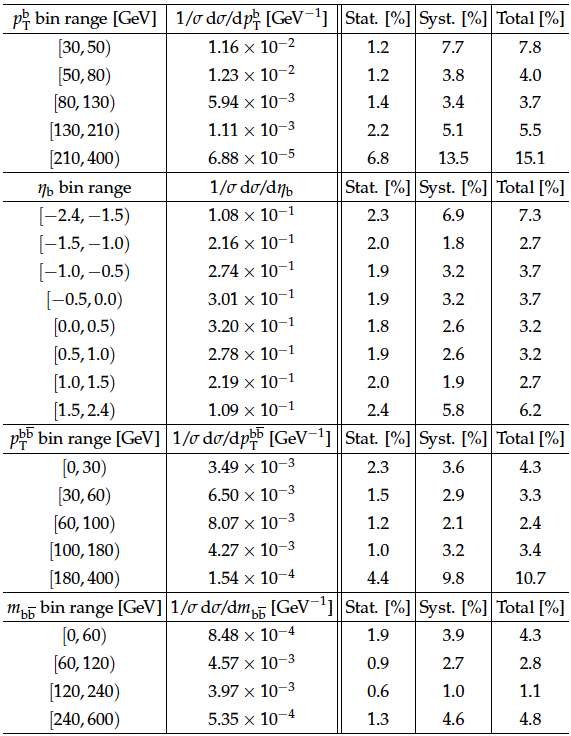
Table A5:
Normalized differential $\mathrm{ t \bar{t} }$ cross section in the dilepton channels as a function of the b jet transverse momentum ($ {p_{\mathrm {T}}} ^{\mathrm{b} }$) and pseudorapidity ($\eta _{\mathrm{b} }$), and the transverse momentum ($ {p_{\mathrm {T}}} ^{ {\mathrm{b} \mathrm{ \bar{b} } } }$) and the invariant mass ($m_{ {\mathrm{b} \mathrm{ \bar{b} } } }$) of the $ {\mathrm{b} \mathrm{ \bar{b} } } $ system. The superscript `b' refers to both b and $\mathrm{ \bar{b} } $ jets. The results are presented at particle level in the fiducial phase space. The statistical and systematic uncertainties are added in quadrature to yield the total uncertainty. |
png |
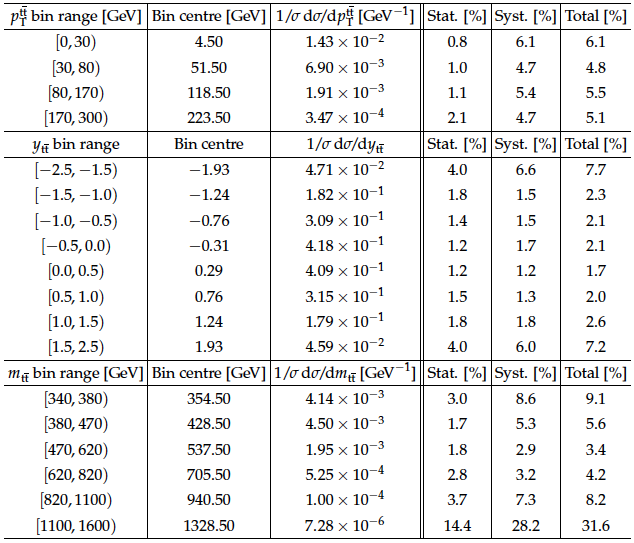
Table A6:
Normalized differential $\mathrm{ t \bar{t} }$ cross section in the $ \ell $+jets channels as a function of top quark or antiquark observables: the transverse momentum ($ {p_{\mathrm {T}}} ^{\mathrm{ t } }$) and the transverse momentum in the $\mathrm{ t \bar{t} }$ rest frame ($ {p_{\mathrm {T}}} ^{\mathrm{ t } * }$) of the top quarks or antiquarks. The horizontally-corrected bin centres according to the MadGraph+PYTHIA -6 prediction are also provided. The results are presented at parton level in the full phase space. The statistical and systematic uncertainties are added in quadrature to yield the total uncertainty. |
png |
Table A7:
Normalized differential $\mathrm{ t \bar{t} }$ cross section in the $ \ell $+jets channels as a function of top quark or antiquark observables: the rapidity ($y_{\mathrm{ t } }$) of the top quarks or antiquarks, and the difference in the azimuthal angle between the top quark and antiquark ($\Delta \phi (\mathrm {t, \bar{t}})$). The horizontally-corrected bin centres according to the MadGraph+PYTHIA -6 prediction are also provided. The results are presented at parton level in the full phase space. The statistical and systematic uncertainties are added in quadrature to yield the total uncertainty. |
png |
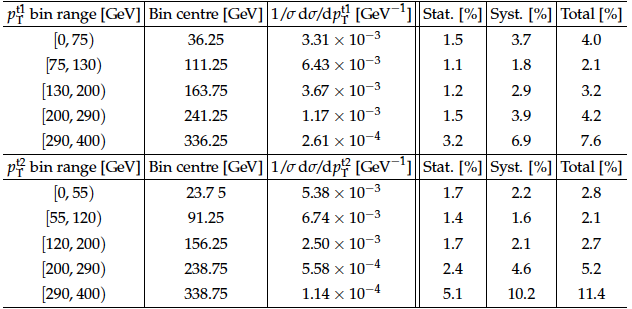
Table A8:
Normalized differential $\mathrm{ t \bar{t} }$ cross section in the $ \ell $+jets channels as a function of the ${p_{\mathrm {T}}} $ of the leading ($ {p_{\mathrm {T}}} ^{\text {t1}}$) and trailing ($ {p_{\mathrm {T}}} ^{\text {t2}}$) top quarks or antiquarks. The horizontally-corrected bin centres according to the MadGraph+PYTHIA -6 prediction are also provided. The results are presented at parton level in the full phase space. The statistical and systematic uncertainties are added in quadrature to yield the total uncertainty. |
png |
Table A9:
Normalized differential $\mathrm{ t \bar{t} }$ cross section in the $ \ell $+jets channels as a function of the $ p_{\mathrm{T}} $ of the leading ($ p_{\mathrm{T}} ^{\text {t1}}$) and trailing ($ p_{\mathrm{T}} ^{\text {t2}}$) top quarks or antiquarks. The horizontally-corrected bin centres according to the MadGraph + PYTHIA-6 prediction are also provided. The results are presented at parton level in the full phase space. The statistical and systematic uncertainties are added in quadrature to yield the total uncertainty. |
png |
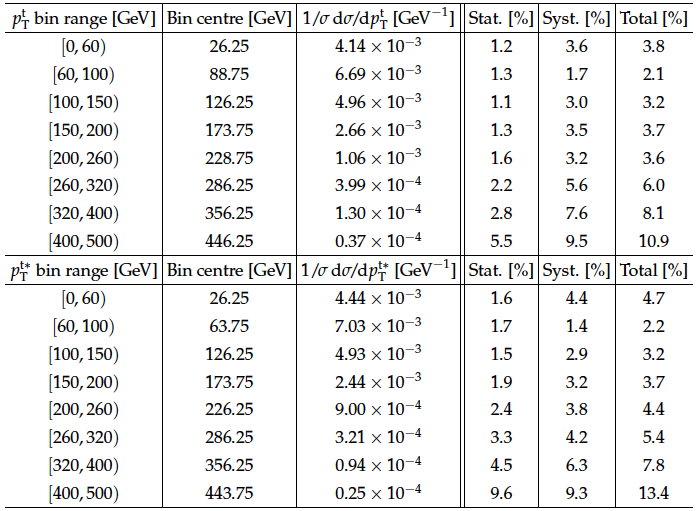
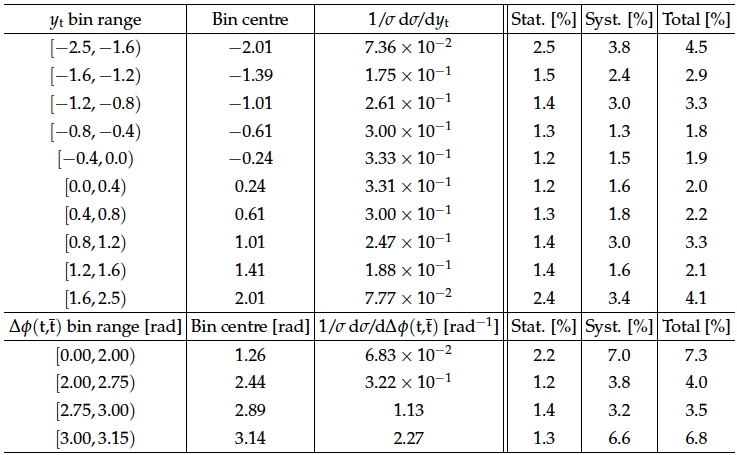
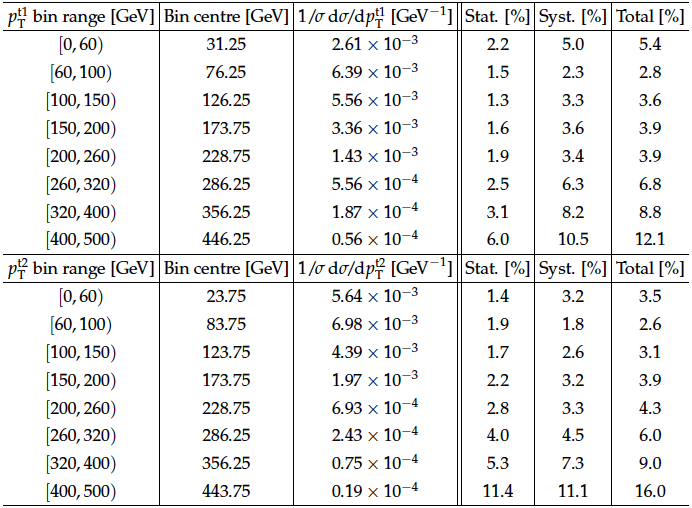
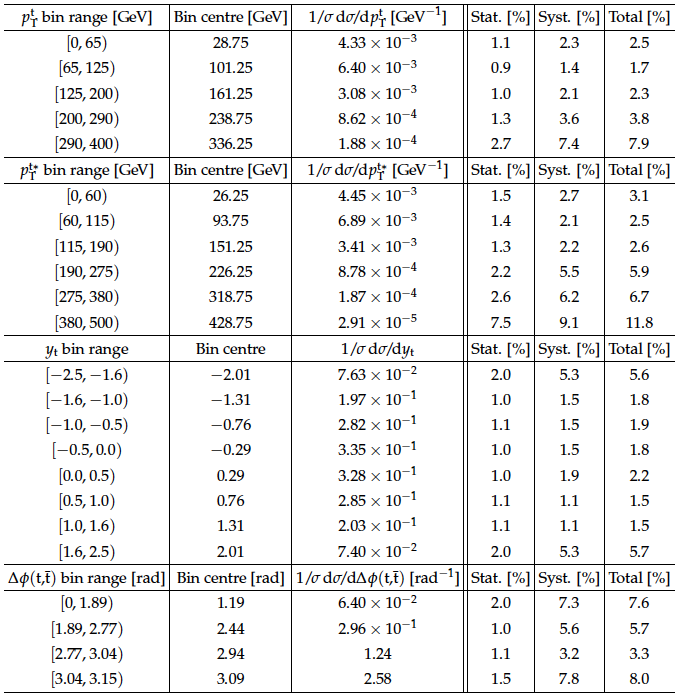
Table A10:
Normalized differential $\mathrm{ t \bar{t} }$ cross section in the dilepton channels as a function of top quark or antiquark observables: the transverse momentum ($ {p_{\mathrm {T}}} ^{\mathrm{ t } }$), the transverse momentum in the $\mathrm{ t \bar{t} }$ rest frame ($ {p_{\mathrm {T}}} ^{\mathrm{ t } \ast }$), and the rapidity ($y_{\mathrm{ t } }$) of the top quarks or antiquarks, and the difference in the azimuthal angle between the top quark and antiquark ($\Delta \phi (\mathrm{ t, \bar{t} })$). The horizontally-corrected bin centres according to the MadGraph+PYTHIA -6 prediction are also provided. The results are presented at parton level in the full phase space. The statistical and systematic uncertainties are added in quadrature to yield the total uncertainty. |
png |
Table A11:
Normalized differential $\mathrm{ t \bar{t} }$ cross section in the dilepton channels as a function of the ${p_{\mathrm {T}}} $ of the leading ($ {p_{\mathrm {T}}} ^{\text {t1}}$) and trailing ($ {p_{\mathrm {T}}} ^{\text {t2}}$) top quarks or antiquarks. The results are presented at parton level in the full phase space. The statistical and systematic uncertainties are added in quadrature to yield the total uncertainty. |
png |
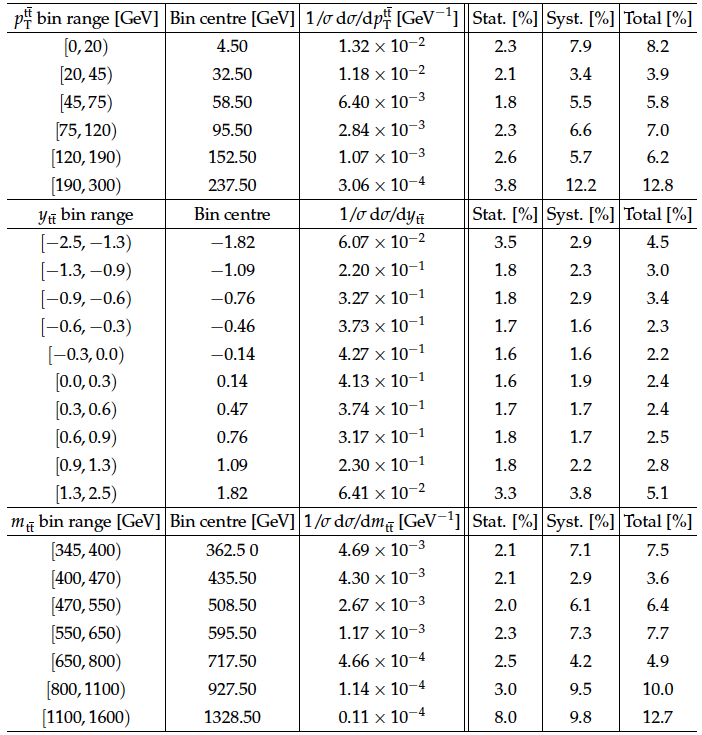
Table A12:
Normalized differential $\mathrm{ t \bar{t} }$ cross section in the dilepton channels as a function of top quark pair observables: the transverse momentum ($ p_{\mathrm{T}} ^{\mathrm{ t \bar{t} } }$), the rapidity ($y_{\mathrm{ t \bar{t} } }$) and the invariant mass ($m_{\mathrm{ t \bar{t} } }$) of the $\mathrm{ t \bar{t} }$ system. The results are presented at parton level in the full phase space. The statistical and systematic uncertainties are added in quadrature to yield the total uncertainty. |
| Summary |
| First measurements are presented of normalized differential $ \mathrm{ t \bar{t} } $ production cross sections in pp collisions at $ \sqrt{s} = $ 8 TeV. The measurements are performed with the CMS detector in the $\ell$+jets ($\ell =$ e or $ \mu $) and dilepton (ee, $ \mu \mu$, and e$ \mu $) $ \mathrm{ t \bar{t} } $ decay channels. The normalized $ \mathrm{ t \bar{t} } $ cross section is measured as a function of the transverse momentum, rapidity, and invariant mass of the final-state leptons and b jets in the fiducial phase space, and the top quarks and $ \mathrm{ t \bar{t} } $ system in the full phase space. The measurements in the different decay channels are in agreement with each other. In general, the data are in agreement with standard model predictions up to approximate NNLO precision. The POWHEG+HERWIG6 prediction provides a good description of data for all measured distributions. However, the $ p_{ \mathrm{T} } $ spectrum in data for leptons, jets, and top quarks is softer than expected, particularly for MADGRAPH+PYTHIA6, POWHEG+PYTHIA6, and MCatNLO+HERWIG6. The calculation at approximate NNLO precision also provides a good description of the top quark $ p_{ \mathrm{T} }$ spectrum. The $m_{ \mathrm{ t \bar{t} } }$ distribution in data tends to be lower than the predictions for large $m_{ \mathrm{ t \bar{t} } }$ values. The $ p_{ \mathrm{T} }^{ \mathrm{ t \bar{t} } }$ spectrum is well described by all the considered predictions, except for the NLO+NNLL calculation, which fails to describe the data for all $ p_{ \mathrm{T} }^{ \mathrm{ t \bar{t} } } $ values. The results show the same behaviour as the corresponding CMS measurements at $ \sqrt{s} = $ 7 TeV. |
|
|
Compact Muon Solenoid LHC, CERN |
|

|

|

|

|

|