Controlling Visualization from Commands
This section describes just a few of the more commonly used visualization commands. For the complete list of commands and options, see the Control…UICommands section of this user guide.
These commands can by typed on the session command line when in Idle state:
Idle> /vis/drawVolume
or specified in a macro file that is executed from the command line:
Idle> /control/execute vis.mac
or from your application, e.g.:
UImanager->ApplyCommand("/control/execute vis.mac");
Most examples have a vis.mac file, where you may look for inspiration.
For simplicity, this section assumes that the Geant4 executable was compiled incorporating the DAWNFILE and the OpenGL-Xlib drivers. For details on creating an executable for visualization see Adding Visualization to Your Executable.
Warning
This section is not a complete description of all visualisation commands; they are too numerous and continually evolving. Please refer to the command guidance, Control…UICommands or simply type “ls vis” or “help”. Some viewers, notably Qt, offer interactivie guidance under the “Help” menu.
Scene, scene handler, and viewer
In using the visualization commands, it is useful to know the concept of “scene”, “scene handler”, and “viewer”. A “scene” is a set of visualizable raw 3D data. A “scene handler” is a graphics-data modeler, which processes raw data in a scene for later visualization. And a “viewer” generates images based on data processed by a scene handler. Roughly speaking, a set of a scene handler and a viewer corresponds to a visualization driver.
The steps of performing Geant4 visualization are explained below, though some of these steps may be done for you so that in practice you may use as few as just two commands (such as /vis/open OGLIX plus /vis/drawVolume). The seven steps of visualization are:
Step |
Command |
Alternative command |
|
1 |
Create a scene handler and a viewer |
/vis/sceneHandler/create /vis/viewer/create |
/vis/open |
2 |
Create an empty scene |
/vis/scene/create |
/vis/drawVolume |
3 |
Add raw 3D data to the created scene |
/vis/scene/add/volume |
|
4 |
Attach the current scene to the current scene handler |
/vis/sceneHandler/attach |
|
5 |
Set camera parameters, drawing style (wireframe/surface), etc |
E.g., /vis/viewer/set/viewpoint |
|
6 |
Make the viewer execute visualization |
/vis/viewer/refresh |
|
7 |
Declare the end of visualization for flushing |
/vis/viewer/flush |
For details about the commands, see below.
These seven steps can be controlled explicitly to create multiple scenes and multiple viewers, each with its own set of parameters, with easy switching from one scene to another. But for the most common case of just having one scene and one viewer, many steps are handled implicitly for you.
Create a scene handler and a viewer: /vis/open command
Command “/vis/open” creates a scene handler and a viewer, which
corresponds to Step 1.
Command: /vis/open <driver_tag_name>
Argument
A name of (a mode of) an available visualization driver.
Action
Create a visualization driver, i.e. a set of a scene handler and a viewer.
Example: Create an OpenGL driver (it chooses the best available for a given type of session):
/vis/open OGL
To see a list of driver_tag_names:
/vis/list
(produces a lot of information) or:
/vis/open xx
which produces:
parameter value (xx) is not listed in the candidate List.
Candidates are: ATree DAWNFILE HepRepFile HepRepXML OGL OGLI OGLIQt OGLS OGLSQt RayTracer VRML1FILE VRML2FILE gMocrenFile
For additional options, see the Control…UICommands section of this user guide.
Create an empty scene: /vis/scene/create command
Command “/vis/scene/create” creates an empty scene, which
corresponds to Step 2.
Command: /vis/scene/create [scene_name]
Argument
A name for this scene. Created for you if you don’t specify one.
Visualization of a physical volume: /vis/drawVolume command
/vis/drawVolume is a “compound” command that creates a new scene (/vis/scene/create), adds a volume (/vis/scene/add/volume) and attaches it (/vis/sceneHandler/attach) to the current viewer (/control/verbose 2 to see all the invoked commands). It takes care of steps 2, 3, 4 and 6. Command /vis/viewer/flush may be required in order to do the final Step 7.
Commands:
/vis/drawVolume [physical-volume-name]
Argument
If physical-volume-name is “world” (the default), the top of the main geometry tree (material world) is added. If “worlds”, the tops of all worlds - material world and parallel worlds, if any - are added. Otherwise a search of all worlds is made.
In the last case the names of all volumes in all worlds are matched against physical-volume-name. If this is of the form “/regexp/”, where regexp is a regular expression (see C++ regex), the match uses the usual rules of regular expression matching. Otherwise an exact match is required.
For example, “/Shap/” matches “Shape1” and “Shape2”.
Action
Creates a scene consisting of the given physical volume(s) and asks the current viewer to draw it. The scene becomes current. Command “
/vis/viewer/flush” should follow this command in order to declare end of visualization.Example: Visualization of the whole world with coordinate axes
/vis/drawVolume
/vis/scene/add/axes 0 0 0 500 mm
/vis/viewer/flush
Visualization of a logical volume: /vis/drawLogicalVolume command
/vis/drawLogicalVolume is a “compound” command that creates a new scene (/vis/scene/create), adds a logical volume (/vis/scene/add/logicalVolume) and attaches it (/vis/sceneHandler/attach) to the current viewer (/control/verbose 2 to see all the invoked commands). It shows all that can be visualised about a logical volume—Booleans, voxels, readout geometries and overlaps—and adds axes in the local coordinate system. All options are on by default.
This command is synonymous with /vis/specify.
Command: vis/drawLogicalVolume <logical-volume-name> [<depth-of-descent>] [<booleans-flag>] [<voxels-flag>] [<readout-flag>] [<axes-flag>] [<check-overlap-flag>]
Argument
A logical-volume name.
Action
Creates a scene consisting of the given logical volume and asks the current viewer to draw it. The scene becomes current.
Example (visualization of a selected logical volume with coordinate axes)
/vis/drawLogicalVolume Absorber
/vis/scene/add/text 0 0 0 mm 40 -100 -200 LogVol:Absorber
/vis/viewer/flush
For more information, use the help facility or refer to
Control…UICommands.
Visualization of trajectories: /vis/scene/add/trajectories command
Command “/vis/scene/add/trajectories [smooth] [rich]” adds
trajectories to the current scene. The optional parameters “smooth”
and/or “rich” (you may specify either, neither or both) invoke, if
“smooth” is specified, the storing and displaying of extra points on
curved trajectories and, if “rich” is specified, the storing, for
possible subsequent selection and display, of additional information,
such as volume names, creator process, energy deposited, global time. Be
aware, of course, that this imposes computational and memory overheads.
Note that this automatically issues the appropriate
“/tracking/storeTrajectory” command so that trajectories are stored
(by default they are not). The visualization is performed with the
command “/run/beamOn” unless you have non-default values for
/vis/scene/endOfEventAction or /vis/scene/endOfRunAction (described
below).
Command: /vis/scene/add/trajectories [smooth] [rich]
Action
The command adds trajectories to the current scene. Trajectories are drawn at end of event when the scene in which they are added is current.
Example: Visualization of trajectories
/vis/scene/add/trajectories
/run/beamOn 10
Additional note 1
See the section Controlling from Commands for details on how trajectories are color-coded.
Additional note 2
Events may be kept and reviewed at end of run with:
/vis/reviewKeptEvents
Keep all events with:
/vis/scene/endOfEventAction accumulate [maxNumber]
or keep some chosen subset by some selection in your user code, for example your user event action:
if ( some criterion ) {
  G4EventManager::GetEventManager()->KeepTheCurrentEvent();
}
or:
if ( some criterion ) {
  UImanager->ApplyCommand("/event/keepCurrentEvent");
}
as described in Listing 83.
To draw only those events kept as above:
/vis/drawOnlyToBeKeptEvents
To suppress drawing during a run:
/vis/disable
/run/beamOn 10000
then at end of run:
/vis/enable
/vis/reviewKeptEvents
Additional note 3
Visualising events as they are being generated inevitably slows the simulation. Visualisation can be suspended with
/vis/disableas suggested above. You may also switch off trajectory production with/tracking/storeTrajectory 0. When using OpenGL, the following can help:/vis/ogl/flushAt <[endOfEvent|endOfRun|eachPrimitive|NthPrimitive|NthEvent|never]> <N>
By default, this value is set to
/vis/ogl/flushAt NthEvent 100
For more options, see the Control…UICommands section of this user guide.
Visualization of hits: /vis/scene/add/hits command
Command “/vis/scene/add/hits” adds hits to the current scene,
assuming that you have a hit class and that the hits have visualization
information. The visualization is performed with the command
“/run/beamOn” unless you have non-default values for
/vis/scene/endOfEventAction or /vis/scene/endOfRunAction (described
above).
Visualization of fields: /vis/scene/add/magneticField command
/vis/scene/add/magneticField and /vis/scene/add/electricField will
draw any fields defined in the scene as an array of arrows whose direction, length and colour are related to the field strength and direction.
Sometimes this can result in a overwhelming number of arrows. To limit the extent of the arrows preface one or more of the above commands with:
/vis/set/extentForField
or:
/vis/set/volumeForField
or equivalent commands in /vis/touchable/.
This can be repeated to get the desired effect, e.g.:
/vis/set/extentForField -20 20 -55 0 0 50 cm
/vis/scene/add/magneticField
/vis/set/volumeForField detector1
/vis/scene/add/magneticField
/vis/set/volumeForField detector2 5
/vis/scene/add/electricField
To remove fields from the scene:
/vis/scene/activateModel Field false
Consult the guidance for the /vis/scene/add/...Field commands for further
hints and suggestions.
Visualization of Scored Data
Scored data can be visualized using the commands
“/score/drawProjection” and “/score/drawColumn”. For details,
see examples/extended/runAndEvent/RE03.
Additional attributes for Hits
The HepRep file formats, HepRepFile and HepRepXML, understand various additional attributes such that you can view these attributes, label trajectories by these attributes or make visibility cuts based on these attributes. Examples of adding HepRep attributes to hit classes can be found in examples /extended/analysis/A01 and /extended/runAndEvent/RE01.
For example, in example RE01’s class RE01CalorimeterHit.cc, available attributes will be:
Hit Type
Track ID
Z Cell ID
Phi Cell ID
Energy Deposited
Energy Deposited by Track
Position
Logical Volume
You can add additional attributes of your choosing by modifying the relevant part of the hit class (look for the methods GetAttDefs and CreateAttValues).
Basic camera workings: /vis/viewer/ commands
Commands in the command directory “/vis/viewer/” set camera
parameters and drawing style of the current viewer, which corresponds to
Step 5. Note that the camera parameters and the drawing style should be
set separately for each viewer. They can be initialized to the default
values with command “/vis/viewer/reset”. Some visualization systems,
such as the VRML and HepRep browsers also allow camera control from the
standalone graphics application.
Just a few of the camera commands are described here. For more commands, see the Control…UICommands section of this user guide.
The view is defined by a target point (initially at the centre of the extent of all objects in the scene), an up-vector and a viewpoint direction - see Fig. 24. By default, the up-Vector is parallel to the y-axis and the viewpoint direction is parallel to the z-axis, so the the view shows the x-axis to the right and the y-axis upwards - a projection on to the canonical x-y plane - see Fig. 25 figure.
The target point can be changed with a /vis/viewer/set command or
with the /vis/viewer/pan commands. The up-vector and the viewpoint
direction can also be changed with /vis/viewer/set commands. Care
must be taken to avoid having the two vectors parallel, for in that case
the view is undefined.
The commands:
/vis/viewer/centreOn <volume-name> [<copy-number>]
/vis/viewer/centreAndZoomInOn <volume-name> [<copy-number>]
also change the target point.
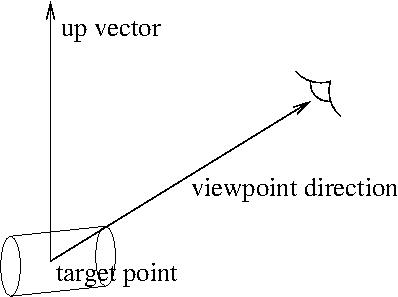
Fig. 24 Up-vector and viewpoint direction
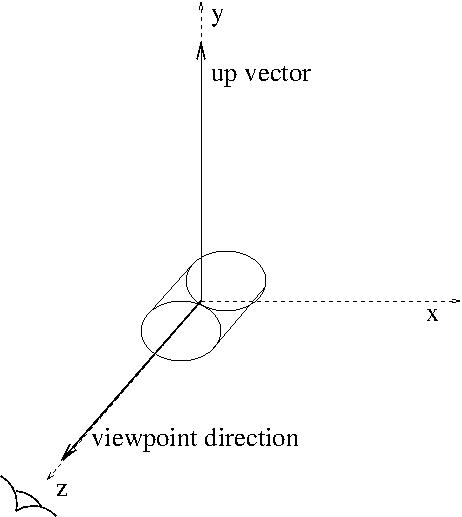
Fig. 25 The default view
Command: /vis/viewer/set/viewpointThetaPhi [theta] [phi] [deg|rad]
Arguments
Arguments “theta” and “phi” are polar and azimuthal camera angles, respectively. The default unit is “degree”.
Action
Set a view point in direction of (theta, phi).
Example: Set the viewpoint in direction of (70 deg, 20 deg) /
/vis/viewer/set/viewpointThetaPhi 70 20
Additional notes
Camera parameters should be set for each viewer. They are initialized with command “
/vis/viewer/reset”. Alternatively, they can be copied from another viewer with the command “/vis/viewer/copyViewFrom viewer-0”, for example.
Command: /vis/viewer/zoom [scale_factor]
Argument
The scale factor. The command multiplies magnification of the view by this factor.
Action
Zoom up/down of view.
Example: Zoom up by factor 1.5
/vis/viewer/zoom 1.5
Additional notes
A similar pair of commands, scale and scaleTo allow non-uniform scaling (i.e., zoom differently along different axes). For details of this and lots of other commands, see the Control…UICommands section of this user guide.
Some viewers have limits to how large the zoom factor can be. This problem can be circumnavigated to some degree by using
zoomandscaletogether. If/vis/viewer/zoomTo 1e10
does not work, please try
/vis/viewer/scaleTo 1e5 1e5 1e5
/vis/viewer/zoomTo 1e5
Of course, with such high zoom factors, you might want to know whither you are zooming. Use “
/vis/viewer/set/targetPoint”Camera parameters should be set for each viewer. They are initialized with command “
/vis/viewer/reset”. Alternatively, they can be copied from another viewer with the command “/vis/viewer/copyViewFrom viewer-0”, for example.
Command: /vis/viewer/set/style [style_name]
Arguments
Candidate values of the argument are “wireframe” and “surface”. (“w” and “s” also work.)
Action
Set a drawing style to wireframe or surface.
Example: Set the drawing style to “surface”
/vis/viewer/set/style surface
Additional notes
The style of some geometry components may have been forced one way or the other through calls in compiled code. The set/style command will NOT override such force styles.
Drawing style should be set for each viewer. The drawing style is initialized with command “
/vis/viewer/reset”. Alternatively, it can be copied from another viewer with the command “/vis/viewer/set/all viewer-0”, for example.
Declare the end of visualization for flushing: /vis/viewer/flush command
Command: /vis/viewer/flush
Action
Declare the end of visualization for flushing.
Additional notes
Command “
/vis/viewer/flush” should follow “/vis/drawVolume”, “/vis/specify”, etc in order to complete visualization. It corresponds to Step 7.The flush is done automatically after every /run/beamOn command unless you have non-default values for /vis/scene/endOfEventAction or /vis/scene/endOfRunAction (described above).
End of Event Action and End of Run Action: /vis/scene/endOfEventAction and /vis/scene/endOfRunAction commands
By default, a separate picture is created for each event. You can change this behaviour to accumulate multiple events, or even multiple runs, in a single picture.
Command: /vis/scene/endOfEventAction [refresh|accumulate]
Action
Control how often the picture should be cleared.
refreshmeans each event will be written to a new picture.accumulatemeans events will be accumulated into a single picture. Picture will be flushed at end of run, unless you have also set/vis/scene/endOfRunAction accumulateAdditional note
You may instead choose to use update commands from your BeginOfRunAction or EndOfEventAction, as in early examples, but now the vis manager is able to do most of what most users require through the above commands.
Command: /vis/scene/endOfRunAction [refresh|accumulate]
Action
Control how often the picture should be cleared.
refreshmeans each run will be written to a new picture.accumulatemeans runs will be accumulated into a single picture. To start a new picture, you must explicitly issue/vis/viewer/refresh,/vis/viewer/updateor/vis/viewer/flush
HepRep Attributes for Trajectories
The HepRep file formats, HepRepFile and HepRepXML, attach various
attributes to trajectories such that you can view these attributes,
label trajectories by these attributes or make visibility cuts based on
these attributes. If you use the default Geant4 trajectory class from
/tracking/src/G4Trajectory.cc (this is what you get with the plain
/vis/scene/add/trajectories command), available attributes will be:
Track ID
Parent ID
Particle Name
Charge
PDG Encoding
Momentum 3-Vector
Momentum magnitude
Number of points
Using /vis/scene/add/trajectories rich will get you additional
attributes. You may also add additional attributes of your choosing by
modifying the relevant part of G4Trajectory (look for the methods
GetAttDefs and CreateAttValues). If you are using your own trajectory
class, you may want to consider copying these methods from G4Trajectory.
How to save a view.
/vis/viewer/save
This will save to a file that can be read in again with
/control/execute
If you save several views you may “fly through” them with
/vis/viewer/interpolate
See Making a Movie.
(Use the Geant4 “help” command to see details.)
How to save a view to an image file
Most of the visualization drivers offer ways to save visualized views to PostScript (PS) or Encapsulated PostScript (EPS). Some, in addition, offer Portable Document Format (PDF). OpenGL offers a big range of formats - see below.
DAWNFILE
The DAWNFILE driver, which co-works with Fukui Renderer DAWN, generates “vectorized” PostScript data with “analytical hidden-line/surface removal”, and so it is well suited for technical high-quality outputs for presentation, documentation, and debugging geometry. In the default setting of the DAWNFILE drivers, EPS files named “
g4_00.eps, g4_01.eps, g4_02.eps,…” are automatically generated in the current directory each time when visualization is performed, and then a PostScript viewer “gv”is automatically invoked to visualize the generated EPS files.For large data sets, it may take time to generate the vectorized PostScript data. In such a case, visualize the 3D scene with a faster visualization driver beforehand for previewing, and then use the DAWNFILE drivers. For example, the following visualizes the whole detector with the OpenGL-Xlib driver (immediate mode) first, and then with the DAWNFILE driver to generate an EPS file
g4_XX.epsto save the visualized view:# Invoke the OpenGL visualization driver in its immediate mode /vis/open OGLIX # Camera setting /vis/viewer/set/viewpointThetaPhi 20 20 # Camera setting /vis/drawVolume /vis/viewer/flush # Invoke the DAWNFILE visualization driver /vis/open DAWNFILE # Camera setting /vis/viewer/set/viewpointThetaPhi 20 20 # Camera setting /vis/drawVolume /vis/viewer/flush
This is a good example to show that the visualization drivers are complementary to each other.
OpenInventor
In the OpenInventor drivers, you can simply click the “Print” button on their GUI to generate a PostScript file as a hard copy of a visualized view.
OpenGL
The OpenGL drivers can also generate image files, either from a pull-down menu (Motif and Qt drivers) or with
/vis/ogl/export. Available formats are: eps ps pdf svg bmp cur dds icns ico jp2 jpeg jpg pbm pgm png ppm tif tiff wbmp webp xbm xpm. The default is pdf. It can generate either vector or bitmap PostScript data with/vis/ogl/set/printMode(“vectored” or “pixmap”). You can change the filename by/vis/ogl/set/printFilenameAnd the print size by/vis/ogl/set/printSizeIn generating vectorized PostScript data, hidden-surface removal is performed based on the painter’s algorithm after dividing facets of shapes into small sub-triangles.Note that a fundamental limitation of the gl2ps library used for this printing causes the
/vis/viewer/set/hiddenMarkercommand to be ignored. Trajectories will always be fully drawn in the printEPS output even when the hiddenMarker hidden line removal option has been set to hide these trajectories in the corresponding OpenGL view.The
/vis/ogl/set/printSizecommand can be used to print EPS files even larger than the current screen resolution. This can allow creation of very large images, suitable for creation of posters, etc. The only size limitation is the graphics card’s viewport dimension: GL_MAX_VIEWPORT_DIMS# Invoke the OpenGL visualization driver in its stored mode /vis/open OGLSX # Camera setting /vis/viewer/set/viewpointThetaPhi 20 20 # Camera setting /vis/drawVolume /vis/viewer/flush # set print mode to vectored #/vis/ogl/set/printMode vectored # set print size larger than screen /vis/ogl/set/printSize 2000 2000 # print /vis/ogl/export
HepRep
The HepRApp HepRep Browser and WIRED4 JAS Plug-In can generate a wide variety of bitmap and vector output formats including PostScript and PDF.
Culling
“Culling” means to skip visualizing parts of a 3D scene. Culling is useful for avoiding complexity of visualized views, keeping transparent features of the 3D scene, and for quick visualization.
Geant4 Visualization supports the following 3 kinds of culling:
Culling of invisible physical volumes
Culling of low density physical volumes.
Culling of covered physical volumes by others
In order that one or all types of the above culling are on, i.e., activated, the global culling flag should also be on.
Table 23 summarizes the default culling policies.
Culling Type |
Default Value |
global |
ON |
invisible |
ON |
low density |
OFF |
covered daughter |
OFF |
The default threshold density of the low-density culling is 0.01 g/cm3.
The default culling policies can be modified with the following
visualization commands. (Below the argument flag takes a value of
true or false.)
# global
/vis/viewer/set/culling  global  flag

# invisible
/vis/viewer/set/culling  invisible  flag

# low density
#   "value" is a proper value of a threshold density
#   "unit" is either g/cm3, mg/cm3 or kg/m3
/vis/viewer/set/culling  density  flag  value  unit

# covered daughter
/vis/viewer/set/culling  coveredDaughters  flag     density
The HepRepFile graphic system will, by default, include culled objects in the file so that they can still be made visible later from controls in the HepRep browser. If this behavior would cause files to be too large, you can instead choose to have culled objects be omitted from the HepRep file. See details in the HepRepFile Driver section of this user guide.
Cut view
Sectioning
“Sectioning” means to make a thin slice of a 3D scene around a given plane. At present, this function is supported by the OpenGL drivers. The sectioning is realized by setting a sectioning plane before performing visualization. The sectioning plane can be set by the command,
/vis/viewer/set/sectionPlane on x y z units nx ny nz
where the vector (x,y,z) defines a point on the sectioning plane, and the vector (nx,ny,nz) defines the normal vector of the sectioning plane. For example, the following sets a sectioning plane to a yz plane at x = 2 cm:
/vis/viewer/set/sectionPlane on 2.0 0.0 0.0 cm 1.0 0.0 0.0
Cutting away
“Cutting away” means to remove a half space, defined with a plane, from a 3D scene.
Cutting away is supported by the DAWNFILE driver “off-line”. Do the following:
Perform visualization with the DAWNFILE driver to generate a file
g4.prim, describing the whole 3D scene.Make the application “DAWNCUT” read the generated file to make a view of cutting away.
Alternatively, add up to three cutaway planes:
/vis/viewer/addCutawayPlane 0 0 0 m 1 0 0
/vis/viewer/addCutawayPlane 0 0 0 m 0 1 0
...
and, for more that one plane, you can change the mode to
“add” or, equivalently, “union” (default) or
“multiply” or, equivalently, “intersection”:
/vis/viewer/set/cutawayMode multiply
To de-activate:
/vis/viewer/clearCutawayPlanes
OpenGL supports this feature.
Multithreading commands
Visualising events inevitably slows things down. With multithreading this effect is all the greater. See Visualization of trajectories: /vis/scene/add/trajectories command, Additional Note 3, for some advice. If you wish to continue visualising, multithreading mode offers the following fine tuning.
Since Geant4 version 10.2, in multithreading mode, events generated by worker threads are put in a queue and extracted by a special visualisation thread. If the queue gets full, workers are suspended until the visualisation thread catches up. To mitigate or avoid this try using
/vis/multithreading/maxEventQueueSize <N>
/vis/multithreading/actionOnEventQueueFull <wait|discard>
(See command guidance for details.)