Controlling Visualization from Compiled Code
While a Geant4 simulation is running, visualization can be performed
without user intervention. This is accomplished by calling methods of
the Visualization Manager from methods of the user action classes
(G4UserRunAction and G4UserEventAction, for example). In this
section methods of the class G4VVisManager, which is part of the
graphics_reps category, are described and examples of their use are
given.
G4VVisManager
The Visualization Manager is implemented by classes G4VisManager and
G4VisExecutive. See Adding Visualization to Your Executable. In order that your Geant4 be compilable
either with or without the visualization category, you should not use
these classes directly in your C++ source code, other than in the
main() function. Instead, you should use their abstract base class
G4VVisManager, defined in the intercoms category.
The pointer to the concrete instance of the real Visualization Manager can be obtained as follows:
//----- Getting a pointer to the concrete Visualization Manager instance
G4VVisManager* pVVisManager = G4VVisManager::GetConcreteInstance();
The method G4VVisManager::GetConcreteInstance() returns NULL if
Geant4 is not ready for visualization. Thus your C++ source code should
be protected as follows:
//----- How to protect your C++ source codes in visualization
if (pVVisManager) {
    ....
    pVVisManager ->Draw (...);
    ....
}
Note: It pays to encapsulate your Draw messages in Visualization User Actions.
The vis manager then has control over the drawing
and may call your action as required, for example, to refresh the screen or
write to file.
Visualization of detector components
If you have already constructed detector components with logical volumes to which visualization attributes are properly assigned, you are almost ready for visualizing detector components. Normally you would do this through UI commands - see Controlling Visualization from Commands.
However, if you really wish to program visualisation we recommend you
invoke vis commands using the ApplyCommand() method.
For example, the following is sample C++ source codes to visualize the detector components:
//----- C++ source code: How to visualize detector components (2)
//                       ... using visualization commands in source codes

G4VVisManager* pVVisManager = G4VVisManager::GetConcreteInstance() ;

if(pVVisManager)
{
    ... (camera setting etc) ...
    G4UImanager::GetUIpointer()->ApplyCommand("/vis/drawVolume");
    G4UImanager::GetUIpointer()->ApplyCommand("/vis/viewer/flush");
}

//-----  end of C++ source code
In the above, you should also describe /vis/open command somewhere
in your C++ codes or execute the command from (G)UI at the executing
stage.
Visualization of trajectories
In order to visualize trajectories, you can use the method void
G4Trajectory::DrawTrajectory() defined in the tracking category. In
the implementation of this method, the following drawing method of
G4VVisManager is used:
//----- A drawing method of G4Polyline
virtual void G4VVisManager::Draw (const G4Polyline&, ...) ;
The real implementation of this method is described in the class
G4VisManager.
At the end of one event, a set of trajectories can be stored as a list
of G4Trajectory objects. Therefore you can visualize trajectories,
for example, at the end of each event, by implementing the method
MyEventAction::EndOfEventAction() as follows:
void ExN03EventAction::EndOfEventAction(const G4Event* evt)
{
  .....
  // extract the trajectories and draw them
  if (G4VVisManager::GetConcreteInstance())
    {
     G4TrajectoryContainer* trajectoryContainer = evt->GetTrajectoryContainer();
     G4int n_trajectories = 0;
     if (trajectoryContainer) n_trajectories = trajectoryContainer->entries();

     for (G4int i=0; i < n_trajectories; i++)
        { G4Trajectory* trj=(G4Trajectory*)((*(evt->GetTrajectoryContainer()))[i]);
          if (drawFlag == "all") trj->DrawTrajectory(50);
          else if ((drawFlag == "charged")&&(trj->GetCharge() != 0.))
                                  trj->DrawTrajectory(50);
          else if ((drawFlag == "neutral")&&(trj->GetCharge() == 0.))
                                  trj->DrawTrajectory(50);
        }
  }
}
Enhanced trajectory drawing
It is possible to use the enhanced trajectory drawing functionality in compiled code as well as from commands. Multiple trajectory models can be instantiated, configured and registered with G4VisManager. For details, see the section on Controlling from Compiled Code.
HepRep Attributes for Trajectories
The HepRep file formats, HepRepFile and HepRepXML, attach various attributes to trajectories such that you can view these attributes, label trajectories by these attributes or make visibility cuts based on these attributes. If you use the default Geant4 trajectory class, from /tracking/src/G4Trajectory.cc, available attributes will be:
Track ID
Parent ID
Particle Name
Charge
PDG Encoding
Momentum 3-Vector
Momentum magnitude
Number of points
You can add additional attributes of your choosing by modifying the relevant part of G4Trajectory (look for the methods GetAttDefs and CreateAttValues). If you are using your own trajectory class, you may want to consider copying these methods from G4Trajectory.
Visualization of hits
Hits are visualized with classes G4Square or G4Circle, or other
user-defined classes inheriting the abstract base class G4VMarker
(Polylines, Markers and Text). Drawing methods for hits are not
supported by default. Instead, ways of their implementation are guided
by virtual methods, G4VHit::Draw() and
G4VHitsCollection::DrawAllHits(), of the abstract base classes
G4VHit and G4VHitsCollection. These methods are defined as empty
functions in the digits+hits category. You can overload these
methods, using the following drawing methods of class G4VVisManager,
in order to visualize hits:
//----- Drawing methods of G4Square and G4Circle
virtual void G4VVisManager::Draw (const G4Circle&, ...) ;
virtual void G4VVisManager::Draw (const G4Square&, ...) ;
The real implementations of these Draw() methods are described in
class G4VisManager.
The overloaded implementation of G4VHits::Draw() will be held by,
for example, class MyTrackerHits inheriting G4VHit as follows:
//----- An example of giving concrete implementation of
//       G4VHit::Draw(), using  class MyTrackerHit : public G4VHit {...}
//
void MyTrackerHit::Draw()
{
   G4VVisManager* pVVisManager = G4VVisManager::GetConcreteInstance();
   if(pVVisManager)
   {
     // define a circle in a 3D space
     G4Circle circle(pos);
     circle.SetScreenSize(0.3);
     circle.SetFillStyle(G4Circle::filled);

     // make the circle red
     G4Colour colour(1.,0.,0.);
     G4VisAttributes attribs(colour);
     circle.SetVisAttributes(attribs);

     // make a 3D data for visualization
     pVVisManager->Draw(circle);
   }
 }
The overloaded implementation of G4VHitsCollection::DrawAllHits()
will be held by, for example, class MyTrackerHitsCollection inheriting
class G4VHitsCollection as follows:
//----- An example of giving concrete implementation of
//       G4VHitsCollection::Draw(),
//       using  class MyTrackerHit : public G4VHitsCollection{...}
//
void MyTrackerHitsCollection::DrawAllHits()
{
  G4int n_hit = theCollection.entries();
  for(G4int i=0;i < n_hit;i++)
  {
    theCollection[i].Draw();
  }
}
Thus, you can visualize hits as well as trajectories, for example, at
the end of each event by implementing the method
MyEventAction::EndOfEventAction() as follows:
void MyEventAction::EndOfEventAction()
{
  const G4Event* evt = fpEventManager->GetConstCurrentEvent();

  G4SDManager * SDman = G4SDManager::GetSDMpointer();
  G4String colNam;
  G4int trackerCollID = SDman->GetCollectionID(colNam="TrackerCollection");
  G4int calorimeterCollID = SDman->GetCollectionID(colNam="CalCollection");

  G4TrajectoryContainer * trajectoryContainer = evt->GetTrajectoryContainer();
  G4int n_trajectories = 0;
  if(trajectoryContainer)
  { n_trajectories = trajectoryContainer->entries(); }

  G4HCofThisEvent * HCE = evt->GetHCofThisEvent();
  G4int n_hitCollection = 0;
  if(HCE)
  { n_hitCollection = HCE->GetCapacity(); }

  G4VVisManager* pVVisManager = G4VVisManager::GetConcreteInstance();

  if(pVVisManager) {

    // Declare begininng of visualization
    G4UImanager::GetUIpointer()->ApplyCommand("/vis/scene/notifyHandlers");

    // Draw trajectories
    for(G4int i=0; i < n_trajectories; i++) {
        (*(evt->GetTrajectoryContainer()))[i]->DrawTrajectory();
    }

    // Construct 3D data for hits
    MyTrackerHitsCollection* THC
      = (MyTrackerHitsCollection*)(HCE->GetHC(trackerCollID));
    if(THC) THC->DrawAllHits();
    MyCalorimeterHitsCollection* CHC
      = (MyCalorimeterHitsCollection*)(HCE->GetHC(calorimeterCollID));
    if(CHC) CHC->DrawAllHits();

    // Declare end of visualization
    G4UImanager::GetUIpointer()->ApplyCommand("/vis/viewer/update");
  }
}
You can re-visualize a physical volume, where a hit is detected, with a highlight color, in addition to the whole set of detector components. It is done by calling a drawing method of a physical volume directly. The method is:
//----- Drawing methods of a physical volume
virtual void Draw (const G4VPhysicalVolume&, ...) ;
This method is, for example, called in a method MyXXXHit::Draw(),
describing the visualization of hits with markers. The following is an
example for this:
//----- An example of visualizing hits with
void MyCalorimeterHit::Draw()
{
  G4VVisManager* pVVisManager = G4VVisManager::GetConcreteInstance();
  if(pVVisManager)
  {
    G4Transform3D trans(rot,pos);
    G4VisAttributes attribs;
    G4LogicalVolume* logVol = pPhys->GetLogicalVolume();
    const G4VisAttributes* pVA = logVol->GetVisAttributes();
    if(pVA) attribs = *pVA;
    G4Colour colour(1.,0.,0.);
    attribs.SetColour(colour);
    attribs.SetForceSolid(true);

    //----- Re-visualization of a selected physical volume with red color
    pVVisManager->Draw(*pPhys,attribs,trans);
  }
}
HepRep Attributes for Hits
The HepRep file formats, HepRepFile and HepRepXML, attach various attributes to hits such that you can view these attributes, label trajectories by these attributes or make visibility cuts based on these attributes. Examples of adding HepRep attributes to hit classes can be found in examples /extended/analysis/A01 and /extended/runAndEvent/RE01.
For example, in example RE01’s class RE01CalorimeterHit.cc, available attributes will be:
Hit Type
Track ID
Z Cell ID
Phi Cell ID
Energy Deposited
Energy Deposited by Track
Position
Logical Volume
You can add additional attributes of your choosing by modifying the relevant part of the hit class (look for the methods GetAttDefs and CreateAttValues).
Visualization of text
In Geant4 Visualization, a text, i.e., a character string, is described
by class G4Text inheriting G4VMarker as well as G4Square and
G4Circle. Therefore, the way to visualize text is the same as for
hits. The corresponding drawing method of G4VVisManager is:
//----- Drawing methods of G4Text
virtual void G4VVisManager::Draw (const G4Text&, ...);
The real implementation of this method is described in class
G4VisManager.
Visualization of polylines and tracking steps
Polylines, i.e., sets of successive line segments, are described by
class G4Polyline. For G4Polyline, the following drawing method
of class G4VVisManager is prepared:
//----- A drawing method of G4Polyline
 virtual void G4VVisManager::Draw (const G4Polyline&, ...) ;
The real implementation of this method is described in class
G4VisManager.
Using this method, C++ source codes to visualize G4Polyline are
described as follows:
//----- How to visualize a polyline
 G4VVisManager* pVVisManager = G4VVisManager::GetConcreteInstance();

 if (pVVisManager) {
     G4Polyline polyline ;

     ..... (C++ source codes to set vertex positions, color, etc)

     pVVisManager -> Draw(polyline);
 }
Tracking steps are able to be visualized based on the above
visualization of G4Polyline. You can visualize tracking steps at
each step automatically by writing a proper implementation of class
MySteppingAction inheriting G4UserSteppingAction, and also with
the help of the Run Manager.
First, you must implement a method,
MySteppingAction::UserSteppingAction(). A typical implementation of
this method is as follows:
//-----  An example of visualizing tracking steps
void MySteppingAction::UserSteppingAction()
{
    G4VVisManager* pVVisManager = G4VVisManager::GetConcreteInstance();

    if (pVVisManager) {
      //----- Get the Stepping Manager
      const G4SteppingManager* pSM = GetSteppingManager();

      //----- Define a line segment
      G4Polyline polyline;
      G4double charge = pSM->GetTrack()->GetDefinition()->GetPDGCharge();
      G4Colour colour;
      if      (charge < 0.) colour = G4Colour(1., 0., 0.);
      else if (charge < 0.) colour = G4Colour(0., 0., 1.);
      else                  colour = G4Colour(0., 1., 0.);
      G4VisAttributes attribs(colour);
      polyline.SetVisAttributes(attribs);
      polyline.push_back(pSM->GetStep()->GetPreStepPoint()->GetPosition());
      polyline.push_back(pSM->GetStep()->GetPostStepPoint()->GetPosition());

      //----- Call a drawing method for G4Polyline
      pVVisManager -> Draw(polyline);
    }
}
Next, in order that the above C++ source code works, you have to pass
the information of the MySteppingAction to the Run Manager in the
main() function:
//----- Passing what to do at each step to the Run Manager

int main()
{
   ...
   // Run Manager
   G4RunManager * runManager = new G4RunManager;

   // User initialization classes
   ...
   runManager->SetUserAction(new MySteppingAction);
   ...
}
Thus you can visualize tracking steps with various visualization attributes, e.g., color, at each step, automatically.
As well as tracking steps, you can visualize any kind 3D object made of
line segments, using class G4Polyline and its drawing method,
defined in class G4VVisManager. See, for example, the implementation
of the /vis/scene/add/axes command.
Visualization User Actions
You can implement the Draw method of G4VUserVisAction, e.g., the
class definition could be:
class MyVisAction: public G4VUserVisAction {
  void Draw();
};
and the implementation:
void MyVisAction::Draw() {
  G4VVisManager* pVisManager = G4VVisManager::GetConcreteInstance();
  if (pVisManager) {

    // Simple box...
    pVisManager->Draw(G4Box("box",2*m,2*m,2*m),
                      G4VisAttributes(G4Colour(1,1,0)));

    // Etc...
  }
}
If efficiency is an issue, create the objects in the constructor, delete
them in the destructor and draw them in your Draw method.
Anyway, an instance of your class needs to be registered with the vis manager, e.g.:
 ...
G4VisManager* visManager = new G4VisExecutive;
visManager->RegisterRunDurationUserVisAction
  ("My drawings",
   new MyVisAction,
   G4VisExtent(-10*m,10*m,-10*m,10*m,-10*m,10*m));  // This 3rd argument is optional.
visManager->Initialize ();
 ...
Any number of actions may be registered either as “run duration” (i.e., permanent, or at least as permanent as detector geometry) or “end of event” or “end of run” through the methods RegisterRunDurationUserVisAction, RegisterEndOfEventUserVisAction or RegisterEndOfRunUserVisAction. The vis manager will invoke your Draw method as appropriate to give your drawing a sort of permanence, for example, that can be drawn from several different angles.
Vis action drawing must be activated by adding to a scene, e.g:
/control/verbose 2
/vis/verbose parameters
/vis/open OGL
/vis/scene/create
/vis/scene/add/userAction
/vis/scene/add/axes
/vis/scene/add/scale
/vis/sceneHandler/attach
/vis/viewer/flush
The “extent” can be added on registration or on the command line or
neither (if the extent of the scene is set by other components). Your
Draw method will be called whenever needed to refresh the screen or
rebuild a graphics database, for any chosen viewer. The scene can be
attached to any scene handler and your drawing will be shown.
Standalone Visualization
The above raises the possibility of using Geant4 as a “standalone”
graphics package without invoking the run manager. The following main
program (from examples/extended/visualization/standalone), together
with a user vis action and a macro file–see above–will
allow you to view your drawing interactively on any of the
supported graphics systems:
#include "globals.hh"
#include "G4VisExecutive.hh"
#include "G4VisExtent.hh"
#include "G4UImanager.hh"
#include "G4UIExecutive.hh"
#include "G4SystemOfUnits.hh"

#include "StandaloneVisAction.hh"

int main(int argc,char** argv) {

  G4UIExecutive* ui = new G4UIExecutive(argc, argv);

  G4VisManager* visManager = new G4VisExecutive;
  visManager->RegisterRunDurationUserVisAction
    ("A standalone example - 3 boxes, 2 with boolean subtracted cutout",
     new StandaloneVisAction,
     G4VisExtent(-10*m,10*m,-10*m,10*m,-10*m,10*m));
  visManager->Initialize ();

  G4UImanager::GetUIpointer()->ApplyCommand ("/control/execute standalone.mac");
  ui->SessionStart();

  delete ui;
  delete visManager;
}
Drawing a solid as a cloud of points
SolidCloudVisAction.hh:
#ifndef SOLIDCLOUDVISACTION_HH
#define SOLIDCLOUDVISACTION_HH
#include "G4VUserVisAction.hh"
#include "G4Polymarker.hh"
class G4VSolid;
class SolidCloudVisAction: public G4VUserVisAction {
public:
  SolidCloudVisAction(G4VSolid*,G4int nPoints);
  virtual void Draw();
private:
  G4Polymarker fPolymarker;
};
#endif
SolidCloudVisAction.cc:
#include "SolidCloudVisAction.hh"
#include "G4VVisManager.hh"
#include "G4VSolid.hh"
SolidCloudVisAction::SolidCloudVisAction(G4VSolid* solid, G4int nPoints).
{
  fPolymarker.SetMarkerType(G4Polymarker::dots);
  fPolymarker.SetSize(G4VMarker::screen,1.);
  for (G4int i = 0; i < nPoints; ++i) {
    G4ThreeVector p = solid->GetPointOnSurface();
    G4cout << solid->GetName() << " " << p << G4endl;
    fPolymarker.push_back(p);
  }
}
void SolidCloudVisAction::Draw() {
  G4VVisManager* pVisManager = G4VVisManager::GetConcreteInstance();
  if (pVisManager) pVisManager->Draw(fPolymarker);
}
Then just after you instantiate the vis manager:
G4VSolid* torus = new G4Torus("Torus",2.*cm,5.*cm,6.*cm,0.,CLHEP::twopi);
visManager->RegisterRunDurationUserVisAction
("Torus",
 new SolidCloudVisAction(torus,100000),
 torus->GetExtent());
Then on the command line:
/vis/scene/create
/vis/scene/add/userAction Torus
/vis/sceneHandler/attach
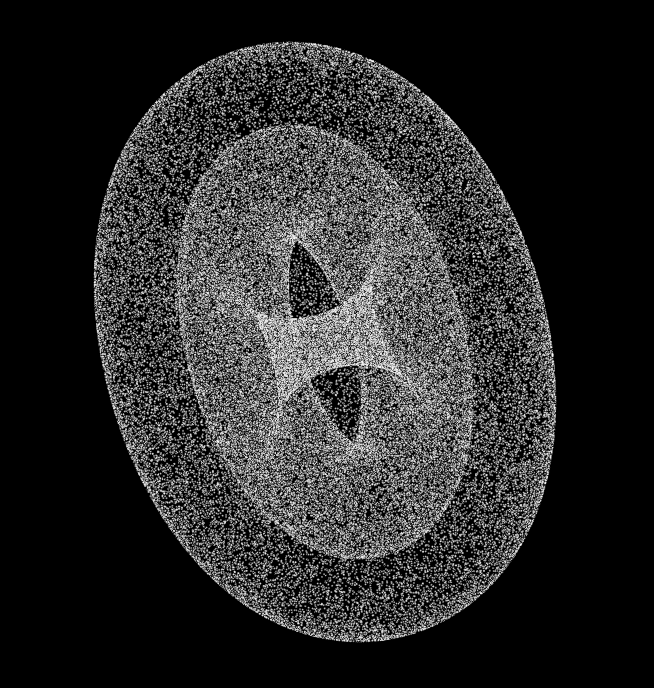
Fig. 26 A torus represented by a cloud of points on its surface.