cern.ch

Update of the LHCb combination of the CKM angle $\gamma$

[to restricted-access page]

Abstract

A combination of tree-level measurements of the CKM angle $\gamma$ at LHCb is performed. The results are obtained from time-integrated measurements of $ B ^+ \rightarrow D K ^+ $ , $ B ^+ \rightarrow D^* K ^+ $ , $ B ^+ \rightarrow D K^{*+}$ , $ B ^0 \rightarrow D K^{*0}$ , $ B ^0 \rightarrow D K ^+ \pi ^- $ and $ B ^+ \rightarrow D K ^+ \pi ^+ \pi ^- $ decays and time-dependent analyses of $ B ^0_ s \rightarrow D_s^\mp K^\pm$ and $ B ^0 \rightarrow D ^\mp \pi ^\pm $ decays. This combination includes new and updated results compared to the previous LHCb combination, giving a best fit value of $\gamma = 74.0 ^\circ$ with confidence intervals, set using a frequentist procedure, of $\gamma \in [68.2,79.0] ^\circ$ at 68.3% confidence level (CL) and $\gamma \in [61.6,83.7] ^\circ$ at 95.5% CL, where all values are modulo $180^\circ$. This gives the result \begin{align*} \gamma = ( 74.0 ^{+5.0}_{-5.8} )^\circ , \end{align*} where the uncertainty includes both statistical and systematic contributions.
Figures and captions

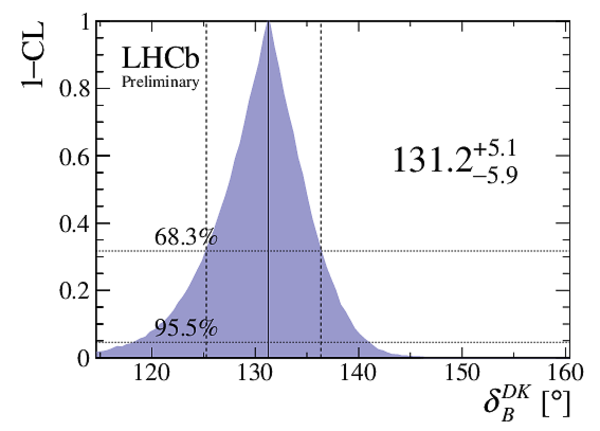
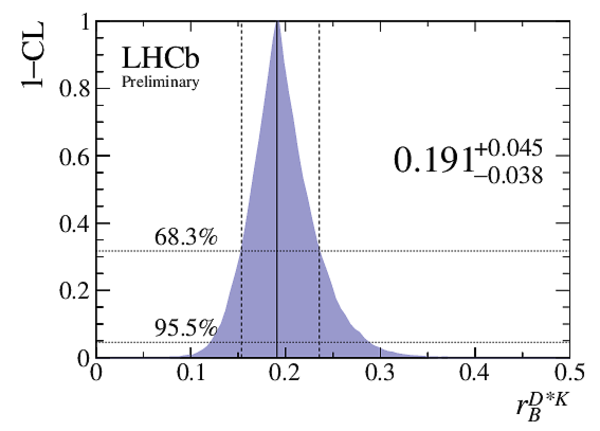
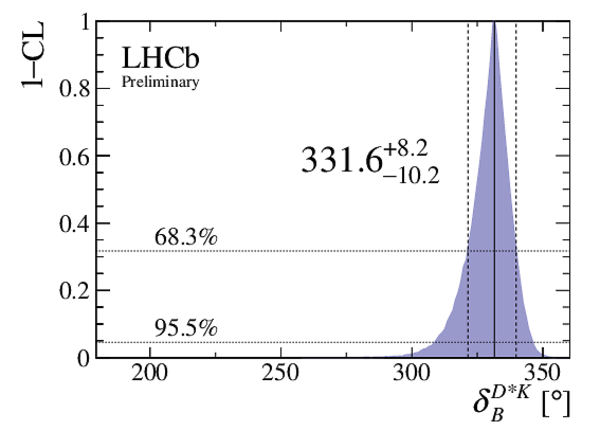
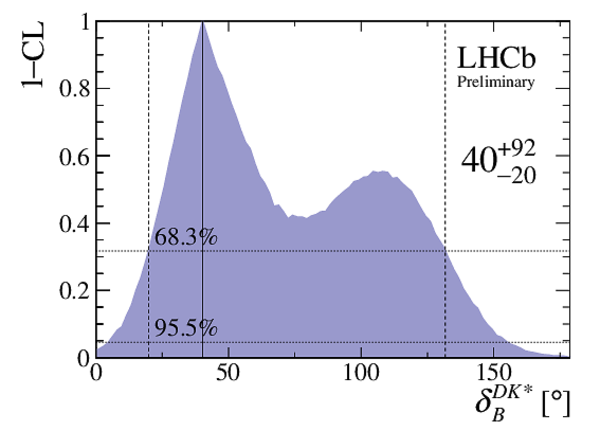
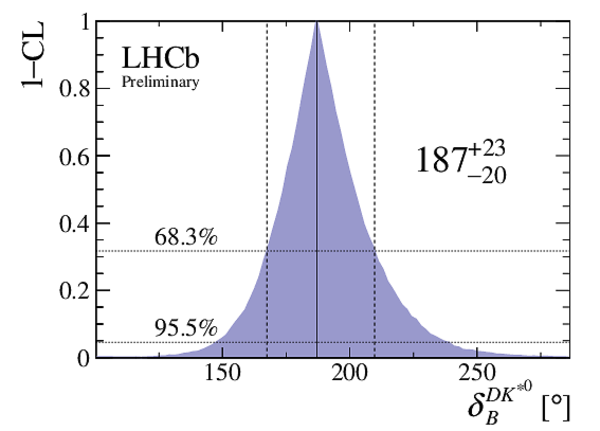
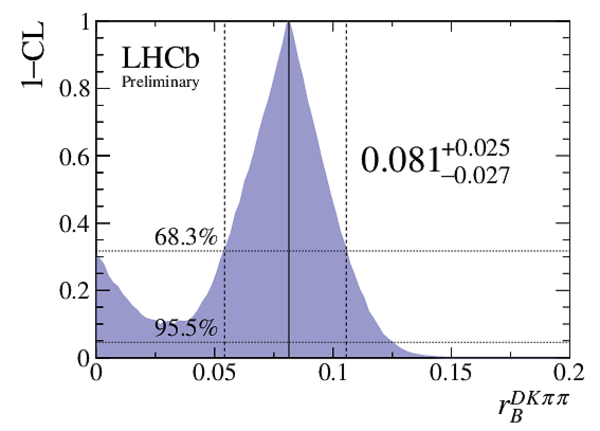
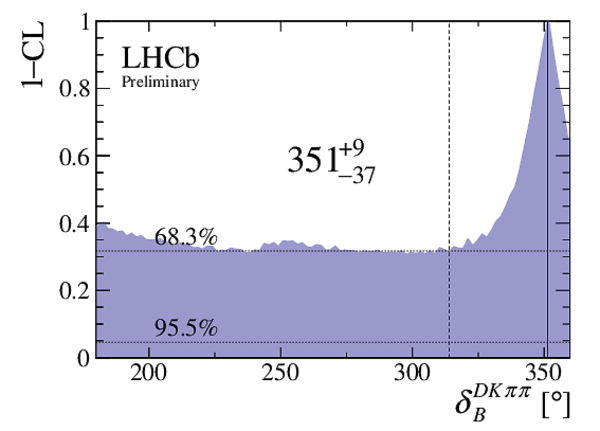
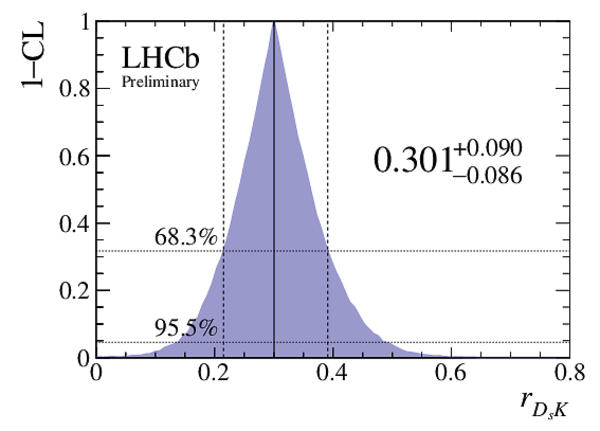
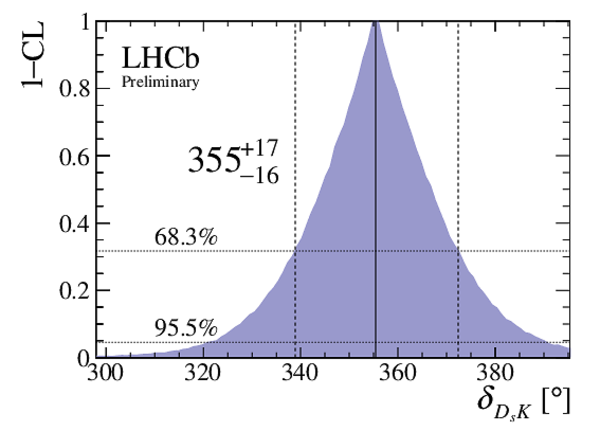
$ 1-{\rm CL}$ curves for the combination, with central values (solid vertical lines) and $1\sigma$ uncertainties (dashed vertical lines) labelled. The $1\sigma$ and $2\sigma$ levels are indicated by the horizontal dotted lines.

Fig1a.pdf [14 KiB]
HiDef png [186 KiB]
Thumbnail [147 KiB]
*.C file
Fig1a.pdf
Fig1b.pdf [14 KiB]
HiDef png [204 KiB]
Thumbnail [167 KiB]
*.C file
Fig1b.pdf
Fig1c.pdf [14 KiB]
HiDef png [196 KiB]
Thumbnail [153 KiB]
*.C file
Fig1c.pdf
Fig1d.pdf [14 KiB]
HiDef png [191 KiB]
Thumbnail [151 KiB]
*.C file
Fig1d.pdf
Fig1e.pdf [14 KiB]
HiDef png [182 KiB]
Thumbnail [145 KiB]
*.C file
Fig1e.pdf
Fig1f.pdf [14 KiB]
HiDef png [219 KiB]
Thumbnail [176 KiB]
*.C file
Fig1f.pdf
Fig1g.pdf [14 KiB]
HiDef png [220 KiB]
Thumbnail [154 KiB]
*.C file
Fig1g.pdf
Fig1h.pdf [14 KiB]
HiDef png [192 KiB]
Thumbnail [154 KiB]
*.C file
Fig1h.pdf
Fig1i.pdf [14 KiB]
HiDef png [190 KiB]
Thumbnail [149 KiB]
*.C file
Fig1i.pdf
Fig1j.pdf [14 KiB]
HiDef png [210 KiB]
Thumbnail [162 KiB]
*.C file
Fig1j.pdf
Fig1k.pdf [14 KiB]
HiDef png [211 KiB]
Thumbnail [141 KiB]
*.C file
Fig1k.pdf
Fig1l.pdf [14 KiB]
HiDef png [203 KiB]
Thumbnail [159 KiB]
*.C file
Fig1l.pdf
Fig1m.pdf [14 KiB]
HiDef png [202 KiB]
Thumbnail [164 KiB]
*.C file
Fig1m.pdf
Fig1n.pdf [14 KiB]
HiDef png [205 KiB]
Thumbnail [143 KiB]
*.C file
Fig1n.pdf

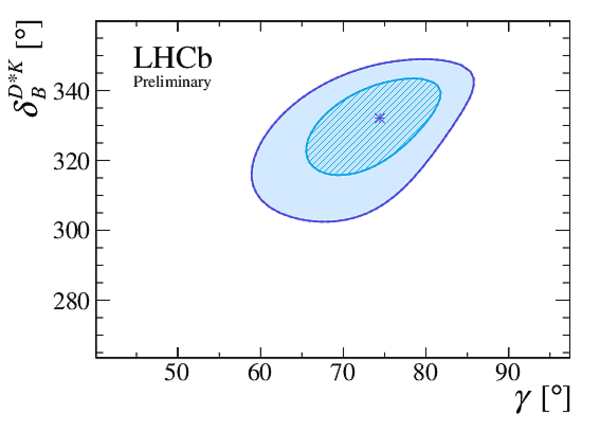
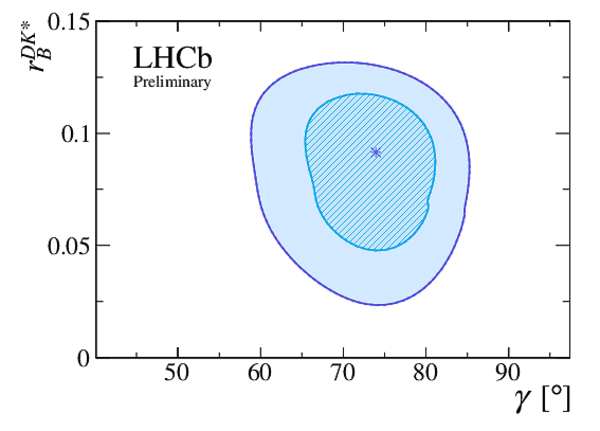
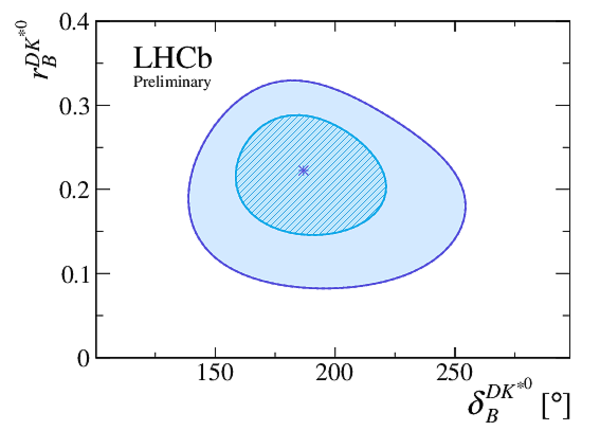
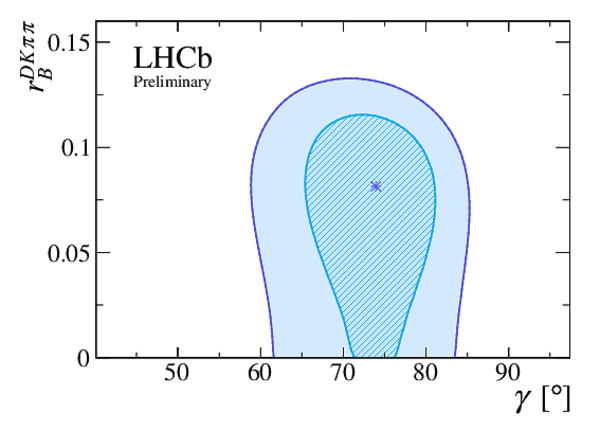
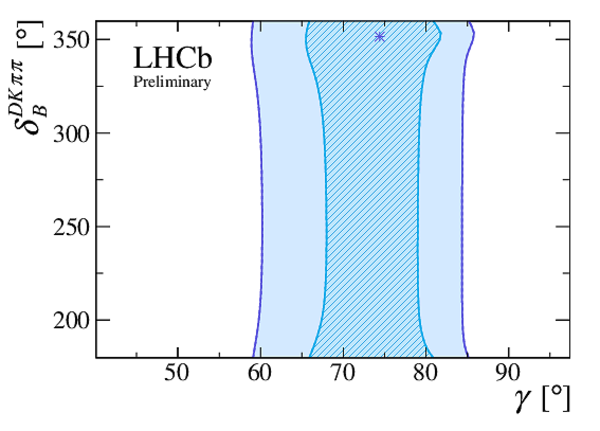
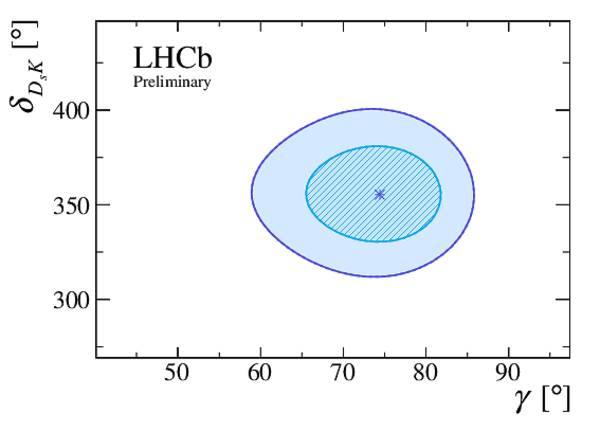
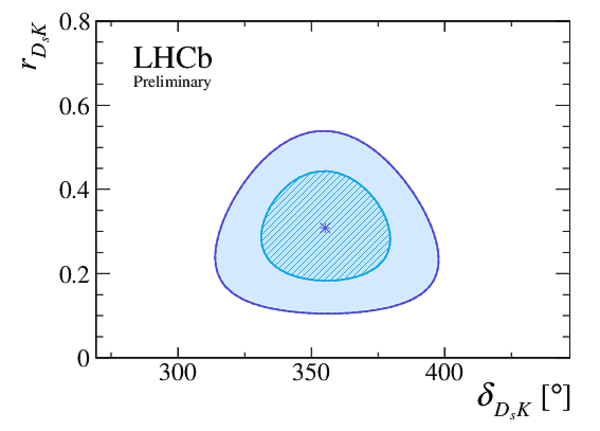
Profile likelihood contours from the combination. The contours show the two-dimensional $1\sigma$ and $2\sigma$ confidence regions, corresponding to 68.3% and 95.5% CL, respectively.

Fig2a.pdf [14 KiB]
HiDef png [268 KiB]
Thumbnail [163 KiB]
*.C file
Fig2a.pdf
Fig2b.pdf [14 KiB]
HiDef png [275 KiB]
Thumbnail [167 KiB]
*.C file
Fig2b.pdf
Fig2c.pdf [14 KiB]
HiDef png [262 KiB]
Thumbnail [160 KiB]
*.C file
Fig2c.pdf
Fig2d.pdf [14 KiB]
HiDef png [218 KiB]
Thumbnail [134 KiB]
*.C file
Fig2d.pdf
Fig2e.pdf [14 KiB]
HiDef png [248 KiB]
Thumbnail [154 KiB]
*.C file
Fig2e.pdf
Fig2f.pdf [14 KiB]
HiDef png [228 KiB]
Thumbnail [144 KiB]
*.C file
Fig2f.pdf
Fig2g.pdf [14 KiB]
HiDef png [336 KiB]
Thumbnail [198 KiB]
*.C file
Fig2g.pdf
Fig2h.pdf [14 KiB]
HiDef png [459 KiB]
Thumbnail [271 KiB]
*.C file
Fig2h.pdf
Fig2i.pdf [14 KiB]
HiDef png [528 KiB]
Thumbnail [336 KiB]
*.C file
Fig2i.pdf

Profile likelihood contours from the combination. The contours show the two-dimensional $1\sigma$ and $2\sigma$ confidence regions, corresponding to 68.3% and 95.5% CL, respectively.

Fig3a.pdf [14 KiB]
HiDef png [288 KiB]
Thumbnail [174 KiB]
*.C file
Fig3a.pdf
Fig3b.pdf [14 KiB]
HiDef png [275 KiB]
Thumbnail [166 KiB]
*.C file
Fig3b.pdf
Fig3c.pdf [14 KiB]
HiDef png [314 KiB]
Thumbnail [188 KiB]
*.C file
Fig3c.pdf
Fig3d.pdf [14 KiB]
HiDef png [415 KiB]
Thumbnail [245 KiB]
*.C file
Fig3d.pdf
Fig3e.pdf [14 KiB]
HiDef png [526 KiB]
Thumbnail [319 KiB]
*.C file
Fig3e.pdf
Fig3f.pdf [13 KiB]
HiDef png [832 KiB]
Thumbnail [586 KiB]
*.C file
Fig3f.pdf
Fig3g.pdf [14 KiB]
HiDef png [280 KiB]
Thumbnail [172 KiB]
*.C file
Fig3g.pdf
Fig3h.pdf [14 KiB]
HiDef png [256 KiB]
Thumbnail [156 KiB]
*.C file
Fig3h.pdf
Fig3i.pdf [14 KiB]
HiDef png [270 KiB]
Thumbnail [165 KiB]
*.C file
Fig3i.pdf

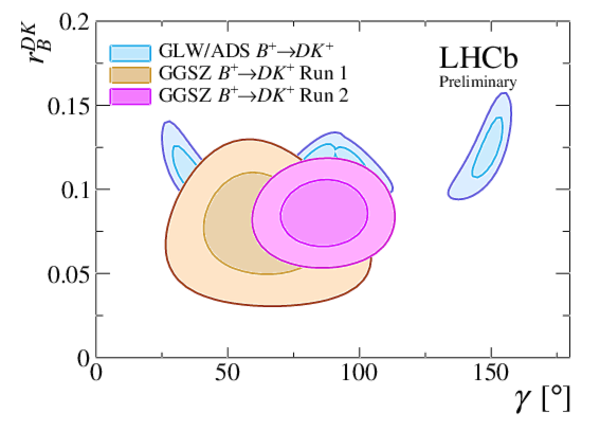
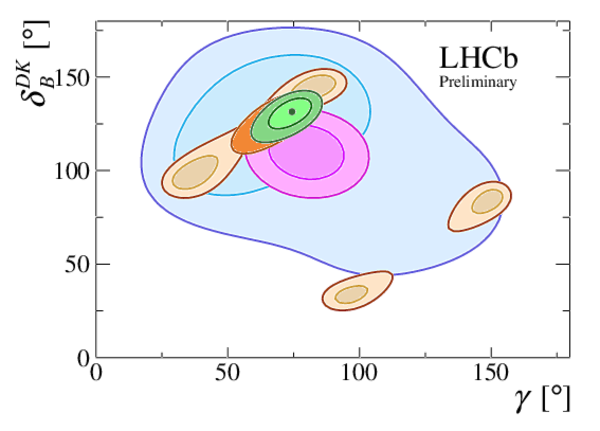
Profile likelihood contours of $\gamma$ vs $ r_B^{DK}$ (left) and $\gamma$ vs $\delta_B^{DK}$ (right) for the GLW/ADS analysis of $ B ^+ \rightarrow D K ^+ $ , $ D\rightarrow h^+h^-$ (blue) alongisde the Run 1 (brown) and Run 2 (pink) GGSZ analyses of $ B ^+ \rightarrow D K ^+ $ , $ D\rightarrow K ^0_{\mathrm{ \scriptscriptstyle S}} h^+h^-$ .

Fig4a.pdf [18 KiB]
HiDef png [367 KiB]
Thumbnail [213 KiB]
*.C file
Fig4a.pdf
Fig4b.pdf [17 KiB]
HiDef png [330 KiB]
Thumbnail [198 KiB]
*.C file
Fig4b.pdf

$ 1-{\rm CL}$ plots, using the profile likelihood method, for combinations split by the initial $B$ meson flavour: (orange) $ B ^0_ s $ initial states, (yellow) $ B ^0$ initial states, (blue) $ B ^+$ initial states and (green) the full combination.

Fig5a.pdf [16 KiB]
HiDef png [297 KiB]
Thumbnail [174 KiB]
*.C file
Fig5a.pdf
Fig5b.pdf [12 KiB]
HiDef png [107 KiB]
Thumbnail [102 KiB]
*.C file
Fig5b.pdf

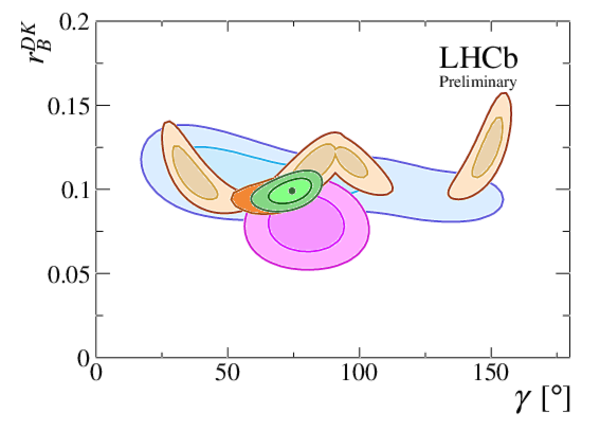
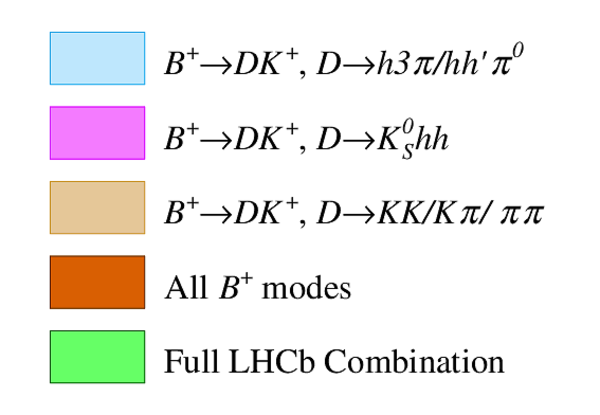
Profile likelihood contours of $\gamma$ vs. $ r_B^{DK}$ (left) and $\gamma$ vs. $\delta_B^{DK}$ (right) for various sub-combinations: (blue) $ B ^+ \rightarrow D K ^+ $ , $D \rightarrow h3\pi$/$hh^{\prime}\pi ^0 $, (pink) $ B ^+ \rightarrow D K ^+ $ , $D\rightarrow K ^0_{\mathrm{ \scriptscriptstyle S}} hh$, (light brown) $ B ^+ \rightarrow D K ^+ $ , $D\rightarrow KK$/$K\pi$/$\pi\pi$, (orange) all $ B ^+$ modes and (green) the full combination. Dark and light confidence regions correspond to 68.3% and 95.5% CL respectively.

Fig6a.pdf [19 KiB]
HiDef png [366 KiB]
Thumbnail [197 KiB]
*.C file
Fig6a.pdf
Fig6b.pdf [20 KiB]
HiDef png [422 KiB]
Thumbnail [227 KiB]
*.C file
Fig6b.pdf
Fig6c.pdf [13 KiB]
HiDef png [128 KiB]
Thumbnail [118 KiB]
*.C file
Fig6c.pdf

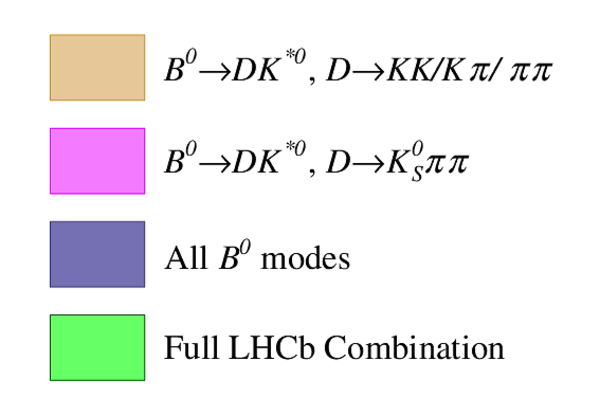
Profile likelihood contours of $\gamma$ vs. $ r_B^{DK^{*0}}$ (left) and $\gamma$ vs. $\delta_B^{DK^{*0}}$ (right) for various sub-combinations: (brown) $ B ^0 \rightarrow D K^{*0}$ , $D\rightarrow KK$/$K\pi$/$\pi\pi$, (pink) $ B ^0 \rightarrow D K^{*0}$ , $D\rightarrow K ^0_{\mathrm{ \scriptscriptstyle S}} \pi\pi$, (purple) all $ B ^0$ modes and (green) the full combination. Dark and light confidence regions correspond to 68.3% and 95.5% CL respectively.

Fig7a.pdf [19 KiB]
HiDef png [424 KiB]
Thumbnail [225 KiB]
*.C file
Fig7a.pdf
Fig7b.pdf [18 KiB]
HiDef png [431 KiB]
Thumbnail [237 KiB]
*.C file
Fig7b.pdf
Fig7c.pdf [12 KiB]
HiDef png [107 KiB]
Thumbnail [96 KiB]
*.C file
Fig7c.pdf

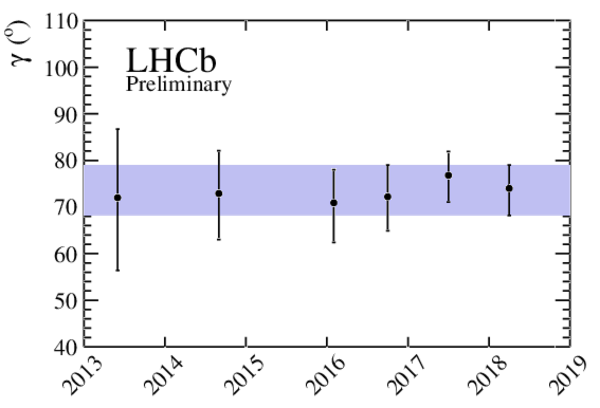
The central value and $1\sigma$ uncertainty of the LHCb $\gamma$ combination (black points with error bars) as a function of time. The blue line (band) shows the central value (68.3% CL) for the latest result (BEAUTY 2018).

Fig8.pdf [13 KiB]
HiDef png [137 KiB]
Thumbnail [107 KiB]
*.C file
Fig8.pdf

Animated gif made out of all figures.

CONF-2018-002.gif
Thumbnail
thumbnail_CONF-2018-002.gif

Tables and captions

List of the LHCb measurements used in the combination, where TD is time-dependent and the method acronyms refer to the authors of Refs. [10,11,12,13,4,5,6,7,8,9].

Table_1.pdf [113 KiB]
HiDef png [151 KiB]
Thumbnail [40 KiB]
tex code
Table_1.pdf

List of the auxiliary inputs used in the combination.

Table_2.pdf [97 KiB]
HiDef png [124 KiB]
Thumbnail [59 KiB]
tex code
Table_2.pdf

Confidence intervals and central values for the parameters of interest. Note that $ r_B^{D^\mp\pi^\pm}$ is constrained as described in Sec. 3.

Table_3.pdf [74 KiB]
HiDef png [167 KiB]
Thumbnail [83 KiB]
tex code
Table_3.pdf

Measured coverage $\alpha$ of the confidence intervals for $\gamma$ , determined at the best fit points, for both the one-dimensional {\sc Plugin} and profile likelihood methods. The nominal coverage is denoted as $\eta$.

Table_4.pdf [51 KiB]
HiDef png [44 KiB]
Thumbnail [21 KiB]
tex code
Table_4.pdf

Statistical correlation matrix for the $ B ^+ \rightarrow D K ^+ $ , $ D\rightarrow h^+h^-$ observables [14].

Table_5.pdf [54 KiB]
HiDef png [50 KiB]
Thumbnail [12 KiB]
tex code
Table_5.pdf

Systematic correlation matrix for the $ B ^+ \rightarrow D K ^+ $ , $ D\rightarrow h^+h^-$ observables [14].

Table_6.pdf [55 KiB]
HiDef png [65 KiB]
Thumbnail [16 KiB]
tex code
Table_6.pdf

Statistical correlation matrix for the $ B ^+ \rightarrow D^* K ^+ $ , $ D\rightarrow h^+h^-$ observables [14].

Table_7.pdf [61 KiB]
HiDef png [50 KiB]
Thumbnail [24 KiB]
tex code
Table_7.pdf

Systematic correlation matrix for the $ B ^+ \rightarrow D^* K ^+ $ , $ D\rightarrow h^+h^-$ observables [14].

Table_8.pdf [62 KiB]
HiDef png [58 KiB]
Thumbnail [27 KiB]
tex code
Table_8.pdf

Statistical correlation matrix for the $ B ^+ \rightarrow D K^{*+}$ , $ D\rightarrow h^+h^-$ and $ D\rightarrow h^+\pi^-\pi^+\pi^-$ observables [20].

Table_9.pdf [76 KiB]
HiDef png [38 KiB]
Thumbnail [15 KiB]
tex code
Table_9.pdf

Systematic correlation matrix for the $ B ^+ \rightarrow D K^{*+}$ , $ D\rightarrow h^+h^-$ and $ D\rightarrow h^+\pi^-\pi^+\pi^-$ observables [20].

Table_10.pdf [76 KiB]
HiDef png [49 KiB]
Thumbnail [19 KiB]
tex code
Table_10.pdf

Statistical correlation matrix for the $ B ^+ \rightarrow D K ^+ $ , $ D\rightarrow K ^0_{\mathrm{ \scriptscriptstyle S}} h^+h^-$ observables [18].

Table_11.pdf [52 KiB]
HiDef png [46 KiB]
Thumbnail [22 KiB]
tex code
Table_11.pdf

Systematic correlation matrix for the $ B ^+ \rightarrow D K ^+ $ , $ D\rightarrow K ^0_{\mathrm{ \scriptscriptstyle S}} h^+h^-$ observables [18].

Table_12.pdf [52 KiB]
HiDef png [47 KiB]
Thumbnail [22 KiB]
tex code
Table_12.pdf

Statistical correlation matrix for the $ B ^0_ s \rightarrow D_s^\mp K^\pm$ observables [25].

Table_13.pdf [52 KiB]
HiDef png [49 KiB]
Thumbnail [25 KiB]
tex code
Table_13.pdf

Systematic correlation matrix for the $ B ^0_ s \rightarrow D_s^\mp K^\pm$ observables [25].

Table_14.pdf [52 KiB]
HiDef png [50 KiB]
Thumbnail [26 KiB]
tex code
Table_14.pdf

Statistical correlation matrix for the $ B ^0 \rightarrow D ^\mp \pi ^\pm $ observables [26].

Table_15.pdf [44 KiB]
HiDef png [52 KiB]
Thumbnail [19 KiB]
tex code
Table_15.pdf

Systematic correlation matrix for the $ B ^0 \rightarrow D ^\mp \pi ^\pm $ observables [26].

Table_16.pdf [51 KiB]
HiDef png [38 KiB]
Thumbnail [16 KiB]
tex code
Table_16.pdf

Created on 02 May 2024.