Measurement of the differential branching fraction of the decay $\Lambda_b^0 \rightarrow \Lambda\mu^+\mu^-$
[to restricted-access page]Information
LHCb-PAPER-2013-025
CERN-PH-EP-2013-094
arXiv:1306.2577 [PDF]
(Submitted on 11 Jun 2013)
Phys. Lett. B725 (2013) 25
Inspire 1238106
Tools
Abstract
The differential branching fraction of the decay $\Lambda_b^0\rightarrow\Lambda\mu^+\mu^-$ is measured as a function of the square of the dimuon invariant mass, $q^2$. A yield of $78\pm12$ $\Lambda_b^0\rightarrow\Lambda\mu^+\mu^-$ decays is observed using data, corresponding to an integrated luminosity of 1.0 fb$^{-1}$, collected by the LHCb experiment at a centre-of-mass energy of 7 TeV. A significant signal is found in the $q^2$ region above the square of the $J/\psi$ mass, while at lower-$q^2$ values upper limits are set on the differential branching fraction. Integrating the differential branching fraction over $q^2$, while excluding the $J/\psi$ and $\psi(2S)$ regions, gives a branching fraction of $\BF($\Lambda_b^0\rightarrow\Lambda\mu^+\mu^-$)=(0.96\pm 0.16\stat\pm 0.13\syst\pm 0.21 (\mathrm{norm}))\times 10^{-6}$, where the uncertainties are statistical, systematic and due to the normalisation mode, $$\Lambda_b^0\rightarrow J/psi\Lambda$, respectively.
Figures and captions
|
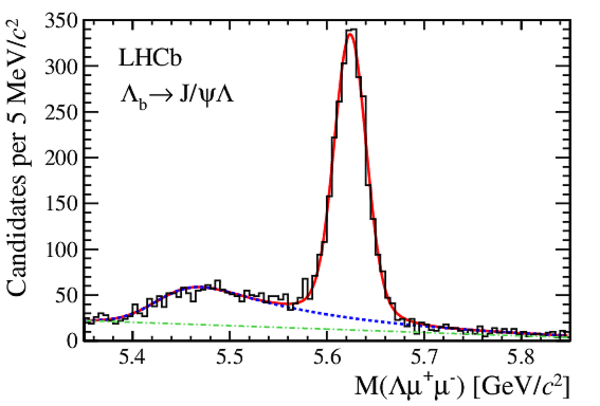
Invariant mass distribution of the $\Lambda ^0_ b \rightarrow { J \mskip -3mu/\mskip -2mu\psi \mskip 2mu} \Lambda $ candidates. The histogram shows data, the solid red line is the overall fit function, the dotted blue line represents the sum of the combinatorial and peaking backgrounds and the dash-dotted green line the combinatorial background component. |
Fig1.pdf [17 KiB] HiDef png [201 KiB] Thumbnail [171 KiB] *.C file |
|
|
Invariant mass distribution of the $\Lambda ^0_ b \rightarrow \Lambda \mu ^+\mu ^- $ candidates, integrated over all $ q^2$ values, together with the fit function described in the text. The histogram shows data, the solid red line is the overall fit function and the dotted blue line represents the background component. |
Fig2.pdf [15 KiB] HiDef png [164 KiB] Thumbnail [148 KiB] *.C file |

|
|
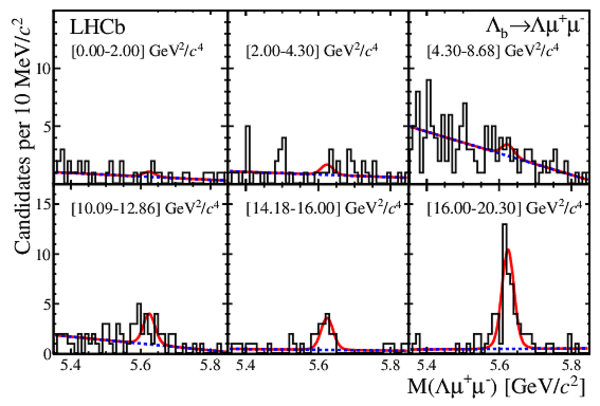
Invariant mass distributions for the rare decay $\Lambda ^0_ b \rightarrow \Lambda \mu ^+\mu ^- $ candidates, in six $ q^2$ intervals, together with the fit function described in the text. The histogram shows data, the solid red line is the overall fit function and the dotted blue line represents the background component. |
Fig3.pdf [23 KiB] HiDef png [281 KiB] Thumbnail [250 KiB] *.C file |
|
|
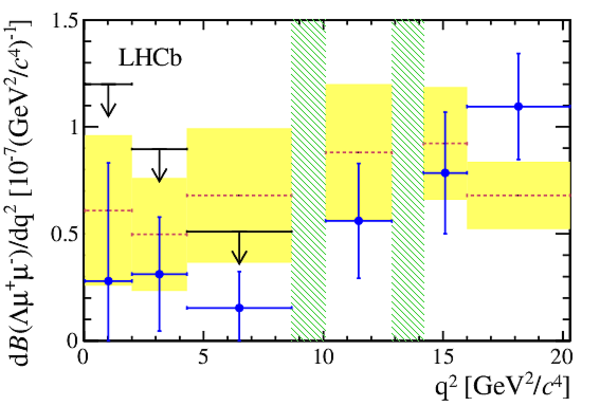
Measured differential branching fraction for the $\Lambda ^0_ b \rightarrow \Lambda \mu ^+\mu ^- $ decay. In regions without a significant signal, the 90 % confidence level upper limits are also shown. The uncertainties due to components that are fully correlated across all $ q^2$ bins, e.g. the branching fraction of the normalisation channel from Ref. [30], are not included in this figure. The dashed red line with the filled area shows the theoretical prediction from Ref. [14]. |
Fig4.pdf [14 KiB] HiDef png [292 KiB] Thumbnail [230 KiB] *.C file |
|
|
Animated gif made out of all figures. |
PAPER-2013-025.gif Thumbnail |

|
![HiDef png [201 KiB]](Directory_LHCb-PAPER-2013-025/hidef_Fig1.png)
![HiDef png [164 KiB]](Directory_LHCb-PAPER-2013-025/hidef_Fig2.png)
![HiDef png [281 KiB]](Directory_LHCb-PAPER-2013-025/hidef_Fig3.png)
![HiDef png [292 KiB]](Directory_LHCb-PAPER-2013-025/hidef_Fig4.png)
Tables and captions
|
Signal ($N_\mathrm{S}$) and background ($N_\mathrm{B}$) decay yields obtained from the $\Lambda ^0_ b \rightarrow \Lambda \mu ^+\mu ^- $ mass fit in each $ q^2$ interval. The integrated yield is the result of a fit without separation of the data into distinct $ q^2$ regions. The statistical significance is calculated as described in the text. |
Table_1.pdf [38 KiB] HiDef png [67 KiB] Thumbnail [35 KiB] tex code |

|
|
Total relative efficiency, $\varepsilon_{\mathrm{rel}}$, between $\Lambda ^0_ b \rightarrow \Lambda \mu ^+\mu ^- $ and $\Lambda ^0_ b \rightarrow { J \mskip -3mu/\mskip -2mu\psi \mskip 2mu} \Lambda $ decays. The uncertainties are the combination of both statistical and systematic components, and are dominated by the latter. |
Table_2.pdf [36 KiB] HiDef png [91 KiB] Thumbnail [42 KiB] tex code |

|
|
Absolute systematic uncertainties on the yields for the $\Lambda ^0_ b \rightarrow \Lambda \mu ^+\mu ^- $ decay. |
Table_3.pdf [32 KiB] HiDef png [56 KiB] Thumbnail [26 KiB] tex code |

|
|
Absolute systematic uncertainties on the total relative efficiency, $\varepsilon_{\mathrm{rel}}$. |
Table_4.pdf [33 KiB] HiDef png [92 KiB] Thumbnail [42 KiB] tex code |

|
|
Measured relative differential branching fraction, $(1/\cal B (\Lambda ^0_ b \rightarrow { J \mskip -3mu/\mskip -2mu\psi \mskip 2mu} \Lambda ))\;\mathrm{d}\cal B (\Lambda ^0_ b \rightarrow \Lambda \mu ^+\mu ^- )/\mathrm{d} q^2 $. The first uncertainty is statistical and the second is systematic. The systematic uncertainty includes the small, correlated component due to $\cal B ( { J \mskip -3mu/\mskip -2mu\psi \mskip 2mu} \rightarrow \mu ^+\mu ^- )=(5.93\pm0.06)\times10^{-2}$ [30]. The rightmost column gives the 90 % (95 %) confidence level upper limit (UL) on the relative branching fraction in $ q^2$ intervals where no significant signal is observed. |
Table_5.pdf [45 KiB] HiDef png [47 KiB] Thumbnail [22 KiB] tex code |

|
|
Measured differential branching fraction, $\mathrm{d}\cal B (\Lambda ^0_ b \rightarrow \Lambda \mu ^+\mu ^- )/\mathrm{d} q^2 $, for $\cal B$ ( $\Lambda ^0_ b \rightarrow { J \mskip -3mu/\mskip -2mu\psi \mskip 2mu} \Lambda $ )$ = (6.2\pm1.4)\times10^{-4}$ [30], where the first uncertainty is statistical, the second systematic and the third from the uncertainty in $\cal B$ ( $\Lambda ^0_ b \rightarrow { J \mskip -3mu/\mskip -2mu\psi \mskip 2mu} \Lambda $ ). The rightmost column gives the 90 % (95 %) confidence level upper limit (UL) on the branching fraction in $ q^2$ intervals where no significant signal is observed. |
Table_6.pdf [45 KiB] HiDef png [56 KiB] Thumbnail [28 KiB] tex code |

|
![HiDef png [67 KiB]](Directory_LHCb-PAPER-2013-025/hidef_Table_1.png)
![HiDef png [91 KiB]](Directory_LHCb-PAPER-2013-025/hidef_Table_2.png)
![HiDef png [56 KiB]](Directory_LHCb-PAPER-2013-025/hidef_Table_3.png)
![HiDef png [92 KiB]](Directory_LHCb-PAPER-2013-025/hidef_Table_4.png)
![HiDef png [47 KiB]](Directory_LHCb-PAPER-2013-025/hidef_Table_5.png)
![HiDef png [56 KiB]](Directory_LHCb-PAPER-2013-025/hidef_Table_6.png)
Supplementary Material [file]
| Supplementary material full pdf |
supple[..].pdf [164 KiB] |
|
|
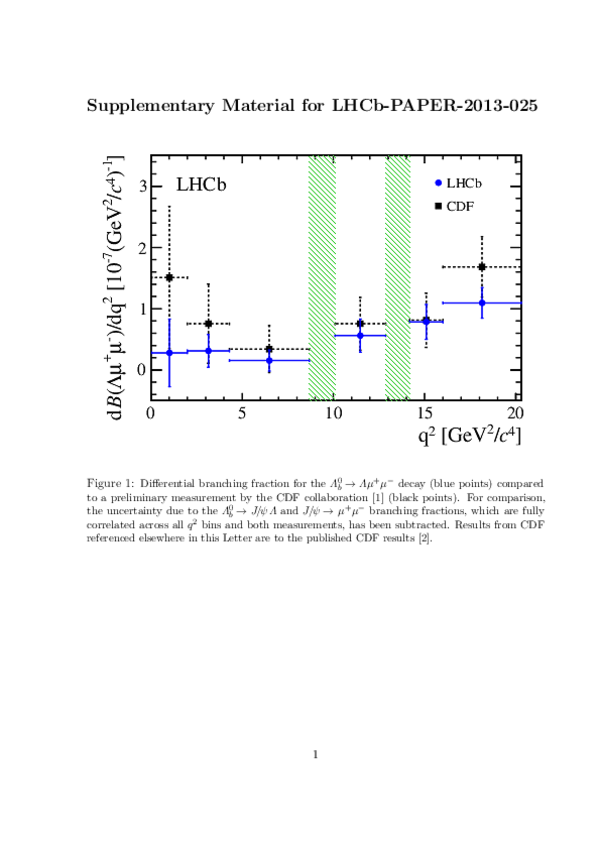
This ZIP file contains supplemetary material for the publication LHCb-PAPER-2013-025. The files are: supplementary.pdf : An overview of the extra figures *.pdf, *.png, *.eps : The figures in variuous formats |
Fig1-S.pdf [14 KiB] HiDef png [279 KiB] Thumbnail [234 KiB] *C file |

|
|
Fig2-S.pdf [14 KiB] HiDef png [284 KiB] Thumbnail [228 KiB] *C file |

|
|
|
Fig3-S.pdf [15 KiB] HiDef png [342 KiB] Thumbnail [290 KiB] *C file |

|
![HiDef png [279 KiB]](Directory_LHCb-PAPER-2013-025/supplementary/hidef_Fig1-S.png)
![HiDef png [284 KiB]](Directory_LHCb-PAPER-2013-025/supplementary/hidef_Fig2-S.png)
![HiDef png [342 KiB]](Directory_LHCb-PAPER-2013-025/supplementary/hidef_Fig3-S.png)
Created on 27 April 2024.