Study of $D_J$ meson decays to $D^+\pi^-$, $D^0 \pi^+$ and $D^{*+}\pi^-$ final states in $pp$ collisions
[to restricted-access page]Information
LHCb-PAPER-2013-026
CERN-PH-EP-2013-122
arXiv:1307.4556 [PDF]
(Submitted on 17 Jul 2013)
JHEP 09 (2013) 145
Inspire 1243156
Tools
Abstract
A study of $D^+\pi^-$, $D^0 \pi^+$ and $D^{*+}\pi^-$ final states is performed using pp collision data, corresponding to an integrated luminosity of 1.0 $fb^{-1}$, collected at a centre-of-mass energy of 7 TeV with the LHCb detector. The $D_1(2420)^0$ resonance is observed in the $D^{*+}\pi^-$ final state and the $D^*_2(2460)$ resonance is observed in the $D^+\pi^-$, $D^0 \pi^+$ and $D^{*+}\pi^-$ final states. For both resonances, their properties and spin-parity assignments are obtained. In addition, two natural parity and two unnatural parity resonances are observed in the mass region between 2500 and 2800 MeV. Further structures in the region around 3000 MeV are observed in all the $D^{*+}\pi^-$, $D^+\pi^-$ and $D^0 \pi^+$ final states.
Figures and captions
|
Modified Godfrey-Isgur mass predictions \cite{Godfrey:1985xj}. The figure shows the $c\bar{u}$ spectrum in which the masses have been scaled such that the ground state coincides with the $D^0$ mass. The $2^-$ states, not shown in the original publication, have been inserted following the splitting structure of the 1P states. |
fig1.pdf [13 KiB] HiDef png [137 KiB] Thumbnail [53 KiB] *.C file |

|
|
Invariant mass distribution for (a) $ D ^+ \rightarrow K^-\pi^+\pi^+$, (b) $ D ^0 \rightarrow K^-\pi^+$, and (c) $ D ^{*+} \rightarrow D ^0 \pi ^+ $ decays. The solid lines are the results from the fits described in the text. The vertical dashed lines indicate the signal regions. |
fig2.pdf [31 KiB] HiDef png [323 KiB] Thumbnail [211 KiB] *.C file |

|
|
Invariant mass distribution for (a) $ D ^+ \pi ^- $, (b) $ D ^0 \pi ^+ $ and (c) $ D ^{*+} \pi ^- $ candidates (points). The full line histograms (in red) show the wrong-sign mass spectra for (a) $ D ^+ \pi ^+ $, (b) $ D ^0 \pi ^- $ and (c) $ D ^{*+} \pi ^+ $ normalized to the same yield at high $D^{(*)}\pi$ masses. |
fig3.pdf [39 KiB] HiDef png [418 KiB] Thumbnail [472 KiB] *.C file |

|
|
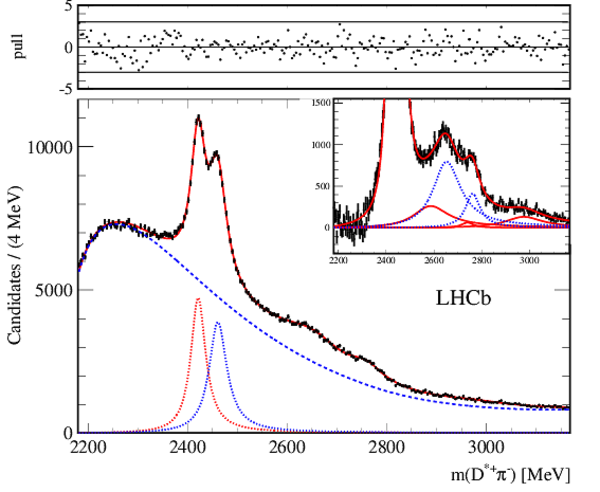
Fit to the $ D ^{*+} \pi ^- $ mass spectrum, {\it enhanced unnatural parity sample}, as defined in Table ???. The dashed (blue) line shows the fitted background, the dotted (red) line the $ D_1(2420)^0$ contribution. The inset displays the $ D ^{*+} \pi ^- $ mass spectrum after subtracting the fitted background. The full line curves (blue) show the contributions from $ D_{J}(2580)^0$ , $ D_{J}(2740)^0$ , and $ D_{J}(3000)^0$ states. The top window displays the pull distribution where the horizontal lines indicate $\pm 3 \sigma$. The pull is defined as $(N_{\rm data} - N_{\rm fit})/\sqrt{N_{\rm data}}$. |
fig4.pdf [71 KiB] HiDef png [319 KiB] Thumbnail [229 KiB] *.C file |

|
|
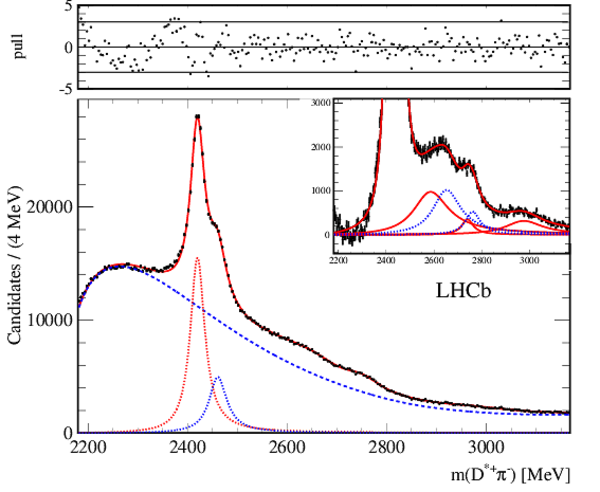
Fit to the {\it natural parity sample} $ D ^{*+} \pi ^- $ mass spectrum. The dashed (blue) line shows the fitted background, the dotted lines the $ D_1(2420)^0$ (red) and $ {D}^*_2(2460)^0$ (blue) contributions. The inset displays the $ D ^{*+} \pi ^- $ mass spectrum after subtracting the fitted background. The full line curves (red) show the contributions from $ D_{J}(2580)^0$ , $ D_{J}(2740)^0$ , and $ D_{J}(3000)^0$ . The dotted (blue) lines display the $ D^*_{J}(2650)^0$ and $ D^*_{J}(2760)^0$ contributions. The top window shows the pull distribution where the horizontal lines indicate $\pm 3 \sigma$. |
fig5.pdf [76 KiB] HiDef png [337 KiB] Thumbnail [240 KiB] *.C file |
|
|
Fit to the {\it unnatural parity sample} $ D ^{*+} \pi ^- $ mass spectrum. The dashed (blue) line shows the fitted background, the dotted lines the $ D_1(2420)^0$ (red) and $ {D}^*_2(2460)^0$ (blue) contributions. The inset displays the $ D ^{*+} \pi ^- $ mass spectrum after subtracting the fitted background. The full line curves (red) show the contributions from $ D_{J}(2580)^0$ , $ D_{J}(2740)^0$ , and $ D_{J}(3000)^0$ states. The dotted (blue) lines display the $ D^*_{J}(2650)^0$ and $ D^*_{J}(2760)^0$ contributions. The top window shows the pull distribution where the horizontal lines indicate $\pm 3 \sigma$. |
fig6.pdf [74 KiB] HiDef png [333 KiB] Thumbnail [241 KiB] *.C file |

|
|
Fit to the total $ D ^{*+} \pi ^- $ sample. The dashed (blue) line shows the fitted background, the dotted lines the $ D_1(2420)^0$ (red) and $ {D}^*_2(2460)^0$ (blue) contributions. The inset displays the $ D ^{*+} \pi ^- $ mass spectrum after subtracting the fitted background. The full line curves (red) show the contributions from $ D_{J}(2580)^0$ , $ D_{J}(2740)^0$ , and $ D_{J}(3000)^0$ states. The dotted (blue) lines display the $ D^*_{J}(2650)^0$ and $ D^*_{J}(2760)^0$ contributions. The top window shows the pull distribution where the horizontal lines indicate $\pm 3 \sigma$. |
fig7.pdf [72 KiB] HiDef png [329 KiB] Thumbnail [236 KiB] *.C file |
|
|
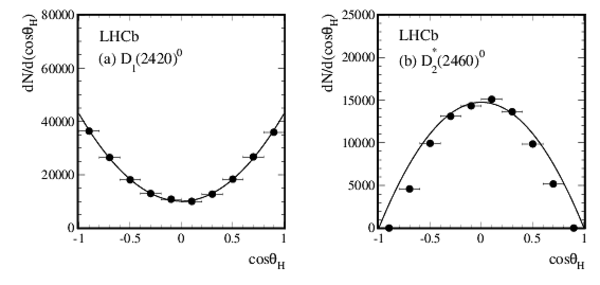
Distributions of (a) $ D_1(2420)^0$ and (b) $ {D}^*_2(2460)^0$ candidates as functions of the helicity angle $\cos\theta_{\rm H}$ . The distributions are fitted with unnatural and natural parity functions, respectively. |
fig8.pdf [17 KiB] HiDef png [99 KiB] Thumbnail [51 KiB] *.C file |
|
|
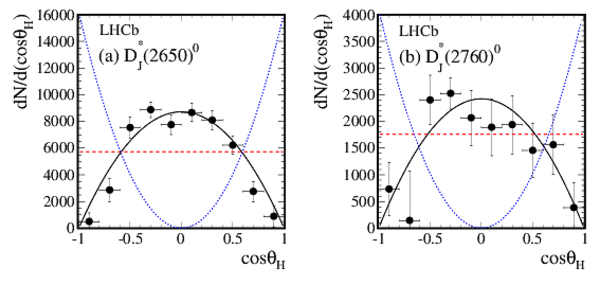
Distributions of (a) $ D^*_{J}(2650)^0$ and (b) $ D^*_{J}(2760)^0$ candidates as functions of the helicity angle $\cos\theta_{\rm H}$ . The distributions are fitted with natural parity (black continuous), unnatural parity (red, dashed) and $J^P=0^-$ (blue, dotted) functions. |
fig9.pdf [20 KiB] HiDef png [203 KiB] Thumbnail [192 KiB] *.C file |
|
|
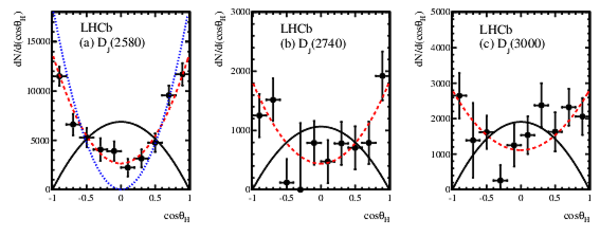
Distributions of (a) $ D_{J}(2580)^0$ , (b) $ D_{J}(2740)^0$ and (c) $ D_{J}(3000)^0$ candidates as functions of the helicity angle $\cos\theta_{\rm H}$ . The distributions are fitted with natural parity (black continuous) and unnatural parity (red, dashed) functions. In (a) the $J^P=0^-$ (blue, dotted) hypothesis is also tested. |
fig10.pdf [22 KiB] HiDef png [188 KiB] Thumbnail [144 KiB] *.C file |
|
|
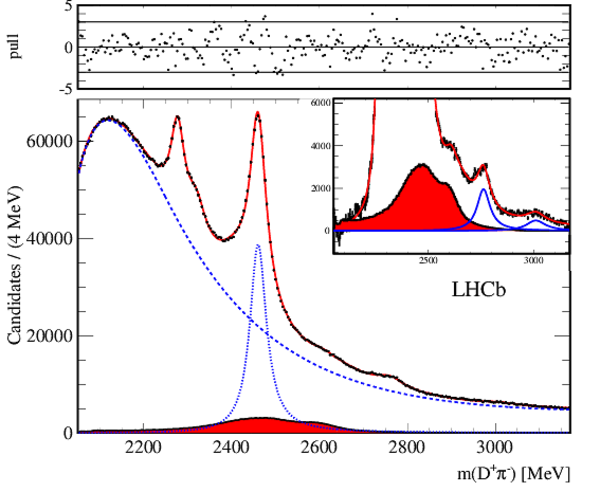
Fit to the $ D ^+ \pi ^- $ mass spectrum. The filled histogram (in red) shows the estimated cross-feeds from the high mass $ D ^* \pi$ resonances. The dashed (blue) line displays the fitted background. The dotted (blue) line shows the $ {D}^*_2(2460)^0$ contribution. The inset displays the mass spectrum after the fitted background subtraction. The full (blue) curves show the $ D^*_{J}(2760)^0$ and $ D^*_{J}(3000)^0$ contributions. The top window displays the pull distribution where the horizontal lines indicate $\pm 3 \sigma$. |
fig11.pdf [76 KiB] HiDef png [307 KiB] Thumbnail [229 KiB] *.C file |
|
|
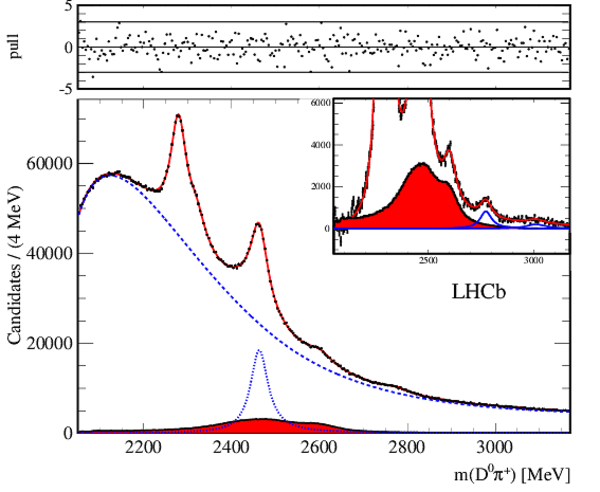
Fit to the $ D ^0 \pi ^+ $ mass spectrum. The filled histogram (in red) shows the estimated cross-feeds from the high mass $ D ^* \pi$ resonances. The dashed (blue) line displays the fitted background. The dotted (blue) line shows the $ {D}^*_2(2460)^+$ contribution. The inset displays the mass spectrum after the fitted background subtraction. The full (blue) curves show the $ D^*_{J}(2760)^+$ and $ D^*_{J}(3000)^+$ contributions. The top window displays the pull distribution where the horizontal lines indicate $\pm 3 \sigma$. |
fig12.pdf [76 KiB] HiDef png [291 KiB] Thumbnail [218 KiB] *.C file |
|
|
Animated gif made out of all figures. |
PAPER-2013-026.gif Thumbnail |

|
![HiDef png [137 KiB]](Directory_LHCb-PAPER-2013-026/hidef_fig1.png)
![HiDef png [323 KiB]](Directory_LHCb-PAPER-2013-026/hidef_fig2.png)
![HiDef png [418 KiB]](Directory_LHCb-PAPER-2013-026/hidef_fig3.png)
![HiDef png [319 KiB]](Directory_LHCb-PAPER-2013-026/hidef_fig4.png)
![HiDef png [337 KiB]](Directory_LHCb-PAPER-2013-026/hidef_fig5.png)
![HiDef png [333 KiB]](Directory_LHCb-PAPER-2013-026/hidef_fig6.png)
![HiDef png [329 KiB]](Directory_LHCb-PAPER-2013-026/hidef_fig7.png)
![HiDef png [99 KiB]](Directory_LHCb-PAPER-2013-026/hidef_fig8.png)
![HiDef png [203 KiB]](Directory_LHCb-PAPER-2013-026/hidef_fig9.png)
![HiDef png [188 KiB]](Directory_LHCb-PAPER-2013-026/hidef_fig10.png)
![HiDef png [307 KiB]](Directory_LHCb-PAPER-2013-026/hidef_fig11.png)
![HiDef png [291 KiB]](Directory_LHCb-PAPER-2013-026/hidef_fig12.png)
Tables and captions
|
Breit-Wigner parameters describing the cross-feed from $ D_1(2420)$ and $ D^*_2(2460)$ in the $ D ^+ \pi ^- $ and $ D ^0 \pi ^+ $ final states. |
Table_1.pdf [37 KiB] HiDef png [44 KiB] Thumbnail [20 KiB] tex code |

|
|
Definition of the categories selected by different ranges of $\cos\theta_{\rm H}$ , and fraction of the total natural parity contribution. |
Table_2.pdf [49 KiB] HiDef png [39 KiB] Thumbnail [15 KiB] tex code |

|
|
Mass intervals, number of bins, yields, and $\chi^2/{\rm ndf}$ in the fits to the different mass spectra. |
Table_3.pdf [58 KiB] HiDef png [65 KiB] Thumbnail [27 KiB] tex code |

|
|
Resonance parameters, yields and statistical significances. The first uncertainty is statistical, the second systematic. Significances are evaluated using the method described in the text. |
Table_4.pdf [55 KiB] HiDef png [105 KiB] Thumbnail [45 KiB] tex code |

|
|
Results from the fits to the $\cos\theta_{\rm H} $ angular distributions for the resonances observed in the $ D ^{*+} \pi ^- $ mass spectrum. The resulting $\chi^2/{\rm ndf}$ for different spin-parity assignments are reported. For each resonance, the expected angular distributions are indicated, where $h$ is a free parameter. The favoured spin-parity assignment is indicated in bold font. |
Table_5.pdf [64 KiB] HiDef png [87 KiB] Thumbnail [41 KiB] tex code |

|
![HiDef png [44 KiB]](Directory_LHCb-PAPER-2013-026/hidef_Table_1.png)
![HiDef png [39 KiB]](Directory_LHCb-PAPER-2013-026/hidef_Table_2.png)
![HiDef png [65 KiB]](Directory_LHCb-PAPER-2013-026/hidef_Table_3.png)
![HiDef png [105 KiB]](Directory_LHCb-PAPER-2013-026/hidef_Table_4.png)
![HiDef png [87 KiB]](Directory_LHCb-PAPER-2013-026/hidef_Table_5.png)
Created on 27 April 2024.