Measurement of the $C P$ asymmetry in $B^+ \rightarrow K^+ \mu^+ \mu^-$ decays
[to restricted-access page]Information
LHCb-PAPER-2013-043
CERN-PH-EP-2013-145
arXiv:1308.1340 [PDF]
(Submitted on 06 Aug 2013)
Phys. Rev. Lett. 111 (2013) 151801
Inspire 1246785
Tools
Abstract
A measurement of the $C\P$ asymmetry in $B^+ \rightarrow K^+ \mu^+ \mu^-$ decays is presented using $pp$ collision data, corresponding to an integrated luminosity of 1.0${ fb}^{-1}$, recorded by the LHCb experiment during 2011 at a centre-of-mass energy of 7 TeV. The measurement is performed in seven bins of $\mu^+ \mu^-$ invariant mass squared in the range ${0.05<q^{2}<22.00{\mathrm{GeV^2/}c^4}}$, excluding the ${J/\psi}$ and $\psi{(2S)}$ resonance regions. Production and detection asymmetries are corrected for using the $B^+ \rightarrow J/\psi K^+$ decay as a control mode. Averaged over all the bins, the $C\P$ asymmetry is found to be ${{\cal A}_{C\P} = 0.000\pm 0.033{(stat.)} \pm0.005 {(syst.)} \pm 0.007{}(J/\psi K^+)}$, where the third uncertainty is due to the $C\P$ asymmetry of the control mode. This is consistent with the Standard Model prediction.
Figures and captions
|
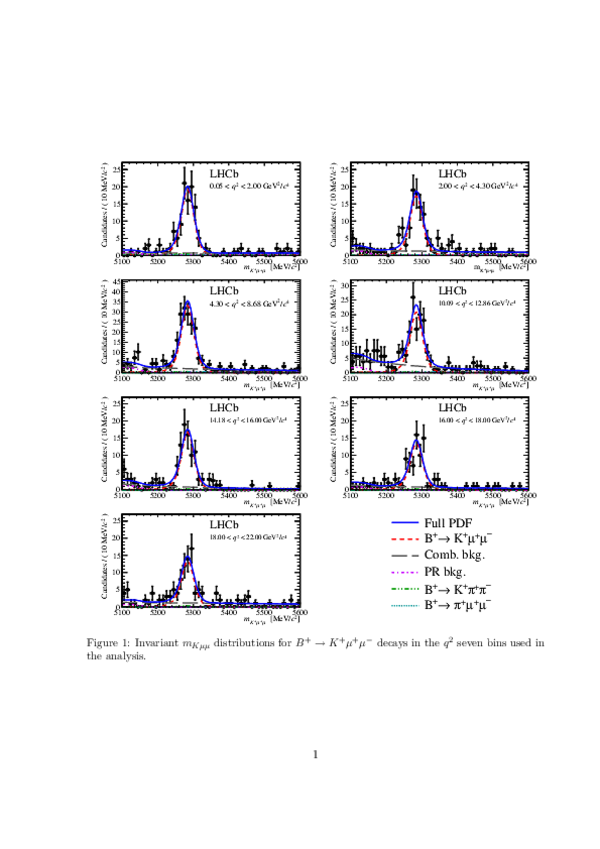
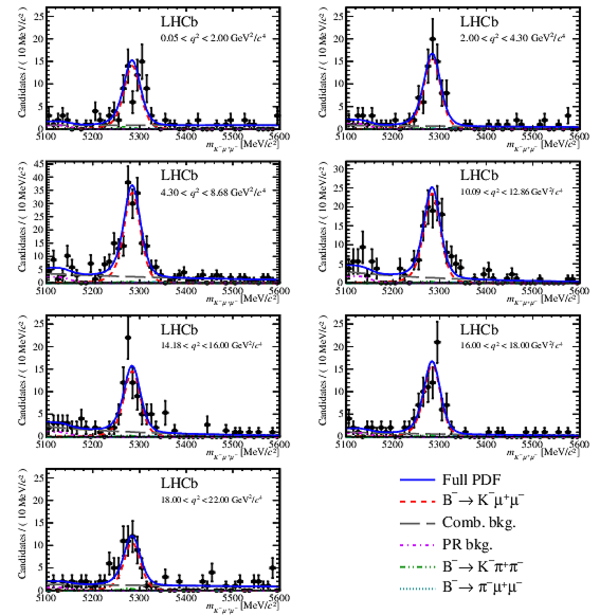
Invariant mass distributions of $ { B ^+ \rightarrow K ^+ \mu ^+\mu ^- }$ candidates for the full $ q^2$ range. The results of the unbinned maximum likelihood fits are shown with blue, solid lines. Also shown are the signal component (red, short-dashed), the combinatorial background (grey, long-dashed), and the partially-reconstructed background (magenta, dot-dashed). The peaking backgrounds $ { B ^+ \rightarrow K ^+ \pi ^+ \pi ^- }$ (green, double-dot-dashed) and $ { B ^+ \rightarrow \pi ^+ \mu ^+\mu ^- }$ (teal, dotted) are also shown under the signal peak. The four datasets are (a) $ B ^+ $ and (b) $ B ^- $ for one magnet polarity, and (c) $ B ^+ $ and (d) $ B ^- $ for the other. |
Fig1.pdf [40 KiB] HiDef png [483 KiB] Thumbnail [339 KiB] *.C file |

|
|
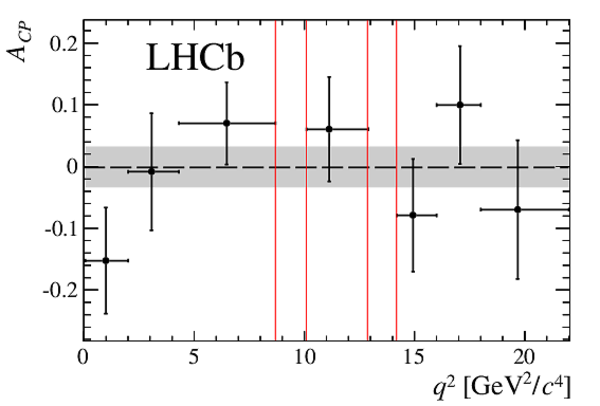
Measured value of $ {\cal A}_{ C P }$ in $ { B ^+ \rightarrow K ^+ \mu ^+\mu ^- }$ decays in bins of the $\mu ^+\mu ^-$ invariant mass squared ( $ q^2$ ). The points are displayed at the mean value of $ q^2$ in each bin. The uncertainties on each $ {\cal A}_{ C P }$ value are the statistical and systematic uncertainties added in quadrature. The excluded charmonium regions are represented by the vertical red lines, the dashed line is the weighted average, and the grey band indicates the 1$\sigma$ uncertainty on the weighted average. |
Fig2.pdf [8 KiB] HiDef png [92 KiB] Thumbnail [93 KiB] *.C file |
|
|
Animated gif made out of all figures. |
PAPER-2013-043.gif Thumbnail |

|
![HiDef png [483 KiB]](Directory_LHCb-PAPER-2013-043/hidef_Fig1.png)
![HiDef png [92 KiB]](Directory_LHCb-PAPER-2013-043/hidef_Fig2.png)
Tables and captions
|
Systematic uncertainties on $ {\cal A}_{ C P }$ from non-cancelling asymmetries arising from kinematic differences between $ { B ^+ \rightarrow { J \mskip -3mu/\mskip -2mu\psi \mskip 2mu} K ^+ }$ and $ { B ^+ \rightarrow K ^+ \mu ^+\mu ^- }$ decays, and fit uncertainties arising from the choice of signal shape, mass fit range and combinatorial background shape, and from the treatment of the asymmetries in the $ { B ^+ \rightarrow \pi ^+ \mu ^+\mu ^- }$ and partially-reconstructed (PR) backgrounds. The total is the sum in quadrature of each component. |
Table_1.pdf [53 KiB] HiDef png [83 KiB] Thumbnail [35 KiB] tex code |

|
|
Values of $ {\cal A}_{ C P }$ and the signal yields in the seven $ q^2$ bins, the weighted average, and their associated uncertainties. |
Table_2.pdf [59 KiB] HiDef png [68 KiB] Thumbnail [30 KiB] tex code |

|
![HiDef png [83 KiB]](Directory_LHCb-PAPER-2013-043/hidef_Table_1.png)
![HiDef png [68 KiB]](Directory_LHCb-PAPER-2013-043/hidef_Table_2.png)
Supplementary Material [file]
| Supplementary material full pdf |
Supple[..].pdf [132 KiB] |
|
|
This ZIP file contains supplemetary material for the publication LHCb-PAPER-2013-043. The files are: Supplementary.pdf : An overview of the extra figures *.pdf, *.png, *.eps : The figures in various formats |
Fig1.pdf [55 KiB] HiDef png [718 KiB] Thumbnail [518 KiB] *C file |

|
|
Fig2.pdf [55 KiB] HiDef png [706 KiB] Thumbnail [509 KiB] *C file |
|
![HiDef png [718 KiB]](Directory_LHCb-PAPER-2013-043/supplementary/hidef_Fig1.png)
![HiDef png [706 KiB]](Directory_LHCb-PAPER-2013-043/supplementary/hidef_Fig2.png)
Created on 27 April 2024.