Information
LHCb-PAPER-2013-049
CERN-PH-EP-2013-181
arXiv:1310.2538 [PDF]
(Submitted on 09 Oct 2013)
JHEP 12 (2013) 90
Inspire 1257745
Tools
Abstract
A search for the doubly charmed baryon Xi_cc^+ in the decay mode Xi_cc^+ -> Lambda_c^+ K^- pi^+ is performed with a data sample, corresponding to an integrated luminosity of 0.65/fb, of pp collisions recorded at a centre-of-mass energy of 7 TeV. No significant signal is found in the mass range 3300-3800 MeV/c^2. Upper limits at the 95 confidence level on the ratio of the Xi_cc^+ production cross-section times branching fraction to that of the Lambda_c^+, R, are given as a function of the Xi_cc^+ mass and lifetime. The largest upper limits range from R < 1.5 x 10^-2 for a lifetime of 100 fs to R < 3.9 x 10^-4 for a lifetime of 400 fs.
Figures and captions
|
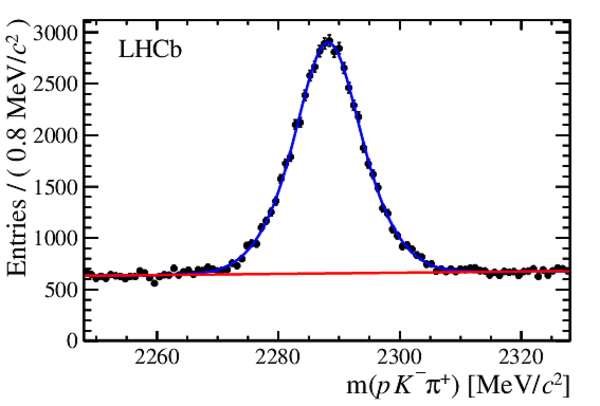
Invariant mass spectrum of $\Lambda _ c ^+ \rightarrow p K ^- \pi ^+ $ candidates for 5$\%$ of the data, with events chosen at random during preselection (due to bandwidth limits for the normalisation mode). The dashed line shows the fitted background contribution, and the solid line the sum of $\Lambda _ c ^+$ signal and background. |
pub-Lc-bw.pdf [25 KiB] HiDef png [117 KiB] Thumbnail [65 KiB] *.C file |

|
|
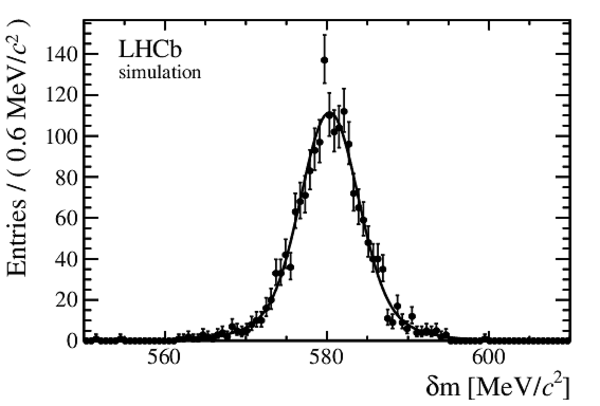
The distribution of the invariant mass difference $\delta m$, defined in Eq. 3, for simulated $\Xi_{ c c }^+$ events with a $\Xi_{ c c }^+$ mass of 3500 $ {\mathrm{ Me V /}c^2}$ . The solid line shows the fitted signal shape. In order to increase the available statistics, the trigger and ANN requirements are not applied in this plot. |
pub-Xi[..].pdf [22 KiB] HiDef png [110 KiB] Thumbnail [61 KiB] *.C file |
|
|
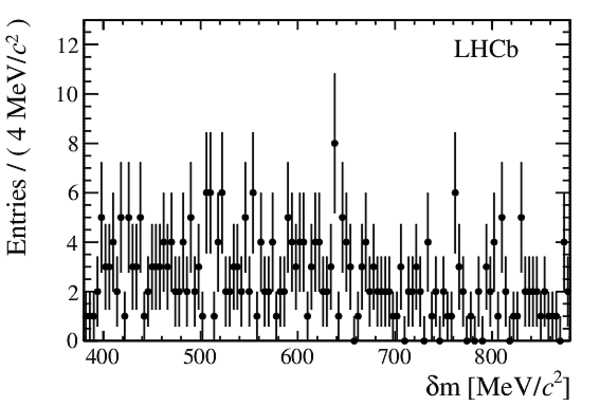
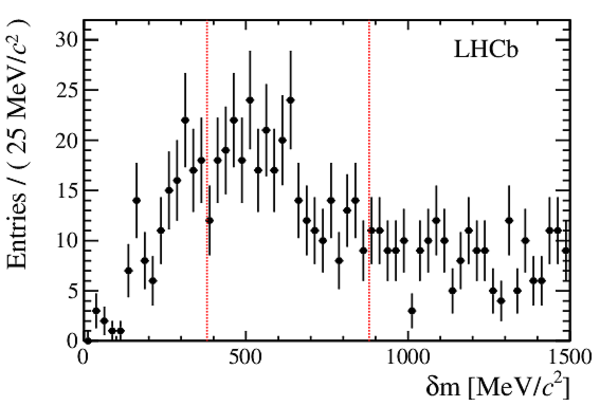
Spectrum of $\delta m$ requiring $2273 < m([ p K ^- \pi ^+ ]_{\Lambda _ c }) < 2303$ $ {\mathrm{ Me V /}c^2}$ . Both plots show the same data sample, but with different $\delta m$ ranges and binnings. The wide signal region is shown in the right plot and indicated by the dotted vertical lines in the left plot. |
pub-sp[..].pdf [17 KiB] HiDef png [113 KiB] Thumbnail [68 KiB] *.C file |

|
|
pub-sp[..].pdf [18 KiB] HiDef png [129 KiB] Thumbnail [80 KiB] *.C file |
|
|
|
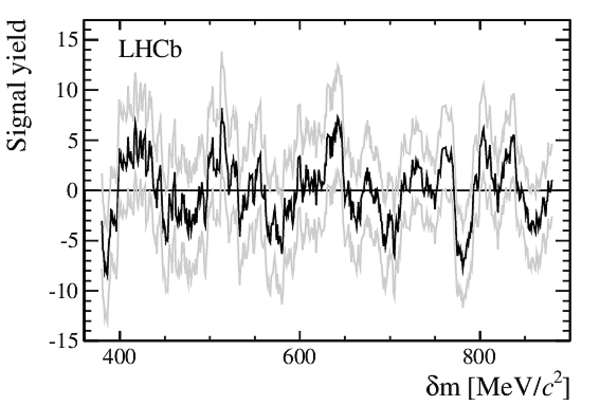
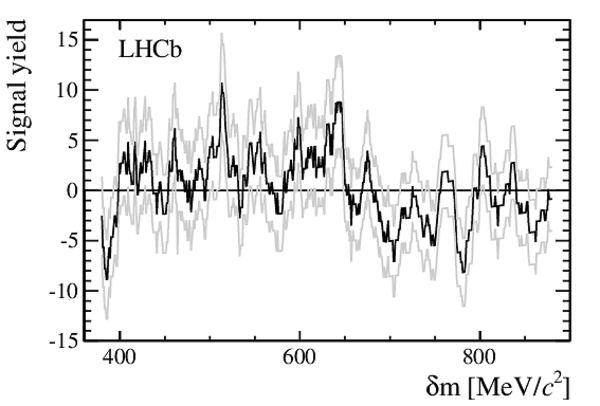
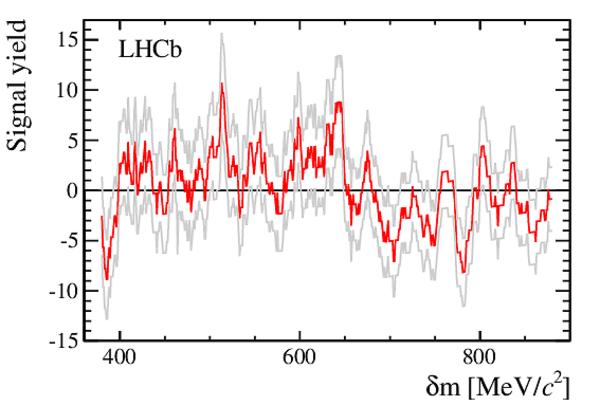
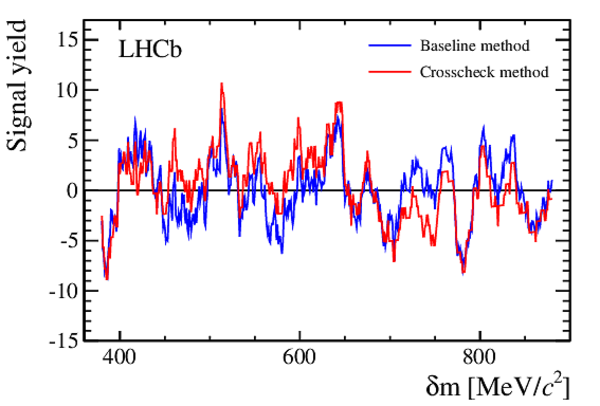
Measured signal yields as a function of $\delta m$. The upper two plots show the estimated signal yield as a dark line and the $\pm 1\sigma$ statistical error bands as light grey lines for (upper left) the baseline method and (upper right) the cross-check method. The central values of the two methods are compared in the lower plot and found to agree well. |
pub-yi[..].pdf [23 KiB] HiDef png [362 KiB] Thumbnail [136 KiB] *.C file |
|
|
pub-yi[..].pdf [23 KiB] HiDef png [317 KiB] Thumbnail [122 KiB] *.C file |
|
|
|
pub-yi[..].pdf [20 KiB] HiDef png [208 KiB] Thumbnail [97 KiB] *.C file |

|
|
|
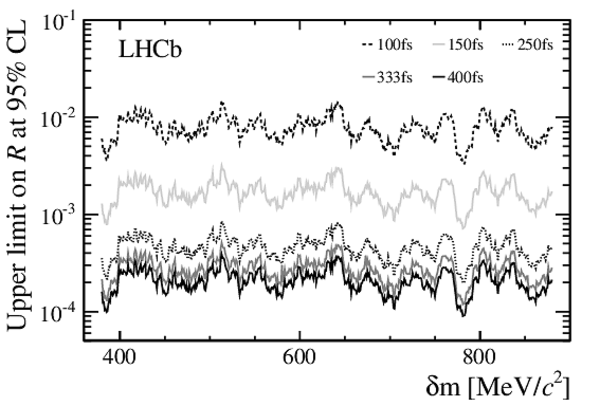
Upper limits on $R$ at the 95% CL as a function of $\delta m$, for five $\Xi_{ c c }^+$ lifetime hypotheses. |
pub-li[..].pdf [29 KiB] HiDef png [281 KiB] Thumbnail [128 KiB] *.C file |
|
|
Mass difference spectrum requiring $2273 < m([ p K ^- \pi ^+ ]_{\Lambda _ c }) < 2303$ $ {\mathrm{ Me V /}c^2}$ . Candidates are also required to be consistent with (left) an intermediate $\Sigma_{ c }(2455)^{++}$, (right) an intermediate $\Sigma_{ c }(2520)^{++}$. |
pub-sp[..].pdf [14 KiB] HiDef png [85 KiB] Thumbnail [53 KiB] *.C file |

|
|
pub-sp[..].pdf [14 KiB] HiDef png [87 KiB] Thumbnail [55 KiB] *.C file |

|
|
|
Animated gif made out of all figures. |
PAPER-2013-049.gif Thumbnail |

|
Tables and captions
|
Systematic uncertainties on the single-event sensitivity $\alpha$. |
Table_1.pdf [24 KiB] HiDef png [132 KiB] Thumbnail [55 KiB] tex code |

|
|
Single-event sensitivity $\alpha$ for different lifetime hypotheses $\tau$, assuming $m(\Xi_{ c c }^+ )=3500$ $ {\mathrm{ Me V /}c^2}$ . The uncertainties quoted include statistical and systematic effects, and are correlated between different lifetime hypotheses. |
Table_2.pdf [40 KiB] HiDef png [123 KiB] Thumbnail [47 KiB] tex code |

|
|
Variation in single-event sensitivity for different mass hypotheses $m(\Xi_{ c c }^+ )$, assuming $\tau=333$ $\rm fs$ . The uncertainties quoted include statistical and systematic effects, and are correlated between different mass hypotheses. The variation is shown separately for all effects other than the efficiency of the $\delta m$ window ($\alpha_u$), for the correction due to the mass-dependent resolution, and for the combination ($\alpha$). |
Table_3.pdf [51 KiB] HiDef png [47 KiB] Thumbnail [22 KiB] tex code |

|
|
Expected value of the signal yield $N_{\text{sig}}$ for different values of $R$ and lifetime hypotheses, assuming $m(\Xi_{ c c }^+ )=3500$ $ {\mathrm{ Me V /}c^2}$ . The uncertainties quoted are due to the systematic uncertainty on $\alpha$. |
Table_4.pdf [41 KiB] HiDef png [72 KiB] Thumbnail [35 KiB] tex code |

|
|
Largest values of the upper limits (UL) on $R$ at the 95% CL in blocks of $\delta m$ for a range of lifetime hypotheses, given in units of $10^{-3}$. The largest values across the entire 500 $ {\mathrm{ Me V /}c^2}$ range are also shown. |
Table_5.pdf [38 KiB] HiDef png [121 KiB] Thumbnail [57 KiB] tex code |

|
Supplementary Material [file]


![HiDef png [117 KiB]](Directory_LHCb-PAPER-2013-049/hidef_pub-Lc-bw.png)
![HiDef png [110 KiB]](Directory_LHCb-PAPER-2013-049/hidef_pub-Xicc-MC-bw.png)
![HiDef png [113 KiB]](Directory_LHCb-PAPER-2013-049/hidef_pub-spectrumWide-bw.png)
![HiDef png [129 KiB]](Directory_LHCb-PAPER-2013-049/hidef_pub-spectrumZoom-bw.png)
![HiDef png [362 KiB]](Directory_LHCb-PAPER-2013-049/hidef_pub-yields-Tiles-bw.png)
![HiDef png [317 KiB]](Directory_LHCb-PAPER-2013-049/hidef_pub-yields-Landau-bw.png)
![HiDef png [208 KiB]](Directory_LHCb-PAPER-2013-049/hidef_pub-yields-both-bw.png)
![HiDef png [281 KiB]](Directory_LHCb-PAPER-2013-049/hidef_pub-limits-Tiles-bw.png)
![HiDef png [85 KiB]](Directory_LHCb-PAPER-2013-049/hidef_pub-spectrumSc2455-bw.png)
![HiDef png [87 KiB]](Directory_LHCb-PAPER-2013-049/hidef_pub-spectrumSc2520-bw.png)
![HiDef png [132 KiB]](Directory_LHCb-PAPER-2013-049/hidef_Table_1.png)
![HiDef png [123 KiB]](Directory_LHCb-PAPER-2013-049/hidef_Table_2.png)
![HiDef png [47 KiB]](Directory_LHCb-PAPER-2013-049/hidef_Table_3.png)
![HiDef png [72 KiB]](Directory_LHCb-PAPER-2013-049/hidef_Table_4.png)
![HiDef png [121 KiB]](Directory_LHCb-PAPER-2013-049/hidef_Table_5.png)
![HiDef png [169 KiB]](Directory_LHCb-PAPER-2013-049/supplementary/hidef_Fig1.png)
![HiDef png [161 KiB]](Directory_LHCb-PAPER-2013-049/supplementary/hidef_Fig2.png)
![HiDef png [156 KiB]](Directory_LHCb-PAPER-2013-049/supplementary/hidef_Fig3a.png)
![HiDef png [522 KiB]](Directory_LHCb-PAPER-2013-049/supplementary/hidef_Fig4a.png)
![HiDef png [456 KiB]](Directory_LHCb-PAPER-2013-049/supplementary/hidef_Fig4b.png)
![HiDef png [353 KiB]](Directory_LHCb-PAPER-2013-049/supplementary/hidef_Fig4c.png)
![HiDef png [463 KiB]](Directory_LHCb-PAPER-2013-049/supplementary/hidef_Fig5.png)
Created on 27 April 2024.