Information
LHCb-PAPER-2014-021
CERN-PH-EP-2014-107
arXiv:1405.7223 [PDF]
(Submitted on 28 May 2014)
Phys. Rev. Lett. 113 (2014) 032001
Inspire 1298392
Tools
Abstract
Using a proton-proton collision data sample corresponding to an integrated luminosity of 3 fb$^{-1}$ collected by LHCb at center-of-mass energies of 7 and 8 TeV, about 3800 $\Xi_b^0\to\Xi_c^+\pi^-$, $\Xi_c^+\to pK^-\pi^+$ signal decays are reconstructed. From this sample, the first measurement of the $\Xi_b^0$ baryon lifetime is made, relative to that of the $\Lambda_b^0$ baryon. The mass differences $M(\Xi_b^0)-M(\Lambda_b^0)$ and $M(\Xi_c^+)-M(\Lambda_c^+)$ are also measured with precision more than four times better than the current world averages. The resulting values are $\frac{\tau_{\Xi_b^0}}{\tau_{\Lambda_b^0}} = 1.006\pm0.018\pm0.010$, $M(\Xi_b^0) - M(\Lambda_b^0) = 172.44\pm0.39\pm0.17 MeV/c^2$, $M(\Xi_c^+) - M(\Lambda_c^+) = 181.51\pm0.14\pm0.10 MeV/c^2$, where the first uncertainty is statistical and the second is systematic. The relative rate of $\Xi_b^0$ to $\Lambda_b^0$ baryon production is measured to be $\frac{f_{\Xi_b^0}}{f_{\Lambda_b^0}}\frac{{\cal{B}}(\Xi_b^0\to\Xi_c^+\pi^-)}{{\cal{B}}(\Lambda_b^0\to\Lambda_c^+\pi^-)}\frac{{\cal{B}}(\Xi_c^+\to pK^-\pi^+)}{{\cal{B}}(\Lambda_c^+\to pK^-\pi^+)} = (1.88\pm0.04\pm0.03)\times10^{-2}$, where the first factor is the ratio of fragmentation fractions, $b\to\Xi_b^0$ relative to $b\to\Lambda_b^0$. Relative production rates as functions of transverse momentum and pseudorapidity are also presented.
Figures and captions
|
Invariant mass spectrum for (left) $\Lambda ^0_ b \rightarrow \Lambda ^+_ c \pi ^- $ and (right) $\Xi ^0_ b \rightarrow \Xi^+_ c \pi ^- $ candidates along with the projections of the fit. |
Lb2LcP[..].pdf [22 KiB] HiDef png [306 KiB] Thumbnail [237 KiB] *.C file |

|
|
Xib2Xi[..].pdf [30 KiB] HiDef png [308 KiB] Thumbnail [224 KiB] *.C file |

|
|
|
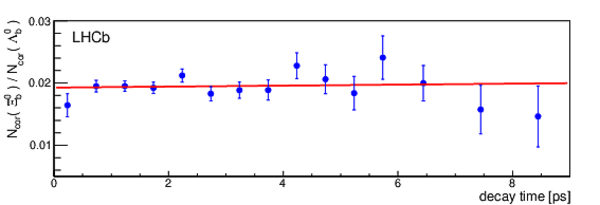
Efficiency-corrected yield ratio of $\Xi ^0_ b \rightarrow \Xi^+_ c \pi ^- $ relative to $\Lambda ^0_ b \rightarrow \Lambda ^+_ c \pi ^- $ decays in bins of decay time. A fit using an exponential function is shown. The uncertainties are statistical only. |
CorrYi[..].pdf [14 KiB] HiDef png [61 KiB] Thumbnail [46 KiB] *.C file |
|
|
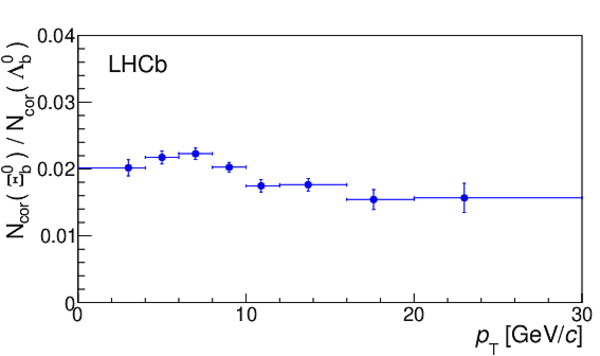
Efficiency-corrected yield ratio of $\Xi ^0_ b \rightarrow \Xi^+_ c \pi ^- $ relative to $\Lambda ^0_ b \rightarrow \Lambda ^+_ c \pi ^- $ decays as functions of (left) $p_{\rm T}$ and (right) pseudorapidity, $\eta$. The points are positioned along the horizontal axis at the weighted average value within each bin. The uncertainties are statistical only. |
Xb_ptRatio.pdf [13 KiB] HiDef png [78 KiB] Thumbnail [67 KiB] *.C file |
|
|
Xb_eta[..].pdf [13 KiB] HiDef png [77 KiB] Thumbnail [69 KiB] *.C file |

|
|
|
Distributions of the $p K ^- \pi ^+ $ invariant mass for (left) $\Lambda ^+_ c $ and (right) $\Xi^+_ c $ candidates along with the projections of the fit. |
Lb2LcP[..].pdf [29 KiB] HiDef png [206 KiB] Thumbnail [166 KiB] *.C file |

|
|
Xib2Xi[..].pdf [30 KiB] HiDef png [290 KiB] Thumbnail [217 KiB] *.C file |

|
|
|
Animated gif made out of all figures. |
PAPER-2014-021.gif Thumbnail |

|
![HiDef png [306 KiB]](Directory_LHCb-PAPER-2014-021/hidef_Lb2LcPi_def_Y0_05012014.png)
![HiDef png [308 KiB]](Directory_LHCb-PAPER-2014-021/hidef_Xib2XicPi_def_Y0_05012014.png)
![HiDef png [61 KiB]](Directory_LHCb-PAPER-2014-021/hidef_CorrYieldRatio_XibOverLb_smallerPtBins.png)
![HiDef png [78 KiB]](Directory_LHCb-PAPER-2014-021/hidef_Xb_ptRatio.png)
![HiDef png [77 KiB]](Directory_LHCb-PAPER-2014-021/hidef_Xb_etaRatio.png)
![HiDef png [206 KiB]](Directory_LHCb-PAPER-2014-021/hidef_Lb2LcPi_LcMass.png)
![HiDef png [290 KiB]](Directory_LHCb-PAPER-2014-021/hidef_Xib2XicPi_XicMass.png)
Tables and captions
|
Summary of systematic uncertainties on the reported measurements. Below, PR represents the relative uncertainty on the production ratio measurement. |
Table_1.pdf [64 KiB] HiDef png [70 KiB] Thumbnail [32 KiB] tex code |

|
![HiDef png [70 KiB]](Directory_LHCb-PAPER-2014-021/hidef_Table_1.png)
Supplementary Material [file]
| Supplementary material full pdf |
supple[..].pdf [85 KiB] |
|
|
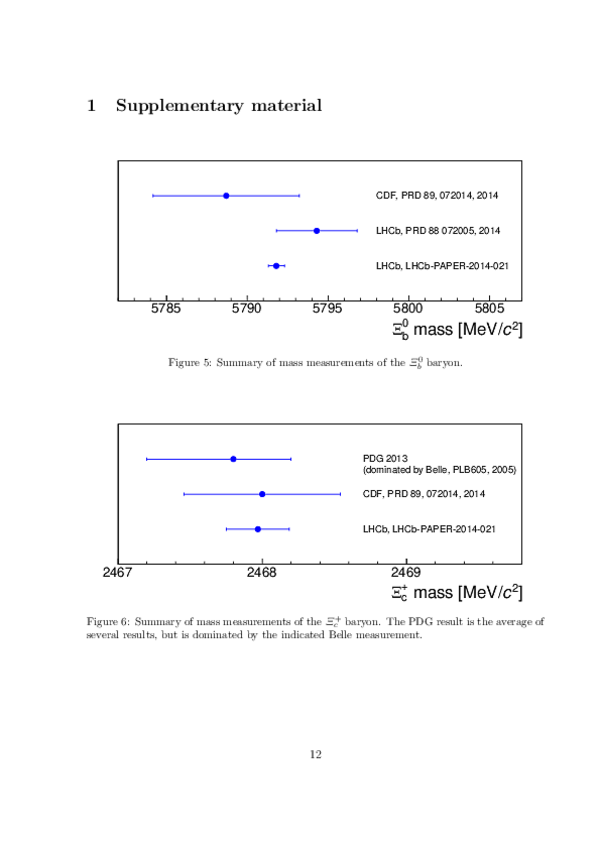
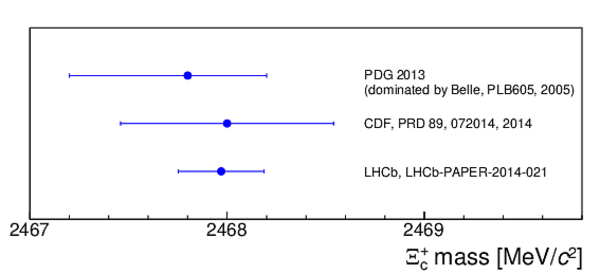
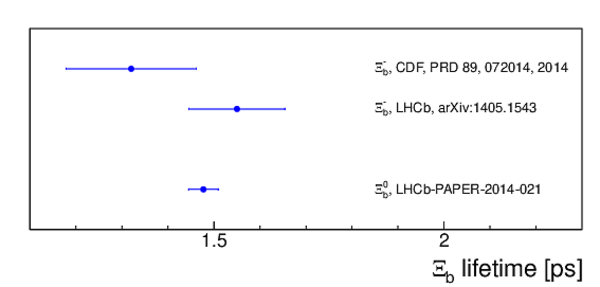
These 3 figures compare recent masses and lifetimes to those measured in this paper. |
Fig5.pdf [13 KiB] HiDef png [85 KiB] Thumbnail [73 KiB] *C file |

|
|
Fig6.pdf [12 KiB] HiDef png [83 KiB] Thumbnail [70 KiB] *C file |
|
|
|
Fig7.pdf [13 KiB] HiDef png [63 KiB] Thumbnail [52 KiB] *C file |
|
![HiDef png [85 KiB]](Directory_LHCb-PAPER-2014-021/supplementary/hidef_Fig5.png)
![HiDef png [83 KiB]](Directory_LHCb-PAPER-2014-021/supplementary/hidef_Fig6.png)
![HiDef png [63 KiB]](Directory_LHCb-PAPER-2014-021/supplementary/hidef_Fig7.png)
Created on 02 May 2024.