Information
LHCb-PAPER-2014-026
CERN-PH-EP-2014-150
arXiv:1407.2222 [PDF]
(Submitted on 08 Jul 2014)
Phys. Rev. D90 (2014) 052011
Inspire 1305288
Tools
Abstract
A measurement of the decay time dependent CP-violating asymmetry in $B_s^0 \to \phi\phi$ decays is presented, along with measurements of the $T$-odd triple-product asymmetries. In this decay channel, the CP-violating weak phase arises from the interference between $B_s^0$-$\bar{B}_s^0$ mixing and the loop-induced decay amplitude. Using a sample of proton-proton collision data corresponding to an integrated luminosity of $3.0 fb^{-1}$ collected with the LHCb detector, a signal yield of approximately 4000 $B_s^0 \to \phi\phi$ decays is obtained. The CP-violating phase is measured to be ${\phi_s =-0.17\pm0.15\mathrm{ (stat)}\pm0.03\mathrm{ (syst)}}$ rad. The triple-product asymmetries are measured to be ${A_U=-0.003\pm0.017\mathrm{ (stat)}\pm0.006\mathrm{ (syst)}}$ and ${A_V=-0.017\pm0.017\mathrm{ (stat)}\pm0.006\mathrm{ (syst)}}$. Results are consistent with the hypothesis of CP conservation.
Figures and captions
|
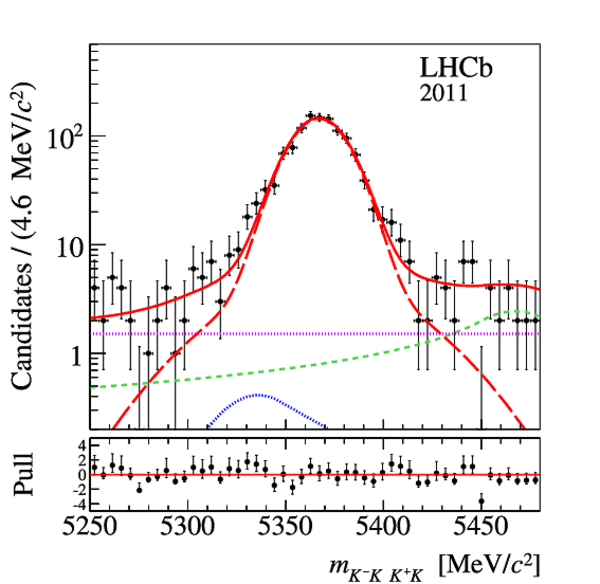
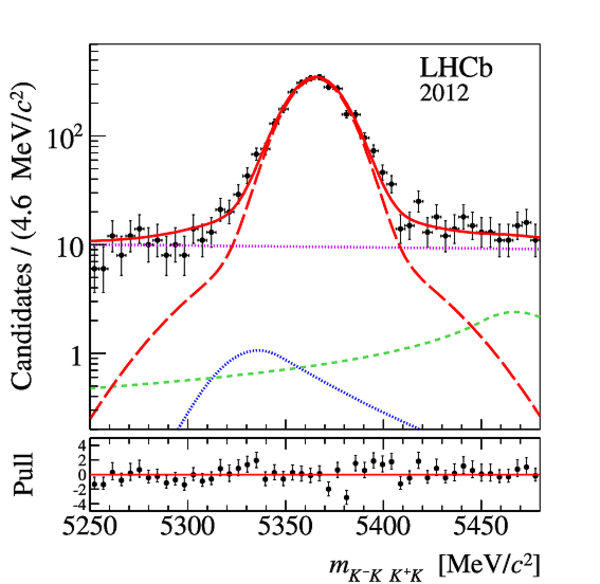
Four-kaon invariant mass distributions for the (left) 2011 and (right) 2012 datasets. The data points are represented by the black markers. Superimposed are the results of the total fit (red solid line), the $ B ^0_ s \to \phi\phi$ (red long dashed), the $ B ^0 \to\phi K ^{*0} $ (blue dotted), the $\Lambda ^0_ b \to\phi p K ^- $ (green short-dashed), and the combinatoric (purple dotted) fit components. |
phiphi[..].pdf [30 KiB] HiDef png [311 KiB] Thumbnail [244 KiB] *.C file |
|
|
phiphi[..].pdf [30 KiB] HiDef png [316 KiB] Thumbnail [254 KiB] *.C file |
|
|
|
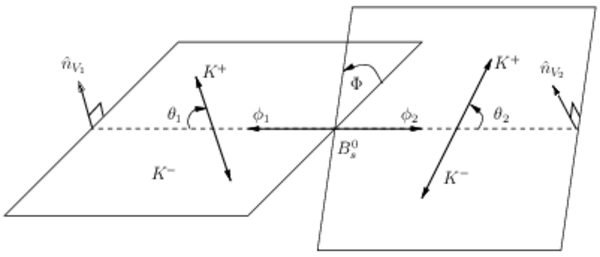
Decay angles for the $ B ^0_ s \rightarrow \phi \phi$ decay, where the $K^+$ momentum in the $\phi_{1,2}$ rest frame and the parent $\phi_{1,2}$ momentum in the rest frame of the $ B ^0_ s $ meson span the two $\phi$ meson decay planes, $\theta_{1,2}$ is the angle between the $K^+$ track momentum in the $\phi_{1,2}$ meson rest frame and the parent $\phi_{1,2}$ momentum in the $ B ^0_ s $ rest frame, $\Phi$ is the angle between the two $\phi$ meson decay planes and $\hat{n}_{V_{1,2}}$ is the unit vector normal to the decay plane of the $\phi_{1,2}$ meson. |
angle_[..].pdf [299 KiB] HiDef png [62 KiB] Thumbnail [39 KiB] *.C file |
|
|
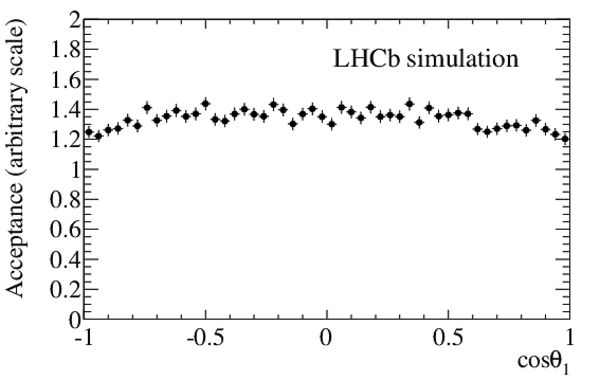
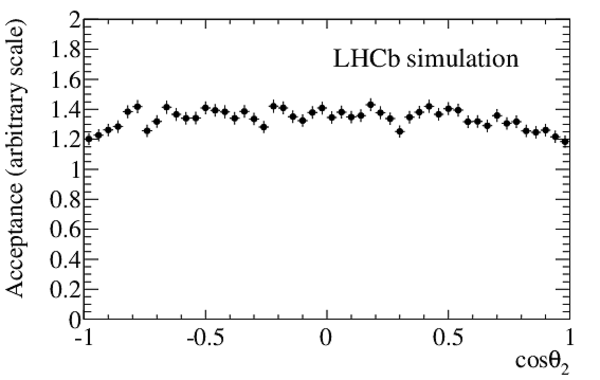
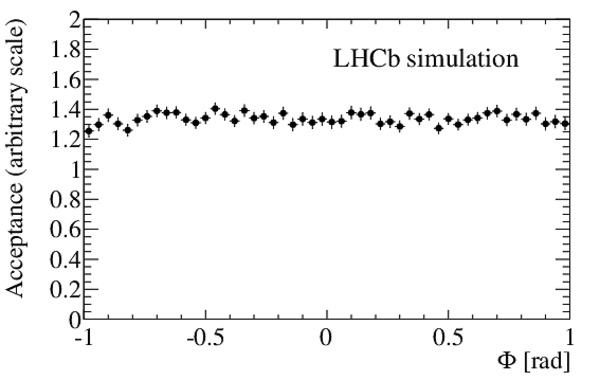
Angular acceptance found from simulated $ B ^0_ s \to \phi\phi$ events (top-left) integrated over $\cos\theta_2$ and $\Phi$ as a function of $\cos\theta_1$, (top-right) integrated over $\cos\theta_1$ and $\Phi$ as a function of $\cos\theta_2$, and (bottom) integrated over $\cos\theta_1$ and $\cos\theta_2$ as a function of $\Phi$. |
accep_ct1.pdf [17 KiB] HiDef png [98 KiB] Thumbnail [55 KiB] *.C file |
|
|
accep_ct2.pdf [17 KiB] HiDef png [98 KiB] Thumbnail [55 KiB] *.C file |
|
|
|
accep_Phi.pdf [17 KiB] HiDef png [98 KiB] Thumbnail [55 KiB] *.C file |
|
|
|
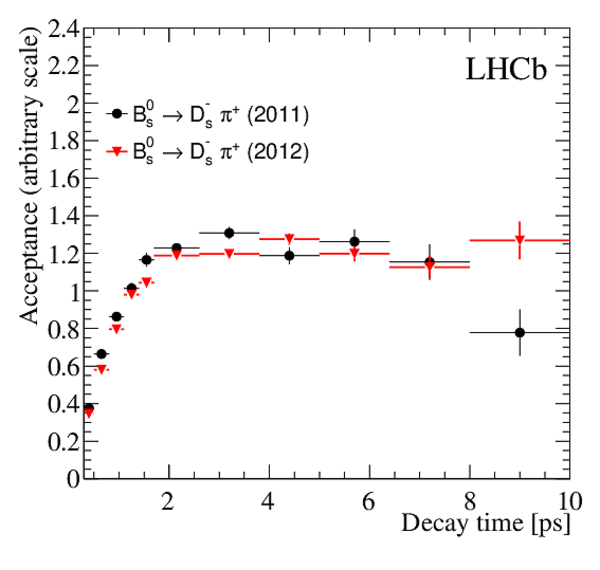
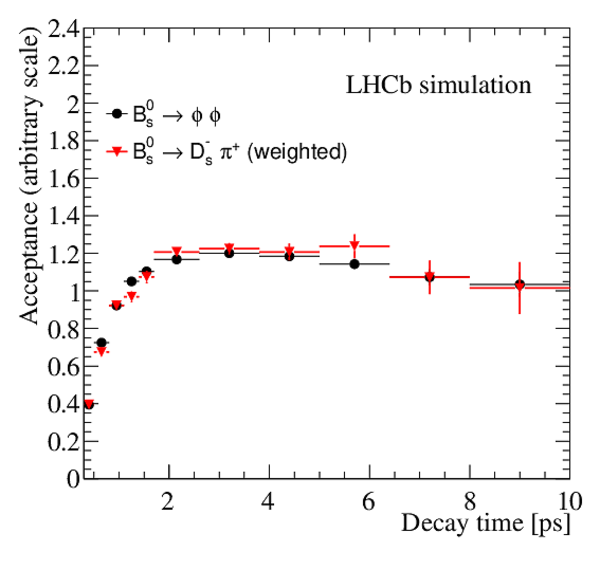
Decay time acceptance (left) calculated using $ B ^0_ s \to D ^-_ s \pi ^+ $ data events, and (right) comparing $ B ^0_ s \to \phi\phi$ and $ B ^0_ s \to D ^-_ s \pi ^+ $ simulation, where $ B ^0_ s \to D ^-_ s \pi ^+ $ events are re-weighted to match the distribution of the minimum $p_{\rm T}$ of the final state particles in $ B ^0_ s \to \phi\phi$ decays. |
TimeAc[..].pdf [15 KiB] HiDef png [159 KiB] Thumbnail [155 KiB] *.C file |
|
|
TimeAcc-MC.pdf [15 KiB] HiDef png [164 KiB] Thumbnail [158 KiB] *.C file |
|
|
|
One-dimensional projections of the $ B ^0_ s \to \phi\phi$ fit for (top-left) decay time with binned acceptance, (top-right) helicity angle $\Phi$ and (bottom-left and bottom-right) cosine of the helicity angles $\theta_1$ and $\theta_2$. The background-subtracted data are marked as black points, while the black solid lines represent the projections of the best fit. The $ C P$ -even $P$-wave, the $ C P$ -odd $P$-wave and $S$-wave combined with double $S$-wave components are shown by the red long dashed, green short dashed and blue dotted lines, respectively. |
Proj_time.pdf [27 KiB] HiDef png [221 KiB] Thumbnail [182 KiB] *.C file |

|
|
Proj_Phi.pdf [19 KiB] HiDef png [211 KiB] Thumbnail [180 KiB] *.C file |

|
|
|
Proj_ct1.pdf [18 KiB] HiDef png [194 KiB] Thumbnail [169 KiB] *.C file |

|
|
|
Proj_ct2.pdf [18 KiB] HiDef png [195 KiB] Thumbnail [170 KiB] *.C file |

|
|
|
Profile log-likelihood for the $\phi_s$ parameter. |
phis_L[..].pdf [14 KiB] HiDef png [84 KiB] Thumbnail [45 KiB] *.C file |

|
|
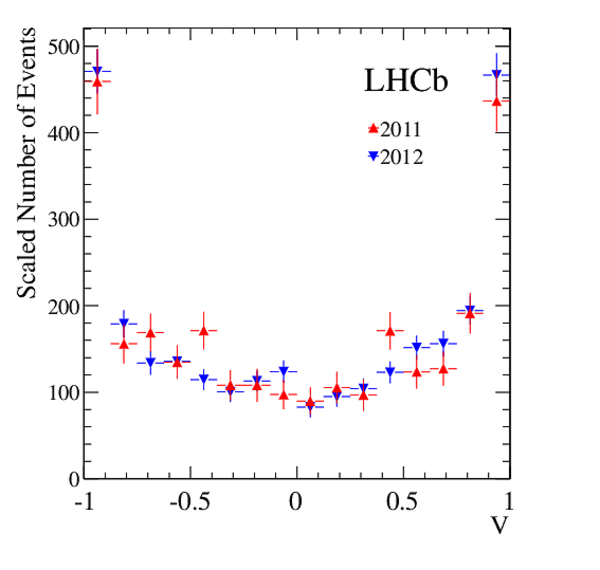
Background-subtracted distributions of the (left) $U$ and (right) $V$ observables for the 2011 and 2012 datasets and restricted to the mass range $5246.8<m_{ K ^+ K ^- K ^+ K ^- }<5486.8 {\mathrm{ Me V /}c^2} $. The 2011 distributions are scaled to have the same area as the 2012 distributions. |
U_sw.pdf [15 KiB] HiDef png [140 KiB] Thumbnail [122 KiB] *.C file |

|
|
V_sw.pdf [15 KiB] HiDef png [136 KiB] Thumbnail [118 KiB] *.C file |
|
|
|
Animated gif made out of all figures. |
PAPER-2014-026.gif Thumbnail |

|
![HiDef png [311 KiB]](Directory_LHCb-PAPER-2014-026/hidef_phiphi_DATA11.png)
![HiDef png [316 KiB]](Directory_LHCb-PAPER-2014-026/hidef_phiphi_DATA12.png)
![HiDef png [62 KiB]](Directory_LHCb-PAPER-2014-026/hidef_angle_fig_annotations.png)
![HiDef png [98 KiB]](Directory_LHCb-PAPER-2014-026/hidef_accep_ct1.png)
![HiDef png [98 KiB]](Directory_LHCb-PAPER-2014-026/hidef_accep_ct2.png)
![HiDef png [98 KiB]](Directory_LHCb-PAPER-2014-026/hidef_accep_Phi.png)
![HiDef png [159 KiB]](Directory_LHCb-PAPER-2014-026/hidef_TimeAcc-Data.png)
![HiDef png [164 KiB]](Directory_LHCb-PAPER-2014-026/hidef_TimeAcc-MC.png)
![HiDef png [221 KiB]](Directory_LHCb-PAPER-2014-026/hidef_Proj_time.png)
![HiDef png [211 KiB]](Directory_LHCb-PAPER-2014-026/hidef_Proj_Phi.png)
![HiDef png [194 KiB]](Directory_LHCb-PAPER-2014-026/hidef_Proj_ct1.png)
![HiDef png [195 KiB]](Directory_LHCb-PAPER-2014-026/hidef_Proj_ct2.png)
![HiDef png [84 KiB]](Directory_LHCb-PAPER-2014-026/hidef_phis_LL_PRLstyle.png)
![HiDef png [140 KiB]](Directory_LHCb-PAPER-2014-026/hidef_U_sw.png)
![HiDef png [136 KiB]](Directory_LHCb-PAPER-2014-026/hidef_V_sw.png)
Tables and captions
|
Coefficients of the time dependent terms and angular functions used in Eq. 2. Amplitudes are defined at $t=0$. |
Table_1.pdf [54 KiB] HiDef png [123 KiB] Thumbnail [55 KiB] tex code |

|
|
Tagging efficiency ($\epsilon_{\rm tag}$), effective dilution ($\mathcal{D}$), and tagging power ($\epsilon \mathcal{D}^2$), as estimated from the data for events tagged containing information from OS algorithms only, SSK algorithms only, and information from both algorithms. Quoted uncertainties include both statistical and systematic contributions. |
Table_2.pdf [37 KiB] HiDef png [98 KiB] Thumbnail [49 KiB] tex code |

|
|
Results of the decay time dependent fit. |
Table_3.pdf [52 KiB] HiDef png [170 KiB] Thumbnail [75 KiB] tex code |

|
|
$S$-wave and double $S$-wave results of the decay time dependent fit for the three regions identified in Sec. 8.1, where $M_{--}$ indicates the region with both two-kaon invariant masses smaller than the known $\phi$ mass, $M_{-+}$ the region with one smaller and one larger, and $M_{++}$ indicates the region with both two-kaon invariant masses larger than the known $\phi$ mass. |
Table_4.pdf [50 KiB] HiDef png [45 KiB] Thumbnail [22 KiB] tex code |

|
|
Correlation matrix associated with the result of the decay time dependent fit. Correlations with a magnitude greater than 0.5 are shown in bold. |
Table_5.pdf [54 KiB] HiDef png [48 KiB] Thumbnail [22 KiB] tex code |

|
|
Summary of systematic uncertainties for physics parameters in the decay time dependent measurement, where AA denotes angular acceptance. |
Table_6.pdf [53 KiB] HiDef png [60 KiB] Thumbnail [27 KiB] tex code |

|
|
{} Systematic uncertainties on the triple-product asymmetries $A_U$ and $A_V$. The total uncertainty is the sum in quadrature of the larger of the two components for each source. |
Table_7.pdf [31 KiB] HiDef png [73 KiB] Thumbnail [31 KiB] tex code |

|
![HiDef png [123 KiB]](Directory_LHCb-PAPER-2014-026/hidef_Table_1.png)
![HiDef png [98 KiB]](Directory_LHCb-PAPER-2014-026/hidef_Table_2.png)
![HiDef png [170 KiB]](Directory_LHCb-PAPER-2014-026/hidef_Table_3.png)
![HiDef png [45 KiB]](Directory_LHCb-PAPER-2014-026/hidef_Table_4.png)
![HiDef png [48 KiB]](Directory_LHCb-PAPER-2014-026/hidef_Table_5.png)
![HiDef png [60 KiB]](Directory_LHCb-PAPER-2014-026/hidef_Table_6.png)
![HiDef png [73 KiB]](Directory_LHCb-PAPER-2014-026/hidef_Table_7.png)
Created on 27 April 2024.