Observation of $B^0_s \to K^{*\pm}K^\mp$ and evidence for $B^0_s \to K^{*-}\pi^+$ decays
[to restricted-access page]Information
LHCb-PAPER-2014-043
CERN-PH-EP-2014-185
arXiv:1407.7704 [PDF]
(Submitted on 29 Jul 2014)
New J. Phys. 16 (2014) 123001
Inspire 1308736
Tools
Abstract
Measurements of the branching fractions of $B^0_s \to K^{*\pm}K^\mp$ and $B^0_s \to K^{*\pm}\pi^\mp$ decays are performed using a data sample corresponding to $1.0 \ {\rm fb}^{-1}$ of proton-proton collision data collected with the LHCb detector at a centre-of-mass energy of $7\mathrm{ TeV}$, where the $K^{*\pm}$ mesons are reconstructed in the $K^0_{\rm S}\pi^\pm$ final state. The first observation of the $B^0_s \to K^{*\pm}K^\mp$ decay and the first evidence for the $B^0_s \to K^{*-}\pi^+$ decay are reported with branching fractions \begin{eqnarray} {\cal B}(B^0_s \to K^{*\pm}K^\mp) & = & (12.7\pm1.9\pm1.9) \times 10^{-6}, \\ {\cal B}(B^0_s \to K^{*-}\pi^+) & = & (3.3\pm1.1\pm0.5) \times 10^{-6}, \end{eqnarray} where the first uncertainties are statistical and the second are systematic. In addition, an upper limit of ${\cal B}(B^0 \to K^{*\pm}K^\mp) < 0.4 \ (0.5) \times 10^{-6}$ is set at $90 % \ (95 %)$ confidence level.
Figures and captions
|
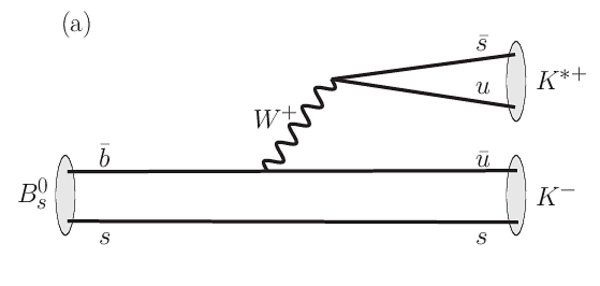
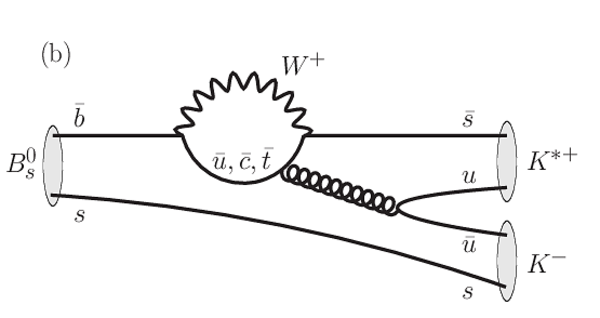
(a) Tree and (b) loop diagrams for the decay $ B ^0_ s \rightarrow K ^{*+} K ^- $ . |
Feynma[..].pdf [8 KiB] HiDef png [129 KiB] Thumbnail [67 KiB] *.C file |
|
|
Feynma[..].pdf [9 KiB] HiDef png [221 KiB] Thumbnail [113 KiB] *.C file |
|
|
|
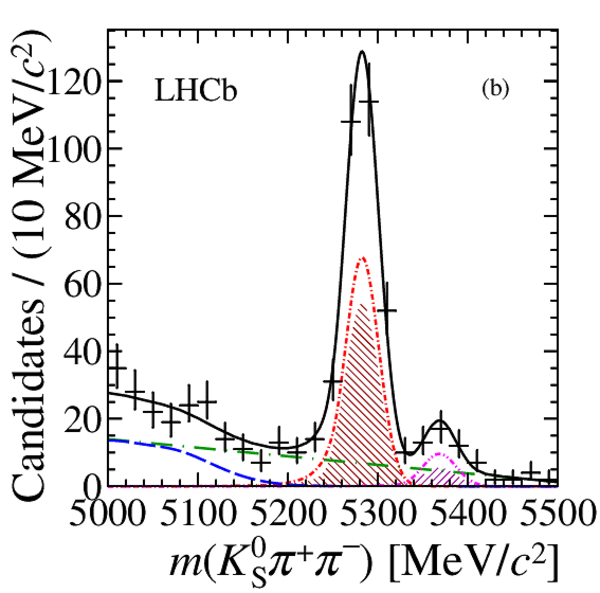
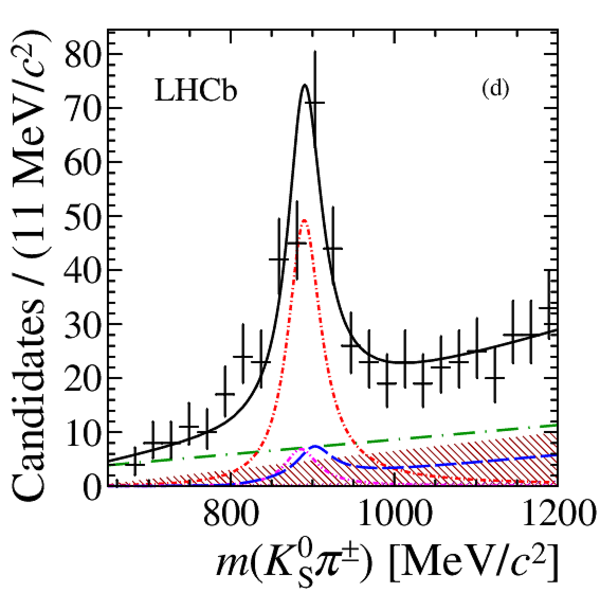
Results of the fit to $ K ^{*\pm} K ^\mp $ candidates projected onto (a,b) $ B $ candidate and (c,d) $ K ^*$ candidate mass distributions, for (a,c) long and (b,d) downstream candidates. The total fit result (solid black line) is shown together with the data points. Components for the $ B ^0$ (pink dash double-dotted line) and $ B ^0_ s $ (red dash dotted line) signals are shown together with the $ B ^0_ s $ nonresonant component (dark red falling-hatched area), charmless partially reconstructed and cross-feed background (blue long-dashed line), and combinatorial background (green long-dash dotted line) components. The $ B ^+ \rightarrow \overline{ D }{} {}^0 h ^+ $ background component has a negative yield (consistent with zero) and so is not directly visible but causes the total PDF to go below the level of the combinatorial background on the left of the $ B $ candidate mass spectrum. |
fitted[..].pdf [20 KiB] HiDef png [342 KiB] Thumbnail [283 KiB] *.C file |

|
|
fitted[..].pdf [20 KiB] HiDef png [357 KiB] Thumbnail [295 KiB] *.C file |

|
|
|
fitted[..].pdf [19 KiB] HiDef png [287 KiB] Thumbnail [239 KiB] *.C file |
|
|
|
fitted[..].pdf [20 KiB] HiDef png [334 KiB] Thumbnail [261 KiB] *.C file |

|
|
|
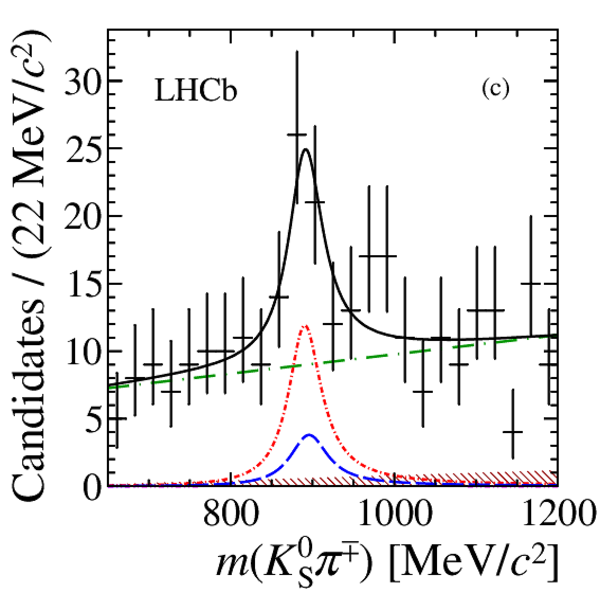
Results of the fit to $ K ^{*\pm} \pi ^\mp $ candidates projected onto (a,b) $ B $ candidate and (c,d) $ K ^*$ candidate mass distributions, for (a,c) long and (b,d) downstream candidates. The total fit result (black solid line) is shown together with the data points. Components for the $ B ^0$ (red dash dotted line) and $ B ^0_ s $ (pink dash double-dotted line) signals are shown together with $ B ^0$ (dark red falling-hatched area) and $ B ^0_ s $ (purple rising-hatched area) nonresonant components, partially reconstructed and cross-feed background (blue long-dashed line), and combinatorial background (green long-dash-dotted line) components. |
fitted[..].pdf [21 KiB] HiDef png [370 KiB] Thumbnail [305 KiB] *.C file |

|
|
fitted[..].pdf [20 KiB] HiDef png [378 KiB] Thumbnail [304 KiB] *.C file |
|
|
|
fitted[..].pdf [20 KiB] HiDef png [352 KiB] Thumbnail [266 KiB] *.C file |

|
|
|
fitted[..].pdf [20 KiB] HiDef png [397 KiB] Thumbnail [297 KiB] *.C file |
|
|
|
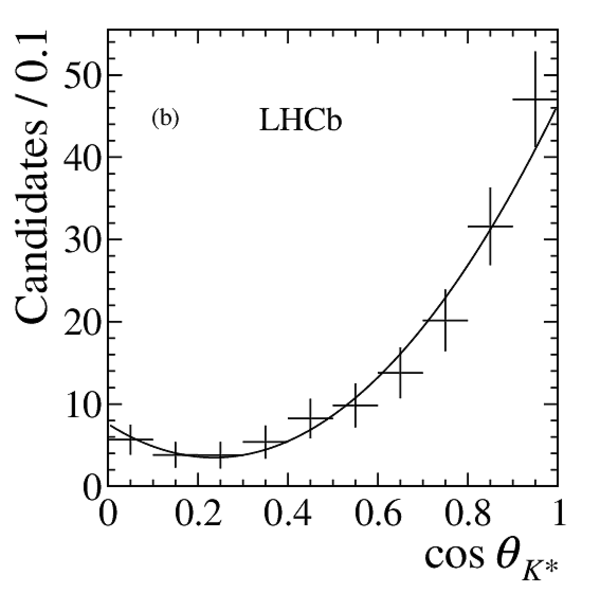
Background-subtracted distribution of $\cos{\theta_{ K ^* }}$ for (a,b) $ B ^0 \rightarrow K ^{*+} \pi ^- $ and (c,d) $ B ^0_ s \rightarrow K ^{*\pm} K ^\mp $ signals from the samples with (a,c) long and (b,d) downstream candidates. Results of fits with second-order polynomial functions are shown as the solid lines. |
data_B[..].pdf [15 KiB] HiDef png [116 KiB] Thumbnail [62 KiB] *.C file |

|
|
data_B[..].pdf [15 KiB] HiDef png [116 KiB] Thumbnail [61 KiB] *.C file |
|
|
|
data_B[..].pdf [14 KiB] HiDef png [115 KiB] Thumbnail [61 KiB] *.C file |

|
|
|
data_B[..].pdf [14 KiB] HiDef png [114 KiB] Thumbnail [60 KiB] *.C file |

|
|
|
Animated gif made out of all figures. |
PAPER-2014-043.gif Thumbnail |

|
![HiDef png [129 KiB]](Directory_LHCb-PAPER-2014-043/hidef_Feynman-Bs2KstK-Tree.png)
![HiDef png [221 KiB]](Directory_LHCb-PAPER-2014-043/hidef_Feynman-Bs2KstK.png)
![HiDef png [342 KiB]](Directory_LHCb-PAPER-2014-043/hidef_fitted_KstK_Model_LL_B_M.png)
![HiDef png [357 KiB]](Directory_LHCb-PAPER-2014-043/hidef_fitted_KstK_Model_DD_B_M.png)
![HiDef png [287 KiB]](Directory_LHCb-PAPER-2014-043/hidef_fitted_KstK_Model_LL_Kst_M.png)
![HiDef png [334 KiB]](Directory_LHCb-PAPER-2014-043/hidef_fitted_KstK_Model_DD_Kst_M.png)
![HiDef png [370 KiB]](Directory_LHCb-PAPER-2014-043/hidef_fitted_Kstpi_Model_LL_B_M.png)
![HiDef png [378 KiB]](Directory_LHCb-PAPER-2014-043/hidef_fitted_Kstpi_Model_DD_B_M.png)
![HiDef png [352 KiB]](Directory_LHCb-PAPER-2014-043/hidef_fitted_Kstpi_Model_LL_Kst_M.png)
![HiDef png [397 KiB]](Directory_LHCb-PAPER-2014-043/hidef_fitted_Kstpi_Model_DD_Kst_M.png)
![HiDef png [116 KiB]](Directory_LHCb-PAPER-2014-043/hidef_data_Bd2Kstpi_theta_LL.png)
![HiDef png [116 KiB]](Directory_LHCb-PAPER-2014-043/hidef_data_Bd2Kstpi_theta_DD.png)
![HiDef png [115 KiB]](Directory_LHCb-PAPER-2014-043/hidef_data_Bs2KstK_theta_LL.png)
![HiDef png [114 KiB]](Directory_LHCb-PAPER-2014-043/hidef_data_Bs2KstK_theta_DD.png)
Tables and captions
|
Yields and relative yields obtained from the fits to $ K ^{*\pm} K ^\mp $ and $ K ^{*\pm} \pi ^\mp $ candidates. The relative yields of nonresonant (NR) $B^0_{(s)}$ decays are constrained to be identical in long and downstream categories. Only statistical uncertainties are given. |
Table_1.pdf [59 KiB] HiDef png [39 KiB] Thumbnail [17 KiB] tex code |

|
|
Systematic uncertainties on the relative branching fraction measurements. The total uncertainty is obtained by combining all sources in quadrature. |
Table_2.pdf [63 KiB] HiDef png [73 KiB] Thumbnail [32 KiB] tex code |

|
![HiDef png [39 KiB]](Directory_LHCb-PAPER-2014-043/hidef_Table_1.png)
![HiDef png [73 KiB]](Directory_LHCb-PAPER-2014-043/hidef_Table_2.png)
Created on 27 April 2024.