Observation of the rare $B^0_s\to\mu^+\mu^-$ decay from the combined analysis of CMS and LHCb data
[to restricted-access page]Information
LHCb-PAPER-2014-049
CERN-PH-EP-2014-220
arXiv:1411.4413 [PDF]
(Submitted on 17 Nov 2014)
Nature 522 (2015) 68
Inspire 1328493
Tools
Abstract
A joint measurement is presented of the branching fractions $B^0_s\to\mu^+\mu^-$ and $B^0\to\mu^+\mu^-$ in proton-proton collisions at the LHC by the CMS and LHCb experiments. The data samples were collected in 2011 at a centre-of-mass energy of 7 TeV, and in 2012 at 8 TeV. The combined analysis produces the first observation of the $B^0_s\to\mu^+\mu^-$ decay, with a statistical significance exceeding six standard deviations, and the best measurement of its branching fraction so far. Furthermore, evidence for the $B^0\to\mu^+\mu^-$ decay is obtained with a statistical significance of three standard deviations. The branching fraction measurements are statistically compatible with SM predictions and impose stringent constraints on several theories beyond the SM.
Figures and captions
|
Feynman diagrams related to the $ B ^0_ s \rightarrow \mu^+\mu^-$ decay: a, $\pi^{+}$ meson decay through charged-current process; b, $ B ^+$ meson decay through the charged-current process; c, a $ B ^0_ s $ decay through the direct flavour changing neutral current process, which is forbidden in the SM , as indicated by the large red "X; d and e, higher-order flavour changing neutral current processes for the $ B ^0_ s \rightarrow \mu^+\mu^-$ decay allowed in the SM ; and f and g, examples of processes for the same decay in theories extending the SM , where new particles, denoted as $X^0$ and $X^+$, can alter the decay rate. |
CMSLHC[..].pdf [38 KiB] HiDef png [38 KiB] Thumbnail [24 KiB] *.C file |

|
|
CMSLHC[..].pdf [38 KiB] HiDef png [39 KiB] Thumbnail [23 KiB] *.C file |

|
|
|
CMSLHC[..].pdf [40 KiB] HiDef png [238 KiB] Thumbnail [162 KiB] *.C file |

|
|
|
CMSLHC[..].pdf [39 KiB] HiDef png [47 KiB] Thumbnail [31 KiB] *.C file |

|
|
|
CMSLHC[..].pdf [38 KiB] HiDef png [52 KiB] Thumbnail [31 KiB] *.C file |

|
|
|
CMSLHC[..].pdf [39 KiB] HiDef png [50 KiB] Thumbnail [30 KiB] *.C file |

|
|
|
CMSLHC[..].pdf [38 KiB] HiDef png [46 KiB] Thumbnail [30 KiB] *.C file |

|
|
|
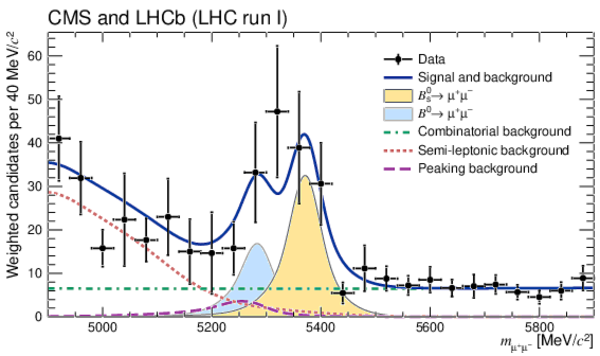
Weighted distribution of the dimuon invariant mass, $m_{\mu^+\mu^-}$, for all categories. Superimposed on the data points in black are the combined fit (solid blue line) and its components: the $ B ^0_ s $ (yellow shaded area) and $ B ^0$ (light-blue shaded area) signal components; the combinatorial background (dash-dotted green line); the sum of the semi-leptonic backgrounds (dotted salmon line); and the peaking backgrounds (dashed violet line). The horizontal bar on each histogram point denotes the size of the binning, while the vertical bar denotes the 68% confidence interval. See main text for details on the weighting procedure. |
CMSLHC[..].pdf [20 KiB] HiDef png [396 KiB] Thumbnail [264 KiB] *.C file |
|
|
Likelihood contours in the $ {\cal B}( B ^0 \rightarrow \mu^+\mu^-) $ versus $ {\cal B}( B ^0_ s \rightarrow \mu^+\mu^-) $ plane. The (black) cross in a marks the best-fit central value. The SM expectation and its uncertainty is shown as the (red) marker. Each contour encloses a region approximately corresponding to the reported confidence level. b, c, Variations of the test statistic $-2\Delta\textrm{ln}L$ for $ {\cal B}( B ^0_ s \rightarrow \mu^+\mu^-) $ (b) and $ {\cal B}( B ^0 \rightarrow \mu^+\mu^-) $ (c). The dark and light (cyan) areas define the $\pm1\sigma$ and $\pm2\sigma$ confidence intervals for the branching fraction, respectively. The SM prediction and its uncertainty for each branching fraction is denoted with the vertical (red) band. |
CMSLHC[..].pdf [106 KiB] HiDef png [311 KiB] Thumbnail [185 KiB] *.C file |

|
|
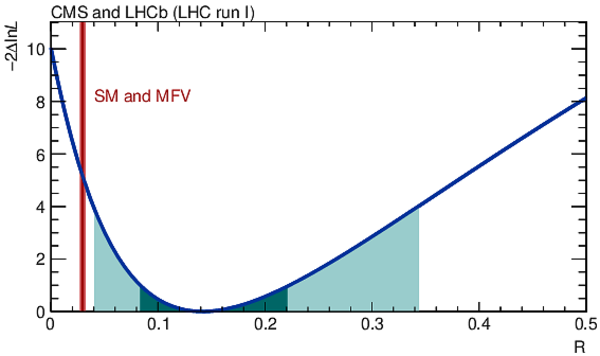
Variation of the test statistic $-2\Delta\textrm{ln}L$ as a function of the ratio of branching fractions $ {\mathcal{R}} \equiv {\cal B}( B ^0 \rightarrow \mu^+\mu^- ) / {\cal B}( B ^0_ s \rightarrow \mu^+\mu^- ) $. The dark and light (cyan) areas define the $\pm1\sigma$ and $\pm2\sigma$ confidence intervals for $ {\mathcal{R}}$ , respectively. The value and uncertainty for $ {\mathcal{R}}$ predicted in the SM , which is the same in BSM theories with the minimal flavour violation (MFV) property, is denoted with the vertical (red) band. |
CMSLHC[..].pdf [14 KiB] HiDef png [151 KiB] Thumbnail [99 KiB] *.C file |
|
|
Distribution of the dimuon invariant mass $m_{\mu^+\mu^-}$ in each of the 20 categories. Superimposed on the data points in black are the combined fit (solid blue) and its components: the $ B ^0_ s $ (yellow shaded) and $ B ^0$ (light-blue shaded) signal components; the combinatorial background (dash-dotted green); the sum of the semi-leptonic backgrounds (dotted salmon); and the peaking backgrounds (dashed violet). The categories are defined by the range of BDT values for LHCb, and for CMS, by centre-of-mass energy, by the region of the detector in which the muons are detected, and by the range of BDT values. Categories for which both muons are detected in the central region of the CMS detector are denoted with CR, those for which at least one muon was detected into the forward region with FR. |
CMSLHC[..].pdf [281 KiB] HiDef png [1 MiB] Thumbnail [731 KiB] *.C file |

|
|
Distribution of the dimuon invariant mass $m_{\mu^+\mu^-}$ for the best six categories. Categories are ranked according to values of ${\rm S}/{\rm (S+B)}$ where S and B are the numbers of signal events expected assuming the SM rates and background events under the $ B ^0_ s $ peak for a given category, respectively. The mass distribution for the six highest-ranking categories, three per experiment, is shown. Superimposed on the data points in black are the combined full fit (solid blue) and its components: the $ B ^0_ s $ (yellow shaded) and $ B ^0$ (light-blue shaded) signal components; the combinatorial background (dash-dotted green); the sum of the semi-leptonic backgrounds (dotted salmon); and the peaking backgrounds (dashed violet). |
CMSLHC[..].pdf [42 KiB] HiDef png [497 KiB] Thumbnail [229 KiB] *.C file |

|
|
Schematic of the CMS detector and event display for a candidate $ B ^0_ s \rightarrow \mu^+\mu^-$ decay at CMS. a, The CMS detector and its components; see ref. \citen{Chatrchyan:2008aa} for details. b, A candidate $ B ^0_ s \rightarrow \mu^+\mu^-$ decay produced in proton-proton collisions at 8 $\mathrm{ Te V}$ in 2012 and recorded in the CMS detector. The red arched curves represent the trajectories of the muons from the $ B ^0_ s $ decay candidate. |
CMSLHC[..].pdf [1 MiB] HiDef png [3 MiB] Thumbnail [1 MiB] *.C file |

|
|
Schematic of the LHCb detector and event display for a candidate $ B ^0_ s \rightarrow \mu^+\mu^-$ decay at LHCb. a, The LHCb detector and its components; see ref. \citen{Alves:2008zz} for details. b, A candidate $ B ^0_ s \rightarrow \mu^+\mu^-$ decay produced in proton-proton collisions at 7 $\mathrm{ Te V}$ in 2011 and recorded in the LHCb detector. The proton-proton collision occurs on the left-hand side, at the origin of the trajectories depicted with the orange curves. The red curves represent the trajectories of the muons from the $ B ^0_ s $ candidate decay. |
CMSLHC[..].pdf [3 MiB] Thumbnail [1 MiB] *.C file |

|
|
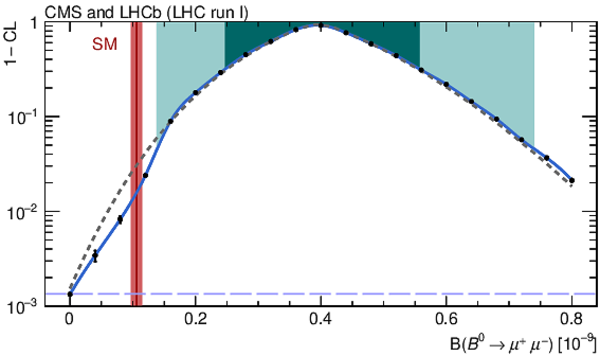
Confidence level as a function of the $ {\cal B}( B ^0 \rightarrow \mu^+\mu^- )$ hypothesis. Value of $1-\mathrm{CL}$, where CL is the confidence level obtained with the Feldman--Cousins procedure, as a function of $ {\cal B}( B ^0 \rightarrow \mu^+\mu^- )$ is shown in logarithmic scale. The points mark the computed $1-\mathrm{CL}$ values and the curve is their spline interpolation. The dark and light (cyan) areas define the two-sided $\pm1\sigma$ and $\pm2\sigma$ confidence intervals for the branching fraction, while the dashed horizontal line defines the confidence level for the $3\sigma$ one-sided interval. The dashed (grey) curve shows the $1-\mathrm{CL}$ values computed from the one-dimensional $-2\Delta\textrm{ln}L$ test statistic using Wilks' theorem. Deviations between these confidence level values and those from the Feldman--Cousins procedure [30] illustrate the degree of approximation implied by the asymptotic assumptions inherent to Wilks' theorem [29]. |
CMSLHC[..].pdf [36 KiB] HiDef png [159 KiB] Thumbnail [109 KiB] *.C file |
|
|
Likelihood contours for the ratios of the branching fractions with respect to their SM prediction, in the $\mathcal{S}^{ B ^0 }_{\rm{SM}}$ versus $\mathcal{S}^{B^0_s}_{\rm{SM}}$ plane. a, The (black) cross marks the central value returned by the fit. The SM point is shown as the (red) square located, by construction, at $\mathcal{S}^{ B ^0 }_{\rm{SM}} = \mathcal{S}^{B^0_s}_{\rm{SM}} =1$. Each contour encloses a region approximately corresponding to the reported confidence level. The SM branching fractions are assumed uncorrelated to each other, and their uncertainties are accounted for in the likelihood contours. b, c, Variations of the test statistic $-2\Delta\textrm{ln}L$ for $\mathcal{S}^{B^0_s}_{\rm{SM}}$ and $\mathcal{S}^{ B ^0 }_{\rm{SM}}$ are shown in b and c, respectively. The SM is represented by the (red) vertical lines. The dark and light (cyan) areas define the $\pm1\sigma$ and $\pm2\sigma$ confidence intervals, respectively. |
CMSLHC[..].pdf [224 KiB] HiDef png [396 KiB] Thumbnail [232 KiB] *.C file |

|
|
Search for the $ B ^0_ s \rightarrow \mu^+\mu^-$ and $ B ^0 \rightarrow \mu^+\mu^-$ decays, reported by 11 experiments spanning more than three decades, and by the present results. Markers without error bars denote upper limits on the branching fractions at 90% confidence level, while measurements are denoted with errors bars delimiting 68% confidence intervals. The horizontal lines represent the SM predictions for the $ B ^0_ s \rightarrow \mu^+\mu^-$ and $ B ^0 \rightarrow \mu^+\mu^-$ branching fractions [1]; the blue (red) lines and markers relate to the $ B ^0_ s \rightarrow \mu^+\mu^-$ ( $ B ^0 \rightarrow \mu^+\mu^-$ ) decay. Data (see key) are from refs \citen{Giles:1984yg,Avery:1987cv,Avery:1989qi,Ammar:1993ez,Bergfeld:2000ui,Albrecht:1987rj ,Albajar:1988iq,Albajar:1991ct ,Abe:1996et,Abe:1998ah,Acosta:2004xj,Abulencia:2005pw,Aaltonen:2011fi,Aaltonen:2013as ,Acciarri:1996us ,Abbott:1998hc,Abazov:2004dj,Abazov:2007iy,Abazov:2010fs,Abazov:2013wjb ,Chang:2003yy ,Aubert:2004gm,Aubert:2007hb ,Aaij:2011rja,Aaij:2012ac,LHCb:2011ac,Aaij:2012nna,Aaij:2013aka ,Chatrchyan:2011kr,Chatrchyan:2012rga,Chatrchyan:2013bka ,Aad:2012pn} ; for details see Methods. Inset, magnified view of the last period in time. |
CMSLHC[..].pdf [18 KiB] HiDef png [337 KiB] Thumbnail [253 KiB] *.C file |

|
|
Animated gif made out of all figures. |
PAPER-2014-049.gif Thumbnail |

|
![HiDef png [38 KiB]](Directory_LHCb-PAPER-2014-049/hidef_CMSLHCb_fig1_a.png)
![HiDef png [39 KiB]](Directory_LHCb-PAPER-2014-049/hidef_CMSLHCb_fig1_b.png)
![HiDef png [238 KiB]](Directory_LHCb-PAPER-2014-049/hidef_CMSLHCb_fig1_c.png)
![HiDef png [47 KiB]](Directory_LHCb-PAPER-2014-049/hidef_CMSLHCb_fig1_d.png)
![HiDef png [52 KiB]](Directory_LHCb-PAPER-2014-049/hidef_CMSLHCb_fig1_e.png)
![HiDef png [50 KiB]](Directory_LHCb-PAPER-2014-049/hidef_CMSLHCb_fig1_f.png)
![HiDef png [46 KiB]](Directory_LHCb-PAPER-2014-049/hidef_CMSLHCb_fig1_g.png)
![HiDef png [396 KiB]](Directory_LHCb-PAPER-2014-049/hidef_CMSLHCb_fig2.png)
![HiDef png [311 KiB]](Directory_LHCb-PAPER-2014-049/hidef_CMSLHCb_fig3.png)
![HiDef png [151 KiB]](Directory_LHCb-PAPER-2014-049/hidef_CMSLHCb_fig4.png)
![HiDef png [1 MiB]](Directory_LHCb-PAPER-2014-049/hidef_CMSLHCb_EDfig1.png)
![HiDef png [497 KiB]](Directory_LHCb-PAPER-2014-049/hidef_CMSLHCb_EDfig2.png)
![HiDef png [3 MiB]](Directory_LHCb-PAPER-2014-049/hidef_CMSLHCb_EDfig3.png)
![HiDef png [159 KiB]](Directory_LHCb-PAPER-2014-049/hidef_CMSLHCb_EDfig5.png)
![HiDef png [396 KiB]](Directory_LHCb-PAPER-2014-049/hidef_CMSLHCb_EDfig6.png)
![HiDef png [337 KiB]](Directory_LHCb-PAPER-2014-049/hidef_CMSLHCb_EDfig7.png)
Created on 27 April 2024.