Measurement of $B_c^+$ production in proton-proton collisions at $\sqrt{s}=8$ TeV
[to restricted-access page]Information
LHCb-PAPER-2014-050
CERN-PH-EP-2014-269
arXiv:1411.2943 [PDF]
(Submitted on 11 Nov 2014)
Phys. Rev. Lett. 114 (2015) 132001
Inspire 1327230
Tools
Abstract
Production of $B_c^+$ mesons in proton-proton collisions at a center-of-mass energy of 8 TeV is studied with data corresponding to an integrated luminosity of $2.0 {\rm fb}^{-1}$ recorded by the LHCb experiment. The ratio of production cross-sections times branching fractions between the $B_c^+\to J/\psi \pi^+$ and $B^+\to J/\psi K^+$ decays is measured as a function of transverse momentum and rapidity in the regions $0 < p_{\rm T} < 20 {\rm GeV}/c$ and $2.0 < y < 4.5$. The ratio in this kinematic range is measured to be $(0.683\pm0.018\pm0.009)\%$, where the first uncertainty is statistical and the second systematic.
Figures and captions
|
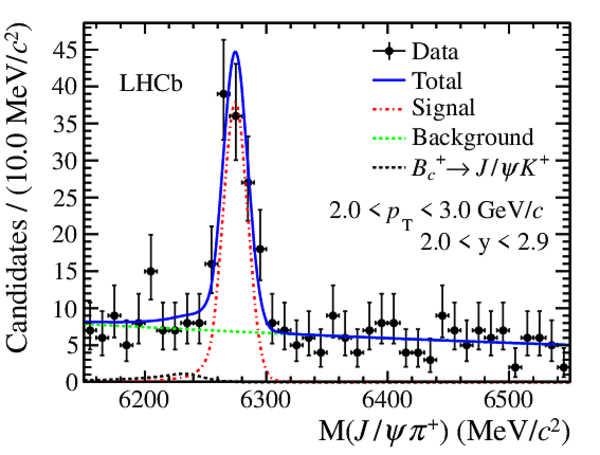
Invariant mass distribution of ({\it left}) $ B_c^+\rightarrow { J \mskip -3mu/\mskip -2mu\psi \mskip 2mu} \pi^+$ and ({\it right}) $ B ^+ \rightarrow { J \mskip -3mu/\mskip -2mu\psi \mskip 2mu} K^+$ candidates with $2.0< p_{\rm T} <3.0 {\mathrm{ Ge V /}c} $ and $2.0<y<2.9$. The results of the fit described in the text are superimposed. |
Fig1a.pdf [19 KiB] HiDef png [313 KiB] Thumbnail [287 KiB] *.C file |
|
|
Fig1b.pdf [25 KiB] HiDef png [274 KiB] Thumbnail [251 KiB] *.C file |

|
|
|
Fig2a.pdf [15 KiB] HiDef png [149 KiB] Thumbnail [152 KiB] *.C file |

|
|
|
Fig2b.pdf [16 KiB] HiDef png [144 KiB] Thumbnail [147 KiB] *.C file |

|
|
|
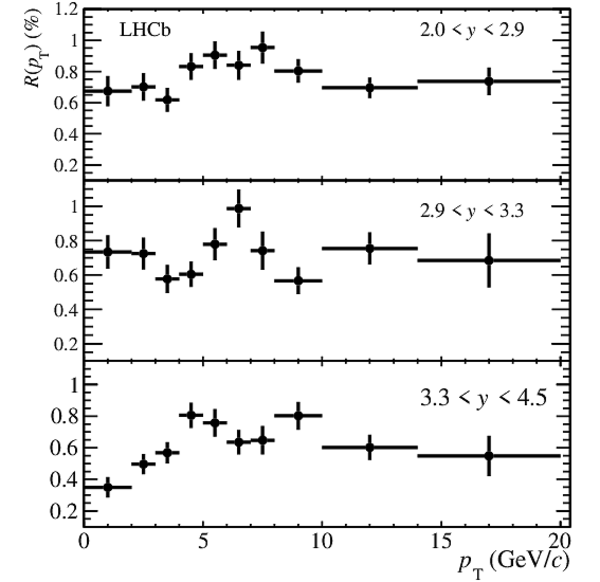
Ratio $R( p_{\rm T},y)$ as a function of $ p_{\rm T} $ in the regions ({\it top}) $2.0<y<2.9$, ({\it middle}) $2.9<y<3.3$, and ({\it bottom}) $3.3<y<4.5$. The error bars on the data show the statistical and systematic uncertainties added in quadrature. |
Fig3.pdf [17 KiB] HiDef png [120 KiB] Thumbnail [77 KiB] *.C file |
|
|
Ratio ({\it left}) $R( p_{\rm T})$ as a function of $ p_{\rm T}$ integrated over $y$ in the region $2.0<y<$4.5 and ({\it right}) $R(y)$ as a function of $y$ integrated over $ p_{\rm T}$ in the region $0< p_{\rm T} <20 {\mathrm{ Ge V /}c} $. The error bars on the data show the statistical and systematic uncertainties added in quadrature. |
Fig4a.pdf [13 KiB] HiDef png [64 KiB] Thumbnail [37 KiB] *.C file |

|
|
Fig4b.pdf [13 KiB] HiDef png [51 KiB] Thumbnail [30 KiB] *.C file |

|
|
|
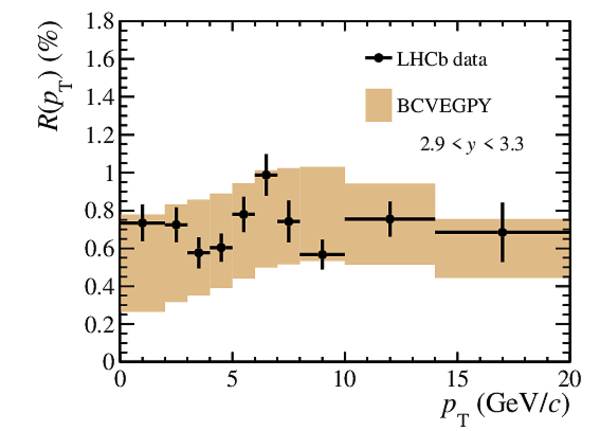
Ratio $R( p_{\rm T},y)$ as a function of $ p_{\rm T} $ in the regions $2.0<y<2.9$ ({\it top left}), $2.9<y<3.3$ ({\it top right}), and $3.3<y<4.5$ ({\it bottom left}), with theoretical predictions following the $\alpha_s^4$ approach [43] overlaid. |
Fig5a.pdf [14 KiB] HiDef png [135 KiB] Thumbnail [132 KiB] *.C file |

|
|
Fig5b.pdf [14 KiB] HiDef png [134 KiB] Thumbnail [131 KiB] *.C file |
|
|
|
Fig5c.pdf [14 KiB] HiDef png [130 KiB] Thumbnail [128 KiB] *.C file |

|
|
|
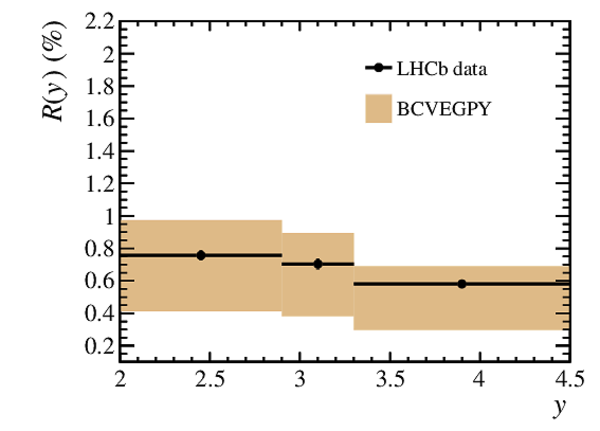
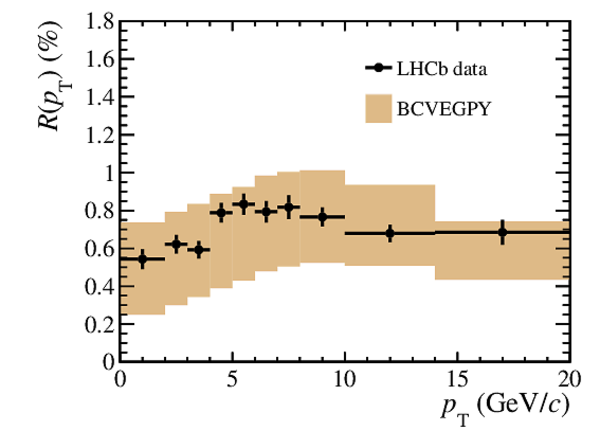
Ratio $R( p_{\rm T})$ as a function of $ p_{\rm T}$ integrated over $y$ in the region 2.0$<y<$4.5 ({\it left}) and $R(y)$ as a function of $y$ integrated over $ p_{\rm T}$ in the region 0$< p_{\rm T} <20 {\mathrm{ Ge V /}c} $ ({\it right}) are compared to the theoretical predictions following the $\alpha_s^4$ approach [43]. |
Fig6a.pdf [14 KiB] HiDef png [128 KiB] Thumbnail [125 KiB] *.C file |

|
|
Fig6b.pdf [14 KiB] HiDef png [102 KiB] Thumbnail [105 KiB] *.C file |
|
|
|
Animated gif made out of all figures. |
PAPER-2014-050.gif Thumbnail |

|
Tables and captions
|
$R( p_{\rm T},y)$ in units of $10^{-2}$ as a function of $ p_{\rm T}$ and $y$. The first uncertainty is statistical and the second systematic. |
Table_1.pdf [35 KiB] HiDef png [113 KiB] Thumbnail [54 KiB] tex code |

|
Supplementary Material [file]


![HiDef png [313 KiB]](Directory_LHCb-PAPER-2014-050/hidef_Fig1a.png)
![HiDef png [274 KiB]](Directory_LHCb-PAPER-2014-050/hidef_Fig1b.png)
![HiDef png [149 KiB]](Directory_LHCb-PAPER-2014-050/hidef_Fig2a.png)
![HiDef png [144 KiB]](Directory_LHCb-PAPER-2014-050/hidef_Fig2b.png)
![HiDef png [120 KiB]](Directory_LHCb-PAPER-2014-050/hidef_Fig3.png)
![HiDef png [64 KiB]](Directory_LHCb-PAPER-2014-050/hidef_Fig4a.png)
![HiDef png [51 KiB]](Directory_LHCb-PAPER-2014-050/hidef_Fig4b.png)
![HiDef png [135 KiB]](Directory_LHCb-PAPER-2014-050/hidef_Fig5a.png)
![HiDef png [134 KiB]](Directory_LHCb-PAPER-2014-050/hidef_Fig5b.png)
![HiDef png [130 KiB]](Directory_LHCb-PAPER-2014-050/hidef_Fig5c.png)
![HiDef png [128 KiB]](Directory_LHCb-PAPER-2014-050/hidef_Fig6a.png)
![HiDef png [102 KiB]](Directory_LHCb-PAPER-2014-050/hidef_Fig6b.png)
![HiDef png [113 KiB]](Directory_LHCb-PAPER-2014-050/hidef_Table_1.png)
![HiDef png [135 KiB]](Directory_LHCb-PAPER-2014-050/supplementary/hidef_Fig5a.png)
![HiDef png [134 KiB]](Directory_LHCb-PAPER-2014-050/supplementary/hidef_Fig5b.png)
![HiDef png [130 KiB]](Directory_LHCb-PAPER-2014-050/supplementary/hidef_Fig5c.png)
![HiDef png [128 KiB]](Directory_LHCb-PAPER-2014-050/supplementary/hidef_Fig6a.png)
![HiDef png [102 KiB]](Directory_LHCb-PAPER-2014-050/supplementary/hidef_Fig6b.png)
Created on 26 April 2024.