Measurement of the CP-violating phase $\phi_s$ in $\bar{B}^{0}_{s}\to D_{s}^{+}D_{s}^{-}$ decays
[to restricted-access page]Information
LHCb-PAPER-2014-051
CERN-PH-EP-2014-223
arXiv:1409.4619 [PDF]
(Submitted on 16 Sep 2014)
Phys. Rev. Lett. 113 (2014) 211801
Inspire 1317237
Tools
Abstract
We present a measurement of the $CP$-violating weak mixing phase $\phi_s$ using the decay $\bar{B}^{0}_{s}\to D_{s}^{+}D_{s}^{-}$ in a data sample corresponding to $3.0$ fb$^{-1}$ of integrated luminosity collected with the LHCb detector in $pp$ collisions at centre-of-mass energies of 7 and 8 TeV. An analysis of the time evolution of the system, which does not constrain $|\lambda|=1$ to allow for the presence of $CP$ violation in decay, yields $\phi_s = 0.02 \pm 0.17$ (stat) $\pm 0.02$ (syst) rad, $|\lambda| = 0.91^{+0.18}_{-0.15}$ (stat) $\pm0.02$ (syst). This result is consistent with the Standard Model expectation.
Figures and captions
|
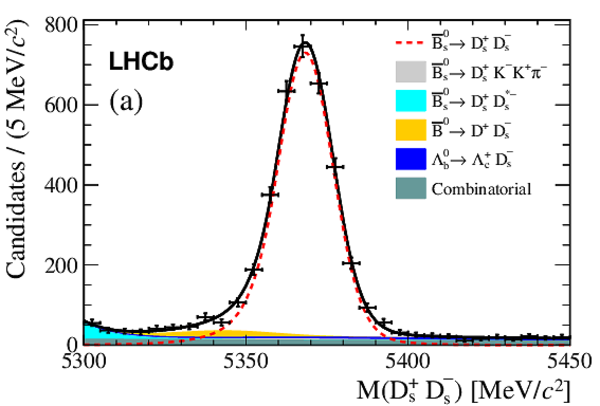
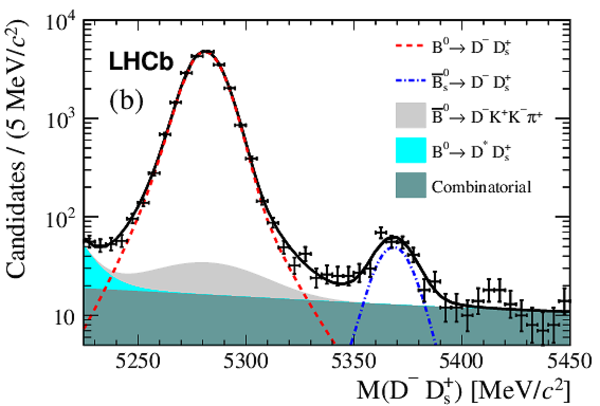
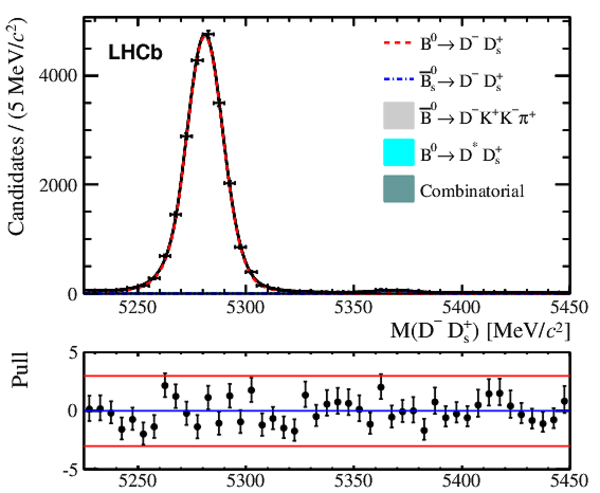
Invariant mass distributions of (a) $\overline{ B }{} {}^0_ s \rightarrow D ^+_ s D ^-_ s $ and (b) $ B ^0 \rightarrow D ^- D ^+_ s $ candidates. The points show the data; the individual fit components are indicated in the legend; the black curve shows the overall fit. |
Fig1a.pdf [20 KiB] HiDef png [226 KiB] Thumbnail [191 KiB] *.C file |
|
|
Fig1b.pdf [24 KiB] HiDef png [258 KiB] Thumbnail [228 KiB] *.C file |
|
|
|
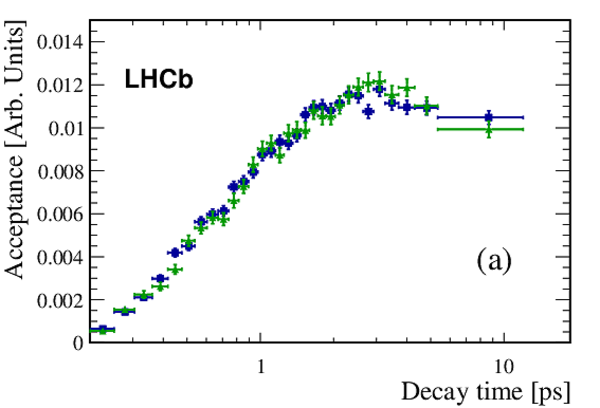
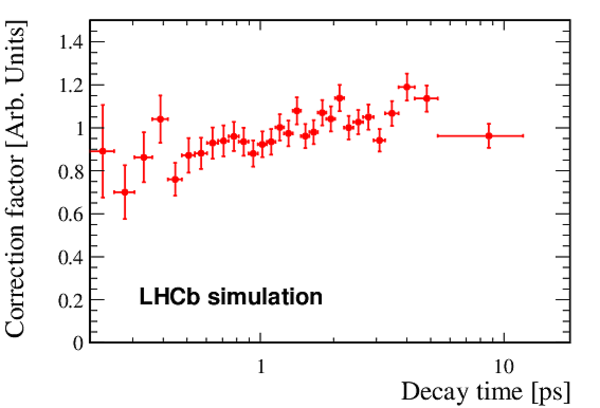
Decay time acceptances in simulation and data: (a) the $ B ^0 \rightarrow D ^- D ^+_ s $ acceptance in data (green triangles) and simulation (blue squares), (b) the $\overline{ B }{} {}^0_ s \rightarrow D ^+_ s D ^-_ s $ acceptance in simulation (blue squares) and the $ B ^0 \rightarrow D ^- D ^+_ s $ acceptance corrected for $\overline{ B }{} {}^0_ s \rightarrow D ^+_ s D ^-_ s $ (red triangles). The correction is described in detail in the text. |
Fig2a.pdf [19 KiB] HiDef png [196 KiB] Thumbnail [142 KiB] *.C file |
|
|
Fig2b.pdf [19 KiB] HiDef png [195 KiB] Thumbnail [147 KiB] *.C file |

|
|
|
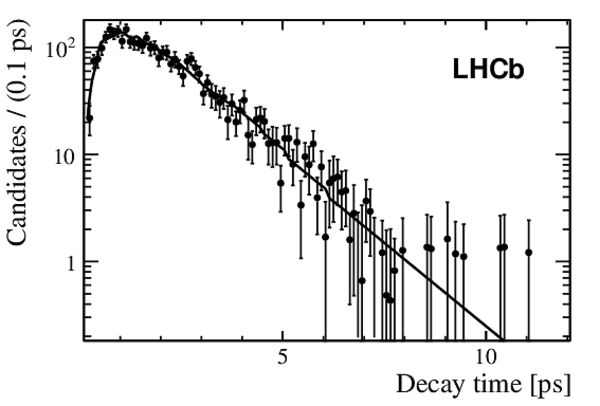
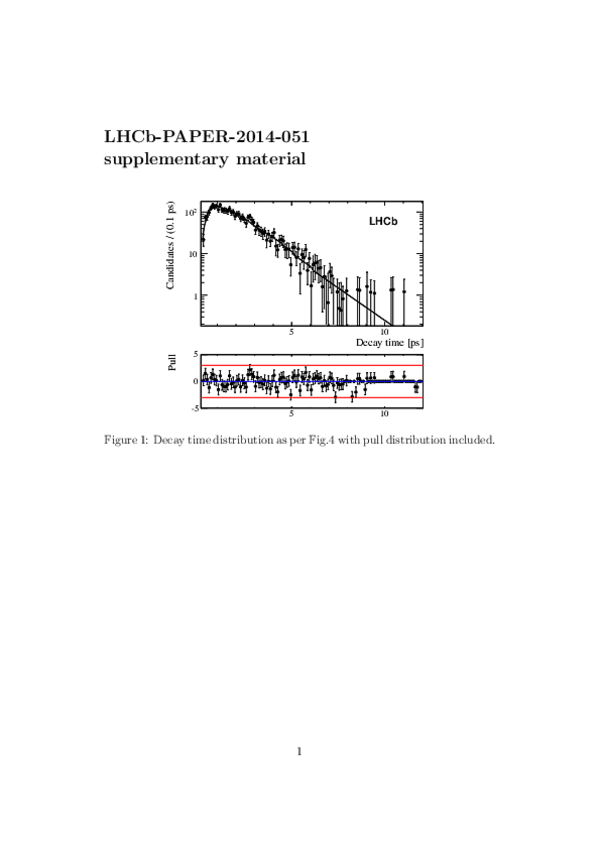
Distribution of the decay time for $\overline{ B }{} {}^0_ s \rightarrow D ^+_ s D ^-_ s $ signal decays with background subtracted using the sPlot method, along with the fit as described in the text. Discontinuities in the fit line shape are a result of the binned acceptance. |
Fig3.pdf [20 KiB] HiDef png [105 KiB] Thumbnail [62 KiB] *.C file |
|
|
Animated gif made out of all figures. |
PAPER-2014-051.gif Thumbnail |

|
Tables and captions
|
Summary of systematic uncertainties not already accounted for in the fit, where $\sigma$ denotes the statistical uncertainty. |
Table_1.pdf [39 KiB] HiDef png [69 KiB] Thumbnail [33 KiB] tex code |

|
Supplementary Material [file]


![HiDef png [226 KiB]](Directory_LHCb-PAPER-2014-051/hidef_Fig1a.png)
![HiDef png [258 KiB]](Directory_LHCb-PAPER-2014-051/hidef_Fig1b.png)
![HiDef png [196 KiB]](Directory_LHCb-PAPER-2014-051/hidef_Fig2a.png)
![HiDef png [195 KiB]](Directory_LHCb-PAPER-2014-051/hidef_Fig2b.png)
![HiDef png [105 KiB]](Directory_LHCb-PAPER-2014-051/hidef_Fig3.png)
![HiDef png [69 KiB]](Directory_LHCb-PAPER-2014-051/hidef_Table_1.png)
![HiDef png [154 KiB]](Directory_LHCb-PAPER-2014-051/supplementary/hidef_Asym_data_fullfit.png)
![HiDef png [151 KiB]](Directory_LHCb-PAPER-2014-051/supplementary/hidef_Asym_data_fullfit_nolambda.png)
![HiDef png [131 KiB]](Directory_LHCb-PAPER-2014-051/supplementary/hidef_B2DsDs_Ds2KKpi_vs_Ds2KKpi_correction.png)
![HiDef png [70 KiB]](Directory_LHCb-PAPER-2014-051/supplementary/hidef_Lambda_pub.png)
![HiDef png [298 KiB]](Directory_LHCb-PAPER-2014-051/supplementary/hidef_MDsD_log_wpulls.png)
![HiDef png [238 KiB]](Directory_LHCb-PAPER-2014-051/supplementary/hidef_MDsD_wpulls.png)
![HiDef png [288 KiB]](Directory_LHCb-PAPER-2014-051/supplementary/hidef_MDsDs_log_wpulls.png)
![HiDef png [254 KiB]](Directory_LHCb-PAPER-2014-051/supplementary/hidef_MDsDs_wpulls.png)
![HiDef png [81 KiB]](Directory_LHCb-PAPER-2014-051/supplementary/hidef_Phi_s_noLambda_pub.png)
![HiDef png [73 KiB]](Directory_LHCb-PAPER-2014-051/supplementary/hidef_Phi_s_withLambda_pub.png)
![HiDef png [22 KiB]](Directory_LHCb-PAPER-2014-051/supplementary/hidef_bsdsds_treepeng.png)
![HiDef png [44 KiB]](Directory_LHCb-PAPER-2014-051/supplementary/hidef_bsmixing_schannel.png)
![HiDef png [210 KiB]](Directory_LHCb-PAPER-2014-051/supplementary/hidef_decay_time_wpulls.png)
![HiDef png [145 KiB]](Directory_LHCb-PAPER-2014-051/supplementary/hidef_omega_OS.png)
![HiDef png [140 KiB]](Directory_LHCb-PAPER-2014-051/supplementary/hidef_omega_OSIncl.png)
![HiDef png [132 KiB]](Directory_LHCb-PAPER-2014-051/supplementary/hidef_omega_SSNNK.png)
![HiDef png [129 KiB]](Directory_LHCb-PAPER-2014-051/supplementary/hidef_omega_SSNNKIncl.png)
![HiDef png [99 KiB]](Directory_LHCb-PAPER-2014-051/supplementary/hidef_omega_overlap.png)
![HiDef png [209 KiB]](Directory_LHCb-PAPER-2014-051/supplementary/hidef_tres_B2DsDs_All_resolution_plot.png)
![HiDef png [123 KiB]](Directory_LHCb-PAPER-2014-051/supplementary/hidef_tres_calib.png)
Created on 02 May 2024.