Determination of the quark coupling strength $|V_{ub}|$ using baryonic decays
[to restricted-access page]Information
LHCb-PAPER-2015-013
CERN-PH-EP-2015-084
arXiv:1504.01568 [PDF]
(Submitted on 07 Apr 2015)
Nature Physics 11 (2015) 743
Inspire 1358215
Tools
Abstract
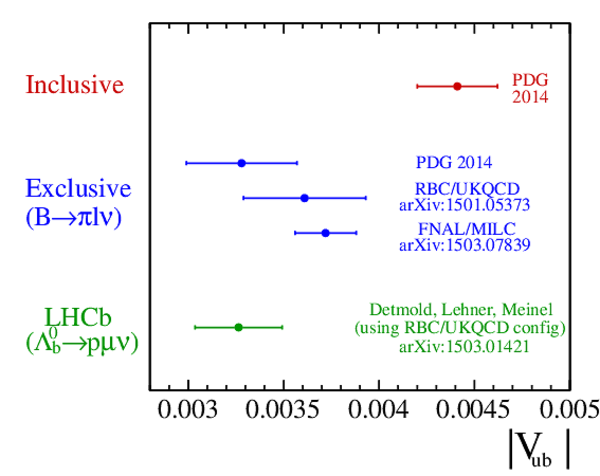
In the Standard Model of particle physics, the strength of the couplings of the $b$ quark to the $u$ and $c$ quarks, $|V_{ub}|$ and $|V_{cb}|$, are governed by the coupling of the quarks to the Higgs boson. Using data from the LHCb experiment at the Large Hadron Collider, the probability for the $\Lambda^0_b$ baryon to decay into the $p \mu^- \overline{\nu}_\mu$ final state relative to the $\Lambda^+_c \mu^- \overline{\nu}_\mu$ final state is measured. Combined with theoretical calculations of the strong interaction and a previously measured value of $|V_{cb}|$, the first $|V_{ub}|$ measurement to use a baryonic decay is performed. This measurement is consistent with previous determinations of $|V_{ub}|$ using $B$ meson decays to specific final states and confirms the existing incompatibility with those using an inclusive sample of final states.
Figures and captions
|
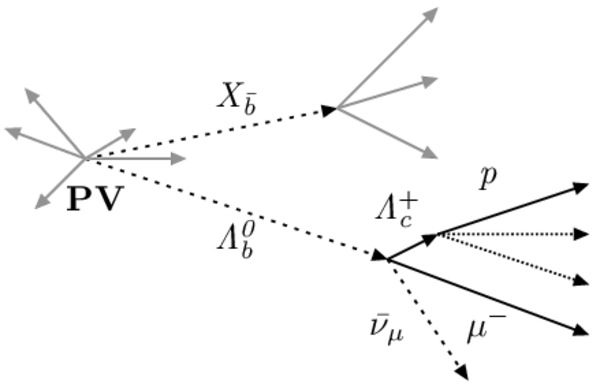
Diagram illustrating the topology for the (top) signal and (bottom) background decays. The $\Lambda ^0_ b $ baryon travels about 1 cm on average before decaying; its flight direction is indicated in the diagram. In the $\Lambda ^0_ b \rightarrow p \mu ^- \overline{\nu } _\mu $ signal case, the only other particles present are typically reconstructed far away from the signal, which are shown as grey arrows. For the background from $\Lambda ^+_ c $ decays, there are particles which are reconstructed in close proximity to the signal and which are indicated as dotted arrows. |
signal[..].pdf [67 KiB] HiDef png [65 KiB] Thumbnail [50 KiB] *.C file |

|
|
backgr[..].pdf [74 KiB] HiDef png [77 KiB] Thumbnail [58 KiB] *.C file |
|
|
|
Illustrating the method used to reduce the number of selected events from the { $ q^{2}$ } region where lattice QCD has high uncertainties. The efficiency of simulated $\Lambda ^0_ b \rightarrow p \mu ^- \overline{\nu } _\mu $ candidates as a function of $ q^{2}$ . For the case where one $ q^{2}$ solution is required to be above 15 $ {\mathrm{ Ge V^2 /}c^4}$ (marked by the vertical line), there is still significant efficiency for signal below this value, whereas, when both solutions have this requirement, only a small amount of signal below 15 $ {\mathrm{ Ge V^2 /}c^4}$ is selected. |
q2eff.pdf [16 KiB] HiDef png [148 KiB] Thumbnail [82 KiB] *.C file |

|
|
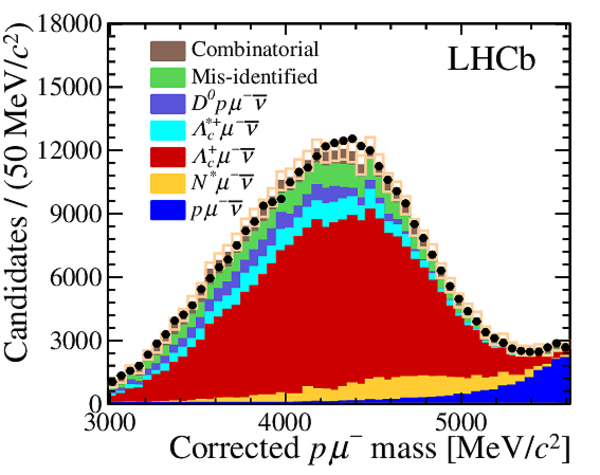
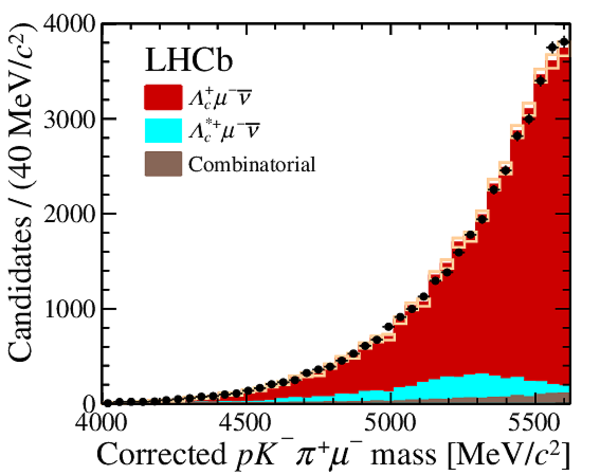
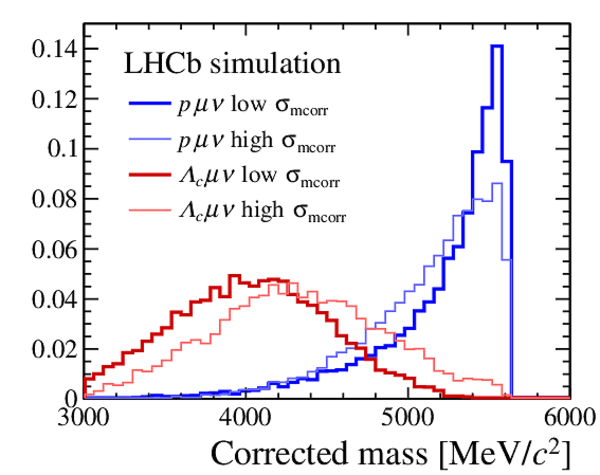
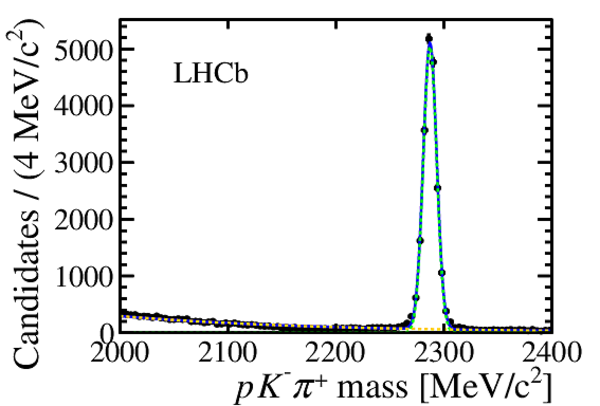
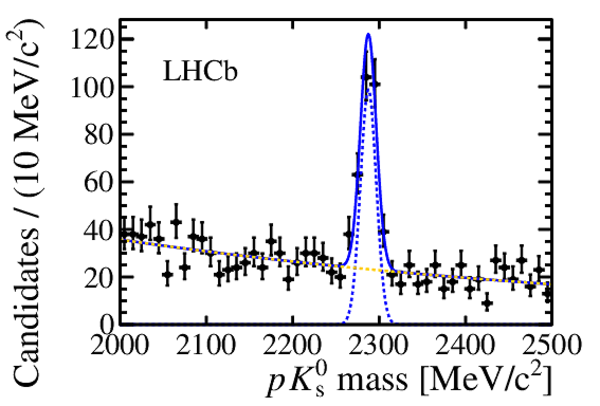
Corrected mass fit used for determining signal yields. Fits are made to (top) $\Lambda ^0_ b \rightarrow p \mu ^- \overline{\nu } _\mu $ and (bottom) $\Lambda ^0_ b \rightarrow (\Lambda ^+_ c \rightarrow p K ^- \pi ^+ ) \mu ^- \overline{\nu } _\mu $ candidates. The statistical uncertainties arising from the finite size of the simulation samples used to model the mass shapes are indicated by open boxes while the data are represented by the black points. The statistical uncertainty on the data points is smaller than the marker size used. The different signal and background components appear in the same order in the fits and the legends. There are no data above the nominal $\Lambda ^0_ b $ mass due to the removal of unphysical $ q^{2}$ solutions. |
pmu_mc[..].pdf [23 KiB] HiDef png [335 KiB] Thumbnail [287 KiB] *.C file |
|
|
norm_fit.pdf [17 KiB] HiDef png [234 KiB] Thumbnail [198 KiB] *.C file |
|
|
|
Experimental constraints on the left-handed coupling, {$|V_{ u b }^{\rm{L}}|$} and the fractional right-handed coupling, {$\epsilon_R$}. While the overlap of the 68% confidence level bands for the inclusive [14] and exclusive [7] world averages of past measurements suggested a right handed coupling of significant magnitude, the inclusion of the LHCb $ |V_{ u b }|$ measurement does not support this. |
righth[..].pdf [19 KiB] HiDef png [340 KiB] Thumbnail [175 KiB] *.C file |

|
|
Animated gif made out of all figures. |
PAPER-2015-013.gif Thumbnail |

|
![HiDef png [65 KiB]](Directory_LHCb-PAPER-2015-013/hidef_signal_diagram.png)
![HiDef png [77 KiB]](Directory_LHCb-PAPER-2015-013/hidef_background_diagram.png)
![HiDef png [148 KiB]](Directory_LHCb-PAPER-2015-013/hidef_q2eff.png)
![HiDef png [335 KiB]](Directory_LHCb-PAPER-2015-013/hidef_pmu_mcorr_fit.png)
![HiDef png [234 KiB]](Directory_LHCb-PAPER-2015-013/hidef_norm_fit.png)
![HiDef png [340 KiB]](Directory_LHCb-PAPER-2015-013/hidef_righthanded.png)
Tables and captions
|
Summary of systematic uncertainties. The table shows the relative systematic uncertainty on the ratio of the $\Lambda ^0_ b \rightarrow p \mu ^- \overline{\nu } _\mu $ and $\Lambda ^0_ b \rightarrow \Lambda ^+_ c \mu ^- \overline{\nu } _\mu $ branching fractions broken into its individual contributions. The total is obtained by adding them in quadrature. Uncertainties on the background levels are not listed here as they are incorporated into the fits. |
Table_1.pdf [57 KiB] HiDef png [120 KiB] Thumbnail [49 KiB] tex code |

|
![HiDef png [120 KiB]](Directory_LHCb-PAPER-2015-013/hidef_Table_1.png)
Supplementary Material [file]
| Supplementary material full pdf |
supple[..].pdf [191 KiB] |
|
|
This ZIP file contains supplementary material for the publication LHCb-PAPER-2015-013. The files are: Supplementary.pdf: An overview of the extra figures *.pdf, *.png, *.eps, *.C: The figures in various formats. The *.C files contain the data on the figures. |
Fig1-S.pdf [15 KiB] HiDef png [215 KiB] Thumbnail [206 KiB] *C file |
|
|
Fig2-S.pdf [13 KiB] HiDef png [266 KiB] Thumbnail [156 KiB] *C file |
|
|
|
Fig3-S.pdf [25 KiB] HiDef png [224 KiB] Thumbnail [176 KiB] *C file |
|
|
|
Fig4-S.pdf [19 KiB] HiDef png [250 KiB] Thumbnail [222 KiB] *C file |
|
|
|
Fig5-S.pdf [24 KiB] HiDef png [243 KiB] Thumbnail [203 KiB] *C file |

|
|
|
Fig6-S.pdf [19 KiB] HiDef png [374 KiB] Thumbnail [189 KiB] *C file |

|
![HiDef png [215 KiB]](Directory_LHCb-PAPER-2015-013/supplementary/hidef_Fig1-S.png)
![HiDef png [266 KiB]](Directory_LHCb-PAPER-2015-013/supplementary/hidef_Fig2-S.png)
![HiDef png [224 KiB]](Directory_LHCb-PAPER-2015-013/supplementary/hidef_Fig3-S.png)
![HiDef png [250 KiB]](Directory_LHCb-PAPER-2015-013/supplementary/hidef_Fig4-S.png)
![HiDef png [243 KiB]](Directory_LHCb-PAPER-2015-013/supplementary/hidef_Fig5-S.png)
![HiDef png [374 KiB]](Directory_LHCb-PAPER-2015-013/supplementary/hidef_Fig6-S.png)
Created on 27 April 2024.