Measurement of the time-integrated $CP$ asymmetry in $D^0 \to K^0_S K^0_S$ decays
[to restricted-access page]Information
LHCb-PAPER-2015-030
CERN-PH-EP-2015-215
arXiv:1508.06087 [PDF]
(Submitted on 25 Aug 2015)
JHEP 10 (2015) 055
Inspire 1389705
Tools
Abstract
The time-integrated $CP$ asymmetry in the decay $D^0 \to K^0_S K^0_S$ is measured using $3 fb^{-1}$ of proton-proton collision data collected by the LHCb experiment at centre-of-mass energies of 7 and 8 TeV. The flavour of the $D^0$ meson is determined by use of the decay $D^{*+} \to D^0 \pi^+$ and its charge conjugate mode. The result is \[ {\cal A}_{CP} = -0.029 \pm 0.052 \pm 0.022, \] where the first uncertainty is statistical and the second systematic. The result is consistent with Standard Model expectations and improves the uncertainty with respect to the only previous measurement of this quantity by more than a factor of three.
Figures and captions
|
Distribution of $\Delta m$ for the control channel $ D ^0 \rightarrow K ^- \pi ^+ $ in (left) linear and in (right) logarithmic scale. The solid (black) line corresponds to the total fit, the dashed (blue) line corresponds to the background, and the dash-dotted (red) line represents the signal contribution. |
Fig1a.pdf [40 KiB] HiDef png [218 KiB] Thumbnail [188 KiB] *.C file |

|
|
Fig1b.pdf [37 KiB] HiDef png [177 KiB] Thumbnail [141 KiB] *.C file |

|
|
|
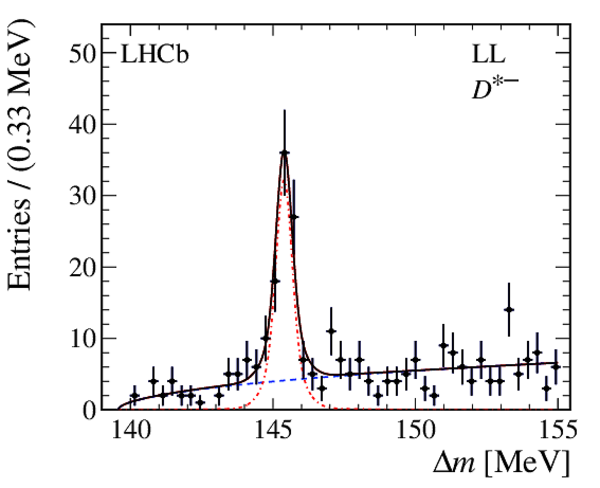
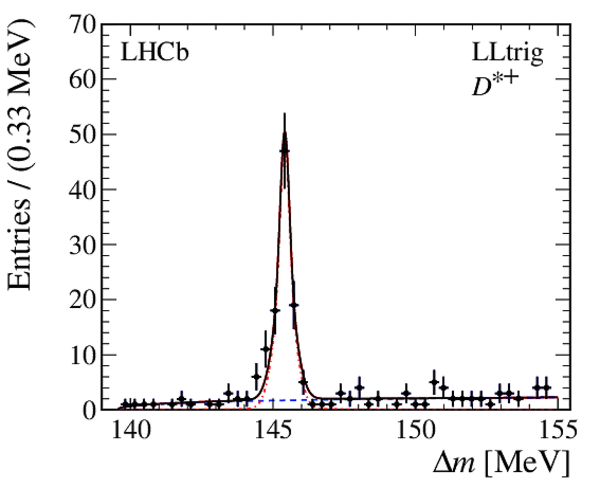
Distributions of $\Delta m$ split into (left) $ D ^{*+}$ , (right) $ D ^{*-}$ and (top) LL , (bottom) LLtrig , including the fit function. The solid (black) line corresponds to the total fit, the dashed (blue) line corresponds to the background, and the dash-dotted (red) line represents the signal contribution. |
Fig2a.pdf [43 KiB] HiDef png [224 KiB] Thumbnail [190 KiB] *.C file |

|
|
Fig2b.pdf [43 KiB] HiDef png [210 KiB] Thumbnail [165 KiB] *.C file |
|
|
|
Fig2c.pdf [43 KiB] HiDef png [195 KiB] Thumbnail [163 KiB] *.C file |
|
|
|
Fig2d.pdf [42 KiB] HiDef png [194 KiB] Thumbnail [160 KiB] *.C file |

|
|
|
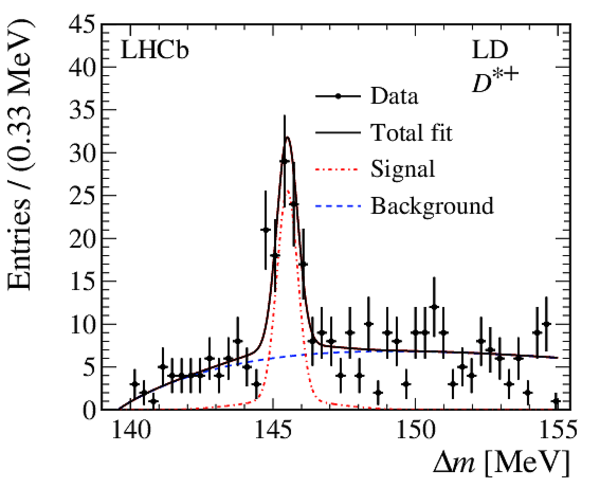
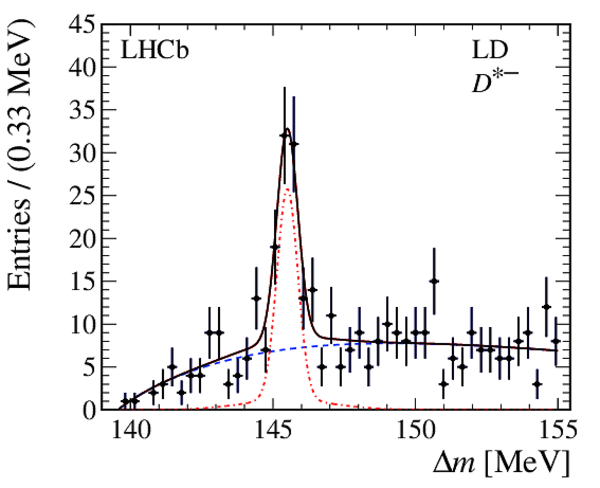
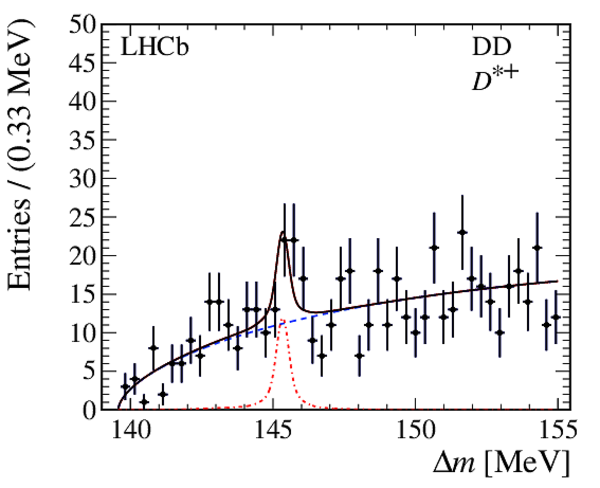
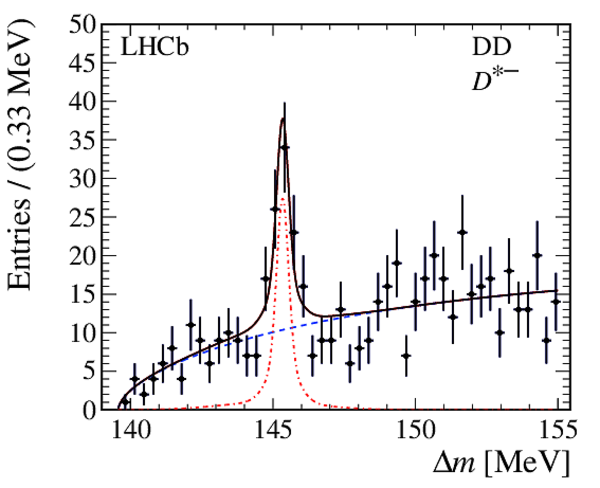
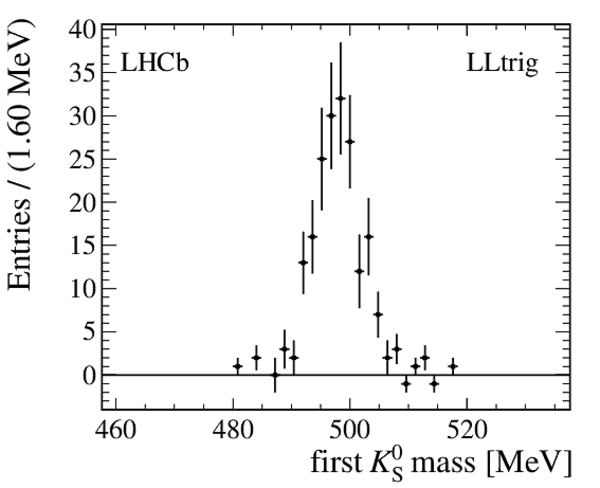
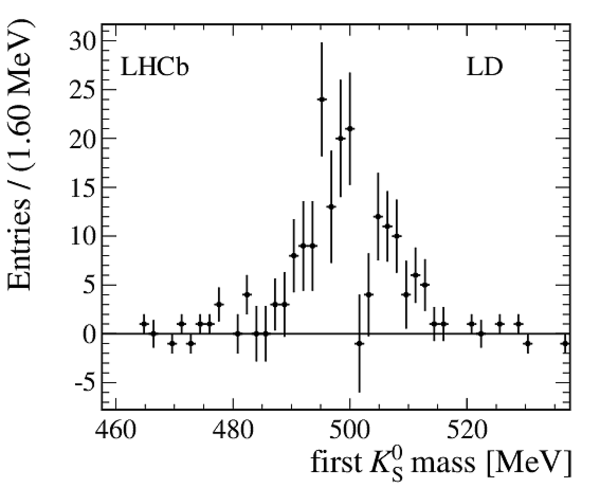
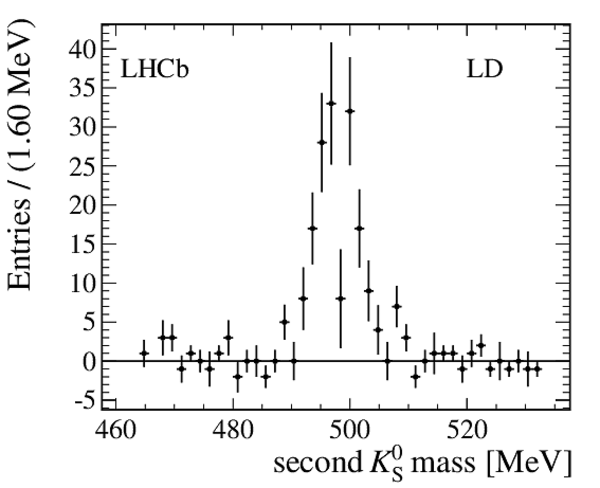
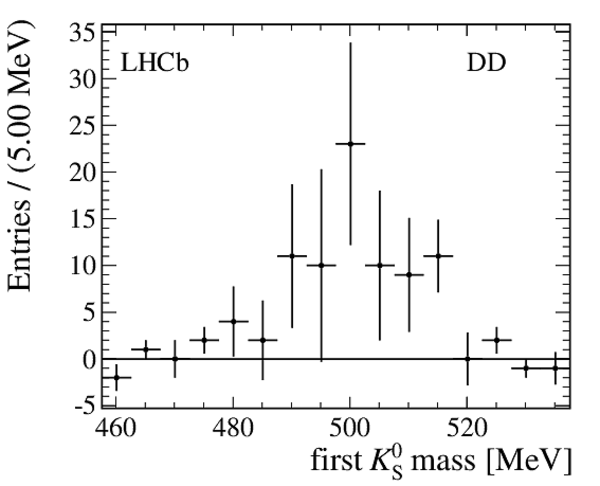
Distributions of $\Delta m$ split into (left) $ D ^{*+}$ , (right) $ D ^{*-}$ and (top) LD , (bottom) DD , including the fit function. The solid (black) line corresponds to the total fit, the dashed (blue) line corresponds to the background, while the dash-dotted (red) line represents the signal contribution. |
Fig3a.pdf [45 KiB] HiDef png [240 KiB] Thumbnail [214 KiB] *.C file |
|
|
Fig3b.pdf [44 KiB] HiDef png [228 KiB] Thumbnail [192 KiB] *.C file |
|
|
|
Fig3c.pdf [43 KiB] HiDef png [219 KiB] Thumbnail [192 KiB] *.C file |
|
|
|
Fig3d.pdf [43 KiB] HiDef png [237 KiB] Thumbnail [201 KiB] *.C file |
|
|
|
Animated gif made out of all figures. |
PAPER-2015-030.gif Thumbnail |

|
![HiDef png [218 KiB]](Directory_LHCb-PAPER-2015-030/hidef_Fig1a.png)
![HiDef png [177 KiB]](Directory_LHCb-PAPER-2015-030/hidef_Fig1b.png)
![HiDef png [224 KiB]](Directory_LHCb-PAPER-2015-030/hidef_Fig2a.png)
![HiDef png [210 KiB]](Directory_LHCb-PAPER-2015-030/hidef_Fig2b.png)
![HiDef png [195 KiB]](Directory_LHCb-PAPER-2015-030/hidef_Fig2c.png)
![HiDef png [194 KiB]](Directory_LHCb-PAPER-2015-030/hidef_Fig2d.png)
![HiDef png [240 KiB]](Directory_LHCb-PAPER-2015-030/hidef_Fig3a.png)
![HiDef png [228 KiB]](Directory_LHCb-PAPER-2015-030/hidef_Fig3b.png)
![HiDef png [219 KiB]](Directory_LHCb-PAPER-2015-030/hidef_Fig3c.png)
![HiDef png [237 KiB]](Directory_LHCb-PAPER-2015-030/hidef_Fig3d.png)
Tables and captions
|
Definition of candidate categories. |
Table_1.pdf [43 KiB] HiDef png [44 KiB] Thumbnail [18 KiB] tex code |

|
|
Number of signal candidates and $ C P$ asymmetry obtained from the fits in the four categories. |
Table_2.pdf [51 KiB] HiDef png [64 KiB] Thumbnail [32 KiB] tex code |

|
![HiDef png [44 KiB]](Directory_LHCb-PAPER-2015-030/hidef_Table_1.png)
![HiDef png [64 KiB]](Directory_LHCb-PAPER-2015-030/hidef_Table_2.png)
Supplementary Material [file]
| Supplementary material full pdf |
supple[..].pdf [173 KiB] |
|
|
This ZIP file contains supplementary material for the publication LHCb-PAPER-2015-030. The files are: supplementary.pdf : An overview of the extra figures *.pdf, *.png, *.eps : The figures in various formats |
Fig1a.pdf [15 KiB] HiDef png [106 KiB] Thumbnail [65 KiB] *C file |
|
|
Fig1b.pdf [15 KiB] HiDef png [111 KiB] Thumbnail [68 KiB] *C file |

|
|
|
Fig1c.pdf [15 KiB] HiDef png [103 KiB] Thumbnail [63 KiB] *C file |
|
|
|
Fig1d.pdf [14 KiB] HiDef png [104 KiB] Thumbnail [62 KiB] *C file |

|
|
|
Fig2a.pdf [16 KiB] HiDef png [107 KiB] Thumbnail [65 KiB] *C file |
|
|
|
Fig2b.pdf [16 KiB] HiDef png [117 KiB] Thumbnail [72 KiB] *C file |
|
|
|
Fig2c.pdf [14 KiB] HiDef png [100 KiB] Thumbnail [61 KiB] *C file |
|
|
|
Fig2d.pdf [14 KiB] HiDef png [101 KiB] Thumbnail [61 KiB] *C file |
|
![HiDef png [106 KiB]](Directory_LHCb-PAPER-2015-030/supplementary/hidef_Fig1a.png)
![HiDef png [111 KiB]](Directory_LHCb-PAPER-2015-030/supplementary/hidef_Fig1b.png)
![HiDef png [103 KiB]](Directory_LHCb-PAPER-2015-030/supplementary/hidef_Fig1c.png)
![HiDef png [104 KiB]](Directory_LHCb-PAPER-2015-030/supplementary/hidef_Fig1d.png)
![HiDef png [107 KiB]](Directory_LHCb-PAPER-2015-030/supplementary/hidef_Fig2a.png)
![HiDef png [117 KiB]](Directory_LHCb-PAPER-2015-030/supplementary/hidef_Fig2b.png)
![HiDef png [100 KiB]](Directory_LHCb-PAPER-2015-030/supplementary/hidef_Fig2c.png)
![HiDef png [101 KiB]](Directory_LHCb-PAPER-2015-030/supplementary/hidef_Fig2d.png)
Created on 27 April 2024.