Study of the production of $\Lambda_b^0$ and $\overline{B}^0$ hadrons in $pp$ collisions and first measurement of the $\Lambda_b^0\rightarrow J/\psi pK^-$ branching fraction
[to restricted-access page]Information
LHCb-PAPER-2015-032
CERN-PH-EP-2015-223
arXiv:1509.00292 [PDF]
(Submitted on 01 Sep 2015)
Chin. Phys. C 40 (2016) 011001
Inspire 1391317
Tools
Abstract
The product of the $\Lambda_b^0$ ($\overline{B}^0$) differential production cross-section and the branching fraction of the decay $\Lambda_b^0\rightarrow J/\psi pK^-$ ($\overline{B}^0\rightarrow J/\psi\overline{K}^*(892)^0$) is measured as a function of the beauty hadron transverse momentum, $p_{\rm T}$, and rapidity, $y$. The kinematic region of the measurements is $p_{\rm T}<20 {\rm GeV}/c$ and $2.0<y<4.5$. The measurements use a data sample corresponding to an integrated luminosity of $3 {\rm fb}^{-1}$ collected by the LHCb detector in $pp$ collisions at centre-of-mass energies $\sqrt{s}=7 {\rm TeV}$ in 2011 and $\sqrt{s}=8 {\rm TeV}$ in 2012. Based on previous LHCb results of the fragmentation fraction ratio, $f_{\Lambda_B^0}/f_d$, the branching fraction of the decay $\Lambda_b^0\rightarrow J/\psi pK^-$ is measured to be \begin{equation*} \mathcal{B}(\Lambda_b^0\rightarrow J/\psi pK^-)= (3.17\pm0.04\pm0.07\pm0.34^{+0.45}_{-0.28})\times10^{-4}, \end{equation*} where the first uncertainty is statistical, the second is systematic, the third is due to the uncertainty on the branching fraction of the decay $\overline{B}^0\rightarrow J/\psi\overline{K}^*(892)^0$, and the fourth is due to the knowledge of $f_{\Lambda_b^0}/f_d$. The sum of the asymmetries in the production and decay between $\Lambda_b^0$ and $\overline{\Lambda}_b^0$ is also measured as a function of $p_{\rm T}$ and $y$. The previously published branching fraction of $\Lambda_b^0\rightarrow J/\psi p\pi^-$, relative to that of $\Lambda_b^0\rightarrow J/\psi pK^-$, is updated. The branching fractions of $\Lambda_b^0\rightarrow P_c^+(\rightarrow J/\psi p)K^-$ are determined.
Figures and captions
|
Fit to the (left) $ { J \mskip -3mu/\mskip -2mu\psi \mskip 2mu} p K ^- $ and (right) $ { J \mskip -3mu/\mskip -2mu\psi \mskip 2mu} \overline{ K }{} {}^{*0} $ invariant mass distributions with $ p_{\rm T} \in[6,7] {\mathrm{ Ge V /}c} $ and $y\in[3.0,3.5]$ for the 2012 data sample. The hatched (red) area represents the signals, the filled (green) area $ B ^0_ s \rightarrow { J \mskip -3mu/\mskip -2mu\psi \mskip 2mu} \overline{ K }{} {}^{*0} $, and the dashed (magenta) lines the combinatorial background. The dot-dashed (black) lines indicate the doubly misidentified background (left) and partially reconstructed background (right). The solid (blue) lines represent the sum of the above components and the points with error bars show the data. |
Lb.pdf [21 KiB] HiDef png [457 KiB] Thumbnail [328 KiB] *.C file |

|
|
Products of production cross-sections and branching fractions as functions of $p_{\rm T}$ in $y$ bins for (left) $\Lambda ^0_ b \rightarrow { J \mskip -3mu/\mskip -2mu\psi \mskip 2mu} p K ^- $ and (right) $\overline{ B }{} {}^0 \rightarrow { J \mskip -3mu/\mskip -2mu\psi \mskip 2mu} \overline{ K }{} {}^{*0} $ . The top (bottom) plots represent the 2011 (2012) sample. The error bars represent the total uncertainties. |
x.pdf [16 KiB] HiDef png [184 KiB] Thumbnail [177 KiB] *.C file |

|
|
x.pdf [16 KiB] HiDef png [194 KiB] Thumbnail [185 KiB] *.C file |
|
|
|
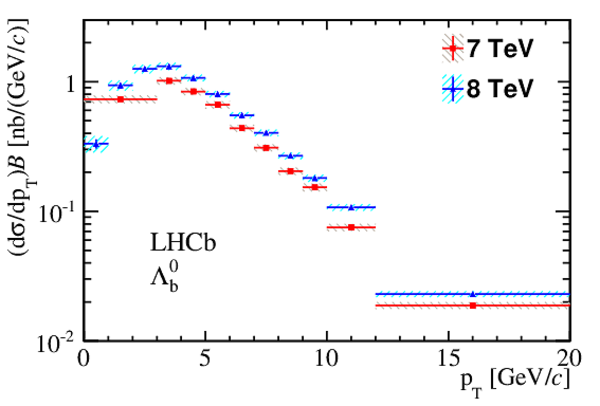
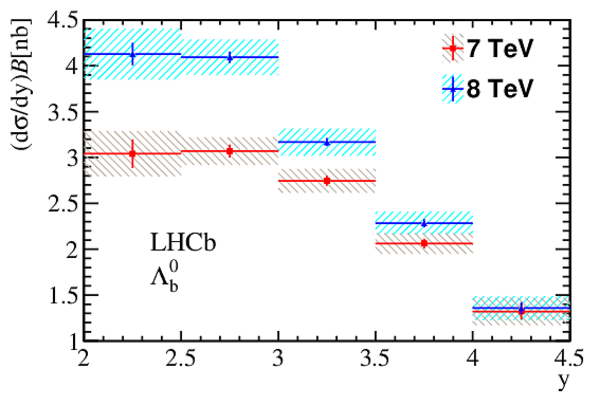
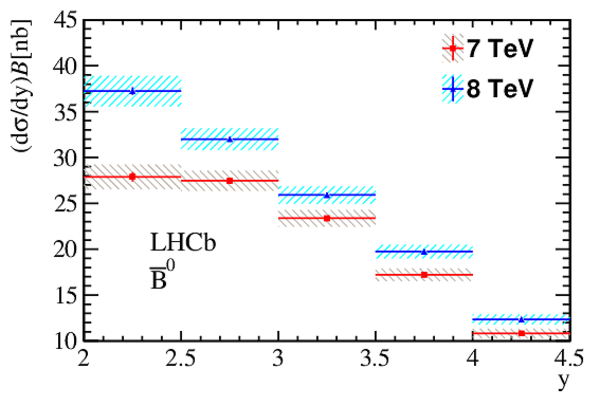
Products of production cross-sections and branching fractions as functions of (top) $p_{\rm T}$ or (bottom) $ y$ . The left (right) plots represent $\Lambda ^0_ b $ ( $\overline{ B }{} {}^0$ ) hadrons. The error bars indicate the statistical uncertainties and the hatched areas represent the total uncertainties. |
Lb_pt.pdf [16 KiB] HiDef png [161 KiB] Thumbnail [131 KiB] *.C file |
|
|
B0_pt.pdf [16 KiB] HiDef png [143 KiB] Thumbnail [121 KiB] *.C file |

|
|
|
Lb_y.pdf [16 KiB] HiDef png [313 KiB] Thumbnail [215 KiB] *.C file |
|
|
|
B0_y.pdf [16 KiB] HiDef png [232 KiB] Thumbnail [178 KiB] *.C file |
|
|
|
Fit to the $\Lambda ^0_ b $ distribution with the Tsallis function. |
Lb_pt_gr.pdf [18 KiB] HiDef png [226 KiB] Thumbnail [167 KiB] *.C file |

|
|
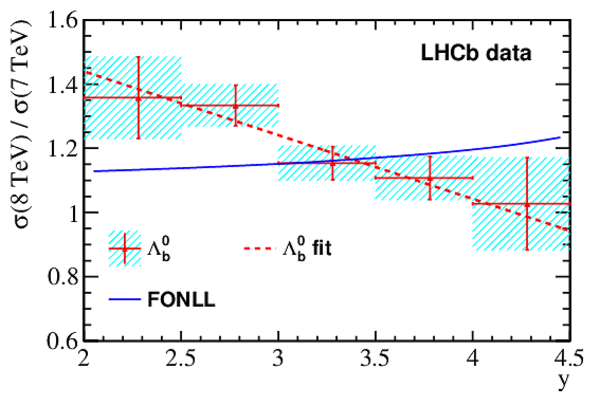
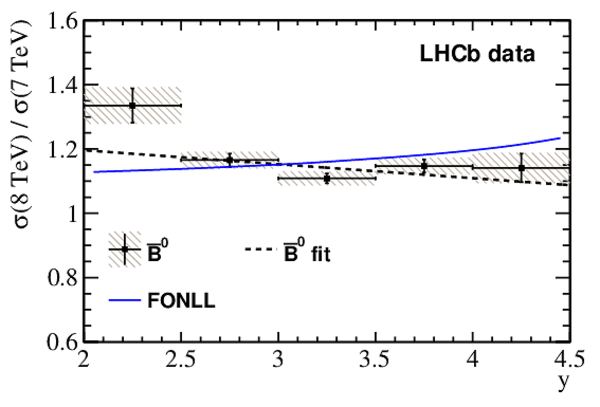
Production ratios of (left) $\Lambda ^0_ b $ and (right) $\overline{ B }{} {}^0 $ at $8\mathrm{ Te V} $ and $7\mathrm{ Te V} $ as functions of the (top) $ p_{\rm T} $ and (bottom) $y$ of the $b$ hadron. The blue lines are FONLL predictions. The error bars represent uncorrelated uncertainties, while the hatched areas show the total uncertainties. Linear fits are also shown. |
ratio_[..].pdf [17 KiB] HiDef png [275 KiB] Thumbnail [193 KiB] *.C file |

|
|
ratio_[..].pdf [17 KiB] HiDef png [253 KiB] Thumbnail [184 KiB] *.C file |

|
|
|
ratio_y_Lb.pdf [16 KiB] HiDef png [276 KiB] Thumbnail [192 KiB] *.C file |
|
|
|
ratio_y_B0.pdf [16 KiB] HiDef png [234 KiB] Thumbnail [172 KiB] *.C file |
|
|
|
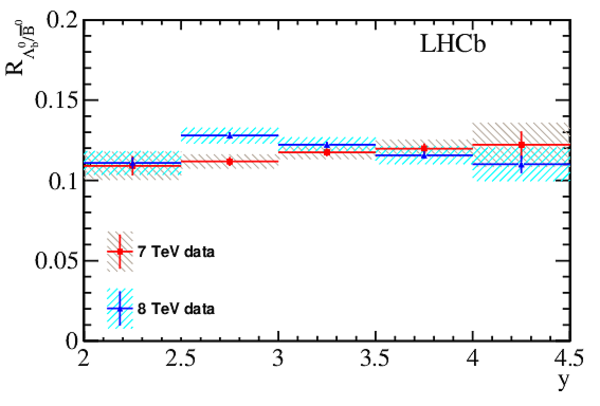
Ratio $ R_{\Lambda ^0_ b /\overline{ B }{} {}^0 } $ as a function of (left) $ p_{\rm T} $ and (right) $y$ for the 2011 and 2012 samples, where the error bars indicate statistical uncertainties and the hatched areas the total uncertainties. The red solid (blue dashed) line in the left plot represents the fit to the ratio $ f_{\Lambda ^0_ b }/f_d ( p_{\rm T} )$ from Ref. [8] for the 2011 (2012) data sample. |
pt.pdf [19 KiB] HiDef png [265 KiB] Thumbnail [178 KiB] *.C file |

|
|
y.pdf [16 KiB] HiDef png [248 KiB] Thumbnail [163 KiB] *.C file |
|
|
|
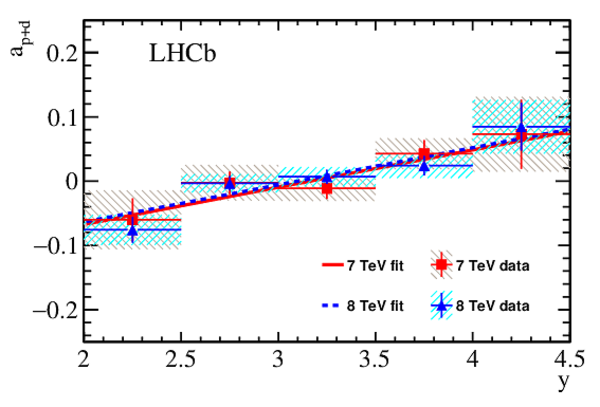
Asymmetries $ a_{\rm p+d}$ between $\Lambda ^0_ b $ and $\overline{\Lambda} {}^0_ b $ as functions of (left) $ p_{\rm T} $ and (right) $y$. The error bars indicate statistical uncertainties, and the hatched areas the total uncertainties. |
apt.pdf [19 KiB] HiDef png [443 KiB] Thumbnail [256 KiB] *.C file |

|
|
ay.pdf [17 KiB] HiDef png [362 KiB] Thumbnail [215 KiB] *.C file |
|
|
|
Animated gif made out of all figures. |
PAPER-2015-032.gif Thumbnail |

|
![HiDef png [457 KiB]](Directory_LHCb-PAPER-2015-032/hidef_Lb.png)
![HiDef png [184 KiB]](Directory_LHCb-PAPER-2015-032/hidef_x.png)
![HiDef png [161 KiB]](Directory_LHCb-PAPER-2015-032/hidef_Lb_pt.png)
![HiDef png [143 KiB]](Directory_LHCb-PAPER-2015-032/hidef_B0_pt.png)
![HiDef png [313 KiB]](Directory_LHCb-PAPER-2015-032/hidef_Lb_y.png)
![HiDef png [232 KiB]](Directory_LHCb-PAPER-2015-032/hidef_B0_y.png)
![HiDef png [226 KiB]](Directory_LHCb-PAPER-2015-032/hidef_Lb_pt_gr.png)
![HiDef png [275 KiB]](Directory_LHCb-PAPER-2015-032/hidef_ratio_pt_Lb.png)
![HiDef png [253 KiB]](Directory_LHCb-PAPER-2015-032/hidef_ratio_pt_B0.png)
![HiDef png [276 KiB]](Directory_LHCb-PAPER-2015-032/hidef_ratio_y_Lb.png)
![HiDef png [234 KiB]](Directory_LHCb-PAPER-2015-032/hidef_ratio_y_B0.png)
![HiDef png [265 KiB]](Directory_LHCb-PAPER-2015-032/hidef_pt.png)
![HiDef png [248 KiB]](Directory_LHCb-PAPER-2015-032/hidef_y.png)
![HiDef png [443 KiB]](Directory_LHCb-PAPER-2015-032/hidef_apt.png)
![HiDef png [362 KiB]](Directory_LHCb-PAPER-2015-032/hidef_ay.png)
Tables and captions
|
Summary of the systematic uncertainties (%) for the production cross-sections of $\Lambda ^0_ b $ and $\overline{ B }{} {}^0 $. The large uncertainties affect the bins with very few candidates. |
Table_1.pdf [68 KiB] HiDef png [97 KiB] Thumbnail [42 KiB] tex code |

|
|
Summary of the absolute systematic uncertainties (%) for the asymmetry of $\Lambda ^0_ b $ and $\overline{\Lambda} {}^0_ b $. The large uncertainties affect the bins with very few candidates. |
Table_2.pdf [32 KiB] HiDef png [60 KiB] Thumbnail [28 KiB] tex code |

|
|
Products of $\Lambda ^0_ b $ production cross-sections ( $\rm pb$ ) and the branching fraction $\cal B (\Lambda ^0_ b \rightarrow { J \mskip -3mu/\mskip -2mu\psi \mskip 2mu} p K ^- )$ in bins of $ p_{\rm T} $ and $y$ in the 2011 data sample. The first uncertainties are statistical and the second are systematic. |
Table_3.pdf [35 KiB] HiDef png [164 KiB] Thumbnail [93 KiB] tex code |

|
|
Products of $\Lambda ^0_ b $ production cross-sections ( $\rm pb$ ) and the branching fraction $\cal B (\Lambda ^0_ b \rightarrow { J \mskip -3mu/\mskip -2mu\psi \mskip 2mu} p K ^- )$ in bins of $p_{\rm T}$ and $ y$ in the 2012 data sample. The first uncertainties are statistical and the second are systematic. |
Table_4.pdf [35 KiB] HiDef png [196 KiB] Thumbnail [104 KiB] tex code |

|
|
Products of $\overline{ B }{} {}^0 $ production cross-sections ( $\rm pb$ ) and $\cal B (\overline{ B }{} {}^0 \rightarrow { J \mskip -3mu/\mskip -2mu\psi \mskip 2mu} \overline{ K }{} {}^{*0} )$ in bins of $ p_{\rm T} $ and $y$ in the 2011 data sample. The first uncertainties are statistical and the second are systematic. |
Table_5.pdf [35 KiB] HiDef png [189 KiB] Thumbnail [92 KiB] tex code |

|
|
Products of $\overline{ B }{} {}^0 $ production cross-sections ($\rm pb $) and $\cal B (\overline{ B }{} {}^0 \rightarrow { J \mskip -3mu/\mskip -2mu\psi \mskip 2mu} \overline{ K }{} {}^{*0} )$ in bins of $ p_{\rm T} $ and $y$ in the 2012 data sample. The first uncertainties are statistical and the second are systematic. |
Table_6.pdf [35 KiB] HiDef png [229 KiB] Thumbnail [112 KiB] tex code |

|
|
Asymmetries $ a_{\rm p+d}$ $(\%)$ of $\Lambda ^0_ b $ and $\overline{\Lambda} {}^0_ b $ in bins of $ p_{\rm T} $ and $y$ for the 2011 and 2012 samples. The first uncertainties are statistical and the second are systematic. |
Table_7.pdf [35 KiB] HiDef png [158 KiB] Thumbnail [82 KiB] tex code |

|
![HiDef png [97 KiB]](Directory_LHCb-PAPER-2015-032/hidef_Table_1.png)
![HiDef png [60 KiB]](Directory_LHCb-PAPER-2015-032/hidef_Table_2.png)
![HiDef png [164 KiB]](Directory_LHCb-PAPER-2015-032/hidef_Table_3.png)
![HiDef png [196 KiB]](Directory_LHCb-PAPER-2015-032/hidef_Table_4.png)
![HiDef png [189 KiB]](Directory_LHCb-PAPER-2015-032/hidef_Table_5.png)
![HiDef png [229 KiB]](Directory_LHCb-PAPER-2015-032/hidef_Table_6.png)
![HiDef png [158 KiB]](Directory_LHCb-PAPER-2015-032/hidef_Table_7.png)
Created on 26 April 2024.