Measurement of the forward-backward asymmetry in $Z/\gamma^{\ast} \rightarrow \mu^{+}\mu^{-}$ decays and determination of the effective weak mixing angle
[to restricted-access page]Information
LHCb-PAPER-2015-039
CERN-PH-EP-2015-250
arXiv:1509.07645 [PDF]
(Submitted on 25 Sep 2015)
JHEP 11 (2015) 190
Inspire 1394859
Tools
Abstract
The forward-backward charge asymmetry for the process $q\bar{q} \rightarrow Z/\gamma^{\ast} \rightarrow \mu^{+}\mu^{-}$ is measured as a function of the invariant mass of the dimuon system. Measurements are performed using proton proton collision data collected with the LHCb detector at $\sqrt{s} = 7$ and 8\tev, corresponding to integrated luminosities of $1$fb$^{-1}$ and $2$fb$^{-1}$ respectively. Within the Standard Model the results constrain the effective electroweak mixing angle to be $$sin^{2}\theta_{W}^{eff} = 0.23142 \pm 0.00073 \pm 0.00052 \pm 0.00056 $$ where the first uncertainty is statistical, the second systematic and the third theoretical. This result is in agreement with the current world average, and is one of the most precise determinations at hadron colliders to date.
Figures and captions
|
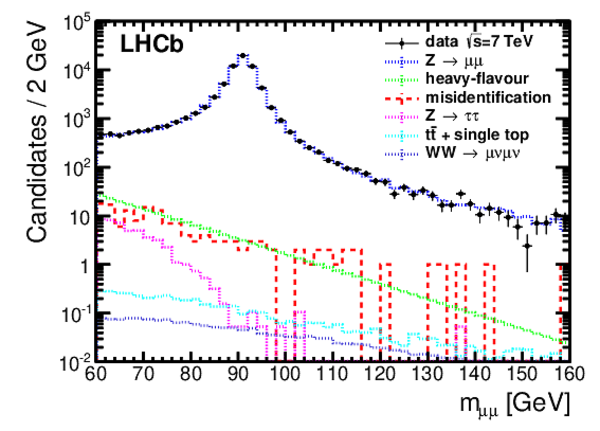
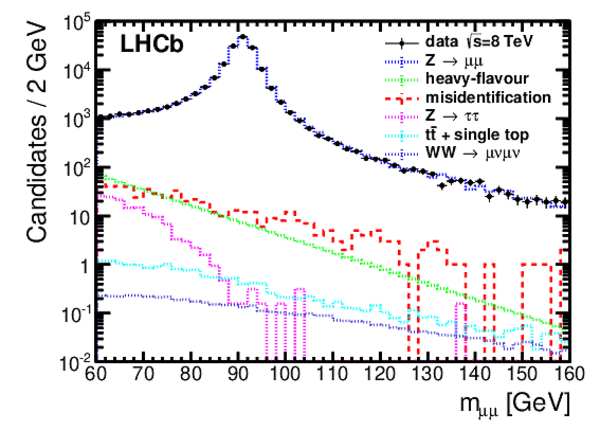
Dimuon invariant mass distribution for data, simulated signal and background processes for (left) { $\sqrt{s}$ $=$ 7 TeV} and (right) { $\sqrt{s}$ $=$ 8 TeV}. |
AfterC[..].pdf [11 KiB] HiDef png [338 KiB] Thumbnail [266 KiB] *.C file |
|
|
AfterC[..].pdf [11 KiB] HiDef png [344 KiB] Thumbnail [269 KiB] *.C file |
|
|
|
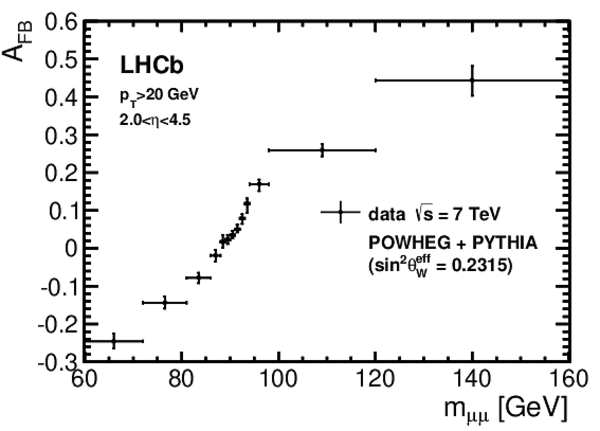
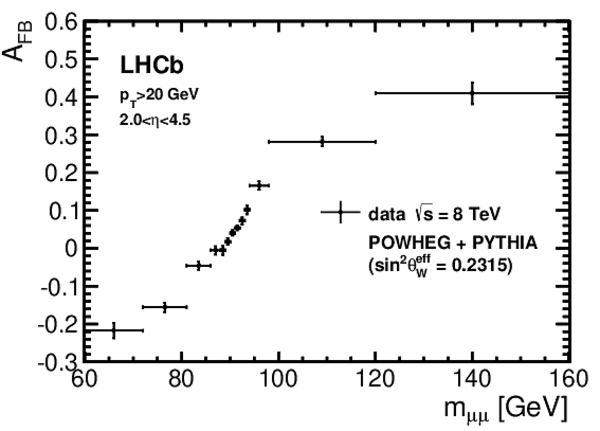
The measurements of $ A_\text{FB}$ as a function of the dimuon invariant mass for data compared to SM predictions for (left) {$\sqrt{s} = 7$ TeV} and (right) {$\sqrt{s} = 8$ TeV}. The SM predictions are calculated using Powheg interfaced with Pythia for parton showering with the world average value for $ {\sin}^{2}\theta_{\mathrm{W}}^{\mathrm{eff}} =0.2315$ [27]. The data include both statistical and systematic uncertainties, and the SM predictions include the theoretical uncertainties described in Sec. 5. |
Paper_[..].pdf [6 KiB] HiDef png [240 KiB] Thumbnail [63 KiB] *.C file |
|
|
Paper_[..].pdf [6 KiB] HiDef png [238 KiB] Thumbnail [63 KiB] *.C file |
|
|
|
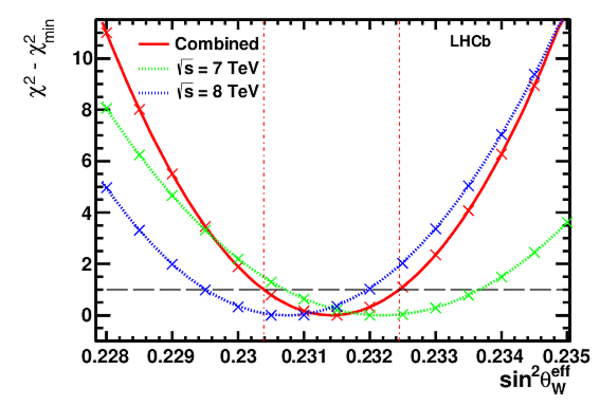
Difference between the $\chi^2$ and the minimum $\chi^2$ obtained by comparing the final $ A_\text{FB}(m_{\mu\mu})$ measurements in data to $ A_\text{FB}^{\text{pred}}$ calculated using values of $ {\sin}^{2}\theta_{\mathrm{W}}^{\mathrm{eff}}$ ranging from 0.22 to 0.24, indicated by the crosses on the plot. A quadratic fit is used to determine the minimum value for $ {\sin}^{2}\theta_{\mathrm{W}}^{\mathrm{eff}}$ and the corresponding uncertainty, and is shown for the different centre-of-mass energies and the combination. The black dashed horizontal line corresponds to one unit of $\chi^2$ from the minimum and the intersecting $ {\sin}^{2}\theta_{\mathrm{W}}^{\mathrm{eff}}$ for the combination are indicated by the vertical red dashed lines. |
chi_pl[..].pdf [6 KiB] HiDef png [233 KiB] Thumbnail [178 KiB] *.C file |
|
|
A comparison of the $ {\sin}^{2}\theta_{\mathrm{W}}^{\mathrm{eff}}$ measurement at LHCb and other experiments. The combined LEP and SLD measurement is indicated by the vertical yellow band. |
stw_co[..].pdf [5 KiB] HiDef png [218 KiB] Thumbnail [190 KiB] *.C file |

|
|
Animated gif made out of all figures. |
PAPER-2015-039.gif Thumbnail |

|
![HiDef png [338 KiB]](Directory_LHCb-PAPER-2015-039/hidef_AfterCommonHits_ZMass_Paper_rebin2011_new.png)
![HiDef png [344 KiB]](Directory_LHCb-PAPER-2015-039/hidef_AfterCommonHits_ZMass_Paper_rebin2012_new.png)
![HiDef png [240 KiB]](Directory_LHCb-PAPER-2015-039/hidef_Paper_afb_statsyst2011_theo.png)
![HiDef png [238 KiB]](Directory_LHCb-PAPER-2015-039/hidef_Paper_afb_statsyst2012_theo.png)
![HiDef png [233 KiB]](Directory_LHCb-PAPER-2015-039/hidef_chi_plot_all.png)
![HiDef png [218 KiB]](Directory_LHCb-PAPER-2015-039/hidef_stw_comp_fullref_final.png)
Tables and captions
|
Weighted average of the absolute systematic uncertainties for $ A_\text{FB}$ , for different sources, given separately for $\sqrt{s}$ $=$ 7 and 8 TeV. |
Table_1.pdf [33 KiB] HiDef png [56 KiB] Thumbnail [25 KiB] tex code |

|
|
Values for $ A_\text{FB}$ with the statistical and positive and negative systematic uncertainties for { $\sqrt{s}$ $= 7$ TeV} data. The theoretical uncertainties presented in this table, corresponding to the PDF, scale and FSR uncertainties described in Sec. 5, affect only the predictions of $ A_\text{FB}$ and the $ {\sin}^{2}\theta_{\mathrm{W}}^{\mathrm{eff}}$ determination, and do not apply to the uncertainties on the measured $ A_\text{FB}$ . |
Table_2.pdf [55 KiB] HiDef png [141 KiB] Thumbnail [66 KiB] tex code |

|
|
Values for $ A_\text{FB}$ with the statistical and positive and negative systematic uncertainties for { $\sqrt{s}$ $= 8$ TeV} data. The theoretical uncertainties presented in this table, corresponding to the PDF, scale and FSR uncertainties described in Sec. 5, affect only the predictions of $ A_\text{FB}$ and the $ {\sin}^{2}\theta_{\mathrm{W}}^{\mathrm{eff}}$ determination, and do not apply to the uncertainties on the measured $ A_\text{FB}$ . |
Table_3.pdf [55 KiB] HiDef png [134 KiB] Thumbnail [65 KiB] tex code |

|
|
Weighted average of the absolute systematic uncertainties for $ A_\text{FB}^{\text{pred}}$ , for the different sources of theoretical uncertainty. The value quoted for the PDF uncertainty corresponds to the $68\%$ confidence range, while for the others the maximum and minimum shifts are given. The correlations among the invariant mass bins are not taken into account. |
Table_4.pdf [55 KiB] HiDef png [65 KiB] Thumbnail [28 KiB] tex code |

|
![HiDef png [56 KiB]](Directory_LHCb-PAPER-2015-039/hidef_Table_1.png)
![HiDef png [141 KiB]](Directory_LHCb-PAPER-2015-039/hidef_Table_2.png)
![HiDef png [134 KiB]](Directory_LHCb-PAPER-2015-039/hidef_Table_3.png)
![HiDef png [65 KiB]](Directory_LHCb-PAPER-2015-039/hidef_Table_4.png)
Supplementary Material [file]
| Supplementary material full pdf |
supple[..].pdf [209 KiB] |

|
|
A PDF of the supplemetary material is included called supplementary.pdf. The tables from the supplementary material are included as PDF files. |
Table5.pdf [18 KiB] HiDef png [142 KiB] Thumbnail [54 KiB] *C file |

|
|
Table6.pdf [22 KiB] HiDef png [125 KiB] Thumbnail [47 KiB] *C file |

|
|
|
Table7.pdf [22 KiB] HiDef png [127 KiB] Thumbnail [47 KiB] *C file |

|
![HiDef png [142 KiB]](Directory_LHCb-PAPER-2015-039/supplementary/hidef_Table5.png)
![HiDef png [125 KiB]](Directory_LHCb-PAPER-2015-039/supplementary/hidef_Table6.png)
![HiDef png [127 KiB]](Directory_LHCb-PAPER-2015-039/supplementary/hidef_Table7.png)
Created on 27 April 2024.