Measurement of forward $W$ and $Z$ boson production in $pp$ collisions at $\sqrt{s} = 8\mathrm{ Te V}$
[to restricted-access page]Information
LHCb-PAPER-2015-049
CERN-PH-EP-2015-301
arXiv:1511.08039 [PDF]
(Submitted on 25 Nov 2015)
JHEP 01 (2016) 155
Inspire 1406555
Tools
Abstract
Measurements are presented of electroweak boson production using data from $pp$ collisions at a centre-of-mass energy of $\sqrt{s} = 8\mathrm{ Te V}$. The analysis is based on an integrated luminosity of $2.0\mathrm{ fb}^{-1}$ recorded with the LHCb detector. The bosons are identified in the $W\rightarrow\mu\nu$ and $Z\rightarrow\mu^{+}\mu^{-}$ decay channels. The cross-sections are measured for muons in the pseudorapidity range $2.0 < \eta < 4.5$, with transverse momenta $p_{\rm T} > 20{\mathrm{ Ge V /}c}$ and, in the case of the $Z$ boson, a dimuon mass within $60 < M_{\mu^{+}\mu^{-}} < 120{\mathrm{ Ge V /}c^{2}}$. The results are \begin{align*} \sigma_{W^{+}\rightarrow\mu^{+}\nu} &= 1093.6 \pm 2.1 \pm 7.2 \pm 10.9 \pm 12.7{\rm pb} , \sigma_{W^{-}\rightarrow\mu^{-}\bar{\nu}} &= \phantom{0}818.4 \pm 1.9 \pm 5.0 \pm \phantom{0}7.0 \pm \phantom{0}9.5{\rm pb} , \sigma_{Z\rightarrow\mu^{+}\mu^{-}} &= \phantom{00}95.0 \pm 0.3 \pm 0.7 \pm \phantom{0}1.1 \pm \phantom{0}1.1{\rm pb} , \end{align*} where the first uncertainties are statistical, the second are systematic, the third are due to the knowledge of the LHC beam energy and the fourth are due to the luminosity determination. The evolution of the $W$ and $Z$ boson cross-sections with centre-of-mass energy is studied using previously reported measurements with $1.0\mathrm{ fb}^{-1}$ of data at $7\mathrm{ Te V}$. Differential distributions are also presented. Results are in good agreement with theoretical predictions at next-to-next-to-leading order in perturbative quantum chromodynamics.
Figures and captions
|
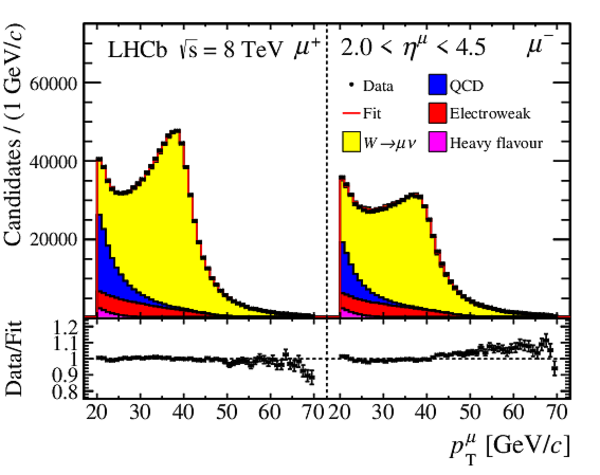
(left) Template fit to the (left panel) positive and (right panel) negative muon $p_{\rm T}$ spectra in the full $\eta^{\mu} $ range for $ W $ candidates. Data are compared to fitted contributions from $ W \rightarrow \mu\nu $ signal and QCD, electroweak and heavy flavour backgrounds. (right) Invariant mass distribution of dimuon pairs in the $ Z $ candidate sample. |
Fig1l.pdf [39 KiB] HiDef png [252 KiB] Thumbnail [230 KiB] *.C file |
|
|
Fig1r.pdf [21 KiB] HiDef png [162 KiB] Thumbnail [145 KiB] *.C file |

|
|
|
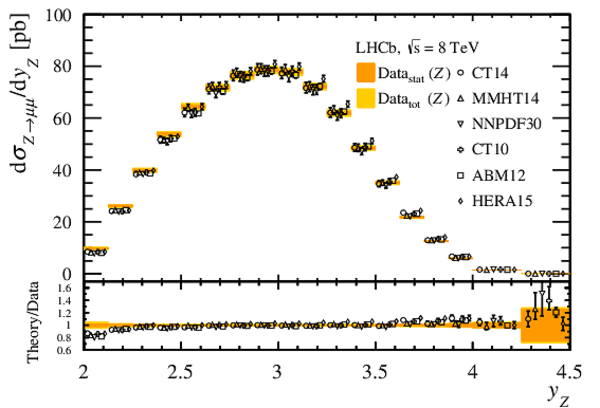
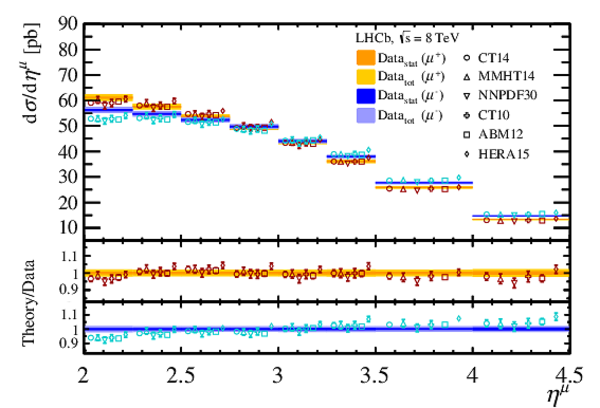
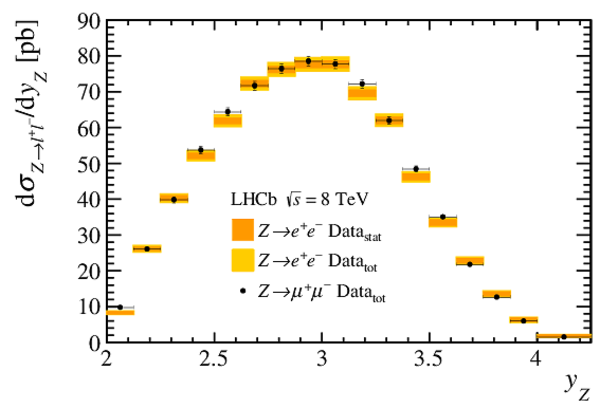
(top) Differential $ W ^+$ and $ W ^-$ boson production cross-section in bins of muon pseudorapidity. (bottom) Differential $ Z $ boson production cross-section in bins of boson rapidity. Measurements, represented as bands, are compared to (markers, displaced horizontally for presentation) NNLO predictions with different parameterisations of the PDFs. |
Fig2t.pdf [29 KiB] HiDef png [364 KiB] Thumbnail [239 KiB] *.C file |

|
|
Fig2b.pdf [25 KiB] HiDef png [258 KiB] Thumbnail [192 KiB] *.C file |
|
|
|
Summary of the $ W $ and $ Z $ cross-sections. Measurements, represented as bands, are compared to (markers) NNLO predictions with different parameterisations of the PDFs . |
Fig3.pdf [15 KiB] HiDef png [201 KiB] Thumbnail [180 KiB] *.C file |

|
|
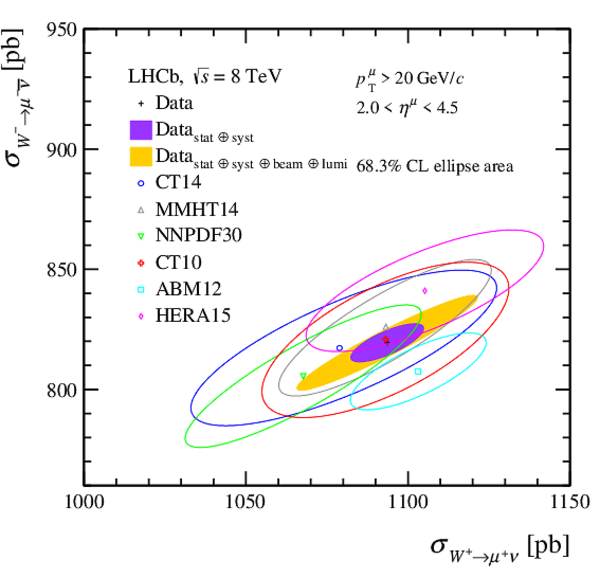
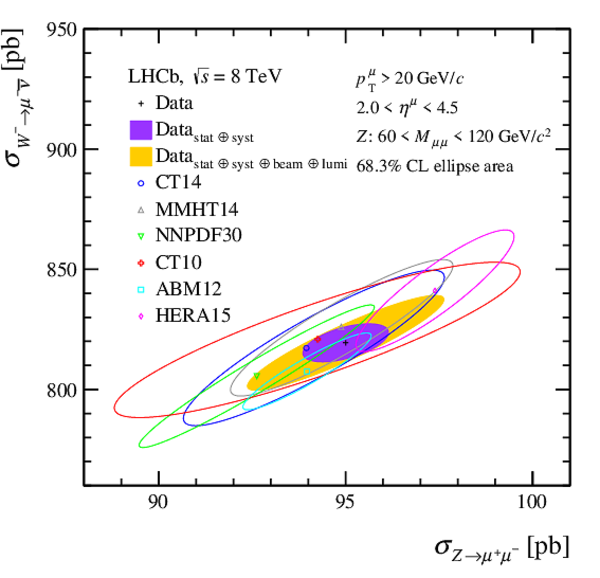
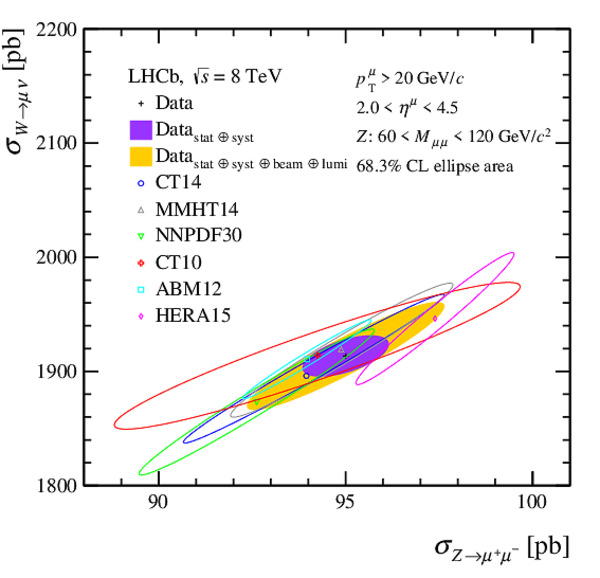
Two-dimensional plots of electroweak boson cross-sections compared to NNLO predictions for various parameterisations of the PDFs. The uncertainties on the theoretical predictions correspond to the PDF uncertainty only. All ellipses correspond to uncertainties at 68.3$\%$ CL. |
Fig4tl.pdf [67 KiB] HiDef png [304 KiB] Thumbnail [223 KiB] *.C file |
|
|
Fig4tr.pdf [67 KiB] HiDef png [317 KiB] Thumbnail [234 KiB] *.C file |

|
|
|
Fig4bl.pdf [67 KiB] HiDef png [323 KiB] Thumbnail [230 KiB] *.C file |
|
|
|
Fig4br.pdf [66 KiB] HiDef png [321 KiB] Thumbnail [228 KiB] *.C file |
|
|
|
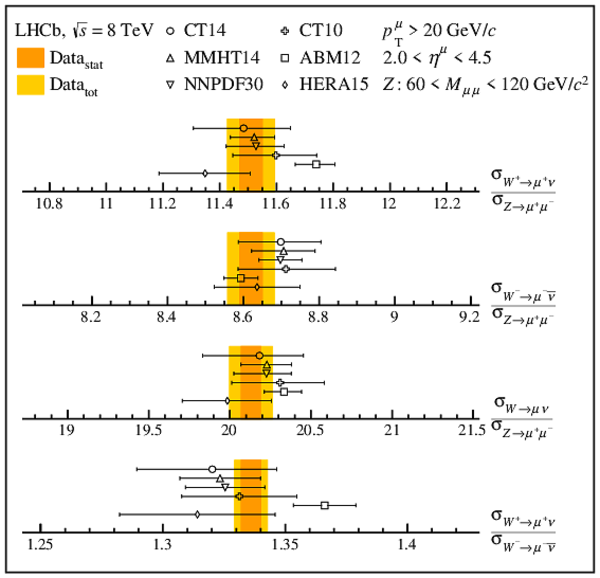
Summary of the cross-section ratios. Measurements, represented as bands, are compared to (markers) NNLO predictions with different parameterisations of the PDFs. |
Fig5.pdf [16 KiB] HiDef png [212 KiB] Thumbnail [202 KiB] *.C file |
|
|
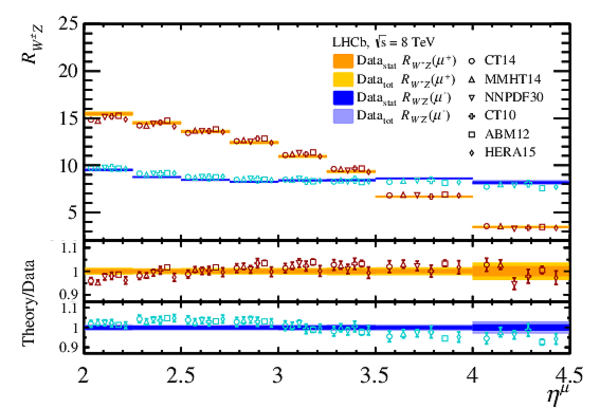
(top) $ W ^+$ to $ W ^-$ cross-section ratio in bins of muon pseudorapidity. (bottom) $ W ^+$ ( $ W ^-$ ) to $ Z $ cross-section ratio in bins of $\mu ^+$ ( $\mu ^-$ ) pseudorapidity. Measurements, represented as bands, are compared to (markers, displaced horizontally for presentation) NNLO predictions with different parameterisations of the PDFs. |
Fig6t.pdf [21 KiB] HiDef png [216 KiB] Thumbnail [175 KiB] *.C file |
|
|
Fig6b.pdf [25 KiB] HiDef png [341 KiB] Thumbnail [232 KiB] *.C file |
|
|
|
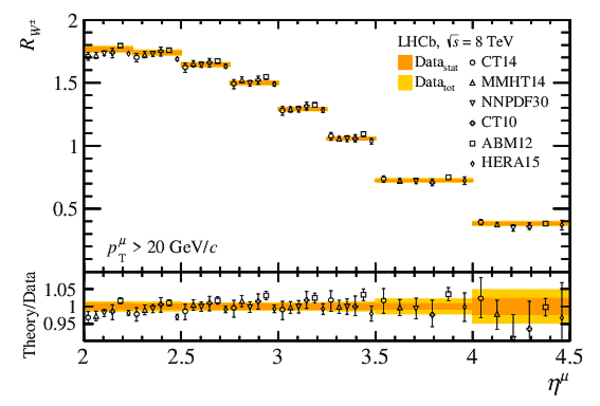
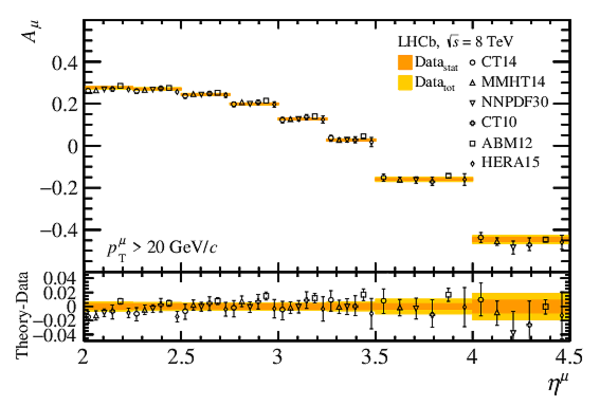
$ W $ production charge asymmetry in bins of muon pseudorapidity. Measurements, represented as bands, are compared to (markers, displaced horizontally for presentation) NNLO predictions with different parameterisations of the PDFs. |
Fig7.pdf [21 KiB] HiDef png [227 KiB] Thumbnail [190 KiB] *.C file |
|
|
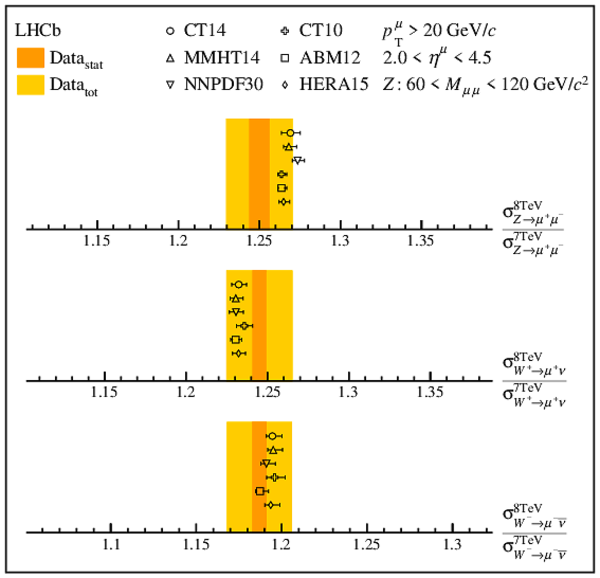
Summary of the $ W $ and $ Z $ cross-section ratios at different centre-of-mass energies. Measurements, represented as bands, are compared to (markers) NNLO predictions with different parameterisations of the PDFs. |
Fig8.pdf [15 KiB] HiDef png [190 KiB] Thumbnail [166 KiB] *.C file |
|
|
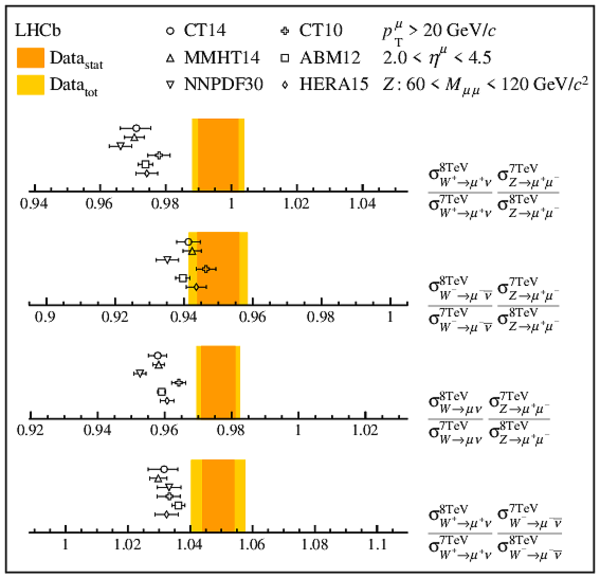
Summary of the cross-section double ratios at different centre-of-mass energies. Measurements, represented as bands, are compared to (markers) NNLO predictions with different parameterisations of the PDFs. |
Fig9.pdf [17 KiB] HiDef png [260 KiB] Thumbnail [243 KiB] *.C file |
|
|
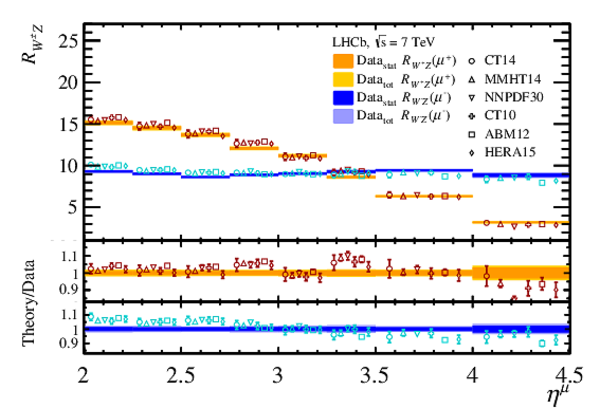
Double ratios of cross-sections at different centre-of-mass energies as a function of muon pseudorapidity. Measurements, represented as bands, are compared to (markers, displaced horizontally for presentation) NNLO predictions with different parameterisations of the PDFs. |
Fig10.pdf [28 KiB] HiDef png [347 KiB] Thumbnail [235 KiB] *.C file |

|
|
Animated gif made out of all figures. |
PAPER-2015-049.gif Thumbnail |

|
Tables and captions
|
Summary of the relative uncertainties on the $ W ^+$ , $ W ^-$ and $ Z $ boson cross-sections. |
Table_1.pdf [55 KiB] HiDef png [95 KiB] Thumbnail [43 KiB] tex code |

|
|
Summary of the relative uncertainties on the $ R_{ W ^\pm }$ , $ R_{ W ^+ Z }$ , $ R_{ W ^- Z }$ and $ R_{ W Z }$ cross-section ratios. |
Table_2.pdf [47 KiB] HiDef png [113 KiB] Thumbnail [53 KiB] tex code |

|
|
Summary of the relative uncertainties on the electroweak boson cross-section ratios at different centre-of-mass energies. |
Table_3.pdf [63 KiB] HiDef png [110 KiB] Thumbnail [48 KiB] tex code |

|
|
Cross-section for (top) $ W ^+$ and (bottom) $ W ^-$ boson production in bins of muon pseudorapidity. The first uncertainties are statistical, the second are systematic, the third are due to the knowledge of the LHC beam energy and the fourth are due to the luminosity measurement. The last column lists the final-state radiation correction. |
Table_4.pdf [64 KiB] HiDef png [83 KiB] Thumbnail [36 KiB] tex code |

|
|
Cross-section for $ Z $ boson production in bins of boson rapidity. The first uncertainties are statistical, the second are systematic, the third are due to the knowledge of the LHC beam energy and the fourth are due to the luminosity measurement. The last column lists the final-state radiation correction. |
Table_5.pdf [64 KiB] HiDef png [232 KiB] Thumbnail [112 KiB] tex code |

|
|
Cross-section for $ Z $ boson production in bins of boson transverse momentum. The first uncertainties are statistical, the second are systematic, the third are due to the knowledge of the LHC beam energy and the fourth are due to the luminosity measurement. The last column lists the final-state radiation correction. |
Table_6.pdf [71 KiB] HiDef png [177 KiB] Thumbnail [83 KiB] tex code |

|
|
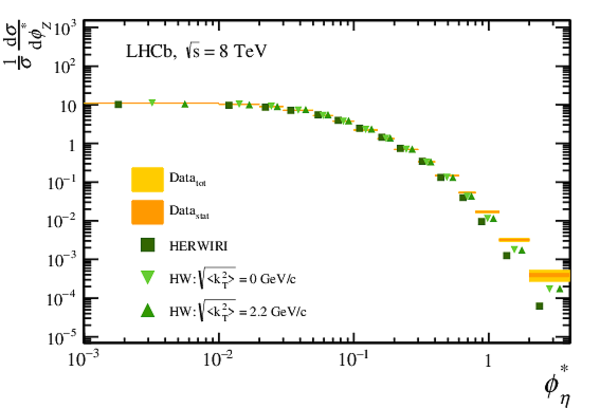
Cross-section for $ Z $ boson production in bins of boson $\phi^{*}_{\eta}$ . The first uncertainties are statistical, the second are systematic, the third are due to the knowledge of the LHC beam energy and the fourth are due to the luminosity measurement. The last column lists the final-state radiation correction. |
Table_7.pdf [64 KiB] HiDef png [190 KiB] Thumbnail [88 KiB] tex code |

|
|
Cross-section for $ Z $ boson production in bins of muon pseudorapidity. The first uncertainties are statistical, the second are systematic, the third are due to the knowledge of the LHC beam energy and the fourth are due to the luminosity measurement. The last column lists the final-state radiation correction. |
Table_8.pdf [64 KiB] HiDef png [81 KiB] Thumbnail [34 KiB] tex code |

|
|
(Top) $ W ^+$ and (bottom) $ W ^-$ to $ Z $ cross-section ratios in bins of muon pseudorapidity. The first uncertainties are statistical, the second are systematic, the third are due to the knowledge of the LHC beam energy and the fourth are due to the luminosity measurement. |
Table_9.pdf [48 KiB] HiDef png [88 KiB] Thumbnail [38 KiB] tex code |

|
|
$ W ^+$ to $ W ^-$ cross-section ratio in bins of muon pseudorapidity. The first uncertainties are statistical, the second are systematic and the third are due to the knowledge of the LHC beam energy. |
Table_10.pdf [41 KiB] HiDef png [139 KiB] Thumbnail [64 KiB] tex code |

|
|
Lepton charge asymmetry in bins of muon pseudorapidity. The first uncertainties are statistical, the second are systematic and the third are due to the knowledge of the LHC beam energy. |
Table_11.pdf [34 KiB] HiDef png [135 KiB] Thumbnail [66 KiB] tex code |

|
|
Ratios of (top) $ W ^+$ and (bottom) $ W ^-$ to $ Z $ cross-section ratios at different centre-of-mass energies in bins of muon pseudorapidity. The first uncertainty is statistical and the second is systematic. |
Table_12.pdf [63 KiB] HiDef png [103 KiB] Thumbnail [46 KiB] tex code |

|
|
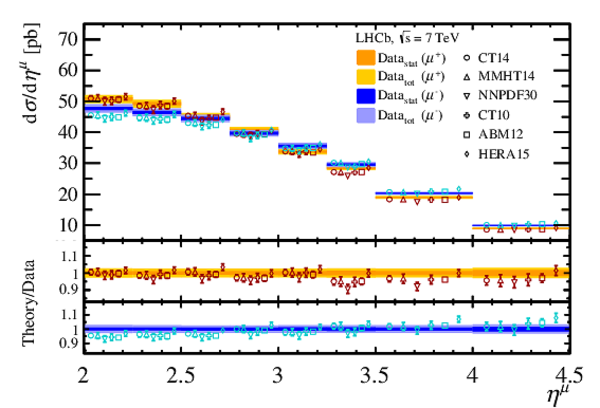
Cross-section for $ Z $ boson production in bins of muon pseudorapidity at $\sqrt{s}$ = 7 TeV. The first uncertainties are statistical, the second are systematic, the third are due to the knowledge of the LHC beam energy and the fourth are due to the luminosity measurement. The last column lists the final-state radiation correction. |
Table_13.pdf [64 KiB] HiDef png [79 KiB] Thumbnail [34 KiB] tex code |

|
|
(Top) $ W ^+$ and (bottom) $ W ^-$ to $ Z $ cross-section ratios in bins of muon pseudorapidity at $\sqrt{s}$ = 7 TeV. The first uncertainties are statistical, the second are systematic, the third are due to the knowledge of the LHC beam energy and the fourth are due to the luminosity measurement. |
Table_14.pdf [48 KiB] HiDef png [86 KiB] Thumbnail [38 KiB] tex code |

|
|
Correlation coefficients between the differential $ W ^+$ and $ W ^-$ cross-sections in bins of muon $\eta$. The LHC beam energy and luminosity uncertainties, which are fully correlated between cross-section measurements, are excluded. |
Table_15.pdf [57 KiB] HiDef png [71 KiB] Thumbnail [27 KiB] tex code |

|
|
Correlation coefficients between the differential $ Z $ cross-section in bins of $ y_{ Z }$ . The LHC beam energy and luminosity uncertainties, which are fully correlated between cross-section measurements, are excluded. |
Table_16.pdf [35 KiB] HiDef png [73 KiB] Thumbnail [25 KiB] tex code |

|
|
Correlation coefficients between the differential $ Z $ cross-section in bins of $ p_{\textrm{T}, Z }$ . The LHC beam energy and luminosity uncertainties, which are fully correlated between cross-section measurements, are excluded. |
Table_17.pdf [37 KiB] HiDef png [62 KiB] Thumbnail [23 KiB] tex code |

|
|
Correlation coefficients between the differential $ Z $ cross-section in bins of $\phi^{*}_{\eta}$ . The LHC beam energy and luminosity uncertainties, which are fully correlated between cross-section measurements, are excluded. |
Table_18.pdf [42 KiB] HiDef png [68 KiB] Thumbnail [23 KiB] tex code |

|
|
Correlation coefficients between differential $ W $ and $ Z $ cross-sections in bins of muon $\eta$ and $ y_{ Z }$ , respectively. The LHC beam energy and luminosity uncertainties, which are fully correlated between cross-section measurements, are excluded. |
Table_19.pdf [44 KiB] HiDef png [102 KiB] Thumbnail [38 KiB] tex code |

|
|
Correlation coefficients between the differential $ Z $ cross-sections in bins of (top) $\eta^{\mu^{+}}$ and (bottom) $\eta^{\mu^{-}}$ . The LHC beam energy and luminosity uncertainties, which are fully correlated between cross-section measurements, are excluded. |
Table_20.pdf [48 KiB] HiDef png [36 KiB] Thumbnail [13 KiB] tex code |

|
|
Correlation coefficients between the differential $ W $ and $ Z $ cross-sections in bins of (top) $\eta^{\mu^{+}}$ and (bottom) $\eta^{\mu^{-}}$ . The LHC beam energy and luminosity uncertainties, which are fully correlated between cross-section measurements, are excluded. |
Table_21.pdf [49 KiB] HiDef png [46 KiB] Thumbnail [17 KiB] tex code |

|
Supplementary Material [file]


![HiDef png [252 KiB]](Directory_LHCb-PAPER-2015-049/hidef_Fig1l.png)
![HiDef png [162 KiB]](Directory_LHCb-PAPER-2015-049/hidef_Fig1r.png)
![HiDef png [364 KiB]](Directory_LHCb-PAPER-2015-049/hidef_Fig2t.png)
![HiDef png [258 KiB]](Directory_LHCb-PAPER-2015-049/hidef_Fig2b.png)
![HiDef png [201 KiB]](Directory_LHCb-PAPER-2015-049/hidef_Fig3.png)
![HiDef png [304 KiB]](Directory_LHCb-PAPER-2015-049/hidef_Fig4tl.png)
![HiDef png [317 KiB]](Directory_LHCb-PAPER-2015-049/hidef_Fig4tr.png)
![HiDef png [323 KiB]](Directory_LHCb-PAPER-2015-049/hidef_Fig4bl.png)
![HiDef png [321 KiB]](Directory_LHCb-PAPER-2015-049/hidef_Fig4br.png)
![HiDef png [212 KiB]](Directory_LHCb-PAPER-2015-049/hidef_Fig5.png)
![HiDef png [216 KiB]](Directory_LHCb-PAPER-2015-049/hidef_Fig6t.png)
![HiDef png [341 KiB]](Directory_LHCb-PAPER-2015-049/hidef_Fig6b.png)
![HiDef png [227 KiB]](Directory_LHCb-PAPER-2015-049/hidef_Fig7.png)
![HiDef png [190 KiB]](Directory_LHCb-PAPER-2015-049/hidef_Fig8.png)
![HiDef png [260 KiB]](Directory_LHCb-PAPER-2015-049/hidef_Fig9.png)
![HiDef png [347 KiB]](Directory_LHCb-PAPER-2015-049/hidef_Fig10.png)
![HiDef png [95 KiB]](Directory_LHCb-PAPER-2015-049/hidef_Table_1.png)
![HiDef png [113 KiB]](Directory_LHCb-PAPER-2015-049/hidef_Table_2.png)
![HiDef png [110 KiB]](Directory_LHCb-PAPER-2015-049/hidef_Table_3.png)
![HiDef png [83 KiB]](Directory_LHCb-PAPER-2015-049/hidef_Table_4.png)
![HiDef png [232 KiB]](Directory_LHCb-PAPER-2015-049/hidef_Table_5.png)
![HiDef png [177 KiB]](Directory_LHCb-PAPER-2015-049/hidef_Table_6.png)
![HiDef png [190 KiB]](Directory_LHCb-PAPER-2015-049/hidef_Table_7.png)
![HiDef png [81 KiB]](Directory_LHCb-PAPER-2015-049/hidef_Table_8.png)
![HiDef png [88 KiB]](Directory_LHCb-PAPER-2015-049/hidef_Table_9.png)
![HiDef png [139 KiB]](Directory_LHCb-PAPER-2015-049/hidef_Table_10.png)
![HiDef png [135 KiB]](Directory_LHCb-PAPER-2015-049/hidef_Table_11.png)
![HiDef png [103 KiB]](Directory_LHCb-PAPER-2015-049/hidef_Table_12.png)
![HiDef png [79 KiB]](Directory_LHCb-PAPER-2015-049/hidef_Table_13.png)
![HiDef png [86 KiB]](Directory_LHCb-PAPER-2015-049/hidef_Table_14.png)
![HiDef png [71 KiB]](Directory_LHCb-PAPER-2015-049/hidef_Table_15.png)
![HiDef png [73 KiB]](Directory_LHCb-PAPER-2015-049/hidef_Table_16.png)
![HiDef png [62 KiB]](Directory_LHCb-PAPER-2015-049/hidef_Table_17.png)
![HiDef png [68 KiB]](Directory_LHCb-PAPER-2015-049/hidef_Table_18.png)
![HiDef png [102 KiB]](Directory_LHCb-PAPER-2015-049/hidef_Table_19.png)
![HiDef png [36 KiB]](Directory_LHCb-PAPER-2015-049/hidef_Table_20.png)
![HiDef png [46 KiB]](Directory_LHCb-PAPER-2015-049/hidef_Table_21.png)
![HiDef png [156 KiB]](Directory_LHCb-PAPER-2015-049/supplementary/hidef_Fig10-S.png)
![HiDef png [135 KiB]](Directory_LHCb-PAPER-2015-049/supplementary/hidef_Fig1b-S.png)
![HiDef png [120 KiB]](Directory_LHCb-PAPER-2015-049/supplementary/hidef_Fig1t-S.png)
![HiDef png [124 KiB]](Directory_LHCb-PAPER-2015-049/supplementary/hidef_Fig2b-S.png)
![HiDef png [128 KiB]](Directory_LHCb-PAPER-2015-049/supplementary/hidef_Fig2t-S.png)
![HiDef png [141 KiB]](Directory_LHCb-PAPER-2015-049/supplementary/hidef_Fig3b-S.png)
![HiDef png [133 KiB]](Directory_LHCb-PAPER-2015-049/supplementary/hidef_Fig3t-S.png)
![HiDef png [131 KiB]](Directory_LHCb-PAPER-2015-049/supplementary/hidef_Fig4b-S.png)
![HiDef png [142 KiB]](Directory_LHCb-PAPER-2015-049/supplementary/hidef_Fig4t-S.png)
![HiDef png [340 KiB]](Directory_LHCb-PAPER-2015-049/supplementary/hidef_Fig5-S.png)
![HiDef png [117 KiB]](Directory_LHCb-PAPER-2015-049/supplementary/hidef_Fig6b-S.png)
![HiDef png [134 KiB]](Directory_LHCb-PAPER-2015-049/supplementary/hidef_Fig6t-S.png)
![HiDef png [293 KiB]](Directory_LHCb-PAPER-2015-049/supplementary/hidef_Fig7-S.png)
![HiDef png [342 KiB]](Directory_LHCb-PAPER-2015-049/supplementary/hidef_Fig8-S.png)
![HiDef png [329 KiB]](Directory_LHCb-PAPER-2015-049/supplementary/hidef_Fig9-S.png)
Created on 27 April 2024.