Information
LHCb-PAPER-2016-002
CERN-EP-2016-047
arXiv:1603.02870 [PDF]
(Submitted on 09 Mar 2016)
Phys. Lett. B759 (2016) 282
Inspire 1426827
Tools
Abstract
The $\Lambda_b^0\to\Lambda\phi$ decay is observed using data corresponding to an integrated luminosity of 3.0fb$^{-1}$ recorded by the LHCb experiment. The decay proceeds at leading order via a $b\to s\bar{s}s$ loop transition and is therefore sensitive to the possible presence of particles beyond the Standard Model. A first observation is reported with a significance of $5.9$ standard deviations. The value of the branching fraction is measured to be $(5.18\pm1.04\pm0.35 ^{+0.67}_{-0.62})\times10^{-6}$, where the first uncertainty is statistical, the second is systematic, and the third is related to external inputs. Triple-product asymmetries are measured to be consistent with zero.
Figures and captions
|
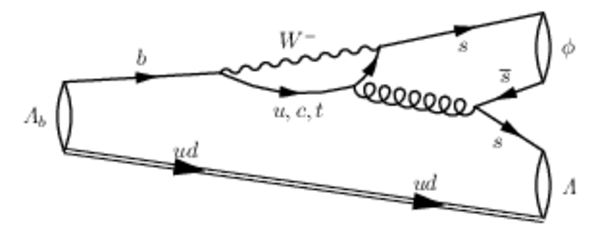
Feynman diagram contributing to the $\Lambda ^0_ b \rightarrow \Lambda \phi$ decay. |
Fig1.pdf [216 KiB] HiDef png [97 KiB] Thumbnail [57 KiB] *.C file |
|
|
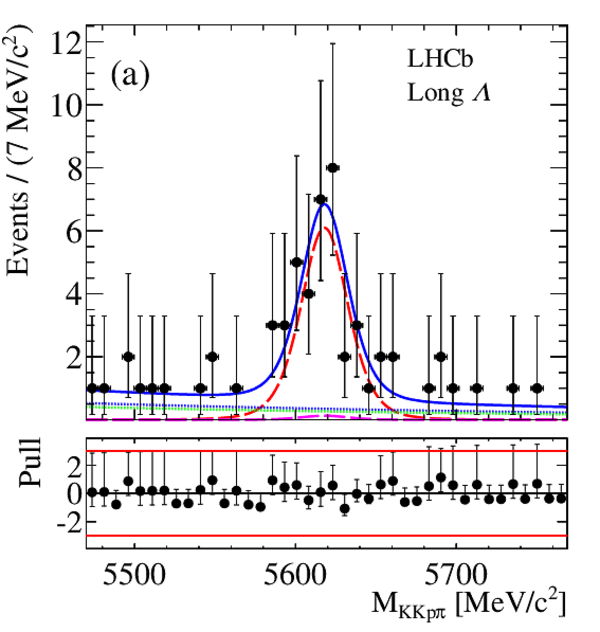
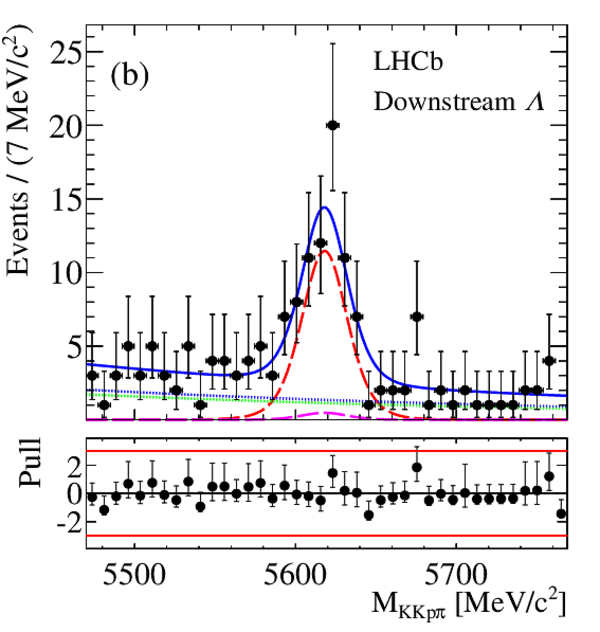
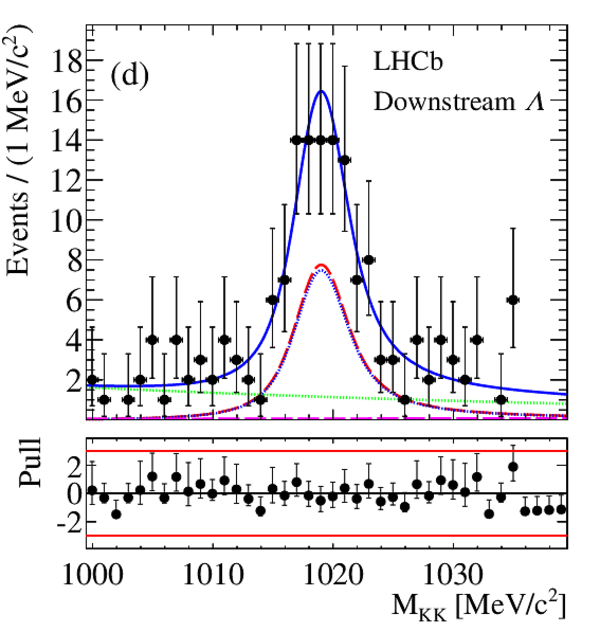
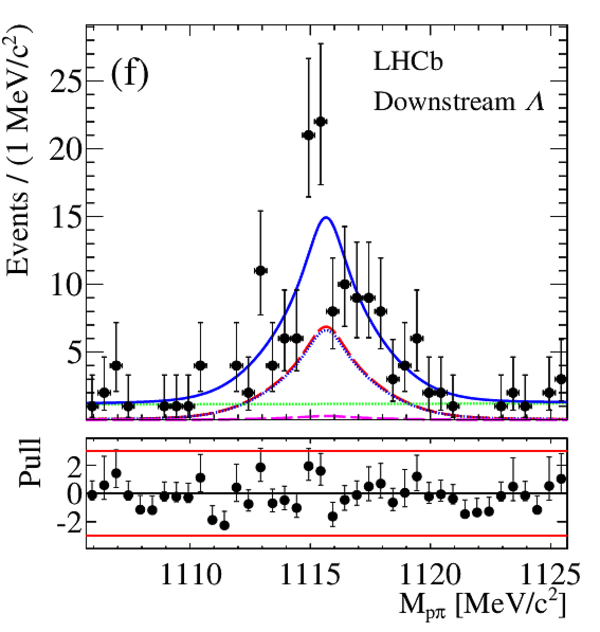
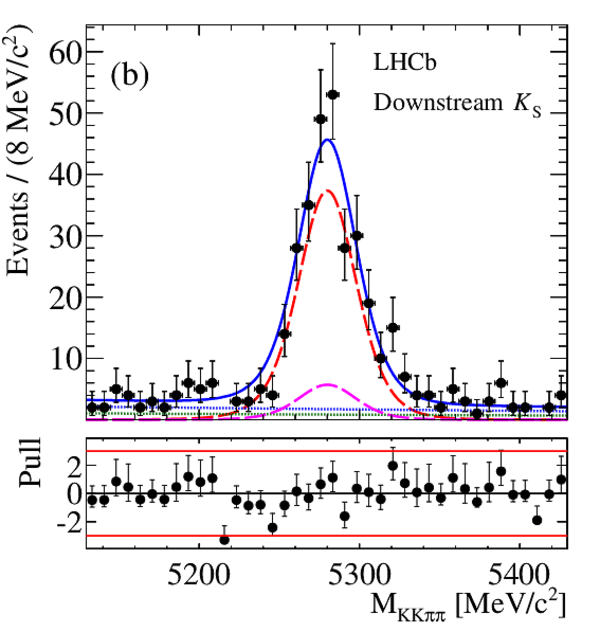
Fit projections to the $ { p \pi ^- K ^+ K ^- } $ invariant mass in the (a) long and (b) downstream datasets, the $ { K ^+ K ^- } $ invariant mass in the (c) long and (d) downstream datasets, and the $ { p \pi ^- } $ invariant mass in the (e) long and (f) downstream datasets. The total fit projection is given by the blue solid line. The blue and green dotted lines represent the $\phi$ + $\Lambda $ and pure combinatorial fit components, respectively. The red and magenta dashed lines represent the $\Lambda ^0_ b \rightarrow \Lambda \phi $ signal and the $\Lambda ^0_ b \rightarrow \Lambda K ^+ K ^- $ non-resonant components, respectively. Black points represent the data. Data uncertainties are Poisson 68% confidence intervals. |
Fig2a.pdf [21 KiB] HiDef png [310 KiB] Thumbnail [244 KiB] *.C file |
|
|
Fig2c.pdf [20 KiB] HiDef png [289 KiB] Thumbnail [237 KiB] *.C file |

|
|
|
Fig2e.pdf [20 KiB] HiDef png [297 KiB] Thumbnail [233 KiB] *.C file |

|
|
|
Fig2b.pdf [22 KiB] HiDef png [321 KiB] Thumbnail [265 KiB] *.C file |
|
|
|
Fig2d.pdf [23 KiB] HiDef png [344 KiB] Thumbnail [279 KiB] *.C file |
|
|
|
Fig2f.pdf [22 KiB] HiDef png [301 KiB] Thumbnail [247 KiB] *.C file |
|
|
|
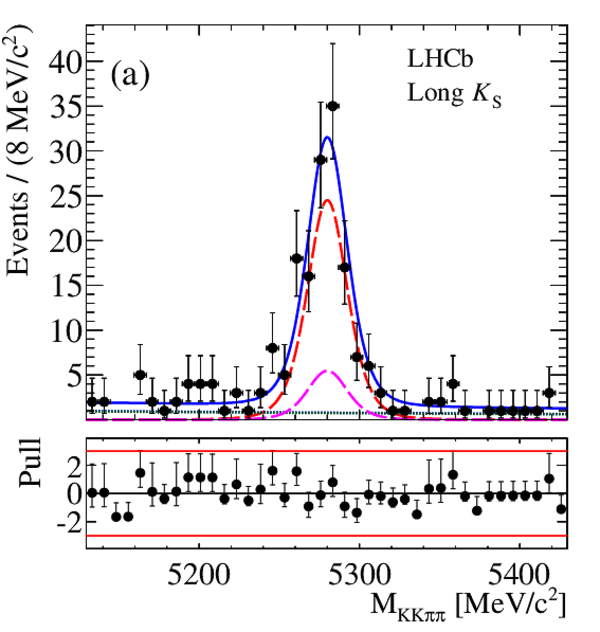
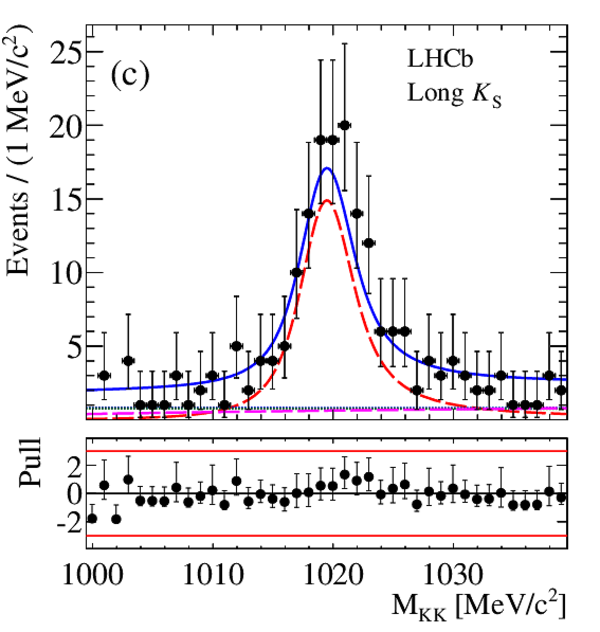
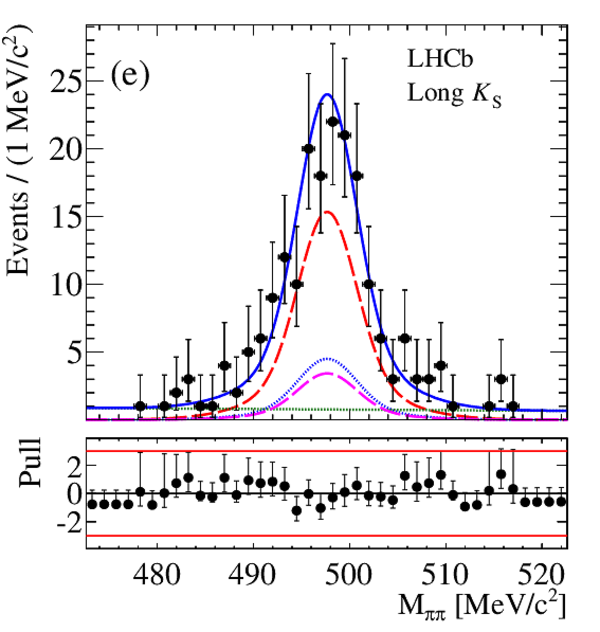
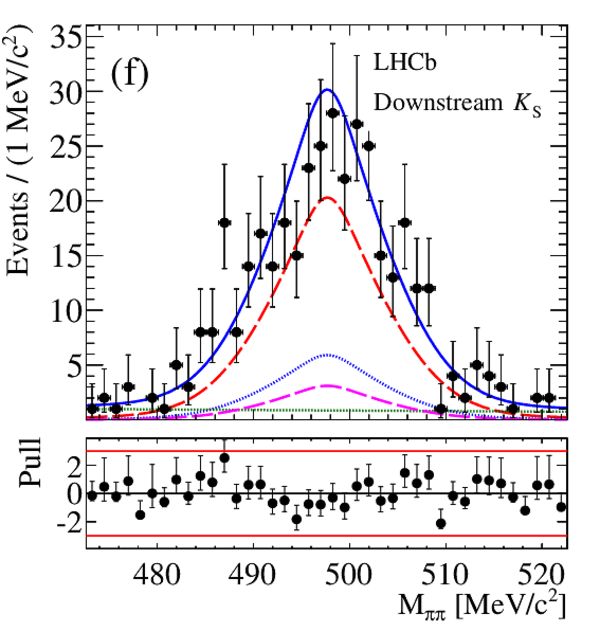
Fit projections to the $ {\pi ^+ \pi ^- K ^+ K ^- } $ invariant mass in the (a) long and (b) downstream datasets, the $ { K ^+ K ^- } $ invariant mass in the (c) long and (d) downstream datasets, and the { $ {\pi ^+ \pi ^- } $ } invariant mass in the (e) long and (f) downstream datasets. The total fit projection is given by the blue solid line. The green and blue dotted lines represent the combinatorial and $ K ^0_{\mathrm{ \scriptscriptstyle S}}$ + random $ K ^+$ $ K ^-$ fit components, respectively. The red and magenta dashed lines represent the $ B ^0 \rightarrow K ^0_{\mathrm{ \scriptscriptstyle S}} \phi $ signal and the $ B ^0 \rightarrow K ^0_{\mathrm{ \scriptscriptstyle S}} K ^+ K ^- $ non-resonant components, respectively. Black points represent the data. Data uncertainties are Poisson 68% confidence intervals. |
Fig3a.pdf [23 KiB] HiDef png [317 KiB] Thumbnail [265 KiB] *.C file |
|
|
Fig3c.pdf [22 KiB] HiDef png [318 KiB] Thumbnail [259 KiB] *.C file |
|
|
|
Fig3e.pdf [22 KiB] HiDef png [330 KiB] Thumbnail [265 KiB] *.C file |
|
|
|
Fig3b.pdf [23 KiB] HiDef png [345 KiB] Thumbnail [279 KiB] *.C file |
|
|
|
Fig3d.pdf [23 KiB] HiDef png [355 KiB] Thumbnail [297 KiB] *.C file |

|
|
|
Fig3f.pdf [23 KiB] HiDef png [369 KiB] Thumbnail [300 KiB] *.C file |
|
|
|
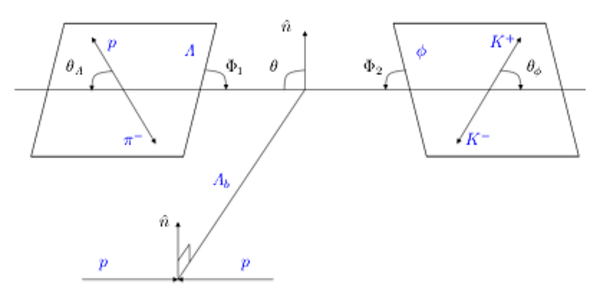
Decay angles for the $\Lambda ^0_ b \rightarrow \Lambda \phi$ decay, where the angles are defined in the text. |
Fig4.pdf [417 KiB] HiDef png [157 KiB] Thumbnail [74 KiB] *.C file |
|
|
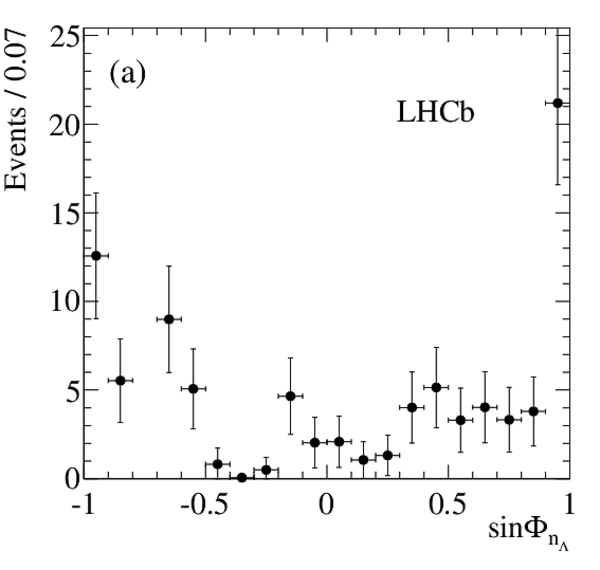
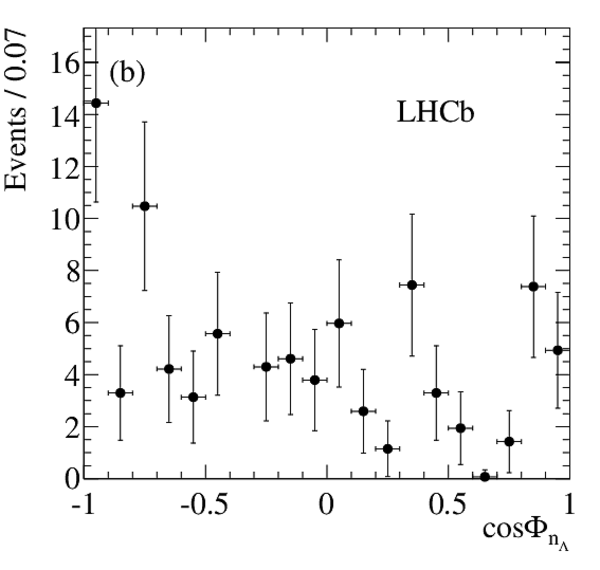
Distributions of the angular observables: (a) $\sin\Phi_{n_\Lambda }$, (b) $\cos\Phi_{n_\Lambda }$, (c) $\sin\Phi_{n_\phi}$, (d) $\cos\Phi_{n_\phi}$ from weighted $\Lambda ^0_ b \rightarrow \Lambda \phi$ data. |
Fig5a.pdf [15 KiB] HiDef png [89 KiB] Thumbnail [48 KiB] *.C file |
|
|
Fig5b.pdf [15 KiB] HiDef png [97 KiB] Thumbnail [51 KiB] *.C file |
|
|
|
Fig5c.pdf [15 KiB] HiDef png [102 KiB] Thumbnail [57 KiB] *.C file |

|
|
|
Fig5d.pdf [15 KiB] HiDef png [100 KiB] Thumbnail [55 KiB] *.C file |

|
|
|
Animated gif made out of all figures. |
PAPER-2016-002.gif Thumbnail |

|
![HiDef png [97 KiB]](Directory_LHCb-PAPER-2016-002/hidef_Fig1.png)
![HiDef png [310 KiB]](Directory_LHCb-PAPER-2016-002/hidef_Fig2a.png)
![HiDef png [289 KiB]](Directory_LHCb-PAPER-2016-002/hidef_Fig2c.png)
![HiDef png [297 KiB]](Directory_LHCb-PAPER-2016-002/hidef_Fig2e.png)
![HiDef png [321 KiB]](Directory_LHCb-PAPER-2016-002/hidef_Fig2b.png)
![HiDef png [344 KiB]](Directory_LHCb-PAPER-2016-002/hidef_Fig2d.png)
![HiDef png [301 KiB]](Directory_LHCb-PAPER-2016-002/hidef_Fig2f.png)
![HiDef png [317 KiB]](Directory_LHCb-PAPER-2016-002/hidef_Fig3a.png)
![HiDef png [318 KiB]](Directory_LHCb-PAPER-2016-002/hidef_Fig3c.png)
![HiDef png [330 KiB]](Directory_LHCb-PAPER-2016-002/hidef_Fig3e.png)
![HiDef png [345 KiB]](Directory_LHCb-PAPER-2016-002/hidef_Fig3b.png)
![HiDef png [355 KiB]](Directory_LHCb-PAPER-2016-002/hidef_Fig3d.png)
![HiDef png [369 KiB]](Directory_LHCb-PAPER-2016-002/hidef_Fig3f.png)
![HiDef png [157 KiB]](Directory_LHCb-PAPER-2016-002/hidef_Fig4.png)
![HiDef png [89 KiB]](Directory_LHCb-PAPER-2016-002/hidef_Fig5a.png)
![HiDef png [97 KiB]](Directory_LHCb-PAPER-2016-002/hidef_Fig5b.png)
![HiDef png [102 KiB]](Directory_LHCb-PAPER-2016-002/hidef_Fig5c.png)
![HiDef png [100 KiB]](Directory_LHCb-PAPER-2016-002/hidef_Fig5d.png)
Tables and captions
|
Systematic uncertainty contributions to the branching fraction ratio. |
Table_1.pdf [19 KiB] HiDef png [100 KiB] Thumbnail [43 KiB] tex code |

|
|
Asymmetries measured from $\Lambda ^0_ b \rightarrow \Lambda \phi$ data events. |
Table_2.pdf [42 KiB] HiDef png [77 KiB] Thumbnail [33 KiB] tex code |

|
|
Systematic uncertainty contributions to the triple-product asymmetries. |
Table_3.pdf [37 KiB] HiDef png [66 KiB] Thumbnail [29 KiB] tex code |

|
![HiDef png [100 KiB]](Directory_LHCb-PAPER-2016-002/hidef_Table_1.png)
![HiDef png [77 KiB]](Directory_LHCb-PAPER-2016-002/hidef_Table_2.png)
![HiDef png [66 KiB]](Directory_LHCb-PAPER-2016-002/hidef_Table_3.png)
Created on 27 April 2024.