Information
LHCb-PAPER-2016-014
CERN-EP-2016-188
arXiv:1609.03124 [PDF]
(Submitted on 11 Sep 2016)
Eur. Phys. J. C76 (2016) 664
Inspire 1486230
Tools
Abstract
A search is presented for massive long-lived particles, in the 20-60 GeV mass range with lifetimes between 5 and 100 ps. The dataset used corresponds to 0.62 1\fb of proton-proton collision data collected by the LHCb detector at sqrt(s)=7 TeV. The particles are assumed to be pair-produced by the decay of a Higgs-like boson with mass between 80 and 140 GeV. No excess above the background expectation is observed and limits are set on the production cross-section as a function of the long-lived particle mass and lifetime and of the Higgs-like boson mass.
Figures and captions
|
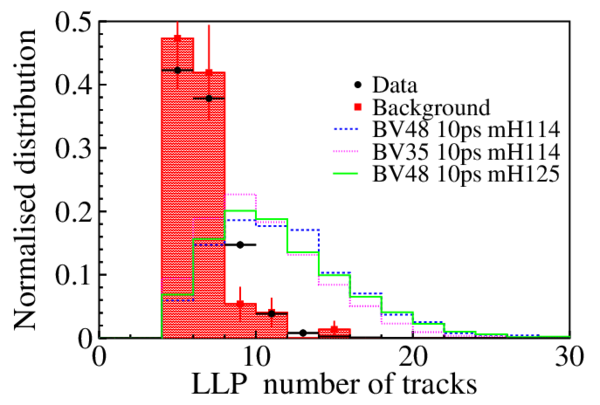
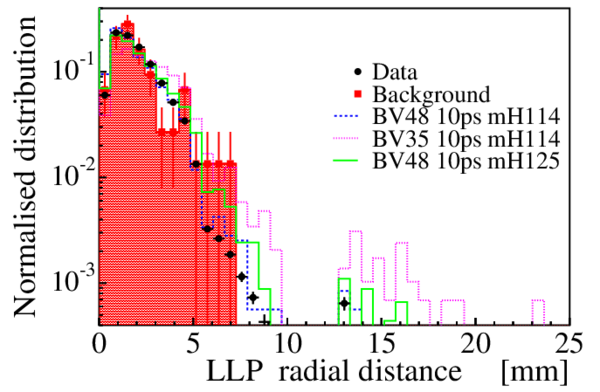
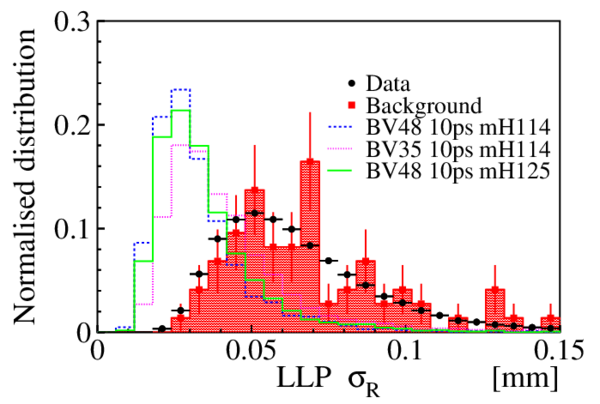
Data (black dots) and simulated distributions after preselection normalised to unit integral. There are two LLP candidates per event. The simulated $ b \overline b $ background is shown by the filled red histograms with error bars. The dashed (blue), dotted (purple) and solid (green) lines are distributions for fully simulated signal models. The subplots show (a) number of tracks used to reconstruct the LLP candidates, (b) LLP transverse momentum, (c) LLP invariant mass, (d) radial distance, $ R_{\rm xy}$ , (e) uncertainty of the radial position, $\sigma_{\rm R}$ , and (f) uncertainty of the longitudinal position, $\sigma_{\rm Z}$ , of the LLP vertex. |
fig1_a.pdf [10 KiB] HiDef png [405 KiB] Thumbnail [156 KiB] *.C file |
|
|
fig1_b.pdf [11 KiB] HiDef png [388 KiB] Thumbnail [152 KiB] *.C file |

|
|
|
fig1_c.pdf [12 KiB] HiDef png [281 KiB] Thumbnail [125 KiB] *.C file |

|
|
|
fig1_d.pdf [12 KiB] HiDef png [550 KiB] Thumbnail [196 KiB] *.C file |
|
|
|
fig1_e.pdf [13 KiB] HiDef png [413 KiB] Thumbnail [161 KiB] *.C file |
|
|
|
fig1_f.pdf [13 KiB] HiDef png [372 KiB] Thumbnail [150 KiB] *.C file |

|
|
|
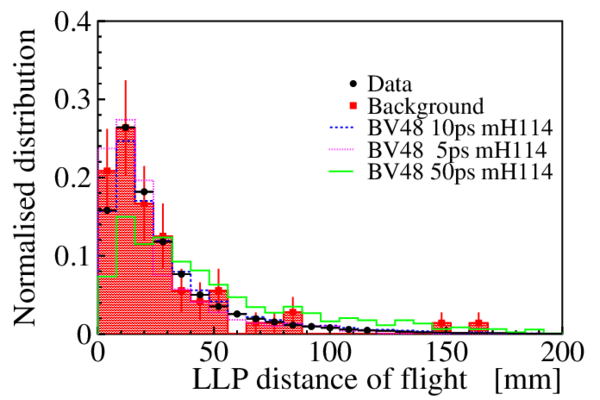
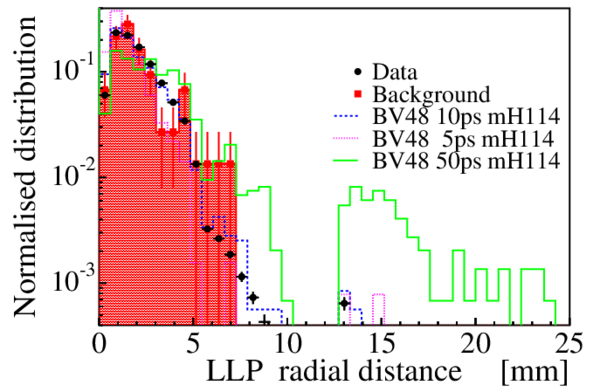
Distributions for (a) the LLP distance of flight from the PV, and, (b), the radial distance of the LLP vertex, $ R_{\rm xy}$ . The fully simulated signal models are chosen with LLP lifetimes of 5, 10, and 50 $ {\rm ps}$ . Symbols are defined as in Fig. 1. |
fig2_a.pdf [12 KiB] HiDef png [341 KiB] Thumbnail [144 KiB] *.C file |
|
|
fig2_b.pdf [12 KiB] HiDef png [541 KiB] Thumbnail [193 KiB] *.C file |
|
|
|
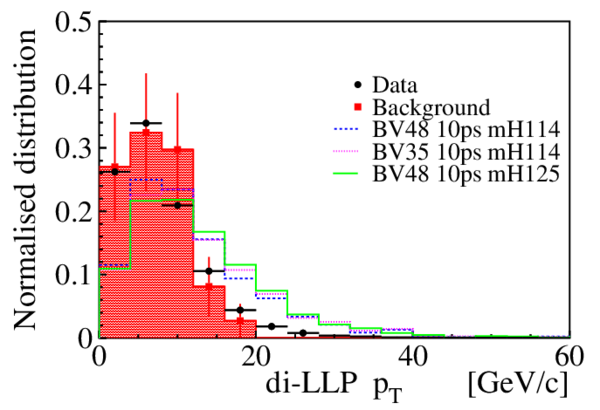
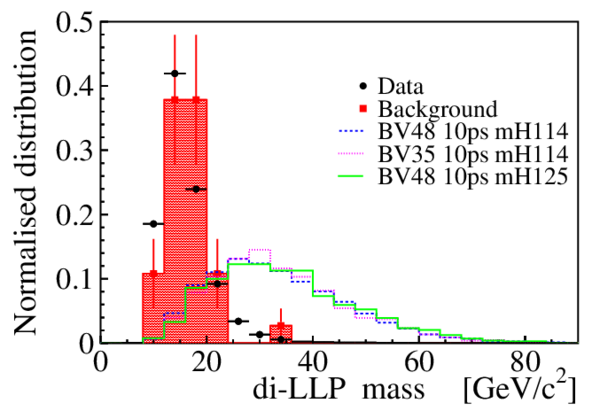
Distributions for (a) the $p_{\rm T}$ of the Higgs-like candidate, and (b), its invariant mass. Symbols are defined as in Fig. 1. |
fig3_a.pdf [11 KiB] HiDef png [404 KiB] Thumbnail [152 KiB] *.C file |
|
|
fig3_b.pdf [11 KiB] HiDef png [336 KiB] Thumbnail [139 KiB] *.C file |
|
|
|
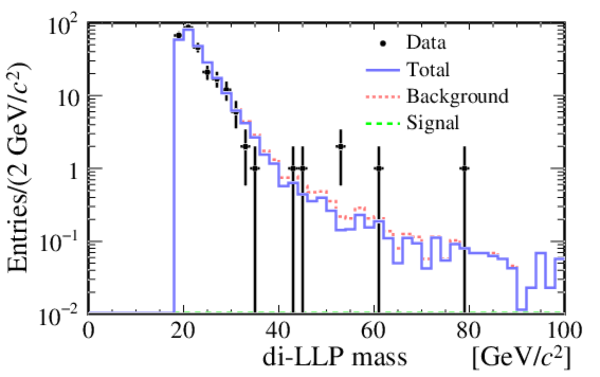
Results of the fit based on the model BV48 10ps mH114. In (a) log distribution and (b) linear scale with pull distribution. Dots with error bars are the data, the dotted (red) and the dashed (green) histograms show the fitted background and signal contributions, respectively. The purple histogram is the total fitted distribution. |
fig4_a.pdf [36 KiB] HiDef png [206 KiB] Thumbnail [159 KiB] *.C file |

|
|
fig4_b.pdf [41 KiB] HiDef png [233 KiB] Thumbnail [174 KiB] *.C file |

|
|
|
Results of the fit based on the model BV48 10ps mH114, for different combinations of signal and background selections, (a) signal from $\rm Sel_1$ and background from $\rm Bkg_2$ , (b) signal from $\rm Sel_2$ and background from $\rm Bkg_1$ . Dots with error bars are data, the dashed (green) line is the fitted signal and the dotted (red) line the background. In both cases the fitted signal is negative. The histogram (blue) is the total fitted function. |
fig5_a.pdf [36 KiB] HiDef png [207 KiB] Thumbnail [159 KiB] *.C file |

|
|
fig5_b.pdf [36 KiB] HiDef png [203 KiB] Thumbnail [156 KiB] *.C file |
|
|
|
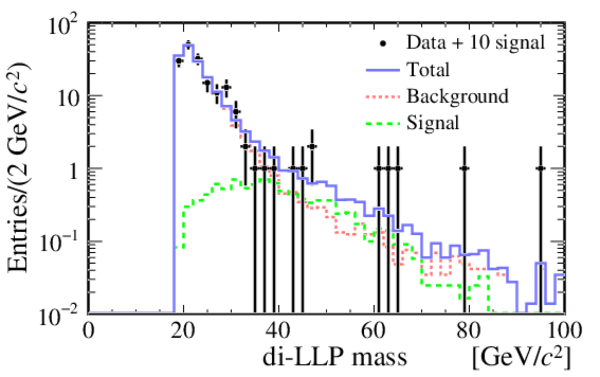
Results of the fit to the data to which 10 signal events have been added randomly chosen following the signal model. For the theoretical model BV48 10ps mH100, in (a), the fitted signal is $11.1\pm7.0$ events; for BV48 10ps mH125, in (b), the result is $9.3\pm5.6$ events. |
fig6_a.pdf [37 KiB] HiDef png [233 KiB] Thumbnail [179 KiB] *.C file |

|
|
fig6_b.pdf [37 KiB] HiDef png [237 KiB] Thumbnail [183 KiB] *.C file |
|
|
|
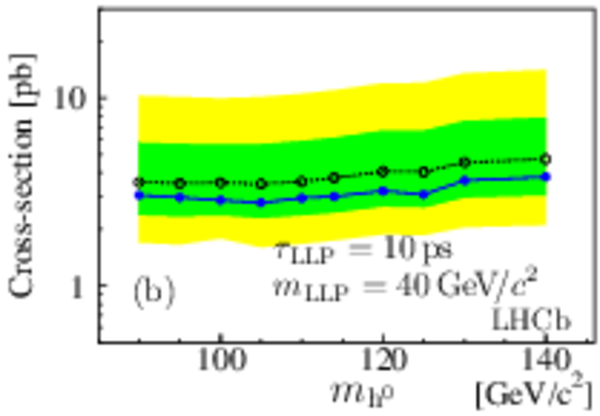
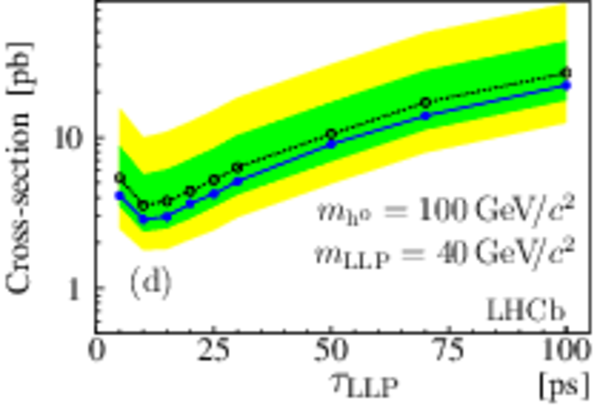
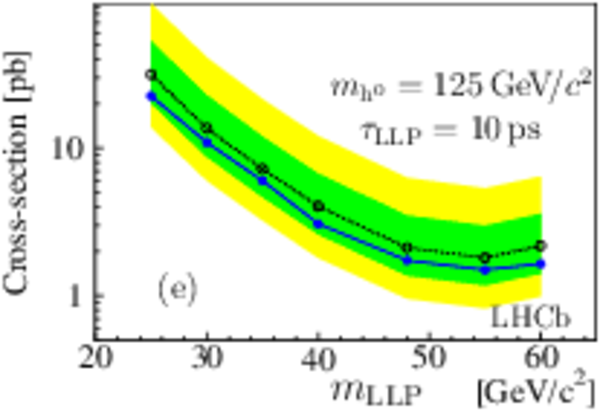
Expected (open dots with 1$\sigma$ and 2$\sigma$ bands) and observed (full dots) upper limits at 95% confidence level, (a) -- (c) shown for different masses of the Higgs-like particle, (d) and (f) for different LLP lifetimes, and (e) as a function of the LLP mass. The values of the other parameters are indicated on the plots. Results inferred from the fast simulation. |
fig7_a.pdf [281 KiB] HiDef png [227 KiB] Thumbnail [164 KiB] *.C file |

|
|
fig7_b.pdf [176 KiB] HiDef png [206 KiB] Thumbnail [151 KiB] *.C file |
|
|
|
fig7_c.pdf [176 KiB] HiDef png [198 KiB] Thumbnail [148 KiB] *.C file |

|
|
|
fig7_d.pdf [176 KiB] HiDef png [248 KiB] Thumbnail [184 KiB] *.C file |
|
|
|
fig7_e.pdf [281 KiB] HiDef png [248 KiB] Thumbnail [185 KiB] *.C file |
|
|
|
fig7_f.pdf [176 KiB] HiDef png [252 KiB] Thumbnail [186 KiB] *.C file |

|
|
|
Animated gif made out of all figures. |
PAPER-2016-014.gif Thumbnail |

|
![HiDef png [405 KiB]](Directory_LHCb-PAPER-2016-014/hidef_fig1_a.png)
![HiDef png [388 KiB]](Directory_LHCb-PAPER-2016-014/hidef_fig1_b.png)
![HiDef png [281 KiB]](Directory_LHCb-PAPER-2016-014/hidef_fig1_c.png)
![HiDef png [550 KiB]](Directory_LHCb-PAPER-2016-014/hidef_fig1_d.png)
![HiDef png [413 KiB]](Directory_LHCb-PAPER-2016-014/hidef_fig1_e.png)
![HiDef png [372 KiB]](Directory_LHCb-PAPER-2016-014/hidef_fig1_f.png)
![HiDef png [341 KiB]](Directory_LHCb-PAPER-2016-014/hidef_fig2_a.png)
![HiDef png [541 KiB]](Directory_LHCb-PAPER-2016-014/hidef_fig2_b.png)
![HiDef png [404 KiB]](Directory_LHCb-PAPER-2016-014/hidef_fig3_a.png)
![HiDef png [336 KiB]](Directory_LHCb-PAPER-2016-014/hidef_fig3_b.png)
![HiDef png [206 KiB]](Directory_LHCb-PAPER-2016-014/hidef_fig4_a.png)
![HiDef png [233 KiB]](Directory_LHCb-PAPER-2016-014/hidef_fig4_b.png)
![HiDef png [207 KiB]](Directory_LHCb-PAPER-2016-014/hidef_fig5_a.png)
![HiDef png [203 KiB]](Directory_LHCb-PAPER-2016-014/hidef_fig5_b.png)
![HiDef png [233 KiB]](Directory_LHCb-PAPER-2016-014/hidef_fig6_a.png)
![HiDef png [237 KiB]](Directory_LHCb-PAPER-2016-014/hidef_fig6_b.png)
![HiDef png [227 KiB]](Directory_LHCb-PAPER-2016-014/hidef_fig7_a.png)
![HiDef png [206 KiB]](Directory_LHCb-PAPER-2016-014/hidef_fig7_b.png)
![HiDef png [198 KiB]](Directory_LHCb-PAPER-2016-014/hidef_fig7_c.png)
![HiDef png [248 KiB]](Directory_LHCb-PAPER-2016-014/hidef_fig7_d.png)
![HiDef png [248 KiB]](Directory_LHCb-PAPER-2016-014/hidef_fig7_e.png)
![HiDef png [252 KiB]](Directory_LHCb-PAPER-2016-014/hidef_fig7_f.png)
Tables and captions
|
Definition of the criteria used for the signal determination. Selections $\rm Sel_1$ and $\rm Bkg_1$ are the baseline selections used in the fit, $\rm Sel_2$ and $\rm Bkg_2$ are used for the determination of systematic effects. The material veto and the requirement $ R_{\rm xy} >0.4$ $\rm mm$ are applied to both LLP candidates. The last column gives the number of data events selected, for a di-LLP reconstructed mass above 19 $ {\mathrm{ Ge V /}c^2}$ . |
Table_1.pdf [33 KiB] HiDef png [38 KiB] Thumbnail [19 KiB] tex code |

|
|
Values of the fitted signal and background events for the different fully simulated signal models. The signal/background combinations are defined in the first row. |
Table_2.pdf [45 KiB] HiDef png [117 KiB] Thumbnail [58 KiB] tex code |

|
|
Contributions to the systematic uncertainty for fully simulated models. For the analysis based on the fast simulation the same total systematic uncertainty is adopted augmented by 5% to account for the relative imprecision of the fast and full simulations. The contributions from the signal and the data-driven background models used in the di-LLP mass fit are discussed in the text. |
Table_3.pdf [32 KiB] HiDef png [159 KiB] Thumbnail [67 KiB] tex code |

|
|
Detection efficiency with total uncertainty, and upper limits at 95% CL on the cross-section times branching ratio for the process $ pp \rightarrow \mathrm{h}^0 X$, $\mathrm{h}^0 \rightarrow\tilde{\chi}^{0}_{1} \tilde{\chi}^{0}_{1} \rightarrow 6q$ for the fully simulated models. |
Table_4.pdf [47 KiB] HiDef png [108 KiB] Thumbnail [52 KiB] tex code |

|
|
Parameters of the signal models generated by Pythia and fully simulated. |
Table_5.pdf [38 KiB] HiDef png [88 KiB] Thumbnail [42 KiB] tex code |

|
|
Detection efficiency values in percent estimated by the fast simulation as a function of $ m_{\rm h^0}$ and $ m_{\rm{LLP}}$ . The LLP lifetime is 10 ps. The statistical uncertainty is 10% for $\epsilon \sim 0.02\%$, 5 \% for $\epsilon \sim 0.1\%$, 3\% for $\epsilon \sim 0.5\%$, and 2\% for $\epsilon \sim 1\%$. |
Table_6.pdf [35 KiB] HiDef png [114 KiB] Thumbnail [44 KiB] tex code |

|
|
Detection efficiency in percent estimated by the fast simulation as a function of the $ m_{\rm{LLP}}$ and $\tau_{\rm{LLP}}$ , for $ m_{\rm h^0}$ =114 GeV/c$^2$. The statistical uncertainty is 10% for $\epsilon \sim 0.02\%$, 5 \% for $\epsilon \sim 0.1\%$, 3\% for $\epsilon \sim 0.5\%$, and 2\% for $\epsilon \sim 1\%$. |
Table_7.pdf [28 KiB] HiDef png [135 KiB] Thumbnail [63 KiB] tex code |

|
|
Expected and observed 95% CL cross-section times branching ratio upper limits as a function of $ m_{\rm h^0}$ , with $ m_{\rm{LLP}} =35 {\mathrm{ Ge V /}c^2} $, and $\tau_{\rm{LLP}} =10 {\rm ps} $, estimated by the fast simulation. |
Table_8.pdf [39 KiB] HiDef png [139 KiB] Thumbnail [68 KiB] tex code |

|
|
Expected and observed 95% CL cross-section times branching ratio upper limits as a function of $ m_{\rm h^0}$ , for LLP masses of 40, 48, 55, and 60 $ {\mathrm{ Ge V /}c^2}$ , $\tau_{\rm{LLP}} =10 {\rm ps} $, estimated by the fast simulation. |
Table_9.pdf [39 KiB] HiDef png [249 KiB] Thumbnail [126 KiB] tex code |

|
|
Expected and observed 95% CL cross-section times branching ratio upper limits as a function of the LLP lifetime, for $ m_{\rm h^0} = 100 {\mathrm{ Ge V /}c^2} $ and $ m_{\rm{LLP}} =40 {\mathrm{ Ge V /}c^2} $, and for $ m_{\rm h^0} = 125 {\mathrm{ Ge V /}c^2} $ and $ m_{\rm{LLP}} =48 {\mathrm{ Ge V /}c^2} $, estimated by the fast simulation. |
Table_10.pdf [39 KiB] HiDef png [211 KiB] Thumbnail [104 KiB] tex code |

|
|
Expected and observed 95% CL cross-section times branching ratio upper limits as a function of the LLP mass, with $ m_{\rm h^0} =125 {\mathrm{ Ge V /}c^2} $ and $\tau_{\rm{LLP}} =10 {\rm ps} $, estimated by the fast simulation. |
Table_11.pdf [39 KiB] HiDef png [103 KiB] Thumbnail [53 KiB] tex code |

|
![HiDef png [38 KiB]](Directory_LHCb-PAPER-2016-014/hidef_Table_1.png)
![HiDef png [117 KiB]](Directory_LHCb-PAPER-2016-014/hidef_Table_2.png)
![HiDef png [159 KiB]](Directory_LHCb-PAPER-2016-014/hidef_Table_3.png)
![HiDef png [108 KiB]](Directory_LHCb-PAPER-2016-014/hidef_Table_4.png)
![HiDef png [88 KiB]](Directory_LHCb-PAPER-2016-014/hidef_Table_5.png)
![HiDef png [114 KiB]](Directory_LHCb-PAPER-2016-014/hidef_Table_6.png)
![HiDef png [135 KiB]](Directory_LHCb-PAPER-2016-014/hidef_Table_7.png)
![HiDef png [139 KiB]](Directory_LHCb-PAPER-2016-014/hidef_Table_8.png)
![HiDef png [249 KiB]](Directory_LHCb-PAPER-2016-014/hidef_Table_9.png)
![HiDef png [211 KiB]](Directory_LHCb-PAPER-2016-014/hidef_Table_10.png)
![HiDef png [103 KiB]](Directory_LHCb-PAPER-2016-014/hidef_Table_11.png)
Created on 27 April 2024.