Study of $B^+_c$ decays to the $K^+K^-\pi^+$ final state and evidence for the decay $B^+_c\to\chi_{c0}\pi^+$
[to restricted-access page]Information
LHCb-PAPER-2016-022
CERN-EP-2016-176
arXiv:1607.06134 [PDF]
(Submitted on 20 Jul 2016)
Phys. Rev. D94 (2016) 091102(R)
Inspire 1477400
Tools
Abstract
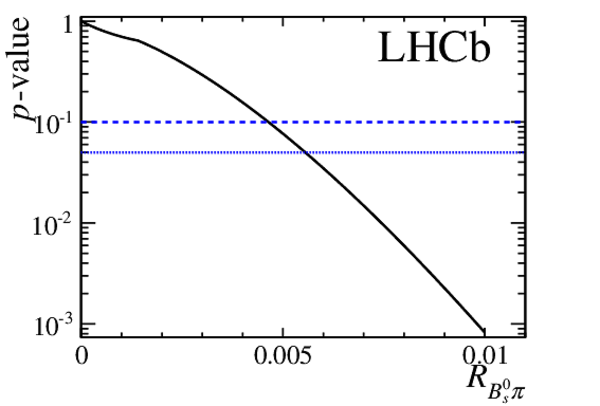
A study of $B_c^+\to K^+K^-\pi^+$ decays is performed for the first time using data corresponding to an integrated luminosity of 3.0 $\mathrm{fb}^{-1}$ collected by the LHCb experiment in $pp$ collisions at centre-of-mass energies of $7$ and $8$ TeV. Evidence for the decay $B_c^+\to\chi_{c0}(\to K^+K^-)\pi^+$ is reported with a significance of 4.0 standard deviations, resulting in the measurement of $\frac{\sigma(B_c^+)}{\sigma(B^+)}\times\mathcal{B}(B_c^+\to\chi_{c0}\pi^+)$ to be $(9.8^{+3.4}_{-3.0}(\mathrm{stat})\pm 0.8(\mathrm{syst}))\times 10^{-6}$. Here $\mathcal{B}$ denotes a branching fraction while $\sigma(B_c^+)$ and $\sigma(B^+)$ are the production cross-sections for $B_c^+$ and $B^+$ mesons. An indication of $\bar b c$ weak annihilation is found for the region $m(K^-\pi^+)<1.834\mathrm{ Ge V /}c^2$, with a significance of 2.4 standard deviations.
Figures and captions
|
Fit to the $ K ^+ K ^- \pi ^+ $ invariant mass for the $ B ^+ $ candidates, with $1.834<m( K ^+ K ^- )<1.894 {\mathrm{ Ge V /}c^2} $. The contributions from the signal $ B ^+ \rightarrow {\overline D}^0(\rightarrow K ^+ K ^- )\pi ^+ $, combinatorial background (Comb.) and partially reconstructed background (Part.) obtained from the fit are shown. |
Fig1.pdf [25 KiB] HiDef png [228 KiB] Thumbnail [195 KiB] *.C file |

|
|
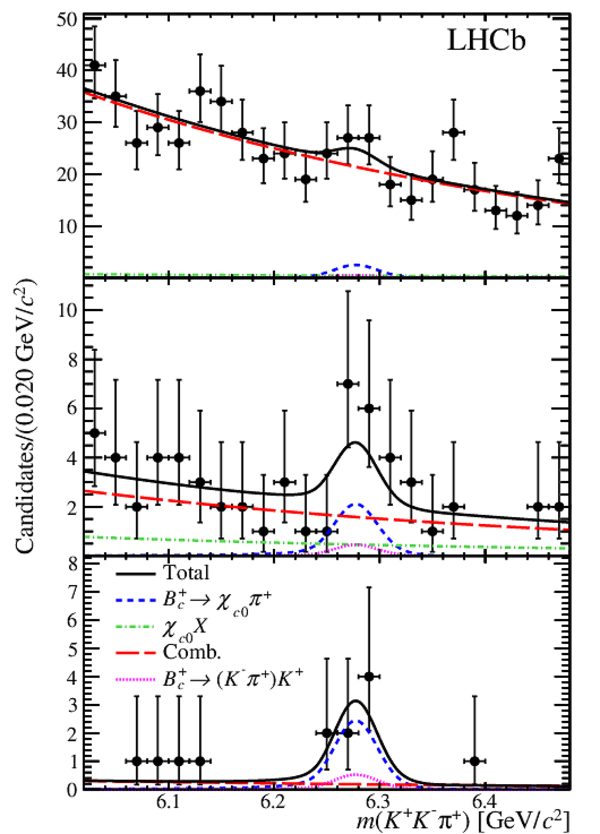
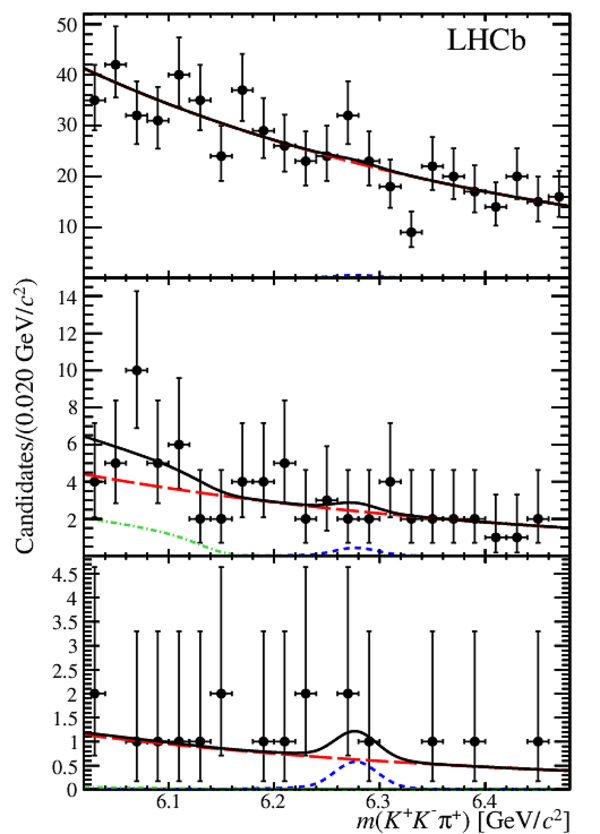
Projection of the fit to the $ K ^+ K ^- \pi ^+ $ invariant mass in the $ B _ c ^+$ region, in the bins of BDT output used in the analysis: (top) $0.04<\mathcal{O}_{\mathrm{BDT}}<0.12$, (middle) $0.12<\mathcal{O}_{\mathrm{BDT}}<0.18$ and (bottom) $\mathcal{O}_{\mathrm{BDT}}>0.18$, for $m( K ^- \pi ^+ )<1.834 {\mathrm{ Ge V /}c^2} $, including the vetoes in $m( K ^+ K ^- )$ (see text). Apart from the signal type, which is given by $ B _ c ^+ \rightarrow K ^+ K ^- \pi ^+ $, the contributions are indicated according to the same scheme as in Fig. 1. |
Fig2.pdf [25 KiB] HiDef png [392 KiB] Thumbnail [373 KiB] *.C file |

|
|
Distribution of events for the signal region $6.2<m( K ^+ K ^- \pi ^+ )<6.35 {\mathrm{ Ge V /}c^2} $ in the $m^2( K ^- \pi ^+ )$ vs. $m^2( K ^+ K ^- )$ plane for (left) $\mathcal{O}_{\mathrm{BDT}}>0.12$ and (right) $\mathcal{O}_{\mathrm{BDT}}>0.18$. The vertical red dashed lines represent a band of width $\pm60 {\mathrm{ Me V /}c^2} $ around the $\chi _{ c 0}$ mass. The horizontal blue dot-dashed line indicates the upper bound of the annihilation region at $m( K ^- \pi ^+ )=1.834 {\mathrm{ Ge V /}c^2} $, representing 17% of the available phase space area. |
Fig3a.pdf [24 KiB] HiDef png [173 KiB] Thumbnail [188 KiB] *.C file |

|
|
Fig3b.pdf [15 KiB] HiDef png [127 KiB] Thumbnail [136 KiB] *.C file |

|
|
|
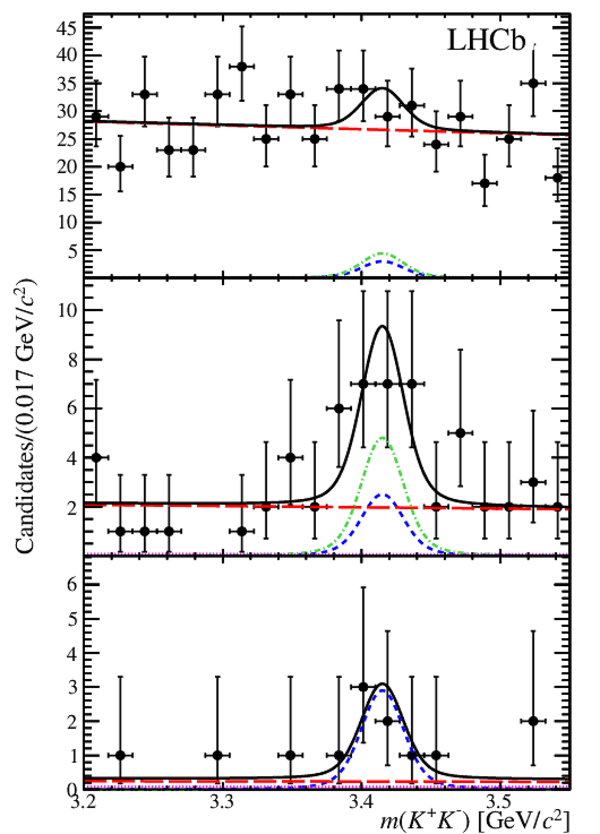
Fit projections to the (left) $ K ^+ K ^- \pi ^+ $ and (right) $ K ^+ K ^- $ invariant masses, in the bins of BDT output (top) $0.04<\mathcal{O}_{\mathrm{BDT}}<0.12$, (middle) $0.12<\mathcal{O}_{\mathrm{BDT}}<0.18$ and (bottom) $\mathcal{O}_{\mathrm{BDT}}>0.18$, for the extraction of the $ B _ c ^+ \rightarrow \chi _{ c 0} (\rightarrow K ^+ K ^- )\pi ^+ $ signal. The contributions from the $ B _ c ^+ \rightarrow \chi _{ c 0} (\rightarrow K ^+ K ^- )\pi ^+ $ signal, combinatorial background (Comb.), possible pollution from the annihilation region $ B _ c ^+ \rightarrow ( K ^- \pi ^+ ) K ^+ $, and combinations of $\chi _{ c 0} \rightarrow K ^+ K ^- $ with a random track $X$ are shown. |
Fig4a.pdf [25 KiB] HiDef png [447 KiB] Thumbnail [400 KiB] *.C file |
|
|
Fig4b.pdf [24 KiB] HiDef png [399 KiB] Thumbnail [356 KiB] *.C file |
|
|
|
Animated gif made out of all figures. |
PAPER-2016-022.gif Thumbnail |

|
![HiDef png [228 KiB]](Directory_LHCb-PAPER-2016-022/hidef_Fig1.png)
![HiDef png [392 KiB]](Directory_LHCb-PAPER-2016-022/hidef_Fig2.png)
![HiDef png [173 KiB]](Directory_LHCb-PAPER-2016-022/hidef_Fig3a.png)
![HiDef png [127 KiB]](Directory_LHCb-PAPER-2016-022/hidef_Fig3b.png)
![HiDef png [447 KiB]](Directory_LHCb-PAPER-2016-022/hidef_Fig4a.png)
![HiDef png [399 KiB]](Directory_LHCb-PAPER-2016-022/hidef_Fig4b.png)
Tables and captions
|
Relative systematic uncertainties (in %) of the measurements of $R_{\mathrm{an},KK\pi}$ and $R_{\chi _{ c 0} \pi}$. |
Table_1.pdf [55 KiB] HiDef png [142 KiB] Thumbnail [62 KiB] tex code |

|
![HiDef png [142 KiB]](Directory_LHCb-PAPER-2016-022/hidef_Table_1.png)
Supplementary Material [file]
| Supplementary material full pdf |
supple[..].pdf [308 KiB] |

|
|
README for supplemental material: - supplementary.pdf is the compiled version - supplement.tex is the latex source file - feyn_diags.zip contains all the Feynman diagrams of Figure 1 - all the other figures have self-explanatory names |
Fig2a_[..].pdf [23 KiB] HiDef png [355 KiB] Thumbnail [326 KiB] *C file |

|
|
Fig2b_[..].pdf [24 KiB] HiDef png [387 KiB] Thumbnail [363 KiB] *C file |
|
|
|
Fig3a_[..].pdf [14 KiB] HiDef png [136 KiB] Thumbnail [126 KiB] *C file |

|
|
|
Fig3b_[..].pdf [14 KiB] HiDef png [128 KiB] Thumbnail [118 KiB] *C file |

|
|
|
Fig4a_[..].pdf [14 KiB] HiDef png [122 KiB] Thumbnail [118 KiB] *C file |

|
|
|
Fig4b_[..].pdf [14 KiB] HiDef png [115 KiB] Thumbnail [101 KiB] *C file |
|
![HiDef png [355 KiB]](Directory_LHCb-PAPER-2016-022/supplementary/hidef_Fig2a_suppl.png)
![HiDef png [387 KiB]](Directory_LHCb-PAPER-2016-022/supplementary/hidef_Fig2b_suppl.png)
![HiDef png [136 KiB]](Directory_LHCb-PAPER-2016-022/supplementary/hidef_Fig3a_suppl.png)
![HiDef png [128 KiB]](Directory_LHCb-PAPER-2016-022/supplementary/hidef_Fig3b_suppl.png)
![HiDef png [122 KiB]](Directory_LHCb-PAPER-2016-022/supplementary/hidef_Fig4a_suppl.png)
![HiDef png [115 KiB]](Directory_LHCb-PAPER-2016-022/supplementary/hidef_Fig4b_suppl.png)
Created on 27 April 2024.