Measurement of forward $t\overline{t}$, $W+b\overline{b}$ and $W+c\overline{c}$ production in $pp$ collisions at $\sqrt{s}=8$ TeV
[to restricted-access page]Information
LHCb-PAPER-2016-038
CERN-EP-2016-232
arXiv:1610.08142 [PDF]
(Submitted on 26 Oct 2016)
Phys. Lett. B767 (2017) 110
Inspire 1494582
Tools
Abstract
The production of $t\overline{t}$, $W+b\overline{b}$ and $W+c\overline{c}$ is studied in the forward region of proton-proton collisions collected at a centre-of-mass energy of 8 TeV by the LHCb experiment, corresponding to an integrated luminosity of 1.98 $\pm$ 0.02 $ fb^{-1}$. The $W$ bosons are reconstructed in the decays $W\rightarrow\ell\nu$, where $\ell$ denotes muon or electron, while the $b$ and $c$ quarks are reconstructed as jets. All measured cross-sections are in agreement with next-to-leading-order Standard Model predictions.
Figures and captions
|
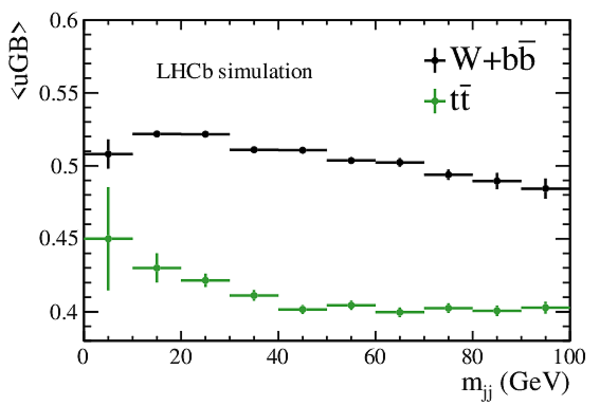
Average of uGB response in different intervals of $m_{\rm jj}$ for $ W + b \overline b $ (black) and $ t \overline t $ (green). The vertical error bars represent the standard error of the uGB mean in each interval. |
Fig1.pdf [14 KiB] HiDef png [114 KiB] Thumbnail [109 KiB] *.C file |
|
|
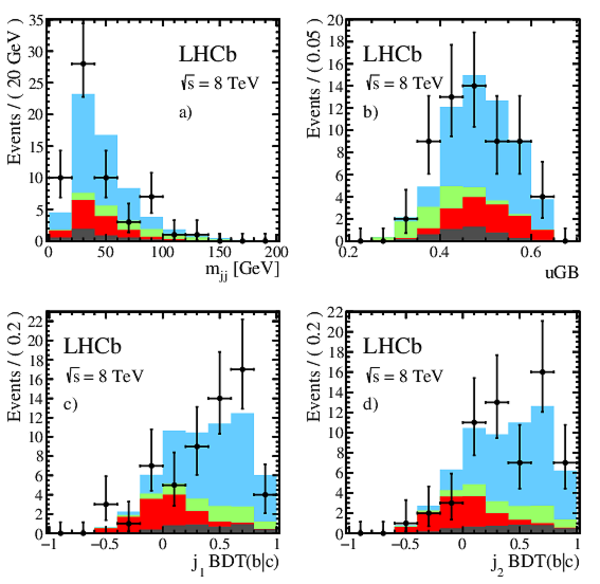
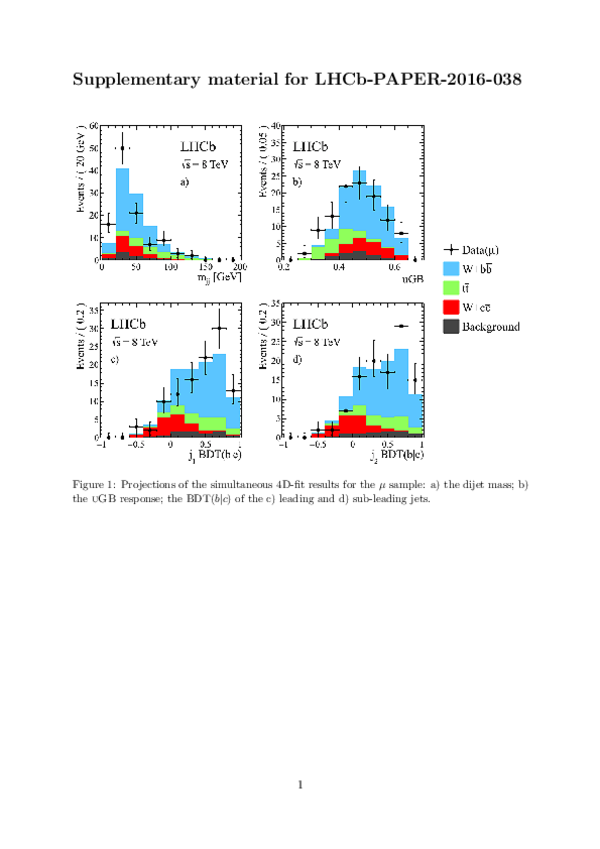
Projections of the simultaneous 4D-fit results for the $\mu^+$ sample: a) the dijet mass; b) the uGB response; the $\mathrm{BDT}({b|c})$ of the c) leading and d) sub-leading jets. |
Fig2a.pdf [22 KiB] HiDef png [324 KiB] Thumbnail [319 KiB] *.C file |
|
|
Fig2b.pdf [12 KiB] HiDef png [116 KiB] Thumbnail [108 KiB] *.C file |

|
|
|
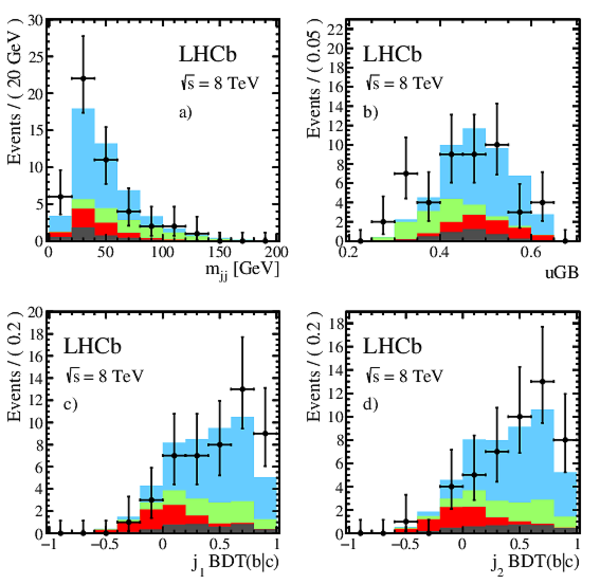
Projections of the simultaneous 4D-fit results for the $\mu^-$ sample: a) the dijet mass; b) the uGB response; the $\mathrm{BDT}({b|c})$ of the c) leading and d) sub-leading jets. |
Fig3a.pdf [22 KiB] HiDef png [319 KiB] Thumbnail [315 KiB] *.C file |
|
|
Fig3b.pdf [12 KiB] HiDef png [116 KiB] Thumbnail [108 KiB] *.C file |
|
|
|
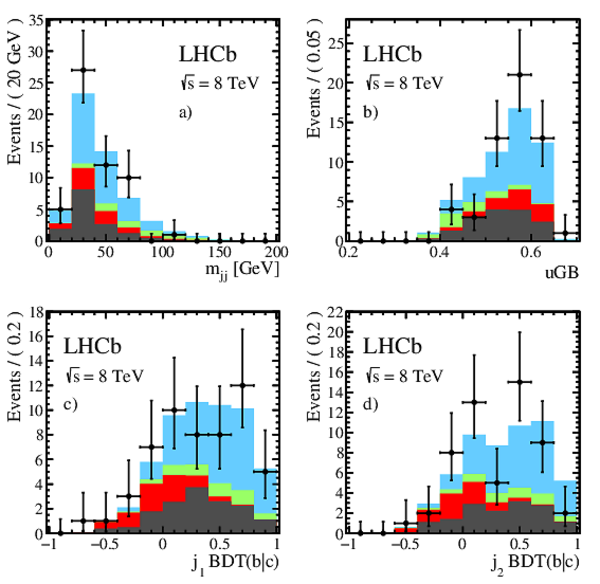
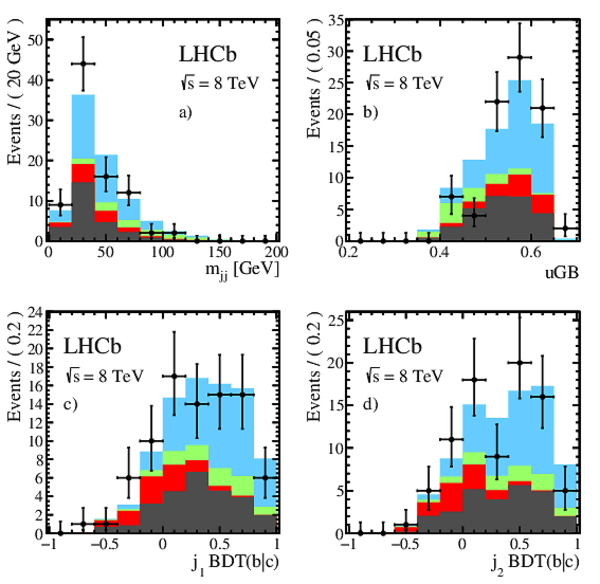
Projections of the simultaneous 4D-fit results for the $e^+$ sample: a) the dijet mass; b) the uGB response; the $\mathrm{BDT}({b|c})$ of the c) leading and d) sub-leading jets. |
Fig4a.pdf [22 KiB] HiDef png [311 KiB] Thumbnail [310 KiB] *.C file |
|
|
Fig4b.pdf [12 KiB] HiDef png [116 KiB] Thumbnail [108 KiB] *.C file |
|
|
|
Projections of the simultaneous 4D-fit results for the $e^-$ sample: a) the dijet mass; b) the uGB response; the $\mathrm{BDT}({b|c})$ of the c) leading and d) sub-leading jets. |
Fig5a.pdf [21 KiB] HiDef png [295 KiB] Thumbnail [293 KiB] *.C file |

|
|
Fig5b.pdf [12 KiB] HiDef png [116 KiB] Thumbnail [108 KiB] *.C file |

|
|
|
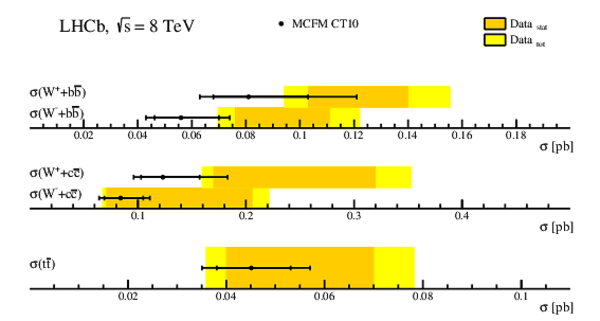
Graphical representation of Table 2. The outer bars (light yellow) correspond to the total uncertainties of the measured cross-sections and the inner bars (dark yellow) correspond to the statistical uncertainties. Theoretical prediction is represented by the black markers and error bars, where inner and outer uncertainties represent the scale and the total errors respectively. |
Fig6.pdf [14 KiB] HiDef png [106 KiB] Thumbnail [95 KiB] *.C file |
|
|
Animated gif made out of all figures. |
PAPER-2016-038.gif Thumbnail |

|
![HiDef png [114 KiB]](Directory_LHCb-PAPER-2016-038/hidef_Fig1.png)
![HiDef png [324 KiB]](Directory_LHCb-PAPER-2016-038/hidef_Fig2a.png)
![HiDef png [116 KiB]](Directory_LHCb-PAPER-2016-038/hidef_Fig2b.png)
![HiDef png [319 KiB]](Directory_LHCb-PAPER-2016-038/hidef_Fig3a.png)
![HiDef png [116 KiB]](Directory_LHCb-PAPER-2016-038/hidef_Fig3b.png)
![HiDef png [311 KiB]](Directory_LHCb-PAPER-2016-038/hidef_Fig4a.png)
![HiDef png [116 KiB]](Directory_LHCb-PAPER-2016-038/hidef_Fig4b.png)
![HiDef png [295 KiB]](Directory_LHCb-PAPER-2016-038/hidef_Fig5a.png)
![HiDef png [116 KiB]](Directory_LHCb-PAPER-2016-038/hidef_Fig5b.png)
![HiDef png [106 KiB]](Directory_LHCb-PAPER-2016-038/hidef_Fig6.png)
Tables and captions
|
Simultaneous 4D-fit results for each of the four signal categories ($e$ and $\mu$, negative and positive). The normalisation factor $K$ and the fitted yields per sample are shown. The uncertainties quoted are statistical only. |
Table_1.pdf [47 KiB] HiDef png [79 KiB] Thumbnail [39 KiB] tex code |

|
|
Observed and expected cross-sections in the fiducial region defined in Section 3. The first uncertainty on the expected cross-sections is related to the scale variation and the second is the total. The first uncertainty on the observed cross-sections is statistical and the second is systematic. |
Table_2.pdf [47 KiB] HiDef png [84 KiB] Thumbnail [38 KiB] tex code |

|
|
Correlation matrix for the measured cross sections. The correlations are given in %. |
Table_3.pdf [35 KiB] HiDef png [41 KiB] Thumbnail [19 KiB] tex code |

|
![HiDef png [79 KiB]](Directory_LHCb-PAPER-2016-038/hidef_Table_1.png)
![HiDef png [84 KiB]](Directory_LHCb-PAPER-2016-038/hidef_Table_2.png)
![HiDef png [41 KiB]](Directory_LHCb-PAPER-2016-038/hidef_Table_3.png)
Supplementary Material [file]
| Supplementary material full pdf |
supple[..].pdf [177 KiB] |
|
|
This ZIP file contains supplemetary material for the publication LHCb-PAPER-2016-038. The files are: Supplementary.pdf : An overview of the extra figures *.pdf, *.png, *.eps : The figures in variuous formats |
Fig1a-S.pdf [22 KiB] HiDef png [315 KiB] Thumbnail [312 KiB] *C file |

|
|
Fig1b-S.pdf [12 KiB] HiDef png [116 KiB] Thumbnail [107 KiB] *C file |

|
|
|
Fig2a-S.pdf [22 KiB] HiDef png [314 KiB] Thumbnail [311 KiB] *C file |
|
|
|
Fig2b-S.pdf [12 KiB] HiDef png [116 KiB] Thumbnail [107 KiB] *C file |
|
![HiDef png [315 KiB]](Directory_LHCb-PAPER-2016-038/supplementary/hidef_Fig1a-S.png)
![HiDef png [116 KiB]](Directory_LHCb-PAPER-2016-038/supplementary/hidef_Fig1b-S.png)
![HiDef png [314 KiB]](Directory_LHCb-PAPER-2016-038/supplementary/hidef_Fig2a-S.png)
![HiDef png [116 KiB]](Directory_LHCb-PAPER-2016-038/supplementary/hidef_Fig2b-S.png)
Created on 27 April 2024.