Measurement of $CP$ asymmetries in $D^{\pm}\rightarrow \eta^{\prime} \pi^{\pm}$ and $D_s^{\pm}\rightarrow \eta^{\prime} \pi^{\pm}$ decays
[to restricted-access page]Information
LHCb-PAPER-2016-041
CERN-EP-2016-315
arXiv:1701.01871 [PDF]
(Submitted on 07 Jan 2017)
Phys. Lett. B771 (2017) 21
Inspire 1508167
Tools
Abstract
A search for $CP$ violation in $D^{\pm}\rightarrow \eta^{\prime} \pi^{\pm}$ and $D^{\pm}_{s}\rightarrow \eta^{\prime} \pi^{\pm}$ decays is performed using proton-proton collision data, corresponding to an integrated luminosity of $3$ fb$^{-1}$, recorded by the LHCb experiment at centre-of-mass energies of $7$ and $8$ TeV. The measured $CP$-violating charge asymmetries are $A_{CP}(D^{\pm} \rightarrow \eta^{\prime} \pi^{\pm})=(-0.61\pm 0.72 \pm 0.53 \pm 0.12)\%$ and $A_{CP}(D^{\pm}_{s}\rightarrow \eta^{\prime} \pi^{\pm})=(-0.82\pm 0.36 \pm 0.22 \pm 0.27)\%$, where the first uncertainties are statistical, the second systematic, and the third are the uncertainties on the $A_{CP}(D^{\pm} \rightarrow K^0_S \pi^{\pm})$ and $A_{CP}(D^{\pm}_{s}\rightarrow \phi \pi^{\pm})$ measurements used for calibration. The results represent the most precise measurements of these asymmetries to date.
Figures and captions
|
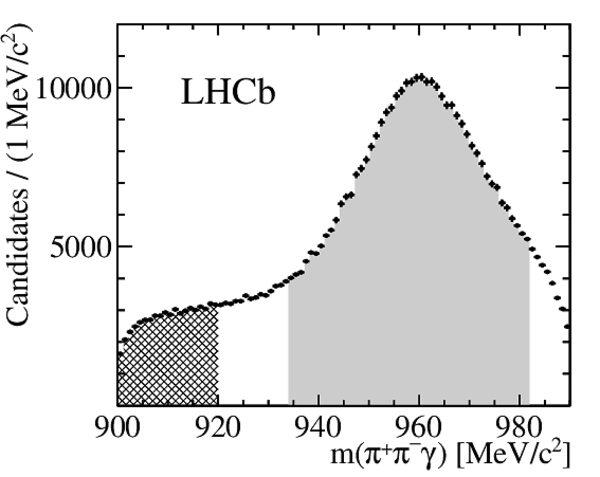
Distribution of (a) $m(\pi ^+ \pi ^- \gamma)$ for $ D^{\pm}_{(s)} \rightarrow \eta'\pi ^\pm $ candidates. The grey solid area represents the signal region, while the black hatched area represents the $m(\pi ^+ \pi ^- \gamma)$ sideband. Distribution of (b) $m(\eta'\pi ^\pm )$ for $ D^{\pm}_{(s)} \rightarrow \eta'\pi ^\pm $ candidates in the $m(\pi ^+ \pi ^- \gamma)$ sideband. |
Fig1a.pdf [16 KiB] HiDef png [171 KiB] Thumbnail [80 KiB] *.C file |
|
|
Fig1b.pdf [16 KiB] HiDef png [143 KiB] Thumbnail [79 KiB] *.C file |

|
|
|
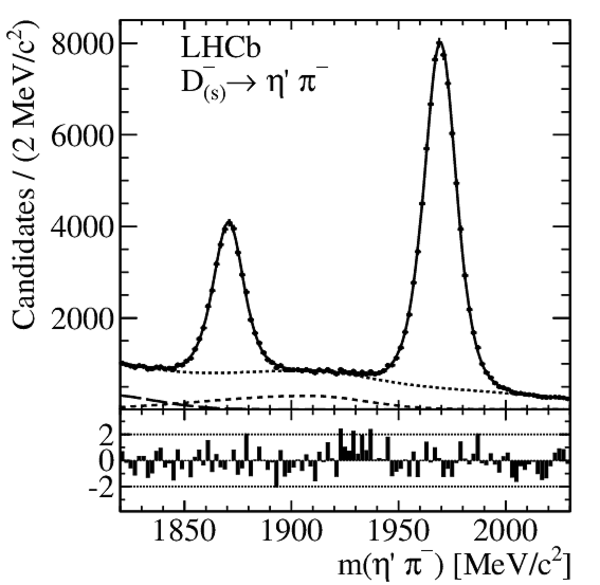
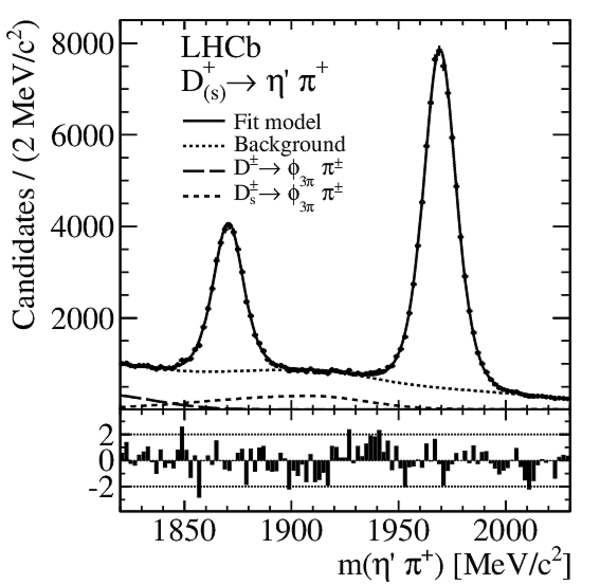
Mass distribution of $\eta^\prime\pi^\pm$ candidates, combined over all kinematic bins, $pp$ centre-of-mass energies, and hardware trigger selections, for (a) positively and (b) negatively charged $ D^{\pm}_{(s)}$ candidates. Points with errors represent data, while the curves represent the fitted model (solid), the $ D ^{\pm}_ s \rightarrow\phi_{3\pi}\pi ^\pm $ (dashed) and $ D ^\pm \rightarrow\phi_{3\pi}\pi ^\pm $ (long-dashed) components, and the sum of all background contributions (dotted), including combinatorial background. Residuals divided by the corresponding uncertainty are shown under each plot. |
Fig2a.pdf [21 KiB] HiDef png [201 KiB] Thumbnail [111 KiB] *.C file |

|
|
Fig2b.pdf [21 KiB] HiDef png [201 KiB] Thumbnail [111 KiB] *.C file |
|
|
|
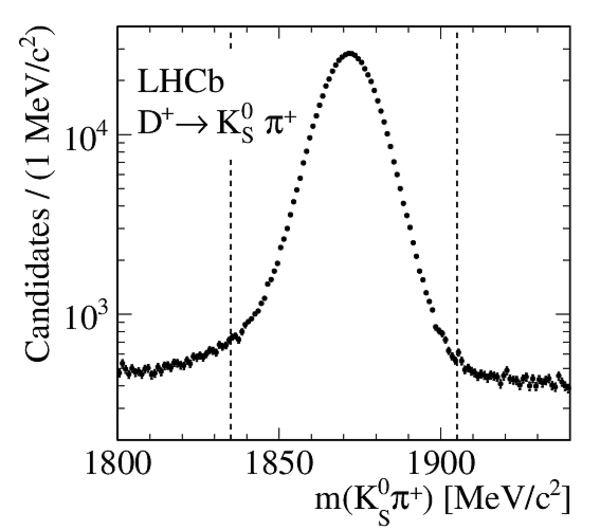
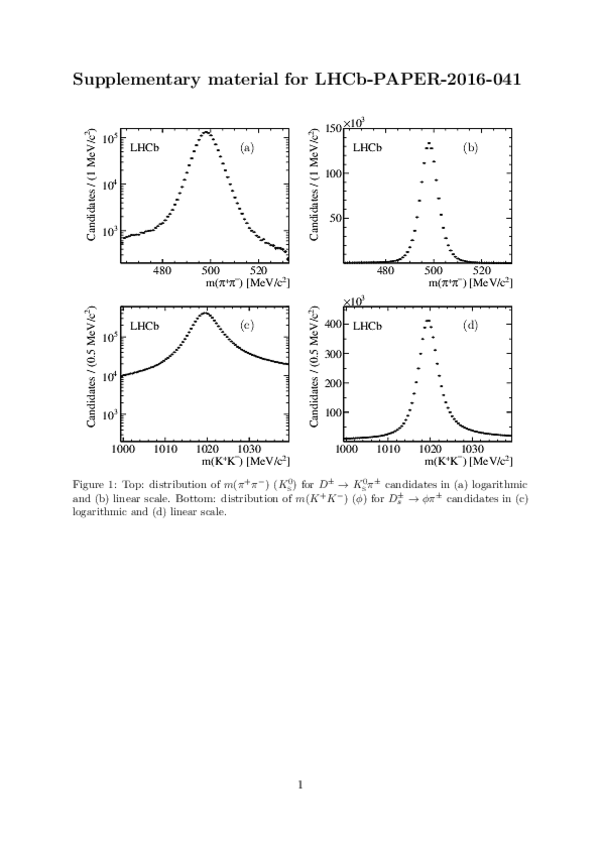
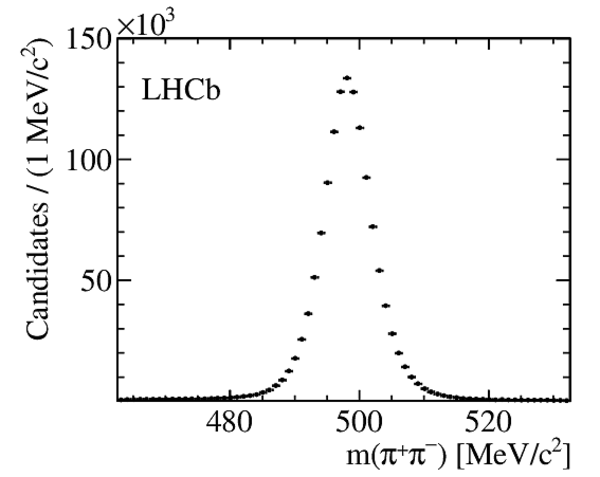
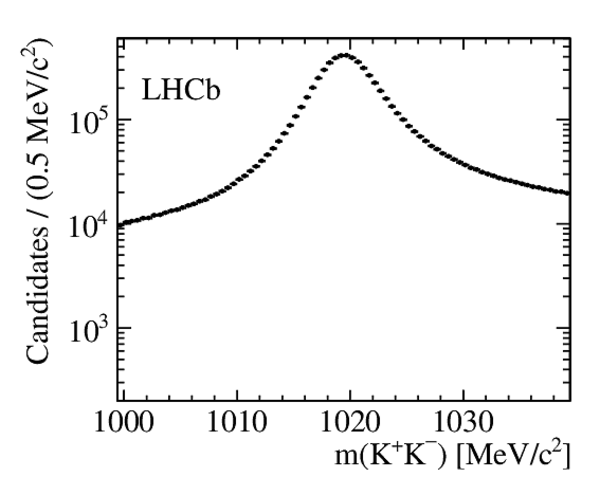
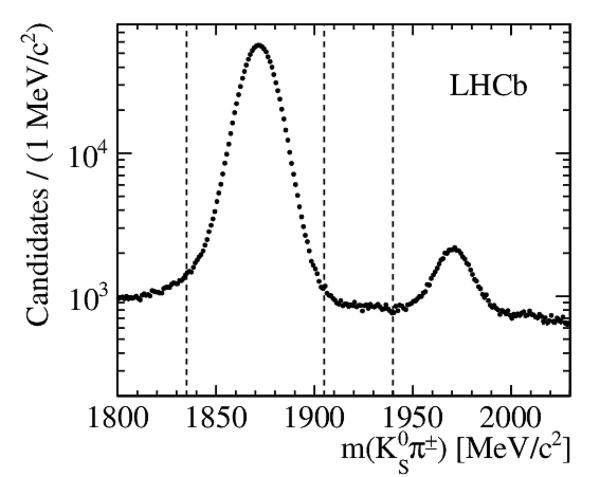
Top: $ K ^0_{\mathrm{ \scriptscriptstyle S}} \pi ^\pm $ mass distribution for (a) positively and (b) negatively charged $ D ^\pm$ candidates. Bottom: $\phi \pi ^\pm $ mass distribution for (c) positively and (d) negatively charged $ D ^{\pm}_ s $ candidates. The signal regions are enclosed within the vertical dashed lines. The mass distributions are combined over all kinematic bins, $pp$ centre-of-mass energies, and hardware trigger selections. |
Fig3a.pdf [17 KiB] HiDef png [129 KiB] Thumbnail [72 KiB] *.C file |
|
|
Fig3b.pdf [18 KiB] HiDef png [127 KiB] Thumbnail [72 KiB] *.C file |

|
|
|
Fig3c.pdf [15 KiB] HiDef png [116 KiB] Thumbnail [70 KiB] *.C file |

|
|
|
Fig3d.pdf [15 KiB] HiDef png [115 KiB] Thumbnail [69 KiB] *.C file |

|
|
|
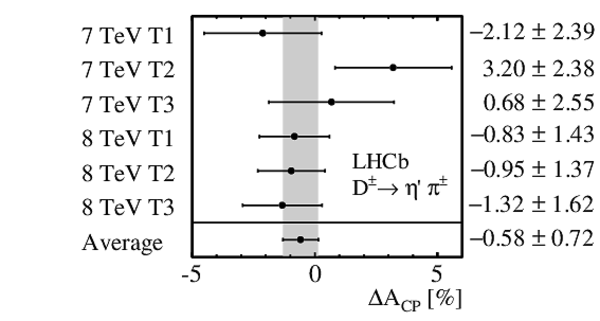
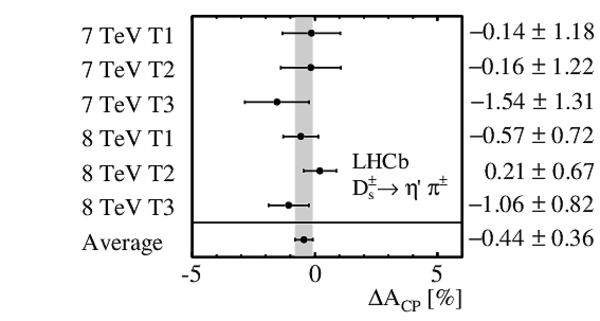
$\Delta\mathcal{A}_{ C P }$ results for (a) $ D ^\pm \rightarrow\eta^\prime\pi ^\pm $ and (b) $ D ^{\pm}_ s \rightarrow\eta^\prime\pi ^\pm $ decays, as a function of $pp$ centre-of-mass energy and trigger selection. Uncertainties are statistical only. A shaded band representing the $68.3\%$ confidence intervals obtained from the weighted average over all the samples is shown to guide the eye. |
Fig4a.pdf [9 KiB] HiDef png [105 KiB] Thumbnail [55 KiB] *.C file |
|
|
Fig4b.pdf [9 KiB] HiDef png [102 KiB] Thumbnail [54 KiB] *.C file |
|
|
|
Animated gif made out of all figures. |
PAPER-2016-041.gif Thumbnail |

|
Tables and captions
|
Systematic uncertainties (absolute values in %) on $\Delta \mathcal{A}_{ C P }$ . The total systematic uncertainty is the sum in quadrature of the individual contributions. |
Table_1.pdf [55 KiB] HiDef png [79 KiB] Thumbnail [38 KiB] tex code |

|
Supplementary Material [file]


![HiDef png [171 KiB]](Directory_LHCb-PAPER-2016-041/hidef_Fig1a.png)
![HiDef png [143 KiB]](Directory_LHCb-PAPER-2016-041/hidef_Fig1b.png)
![HiDef png [201 KiB]](Directory_LHCb-PAPER-2016-041/hidef_Fig2a.png)
![HiDef png [201 KiB]](Directory_LHCb-PAPER-2016-041/hidef_Fig2b.png)
![HiDef png [129 KiB]](Directory_LHCb-PAPER-2016-041/hidef_Fig3a.png)
![HiDef png [127 KiB]](Directory_LHCb-PAPER-2016-041/hidef_Fig3b.png)
![HiDef png [116 KiB]](Directory_LHCb-PAPER-2016-041/hidef_Fig3c.png)
![HiDef png [115 KiB]](Directory_LHCb-PAPER-2016-041/hidef_Fig3d.png)
![HiDef png [105 KiB]](Directory_LHCb-PAPER-2016-041/hidef_Fig4a.png)
![HiDef png [102 KiB]](Directory_LHCb-PAPER-2016-041/hidef_Fig4b.png)
![HiDef png [79 KiB]](Directory_LHCb-PAPER-2016-041/hidef_Table_1.png)
![HiDef png [96 KiB]](Directory_LHCb-PAPER-2016-041/supplementary/hidef_Fig1a-S.png)
![HiDef png [94 KiB]](Directory_LHCb-PAPER-2016-041/supplementary/hidef_Fig1b-S.png)
![HiDef png [102 KiB]](Directory_LHCb-PAPER-2016-041/supplementary/hidef_Fig1c-S.png)
![HiDef png [108 KiB]](Directory_LHCb-PAPER-2016-041/supplementary/hidef_Fig1d-S.png)
![HiDef png [133 KiB]](Directory_LHCb-PAPER-2016-041/supplementary/hidef_Fig2a-S.png)
![HiDef png [127 KiB]](Directory_LHCb-PAPER-2016-041/supplementary/hidef_Fig2b-S.png)
![HiDef png [305 KiB]](Directory_LHCb-PAPER-2016-041/supplementary/hidef_Fig3a-S.png)
![HiDef png [285 KiB]](Directory_LHCb-PAPER-2016-041/supplementary/hidef_Fig3b-S.png)
![HiDef png [282 KiB]](Directory_LHCb-PAPER-2016-041/supplementary/hidef_Fig3c-S.png)
![HiDef png [313 KiB]](Directory_LHCb-PAPER-2016-041/supplementary/hidef_Fig4a-S.png)
![HiDef png [276 KiB]](Directory_LHCb-PAPER-2016-041/supplementary/hidef_Fig4b-S.png)
![HiDef png [274 KiB]](Directory_LHCb-PAPER-2016-041/supplementary/hidef_Fig4c-S.png)
![HiDef png [277 KiB]](Directory_LHCb-PAPER-2016-041/supplementary/hidef_Fig5a-S.png)
![HiDef png [268 KiB]](Directory_LHCb-PAPER-2016-041/supplementary/hidef_Fig5b-S.png)
![HiDef png [262 KiB]](Directory_LHCb-PAPER-2016-041/supplementary/hidef_Fig5c-S.png)
![HiDef png [164 KiB]](Directory_LHCb-PAPER-2016-041/supplementary/hidef_Fig6a-S.png)
![HiDef png [160 KiB]](Directory_LHCb-PAPER-2016-041/supplementary/hidef_Fig6b-S.png)
![HiDef png [143 KiB]](Directory_LHCb-PAPER-2016-041/supplementary/hidef_Fig6c-S.png)
![HiDef png [157 KiB]](Directory_LHCb-PAPER-2016-041/supplementary/hidef_Fig6d-S.png)
![HiDef png [225 KiB]](Directory_LHCb-PAPER-2016-041/supplementary/hidef_Fig7a-S.png)
![HiDef png [225 KiB]](Directory_LHCb-PAPER-2016-041/supplementary/hidef_Fig7b-S.png)
Created on 27 April 2024.