Measurements of prompt charm production cross-sections in $pp$ collisions at $\sqrt{s} = 5$ TeV
[to restricted-access page]Information
LHCb-PAPER-2016-042
CERN-EP-2016-244
arXiv:1610.02230 [PDF]
(Submitted on 07 Oct 2016)
JHEP 06 (2017) 147
Inspire 1490663
Tools
Abstract
Production cross-sections of prompt charm mesons are measured using data from $pp$ collisions at the LHC at a centre-of-mass energy of $5 $TeV. The data sample corresponds to an integrated luminosity of $8.60\pm0.33 $pb$^{-1}$ collected by the LHCb experiment. The production cross-sections of $D^0$, $D^+$, $D_s^+$, and $D^{*+}$ mesons are measured in bins of charm meson transverse momentum, $p_{\text{T}}$, and rapidity, $y$. They cover the rapidity range $2.0<y<4.5$ and transverse momentum ranges $0 < p_{\text{T}} < 10 \text{GeV}/c$ for $D^0$ and $D^+$ and $1 < p_{\text{T}} < 10 \text{GeV}/c$ for $D_s^+$ and $D^{*+}$ mesons. The inclusive cross-sections for the four mesons, including charge-conjugate states, within the range of $1 < p_{\text{T}} < 8 \text{GeV}/c$ are determined to be \sigma(pp\rightarrow D^0 X) = 1004 \pm 3 \pm 54 \mu\text{b} \sigma(pp\rightarrow D^+ X) = 402 \pm 2 \pm 30 \mu\text{b} \sigma(pp\rightarrow D_s^+ X) = 170 \pm 4 \pm 16 \mu\text{b} \sigma(pp\rightarrow D^{*+} X)= 421 \pm 5 \pm 36 \mu\text{b} where the uncertainties are statistical and systematic, respectively.
Figures and captions
|
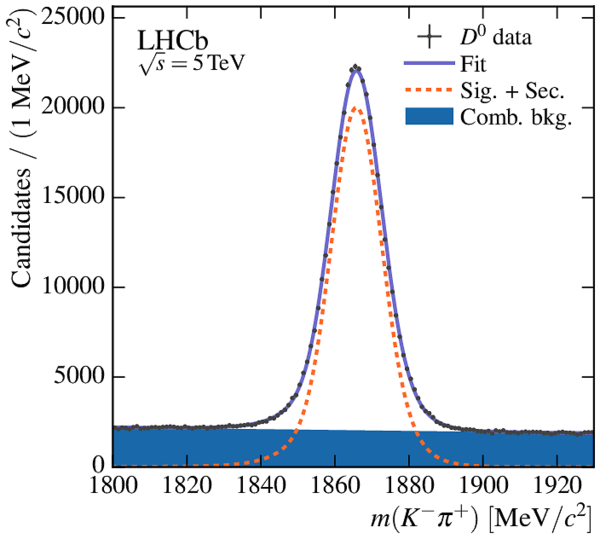
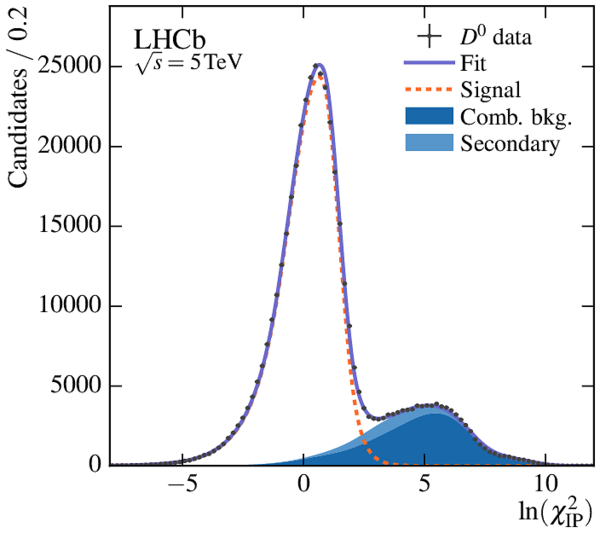
Distributions for selected $ D ^0 \to K^{-} \pi^{+} $ candidates: (left) $ K^{-} \pi^{+} $ invariant mass and (right) $\ln{\left(\chi^2_{\rm IP}\right)}$ for a mass window of $\pm\SI{20}{\mevcc}$ around the nominal $ D ^0$ mass. The sum of the simultaneous likelihood fits in each $ ( p_{\mathrm{T}} , y )$ bin is shown, with components as indicated in the legends. |
Fig1a.pdf [246 KiB] HiDef png [323 KiB] Thumbnail [214 KiB] *.C file |
|
|
Fig1b.pdf [257 KiB] HiDef png [276 KiB] Thumbnail [169 KiB] *.C file |
|
|
|
Distributions for selected $ D ^+ \to K^{-} \pi^{+} \pi^{+} $ candidates: (left) $ K^{-} \pi^{+} \pi^{+} $ invariant mass and (right) $\ln{\left(\chi^2_{\rm IP}\right)}$ for a mass window of $\pm\SI{20}{\mevcc}$ around the nominal $ D ^+$ mass. The sum of the simultaneous likelihood fits in each $ ( p_{\mathrm{T}} , y )$ bin is shown, with components as indicated in the legends. |
Fig2a.pdf [246 KiB] HiDef png [296 KiB] Thumbnail [196 KiB] *.C file |

|
|
Fig2b.pdf [256 KiB] HiDef png [261 KiB] Thumbnail [159 KiB] *.C file |

|
|
|
Distributions for selected $ D ^+_ s \to ( K^{-} K^{+} )_{\phi}\pi^{+} $ candidates: (left) $ K^{+} K^{-} \pi^{+} $ invariant mass and (right) $\ln{\left(\chi^2_{\rm IP}\right)}$ for a mass window of $\pm\SI{20}{\mevcc}$ around the nominal $ D ^+_ s $ mass. The sum of the simultaneous likelihood fits in each $ ( p_{\mathrm{T}} , y )$ bin is shown, with components as indicated in the legends. |
Fig3a.pdf [244 KiB] HiDef png [308 KiB] Thumbnail [202 KiB] *.C file |

|
|
Fig3b.pdf [255 KiB] HiDef png [271 KiB] Thumbnail [163 KiB] *.C file |

|
|
|
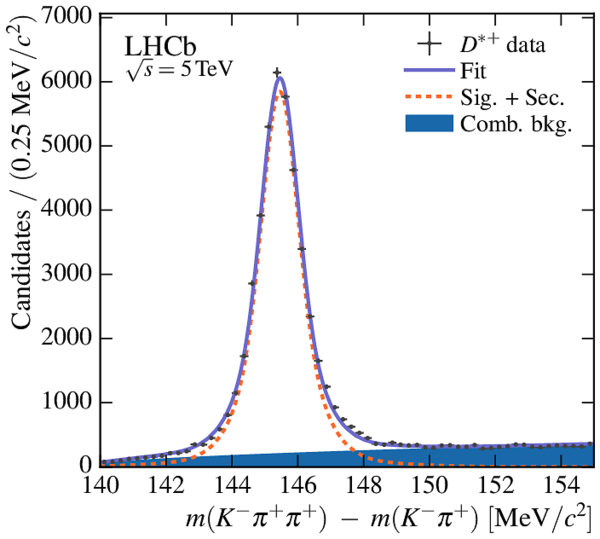
Distributions for selected $ D ^{*+} \to D ^0 \pi^{+} $ candidates, with $ D ^0 \to K^{-} \pi^{+} $ : (left) $\Delta{m} = m( D ^{*+} ) - m( D ^0 )$ for a mass window of $\pm\SI{20}{\mevcc}$ around the nominal $ D ^0$ mass and (right) $\ln{\left(\chi^2_{\rm IP}\right)}$ of the $ D ^0$ with an additional mass window of $\pm\SI{3}{\mevcc}$ around the nominal $ D ^{*+}$ {}- $ D ^0$ mass difference. The sum of the simultaneous likelihood fits in each $ ( p_{\mathrm{T}} , y )$ bin is shown, with components as indicated in the legends. |
Fig4a.pdf [243 KiB] HiDef png [327 KiB] Thumbnail [220 KiB] *.C file |
|
|
Fig4b.pdf [256 KiB] HiDef png [286 KiB] Thumbnail [176 KiB] *.C file |

|
|
|
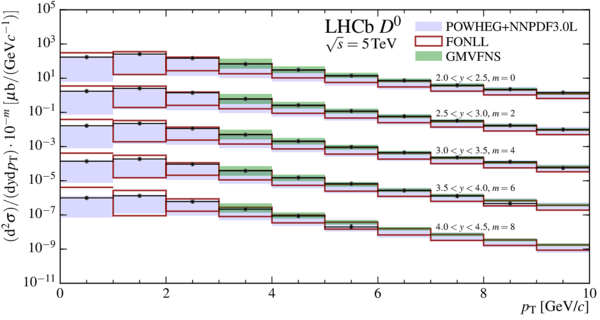
Measurements and predictions for the absolute prompt (top) $ D ^0$ , and (bottom) $ D ^+$ cross-sections at $\sqrt{s} = \SI{5}{\TeV}$ . Each set of measurements and predictions in a given rapidity bin is offset by a multiplicative factor $10^{-m}$, where the factor $m$ is shown on the plots. The boxes indicate the $\pm1\sigma$ uncertainty band on the theory predictions, where only the upper edge is shown if the uncertainty exceeds two orders of magnitude. |
Fig5a.pdf [236 KiB] HiDef png [201 KiB] Thumbnail [141 KiB] *.C file |
|
|
Fig5b.pdf [237 KiB] HiDef png [202 KiB] Thumbnail [140 KiB] *.C file |

|
|
|
Measurements and predictions for the absolute prompt (top) $ D ^+_ s $ , and (bottom) $ D ^{*+}$ cross-sections at $\sqrt{s} = \SI{5}{\TeV}$ . Each set of measurements and predictions in a given rapidity bin is offset by a multiplicative factor $10^{-m}$, where the factor $m$ is shown on the plots. The boxes indicate the $\pm1\sigma$ uncertainty band on the theory predictions, where only the upper edge is shown if the uncertainty exceeds two orders of magnitude. |
Fig6a.pdf [235 KiB] HiDef png [160 KiB] Thumbnail [123 KiB] *.C file |

|
|
Fig6b.pdf [236 KiB] HiDef png [195 KiB] Thumbnail [137 KiB] *.C file |

|
|
|
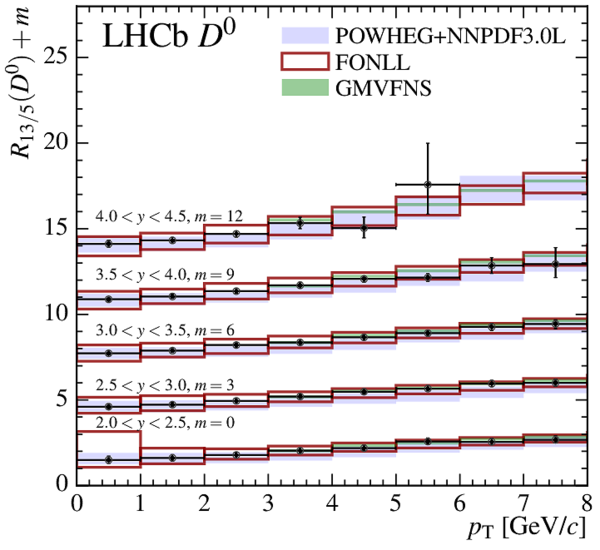
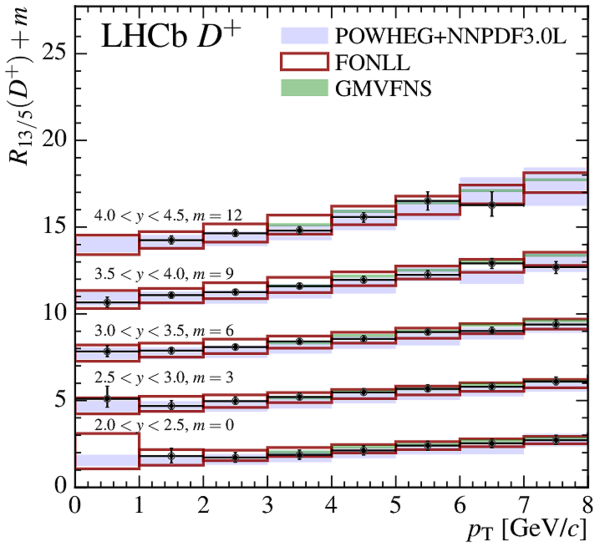
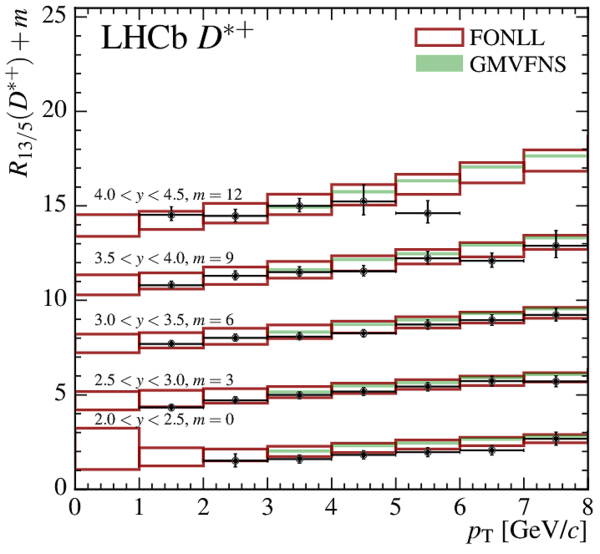
Measurements and predictions of the prompt $ D ^0$ , $ D ^+$ , $ D ^+_ s $ , and $ D ^{*+}$ cross-section ratios between $\sqrt{s} = 13$ and \SI{5}{\TeV}. Each set of measurements and predictions in a given rapidity bin is offset by an additive constant $m$, which is shown on the plot. Only central values are provided for the GMVFNS predictions. |
Fig7a.pdf [175 KiB] HiDef png [296 KiB] Thumbnail [230 KiB] *.C file |
|
|
Fig7b.pdf [175 KiB] HiDef png [298 KiB] Thumbnail [231 KiB] *.C file |
|
|
|
Fig7c.pdf [174 KiB] HiDef png [237 KiB] Thumbnail [203 KiB] *.C file |

|
|
|
Fig7d.pdf [204 KiB] HiDef png [252 KiB] Thumbnail [205 KiB] *.C file |
|
|
|
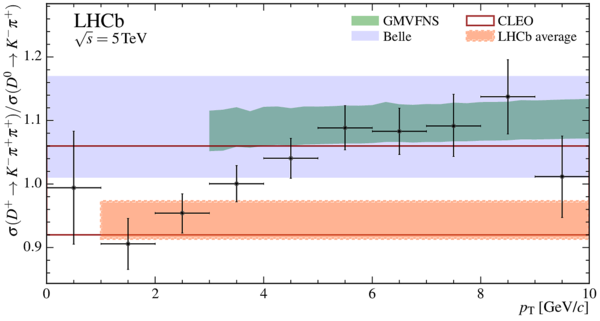
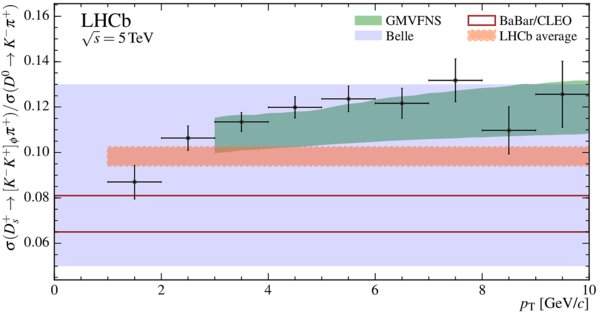
Ratios of the measurements of cross-section times branching fraction of (top) $ D ^+$ , (middle) $ D ^+_ s $ , and (bottom) $ D ^{*+}$ mesons with respect to the $ D ^0$ measurements. The bands indicate the corresponding ratios computed using measurements from $ e^{+} e^{-} $ collider experiments [42,43,44]. The ratios are given as a function of $ p_{\mathrm{T}}$ integrated over $ y$ . The notation $\sigma( D \to f )$ is shorthand for $\sigma(D)\times\mathcal{B} ( D \to f )$ . |
Fig8a.pdf [227 KiB] HiDef png [165 KiB] Thumbnail [117 KiB] *.C file |
|
|
Fig8b.pdf [227 KiB] HiDef png [188 KiB] Thumbnail [125 KiB] *.C file |
|
|
|
Fig8c.pdf [227 KiB] HiDef png [175 KiB] Thumbnail [113 KiB] *.C file |

|
|
|
Ratios of the measurements of cross-section times branching fraction of (top) $ D ^{*+}$ , and (middle) $ D ^+_ s $ mesons with respect to $ D ^+$ cross-sections, and (bottom) $ D ^+_ s $ over $ D ^{*+}$ mesons. The bands indicate the corresponding ratios computed using measurements from $ e^{+} e^{-} $ collider experiments [42,43,44]. The ratios are given as a function of $ p_{\mathrm{T}}$ integrated over $ y$ . The notation $\sigma( D \to f )$ is shorthand for $\sigma(D)\times\mathcal{B} ( D \to f )$ . |
Fig9a.pdf [227 KiB] HiDef png [190 KiB] Thumbnail [122 KiB] *.C file |

|
|
Fig9b.pdf [227 KiB] HiDef png [171 KiB] Thumbnail [119 KiB] *.C file |

|
|
|
Fig9c.pdf [227 KiB] HiDef png [204 KiB] Thumbnail [137 KiB] *.C file |

|
|
|
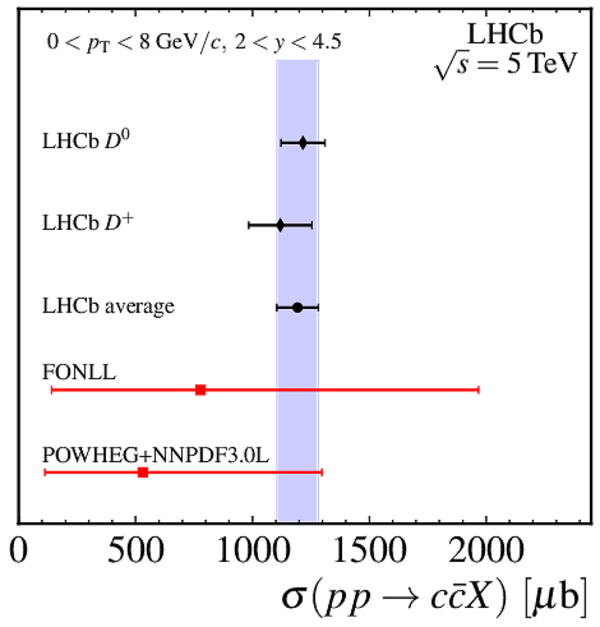
Integrated $ c \overline c $ cross-sections (black diamonds), their average (black circle and blue band) and theory predictions (red squares) [1,2] are shown (left) based on the $ D ^0$ and $ D ^+$ for $0 < p_{\mathrm{T}} < \SI{8}{ {\mathrm{Ge V /}c}}$ and (right) for measurements based on all four mesons for $1 < p_{\mathrm{T}} < \SI{8}{ {\mathrm{Ge V /}c}}$. |
Fig10a.pdf [225 KiB] HiDef png [169 KiB] Thumbnail [161 KiB] *.C file |
|
|
Fig10b.pdf [225 KiB] HiDef png [150 KiB] Thumbnail [144 KiB] *.C file |

|
|
|
Animated gif made out of all figures. |
PAPER-2016-042.gif Thumbnail |

|
![HiDef png [323 KiB]](Directory_LHCb-PAPER-2016-042/hidef_Fig1a.png)
![HiDef png [276 KiB]](Directory_LHCb-PAPER-2016-042/hidef_Fig1b.png)
![HiDef png [296 KiB]](Directory_LHCb-PAPER-2016-042/hidef_Fig2a.png)
![HiDef png [261 KiB]](Directory_LHCb-PAPER-2016-042/hidef_Fig2b.png)
![HiDef png [308 KiB]](Directory_LHCb-PAPER-2016-042/hidef_Fig3a.png)
![HiDef png [271 KiB]](Directory_LHCb-PAPER-2016-042/hidef_Fig3b.png)
![HiDef png [327 KiB]](Directory_LHCb-PAPER-2016-042/hidef_Fig4a.png)
![HiDef png [286 KiB]](Directory_LHCb-PAPER-2016-042/hidef_Fig4b.png)
![HiDef png [201 KiB]](Directory_LHCb-PAPER-2016-042/hidef_Fig5a.png)
![HiDef png [202 KiB]](Directory_LHCb-PAPER-2016-042/hidef_Fig5b.png)
![HiDef png [160 KiB]](Directory_LHCb-PAPER-2016-042/hidef_Fig6a.png)
![HiDef png [195 KiB]](Directory_LHCb-PAPER-2016-042/hidef_Fig6b.png)
![HiDef png [296 KiB]](Directory_LHCb-PAPER-2016-042/hidef_Fig7a.png)
![HiDef png [298 KiB]](Directory_LHCb-PAPER-2016-042/hidef_Fig7b.png)
![HiDef png [237 KiB]](Directory_LHCb-PAPER-2016-042/hidef_Fig7c.png)
![HiDef png [252 KiB]](Directory_LHCb-PAPER-2016-042/hidef_Fig7d.png)
![HiDef png [165 KiB]](Directory_LHCb-PAPER-2016-042/hidef_Fig8a.png)
![HiDef png [188 KiB]](Directory_LHCb-PAPER-2016-042/hidef_Fig8b.png)
![HiDef png [175 KiB]](Directory_LHCb-PAPER-2016-042/hidef_Fig8c.png)
![HiDef png [190 KiB]](Directory_LHCb-PAPER-2016-042/hidef_Fig9a.png)
![HiDef png [171 KiB]](Directory_LHCb-PAPER-2016-042/hidef_Fig9b.png)
![HiDef png [204 KiB]](Directory_LHCb-PAPER-2016-042/hidef_Fig9c.png)
![HiDef png [169 KiB]](Directory_LHCb-PAPER-2016-042/hidef_Fig10a.png)
![HiDef png [150 KiB]](Directory_LHCb-PAPER-2016-042/hidef_Fig10b.png)
Tables and captions
|
Prompt signal yields in the fully selected dataset, summed over all $ ( p_{\mathrm{T}} , y )$ bins in which a measurement is made. Only statistical uncertainties are given. |
Table_1.pdf [51 KiB] HiDef png [87 KiB] Thumbnail [38 KiB] tex code |

|
|
Fractional systematic uncertainties, in percent. Uncertainties that are computed bin-by-bin are expressed as ranges giving the minimum to maximum values. Ranges for the correlations between $ p_{\mathrm{T}}$ - $ y$ bins and between modes are also given, expressed in percent. |
Table_2.pdf [47 KiB] HiDef png [71 KiB] Thumbnail [31 KiB] tex code |

|
|
Prompt { $ D$ }-meson production cross-sections in the kinematic ranges given. The computation of the extrapolation factors is described in Ref [22]. The first uncertainty on the cross-section is statistical, and the second is systematic and includes the contribution from the extrapolation factor. A dash indicates that measurements are available in all bins and no extrapolation factor is needed. Integrated numbers in the reduced acceptance $2.5 < y < 4.0$ are quoted as reference for future heavy ion measurements. |
Table_3.pdf [60 KiB] HiDef png [107 KiB] Thumbnail [53 KiB] tex code |

|
|
Ratios of integrated prompt { $ D$ }-meson production cross-sections between measurements at $\sqrt{s} = \SI{13}{\TeV}$ and $\sqrt{s} = \SI{5}{\TeV}$ . The first uncertainty on the ratio is statistical, and the second is systematic. |
Table_4.pdf [48 KiB] HiDef png [50 KiB] Thumbnail [25 KiB] tex code |

|
|
Ratios of the measurements of cross-section times branching fraction in the kinematic range $1 < p_{\mathrm{T}} < \SI{8}{ {\mathrm{Ge V /}c}}$ and $2 < y < 4.5$. The first uncertainty on the ratio is statistical and the second is systematic. The notation $\sigma( D \to f )$ is shorthand for $\sigma(D)\times\mathcal{B} ( D \to f )$ . |
[Error creating the table] | |
|
Differential production cross-sections, $\text{d}^2\sigma/(\text{d} p_{\mathrm{T}} \text{d}y)$, in $\si{\micro\barn}/(\si{ {\mathrm{Ge V /}c}})$ for prompt $ D ^0 + \overline{ D }{} {}^0 $ mesons in bins of $ ( p_{\mathrm{T}} , y )$ . The first uncertainty is statistical, and the second is the total systematic. |
Table_6.pdf [44 KiB] HiDef png [106 KiB] Thumbnail [45 KiB] tex code |

|
|
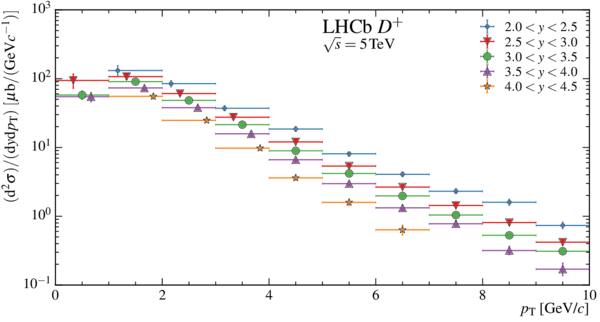
Differential production cross-sections, $\text{d}^2\sigma/(\text{d} p_{\mathrm{T}} \text{d}y)$, in $\si{\micro\barn}/(\si{ {\mathrm{Ge V /}c}})$ for prompt $ D ^+ + D ^- $ mesons in bins of $ ( p_{\mathrm{T}} , y )$ . The first uncertainty is statistical, and the second is the total systematic. |
Table_7.pdf [44 KiB] HiDef png [83 KiB] Thumbnail [45 KiB] tex code |

|
|
Differential production cross-sections, $\text{d}^2\sigma/(\text{d} p_{\mathrm{T}} \text{d}y)$, in $\si{\micro\barn}/(\si{ {\mathrm{Ge V /}c}})$ for prompt $ D ^+_ s + D ^-_ s $ mesons in bins of $ ( p_{\mathrm{T}} , y )$ . The first uncertainty is statistical, and the second is the total systematic. |
Table_8.pdf [44 KiB] HiDef png [100 KiB] Thumbnail [42 KiB] tex code |

|
|
Differential production cross-sections, $\text{d}^2\sigma/(\text{d} p_{\mathrm{T}} \text{d}y)$, in $\si{\micro\barn}/(\si{ {\mathrm{Ge V /}c}})$ for prompt $ D ^{*+} + D ^{*-} $ mesons in bins of $ ( p_{\mathrm{T}} , y )$ . The first uncertainty is statistical, and the second is the total systematic. |
Table_9.pdf [44 KiB] HiDef png [99 KiB] Thumbnail [42 KiB] tex code |

|
|
The ratios of differential production cross-sections, $R_{13/5}$, for prompt $ D ^0 + \overline{ D }{} {}^0 $ mesons in bins of $ ( p_{\mathrm{T}} , y )$ . The first uncertainty is statistical, and the second is the total systematic. |
Table_10.pdf [44 KiB] HiDef png [108 KiB] Thumbnail [47 KiB] tex code |

|
|
The ratios of differential production cross-sections, $R_{13/5}$, for prompt $ D ^+ + D ^- $ mesons in bins of $ ( p_{\mathrm{T}} , y )$ . The first uncertainty is statistical, and the second is the total systematic. |
Table_11.pdf [44 KiB] HiDef png [107 KiB] Thumbnail [47 KiB] tex code |

|
|
The ratios of differential production cross-sections, $R_{13/5}$, for prompt $ D ^+_ s + D ^-_ s $ mesons in bins of $ ( p_{\mathrm{T}} , y )$ . The first uncertainty is statistical, and the second is the total systematic. |
Table_12.pdf [44 KiB] HiDef png [95 KiB] Thumbnail [42 KiB] tex code |

|
|
The ratios of differential production cross-sections, $R_{13/5}$, for prompt $ D ^{*+} + D ^{*-} $ mesons in bins of $ ( p_{\mathrm{T}} , y )$ . The first uncertainty is statistical, and the second is the total systematic. |
Table_13.pdf [43 KiB] HiDef png [94 KiB] Thumbnail [41 KiB] tex code |

|
|
The ratios of the measurements of cross-section times branching fraction for prompt $ D ^+$ and $ D ^0$ mesons in bins of $ ( p_{\mathrm{T}} , y )$ . The first uncertainty is statistical, and the second is the total systematic. All values are given in percent. |
Table_14.pdf [44 KiB] HiDef png [107 KiB] Thumbnail [52 KiB] tex code |

|
|
The ratios of the measurements of cross-section times branching fraction for prompt $ D ^+_ s $ and $ D ^0$ mesons in bins of $ ( p_{\mathrm{T}} , y )$ . The first uncertainty is statistical, and the second is the total systematic. All values are given in percent. |
Table_15.pdf [44 KiB] HiDef png [101 KiB] Thumbnail [46 KiB] tex code |

|
|
The ratios of the measurements of cross-section times branching fraction for prompt $ D ^{*+}$ and $ D ^0$ mesons in bins of $ ( p_{\mathrm{T}} , y )$ . The first uncertainty is statistical, and the second is the total systematic. All values are given in percent. |
Table_16.pdf [44 KiB] HiDef png [103 KiB] Thumbnail [49 KiB] tex code |

|
|
The ratios of the measurements of cross-section times branching fraction for prompt $ D ^+_ s $ and $ D ^+$ mesons in bins of $ ( p_{\mathrm{T}} , y )$ . The first uncertainty is statistical, and the second is the total systematic. All values are given in percent. |
Table_17.pdf [44 KiB] HiDef png [100 KiB] Thumbnail [45 KiB] tex code |

|
|
The ratios of the measurements of cross-section times branching fraction for prompt $ D ^{*+}$ and $ D ^+$ mesons in bins of $ ( p_{\mathrm{T}} , y )$ . The first uncertainty is statistical, and the second is the total systematic. All values are given in percent. |
Table_18.pdf [44 KiB] HiDef png [103 KiB] Thumbnail [49 KiB] tex code |

|
|
The ratios of the measurements of cross-section times branching fraction for prompt $ D ^+_ s $ and $ D ^{*+}$ mesons in bins of $ ( p_{\mathrm{T}} , y )$ . The first uncertainty is statistical, and the second is the total systematic. All values are given in percent. |
Table_19.pdf [44 KiB] HiDef png [101 KiB] Thumbnail [48 KiB] tex code |

|
![HiDef png [87 KiB]](Directory_LHCb-PAPER-2016-042/hidef_Table_1.png)
![HiDef png [71 KiB]](Directory_LHCb-PAPER-2016-042/hidef_Table_2.png)
![HiDef png [107 KiB]](Directory_LHCb-PAPER-2016-042/hidef_Table_3.png)
![HiDef png [50 KiB]](Directory_LHCb-PAPER-2016-042/hidef_Table_4.png)
![HiDef png [106 KiB]](Directory_LHCb-PAPER-2016-042/hidef_Table_6.png)
![HiDef png [83 KiB]](Directory_LHCb-PAPER-2016-042/hidef_Table_7.png)
![HiDef png [100 KiB]](Directory_LHCb-PAPER-2016-042/hidef_Table_8.png)
![HiDef png [99 KiB]](Directory_LHCb-PAPER-2016-042/hidef_Table_9.png)
![HiDef png [108 KiB]](Directory_LHCb-PAPER-2016-042/hidef_Table_10.png)
![HiDef png [107 KiB]](Directory_LHCb-PAPER-2016-042/hidef_Table_11.png)
![HiDef png [95 KiB]](Directory_LHCb-PAPER-2016-042/hidef_Table_12.png)
![HiDef png [94 KiB]](Directory_LHCb-PAPER-2016-042/hidef_Table_13.png)
![HiDef png [107 KiB]](Directory_LHCb-PAPER-2016-042/hidef_Table_14.png)
![HiDef png [101 KiB]](Directory_LHCb-PAPER-2016-042/hidef_Table_15.png)
![HiDef png [103 KiB]](Directory_LHCb-PAPER-2016-042/hidef_Table_16.png)
![HiDef png [100 KiB]](Directory_LHCb-PAPER-2016-042/hidef_Table_17.png)
![HiDef png [103 KiB]](Directory_LHCb-PAPER-2016-042/hidef_Table_18.png)
![HiDef png [101 KiB]](Directory_LHCb-PAPER-2016-042/hidef_Table_19.png)
Supplementary Material [file]
| Supplementary material full pdf |
supple[..].pdf [418 KiB] |
|
|
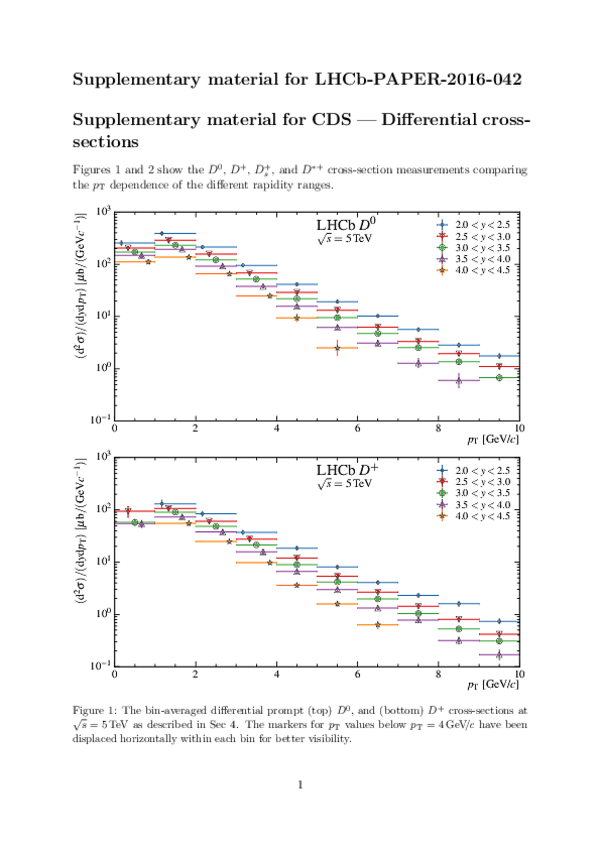
This ZIP file contains supplemetary material for the publication LHCb-PAPER-2016-042. The files are: supplementary.pdf : An overview of the extra figures *.pdf, *.png, *.jpg, *.eps : The figures in various formats |
Fig1a-S.pdf [234 KiB] HiDef png [155 KiB] Thumbnail [110 KiB] *C file |

|
|
Fig1b-S.pdf [234 KiB] HiDef png [156 KiB] Thumbnail [110 KiB] *C file |
|
|
|
Fig2a-S.pdf [233 KiB] HiDef png [151 KiB] Thumbnail [106 KiB] *C file |

|
|
|
Fig2b-S.pdf [233 KiB] HiDef png [147 KiB] Thumbnail [106 KiB] *C file |

|
|
|
Fig3-S.pdf [193 KiB] HiDef png [103 KiB] Thumbnail [84 KiB] *C file |

|
![HiDef png [155 KiB]](Directory_LHCb-PAPER-2016-042/supplementary/hidef_Fig1a-S.png)
![HiDef png [156 KiB]](Directory_LHCb-PAPER-2016-042/supplementary/hidef_Fig1b-S.png)
![HiDef png [151 KiB]](Directory_LHCb-PAPER-2016-042/supplementary/hidef_Fig2a-S.png)
![HiDef png [147 KiB]](Directory_LHCb-PAPER-2016-042/supplementary/hidef_Fig2b-S.png)
![HiDef png [103 KiB]](Directory_LHCb-PAPER-2016-042/supplementary/hidef_Fig3-S.png)
Created on 27 April 2024.