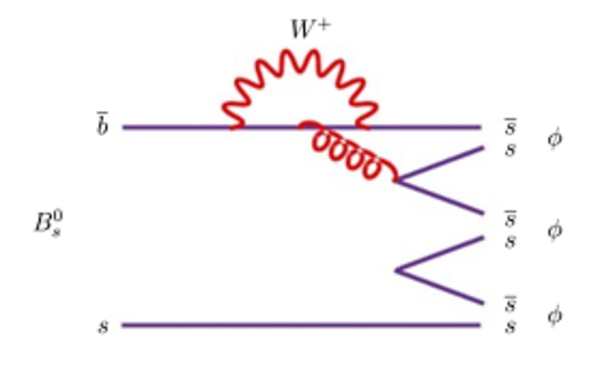
Study of charmonium production in ${b}$-hadron decays and first evidence for the decay ${{{B}} ^0_{{s}}} \rightarrow \phi \phi \phi $
[to restricted-access page]Information
LHCb-PAPER-2017-007
CERN-EP-2017-099
arXiv:1706.07013 [PDF]
(Submitted on 21 Jun 2017)
Eur. Phys. J. C77 (2017) 609
Inspire 1606204
Tools
Abstract
Using decays to $\phi$-meson pairs, the inclusive production of charmonium states in $b$-hadron decays is studied with $pp$ collision data corresponding to an integrated luminosity of $3.0fb^{-1}$, collected by the LHCb experiment at centre-of-mass energies of 7 and 8 TeV. Denoting by $B_C\equiv B(b\to CX)\times B(C\to\phi\phi)$ the inclusive branching fraction of a $b$ hadron to a charmonium state $C$ that decays into a pair of $\phi$ mesons, ratios $R^{C1}_{C2}\equiv B_{C1}/B_{C2}$ are determined as $R^{\chi_{c0}}_{\eta_c(1S)}=0.147\pm0.023\pm0.011$, $R^{\chi_{c1}}_{\eta_c (1S)}=0.073\pm0.016\pm0.006$, $R^{\chi_{c2}}_{\eta_c (1S)}=0.081\pm0.013\pm0.005$, $R^{\chi_{c1}}_{\chi_{c0}}=0.50\pm0.11\pm0.01$, $R^{\chi_{c2}}_{\chi_{c0}}=0.56\pm0.10\pm0.01$ and $R^{\eta_c (2S)}_{\eta_c(1S)}=0.040\pm0.011\pm0.004$. Here and below the first uncertainties are statistical and the second systematic. Upper limits at $90\%$ confidence level for the inclusive production of $X(3872)$, $X(3915)$ and $\chi_{c2}(2P)$ states are obtained as $R^{X(3872)}_{\chi_{c1}}<0.34$, $R^{X(3915)}_{\chi_{c0}}<0.12$ and $R^{\chi_{c2}(2P)}_{\chi_{c2}}<0.16$. Differential cross-sections as a function of transverse momentum are measured for the $\eta_c(1S)$ and $\chi_c$ states. The branching fraction of the decay $B_s^0\rightarrow\phi\phi\phi$ is measured for the first time, $B(B_s^0\to\phi\phi\phi)=(2.15\pm0.54\pm0.28\pm0.21_{B})\times 10^{-6}$. Here the third uncertainty is due to the branching fraction of the decay $B_s^0\to\phi\phi$, which is used for normalization. No evidence for intermediate resonances is seen. A preferentially transverse $\phi$ polarization is observed. The measurements allow the determination of the ratio of the branching fractions for the $\eta_c(1S)$ decays to $\phi\phi$ and $p\bar{p}$ as $B(\eta_c(1S)\to\phi\phi)/B(\eta_c(1S)\to p\bar{p})=1.79\pm0.14\pm0.32$.
Figures and captions
|
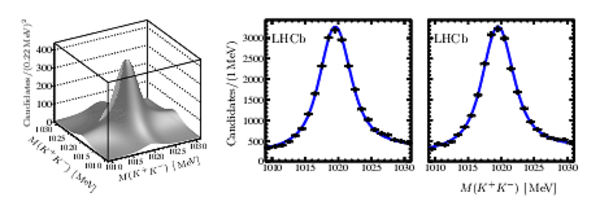
Result of the 2D fit to the $2 ( K^+ K^- )$ invariant mass distribution along with the projections to the $ K ^+ K ^- $ invariant mass axes in the $\eta _ c (1S)$ signal region. |
Fig_1.pdf [373 KiB] HiDef png [250 KiB] Thumbnail [196 KiB] *.C file tex code |
|
|
Result of the 2D fit to the $2 ( K^+ K^- )$ invariant mass distribution along with the projections to the $ K ^+ K ^- $ invariant mass axes in the $ B ^0_ s $ signal region. |
Fig_2.pdf [370 KiB] HiDef png [247 KiB] Thumbnail [195 KiB] *.C file tex code |

|
|
Projections to the $ K ^+ K ^- $ invariant mass axes of the 3D fit to the $3 ( K^+ K^- )$ invariant mass distribution in the $ B ^0_ s $ signal region. |
Fig_3.pdf [64 KiB] HiDef png [160 KiB] Thumbnail [149 KiB] *.C file tex code |

|
|
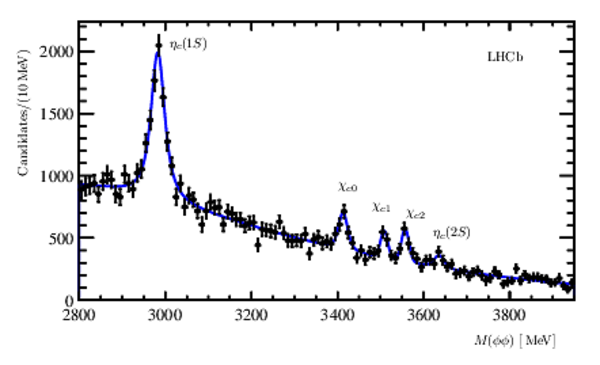
Distribution of the invariant mass of $\phi \phi$ combinations. The number of candidates in each bin is obtained from the corresponding 2D fit. The peaks corresponding to the $ c \overline c $ resonances are marked on the plot. The signal yields are given in Table 1. |
Fig_4.pdf [129 KiB] HiDef png [169 KiB] Thumbnail [159 KiB] *.C file tex code |
|
|
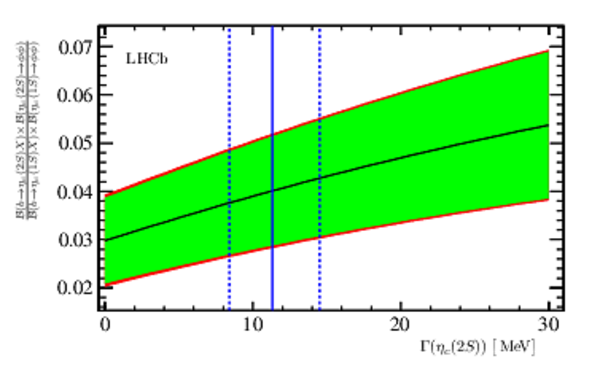
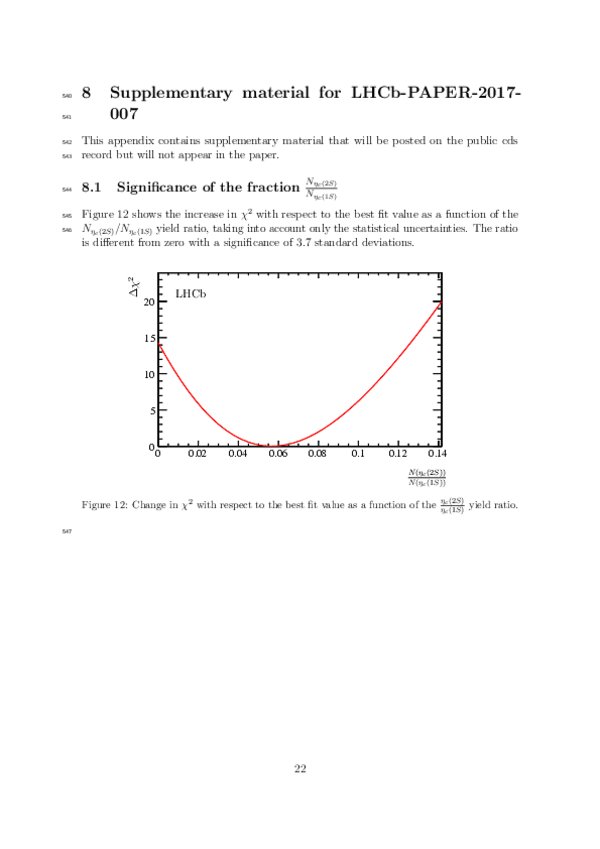
Ratio of the $\eta _ c (2S)$ and $\eta _ c (1S)$ inclusive yields $\frac{\mathcal{B} ( b \rightarrow \eta _ c (2S) X ) \times \mathcal{B} ( \eta _ c (2S) \rightarrow \phi \phi )}{\mathcal{B} ( b \rightarrow \eta _ c (1S) X ) \times \mathcal{B} ( \eta _ c (1S) \rightarrow \phi \phi )}$ as a function of the assumed $\eta _ c (2S)$ natural width. Statistical (green band) and total uncertainties are shown separately. The $\eta _ c (2S)$ natural width from Ref. [14] is shown as a vertical solid line; the dashed lines indicate its uncertainty. |
Fig_5.pdf [61 KiB] HiDef png [179 KiB] Thumbnail [160 KiB] *.C file tex code |
|
|
Differential cross-sections normalized to the production cross-section integrated over the studied region, $\sigma^*$, of the (top to bottom) $\eta _ c (1S)$, $\chi _{ c 0}$ , $\chi _{ c 1}$ and $\chi _{ c 2}$ states for the (left) $\sqrt{s} = 7 \mathrm{ Te V} $ and the (right) $\sqrt{s} = 8 \mathrm{ Te V} $ data samples. The horizontal and vertical size of the boxes reflect the size of the $p_{\mathrm{ T}}$ bins and the statistical and uncorrelated systematic uncertainties of the differential production cross-sections added in quadrature. The exponential functions proportional to $\exp (- \alpha p_{\mathrm{ T}} )$ fitted to the integral of the each bin of the distributions are overlaid. |
Fig_6.pdf [79 KiB] HiDef png [198 KiB] Thumbnail [123 KiB] *.C file tex code |

|
|
Contour plot of $\Gamma_{\eta _ c (1S)}$ and $M_{\eta _ c (1S)}$ using $\eta _ c \rightarrow \phi \phi$ decays. The two magenta curves indicate $\Delta\chi^2 = 1$ and $\Delta\chi^2 = 4$ contours. Only statistical uncertainties are shown. The red cross, black square and blue triangle with error bars indicate the world average [14], the result from Ref. [15], and the result from Ref. [61], respectively. |
Fig_7.pdf [1 KiB] HiDef png [1 KiB] Thumbnail [0 KiB] *.C file tex code |

|
|
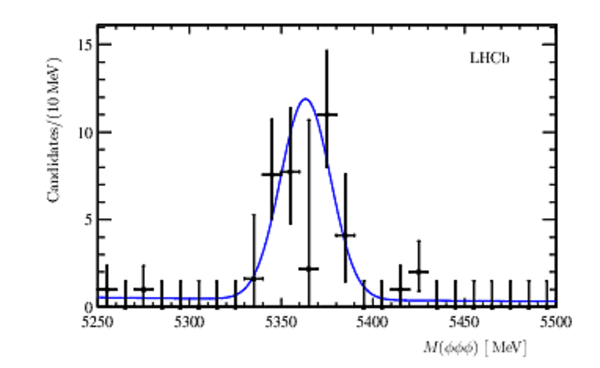
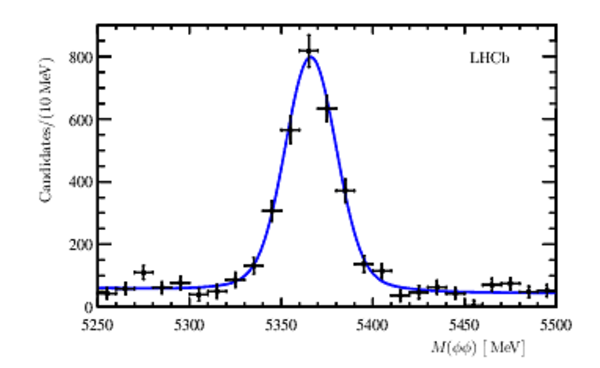
Invariant mass spectrum of the $\phi \phi \phi$ combinations in the region of the $ B ^0_ s $ mass, including the fit function described in the text. |
Fig_8.pdf [49 KiB] HiDef png [127 KiB] Thumbnail [129 KiB] *.C file tex code |
|
|
Invariant mass spectrum of the $\phi \phi$ combinations in the region of the $ B ^0_ s $ mass, including the fit function described in the text. |
Fig_9.pdf [35 KiB] HiDef png [135 KiB] Thumbnail [133 KiB] *.C file tex code |
|
|
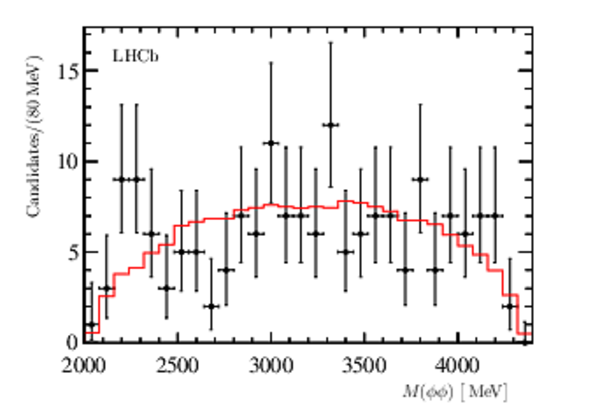
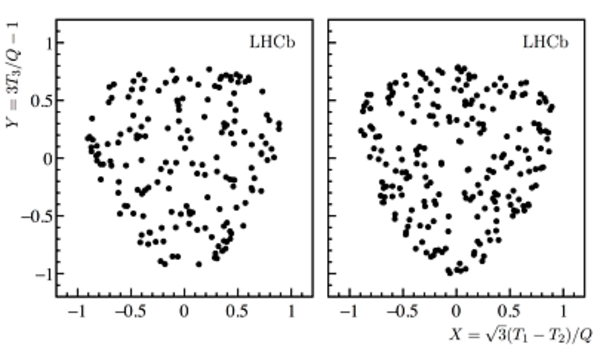
The invariant mass distribution of each combination of $\phi \phi$ pairs in the $ B ^0_ s \rightarrow \phi \phi \phi$ candidates. The $ B ^0_ s $ candidates are constrained to the known $ B ^0_ s $ mass. A phase-space distribution as obtained from simulation (red histogram) is overlaid. |
Fig_10.pdf [34 KiB] HiDef png [133 KiB] Thumbnail [168 KiB] *.C file tex code |
|
|
The $\phi$ meson angular distribution for the $ B ^0_ s \rightarrow \phi \phi \phi$ candidates (points with error bars) with the overlaid distribution from the simulation with no polarization (red solid histogram) and two extreme, transverse (green dashed histogram) and longitudinal (blue dotted histogram), polarizations. |
Fig_11.pdf [33 KiB] HiDef png [186 KiB] Thumbnail [194 KiB] *.C file tex code |

|
|
Animated gif made out of all figures. |
PAPER-2017-007.gif Thumbnail |

|
Tables and captions
|
Signal yields with statistical uncertainties of the fit to the spectrum of the $\phi \phi$ invariant mass. |
Table_1.pdf [44 KiB] HiDef png [86 KiB] Thumbnail [37 KiB] tex code |

|
|
The ratio of charmonium signal yields with respect to the $\eta _ c (1S)$ yield and between pairs of $\chi _{c}$ states. The first uncertainties are statistical and the second systematic. |
Table_2.pdf [58 KiB] HiDef png [128 KiB] Thumbnail [56 KiB] tex code |

|
|
Systematic uncertainties of the charmonium event yield ratios within families and with respect to the $\eta _ c (1S)$ yield. The total uncertainty is the sum in quadrature of the individual contributions. |
Table_3.pdf [47 KiB] HiDef png [74 KiB] Thumbnail [32 KiB] tex code |

|
|
Exponential slope parameter in units of $\mathrm{ Ge V} ^{-1}$ from a fit to the $p_{\mathrm{ T}}$ spectra of $\eta _ c (1S)$, $\chi _{ c 0}$ , $\chi _{ c 1}$ and $\chi _{ c 2}$ mesons. |
Table_4.pdf [42 KiB] HiDef png [29 KiB] Thumbnail [15 KiB] tex code |

|
|
Charmonium masses and natural widths in$ \mathrm{ Me V} $. |
Table_5.pdf [66 KiB] HiDef png [90 KiB] Thumbnail [46 KiB] tex code |

|
|
Charmonium mass differences (in$ \mathrm{ Me V} $). |
Table_6.pdf [58 KiB] HiDef png [42 KiB] Thumbnail [21 KiB] tex code |

|
Supplementary Material [file]


![HiDef png [250 KiB]](Directory_LHCb-PAPER-2017-007/hidef_Fig_1.png)
![HiDef png [247 KiB]](Directory_LHCb-PAPER-2017-007/hidef_Fig_2.png)
![HiDef png [160 KiB]](Directory_LHCb-PAPER-2017-007/hidef_Fig_3.png)
![HiDef png [169 KiB]](Directory_LHCb-PAPER-2017-007/hidef_Fig_4.png)
![HiDef png [179 KiB]](Directory_LHCb-PAPER-2017-007/hidef_Fig_5.png)
![HiDef png [198 KiB]](Directory_LHCb-PAPER-2017-007/hidef_Fig_6.png)
![HiDef png [1 KiB]](Directory_LHCb-PAPER-2017-007/hidef_Fig_7.png)
![HiDef png [127 KiB]](Directory_LHCb-PAPER-2017-007/hidef_Fig_8.png)
![HiDef png [135 KiB]](Directory_LHCb-PAPER-2017-007/hidef_Fig_9.png)
![HiDef png [133 KiB]](Directory_LHCb-PAPER-2017-007/hidef_Fig_10.png)
![HiDef png [186 KiB]](Directory_LHCb-PAPER-2017-007/hidef_Fig_11.png)
![HiDef png [86 KiB]](Directory_LHCb-PAPER-2017-007/hidef_Table_1.png)
![HiDef png [128 KiB]](Directory_LHCb-PAPER-2017-007/hidef_Table_2.png)
![HiDef png [74 KiB]](Directory_LHCb-PAPER-2017-007/hidef_Table_3.png)
![HiDef png [29 KiB]](Directory_LHCb-PAPER-2017-007/hidef_Table_4.png)
![HiDef png [90 KiB]](Directory_LHCb-PAPER-2017-007/hidef_Table_5.png)
![HiDef png [42 KiB]](Directory_LHCb-PAPER-2017-007/hidef_Table_6.png)
![HiDef png [117 KiB]](Directory_LHCb-PAPER-2017-007/supplementary/hidef_supp_Fig12.png)
![HiDef png [337 KiB]](Directory_LHCb-PAPER-2017-007/supplementary/hidef_supp_Fig13.png)
![HiDef png [753 KiB]](Directory_LHCb-PAPER-2017-007/supplementary/hidef_supp_Fig14.png)
![HiDef png [856 KiB]](Directory_LHCb-PAPER-2017-007/supplementary/hidef_supp_Fig15.png)
![HiDef png [352 KiB]](Directory_LHCb-PAPER-2017-007/supplementary/hidef_supp_Fig16.png)
![HiDef png [261 KiB]](Directory_LHCb-PAPER-2017-007/supplementary/hidef_supp_Fig17.png)
![HiDef png [212 KiB]](Directory_LHCb-PAPER-2017-007/supplementary/hidef_supp_Fig18.png)
Created on 26 April 2024.