Search for $CP$ violation through an amplitude analysis of $D^0\rightarrow K^+ K^- \pi^+ \pi^-$ decays
[to restricted-access page]Information
LHCb-PAPER-2018-041
CERN-EP-2018-299
arXiv:1811.08304 [PDF]
ancillary file
(Submitted on 20 Nov 2018)
JHEP 02 (2019) 126
Inspire 1704426
Tools
Abstract
A search for $CP$ violation in the Cabibbo-suppressed $D^0 \rightarrow K^+ K^- \pi^+ \pi^-$ decay mode is performed using an amplitude analysis. The measurement uses a sample of $pp$ collisions recorded by the LHCb experiment during 2011 and 2012, corresponding to an integrated luminosity of 3.0 fb$^{-1}$. The $D^0$ mesons are reconstructed from semileptonic $b$-hadron decays into $D^0\mu^- X$ final states. The selected sample contains more than 160000 signal decays, allowing the most precise amplitude modelling of this $D^0$ decay to date. The obtained amplitude model is used to perform the search for $CP$ violation. The result is compatible with $CP$ symmetry, with a sensitivity ranging from 1 to 15 depending on the amplitude considered.
Figures and captions
|
Mass distribution of the $ D ^0 \rightarrow K ^+ K ^- \pi ^+ \pi ^- $ candidates after the final selection, with fit result superimposed. The top plot shows the normalised residuals. |
Fig1.pdf [44 KiB] HiDef png [279 KiB] Thumbnail [220 KiB] *.C file |

|
|
Definition of the helicity angles $\theta_{K}$ and $\theta_{\pi}$, and the decay-plane angle $\phi$. |
Fig2.pdf [23 KiB] HiDef png [46 KiB] Thumbnail [21 KiB] *.C file |

|
|
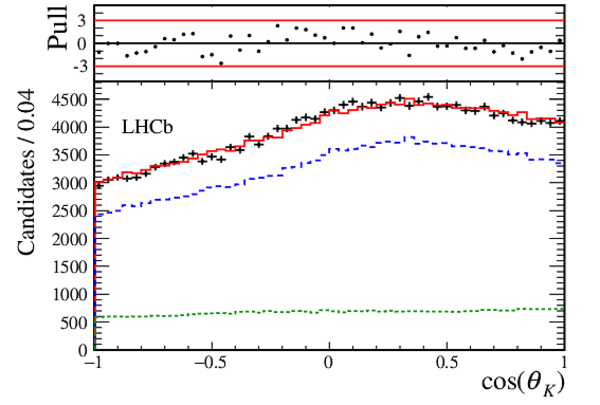
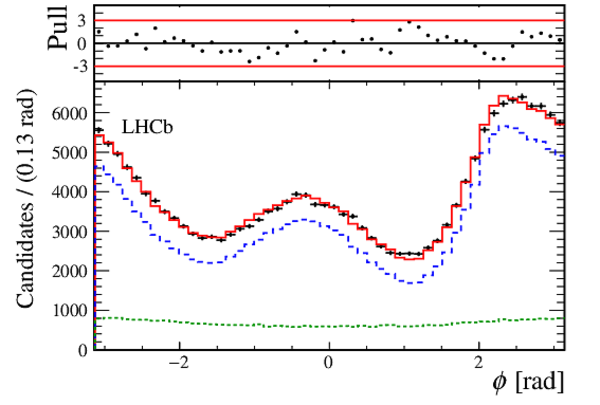
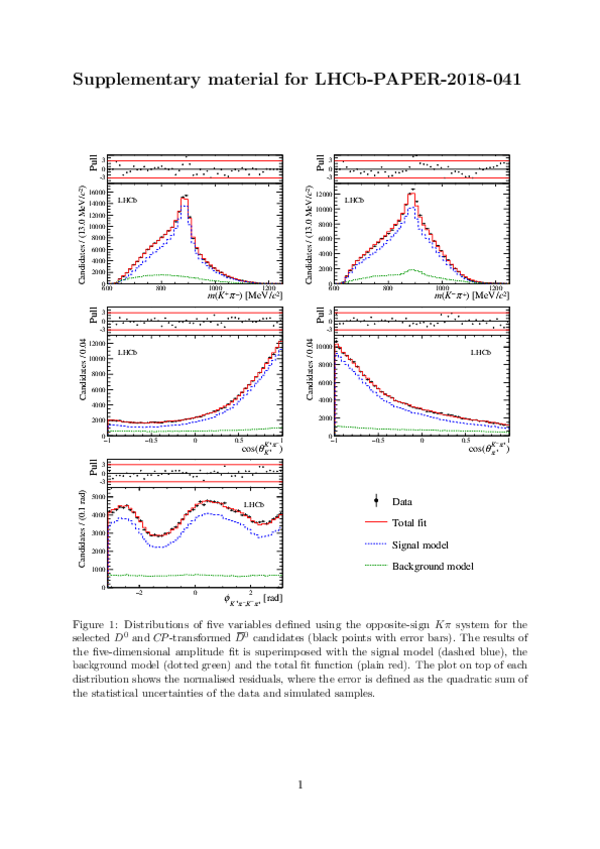
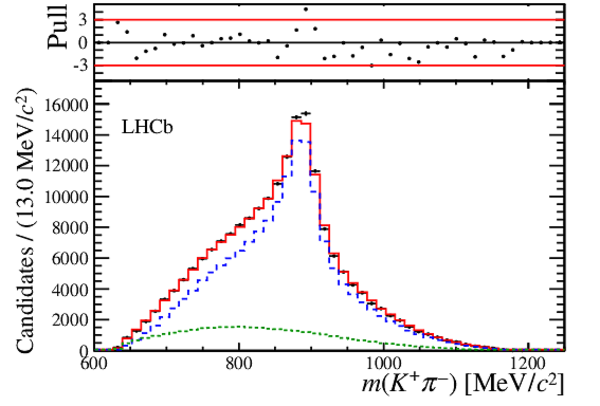
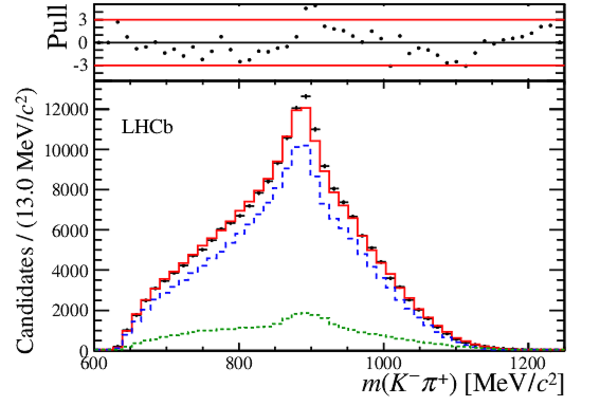
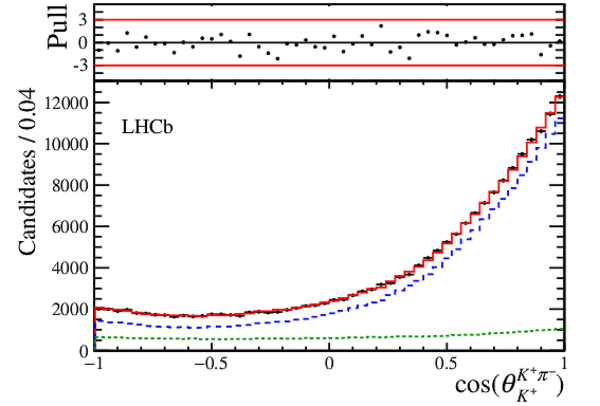
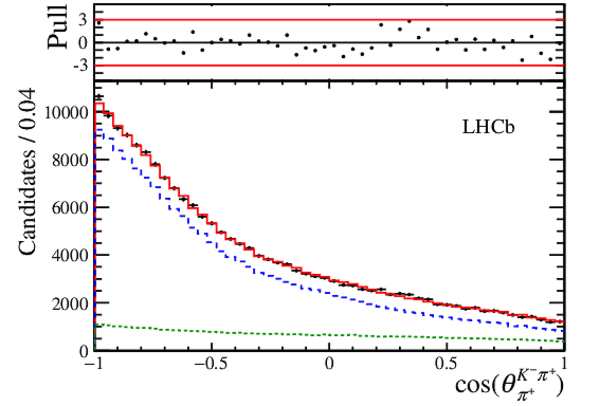
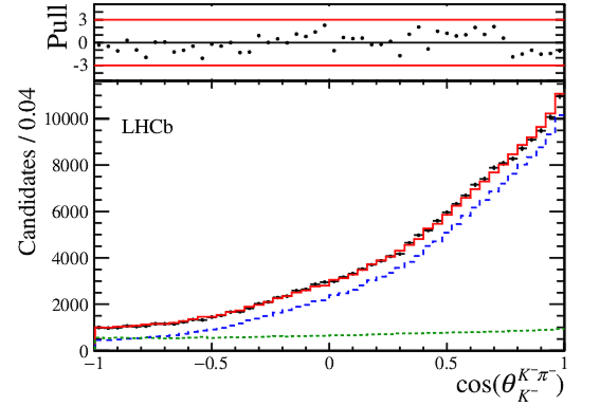
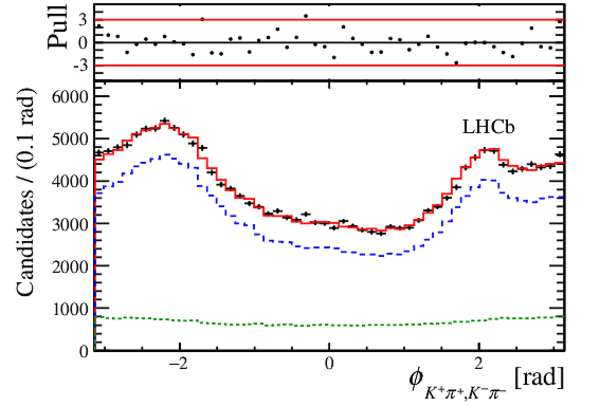
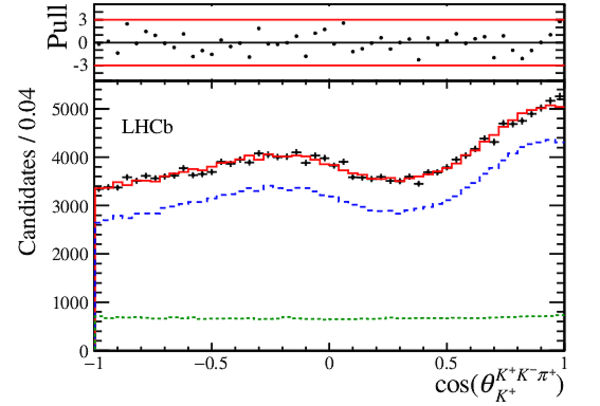
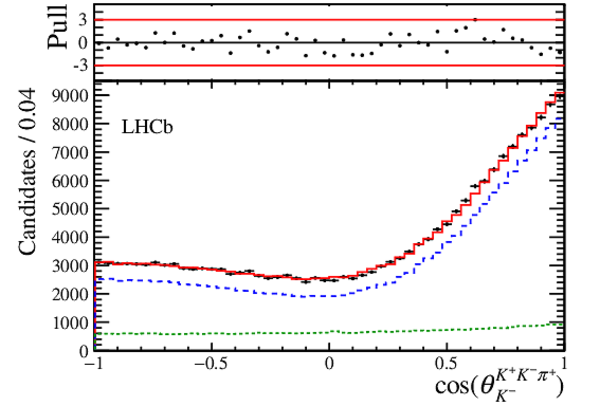
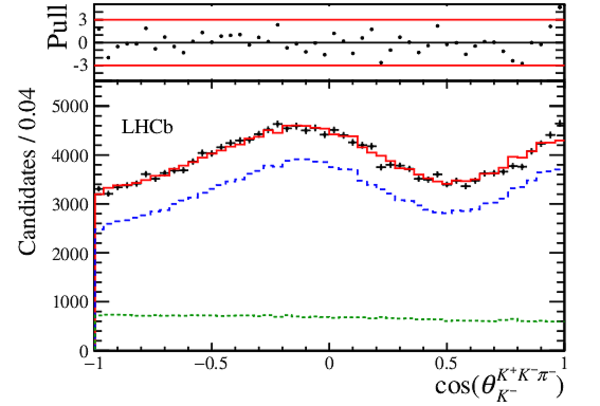
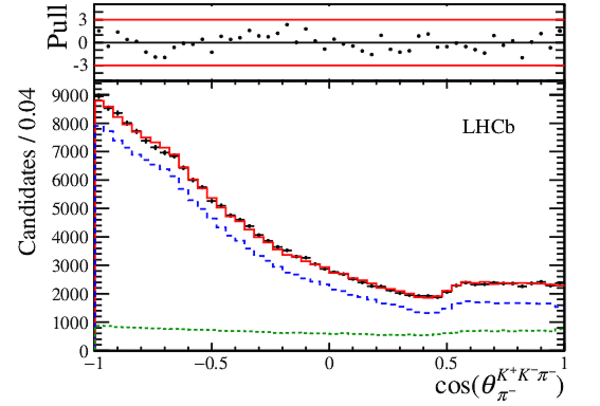
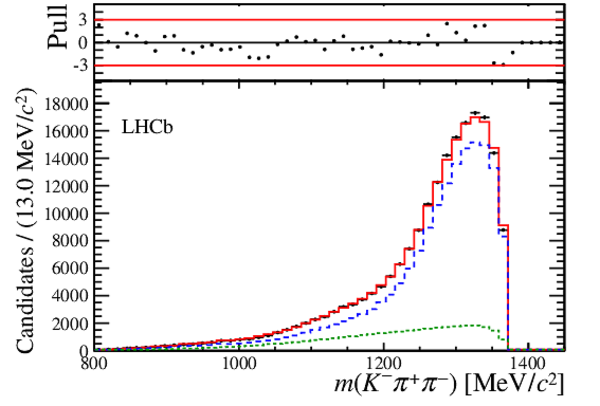
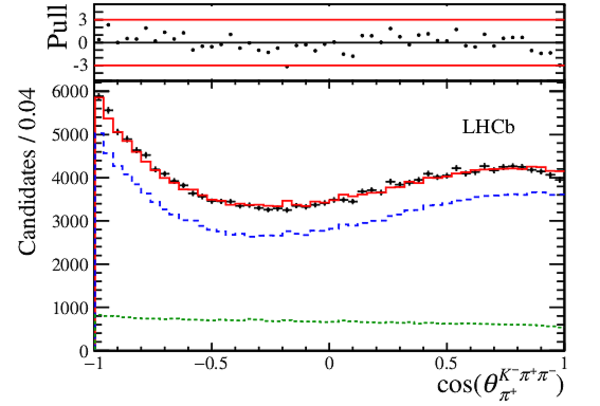
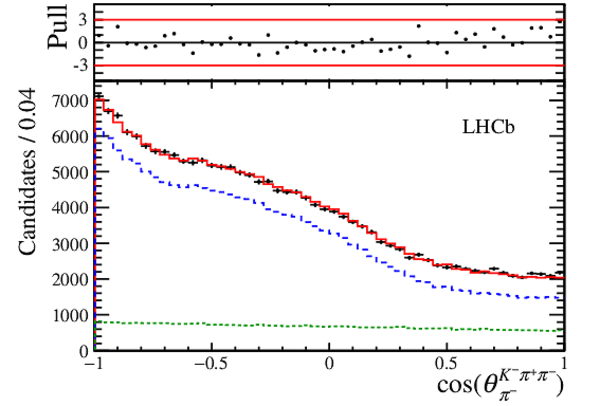
Distributions of the five CM variables for the selected $ D ^0$ and $ C P$ -transformed $\overline{ D }{} {}^0$ candidates (black points with error bars). The results of the five-dimensional amplitude fit is superimposed with the signal model (dashed blue), the background model (dotted green) and the total fit function (plain red). The plot on top of each distribution shows the normalised residuals, where the error is defined as the quadratic sum of the statistical uncertainties of the data and simulated samples. |
Fig3a.pdf [19 KiB] HiDef png [198 KiB] Thumbnail [179 KiB] *.C file |

|
|
Fig3b.pdf [25 KiB] HiDef png [212 KiB] Thumbnail [176 KiB] *.C file |

|
|
|
Fig3c.pdf [20 KiB] HiDef png [179 KiB] Thumbnail [167 KiB] *.C file |
|
|
|
Fig3d.pdf [20 KiB] HiDef png [168 KiB] Thumbnail [151 KiB] *.C file |

|
|
|
Fig3e.pdf [20 KiB] HiDef png [173 KiB] Thumbnail [155 KiB] *.C file |
|
|
|
Fig3f.pdf [12 KiB] HiDef png [74 KiB] Thumbnail [65 KiB] *.C file |
|
|
|
Animated gif made out of all figures. |
PAPER-2018-041.gif Thumbnail |

|
Tables and captions
|
Resonances considered in the analysis, classified according to their spin-parity $J^P$ and decay products. |
Table_1.pdf [61 KiB] HiDef png [57 KiB] Thumbnail [25 KiB] tex code |

|
|
Modulus and phase of the fit parameters along with the fit fractions of the amplitudes included in the model. The substructures of the three-body resonances are listed in Table 3. The first uncertainty is statistical and the second is systematic. |
Table_2.pdf [76 KiB] HiDef png [246 KiB] Thumbnail [107 KiB] tex code |

|
|
Parameters of the amplitudes contributing to the three-body decays of the $a_1(1260)^+$, $K_1(1270)^+$ and $K_1(1400)^+$. The first uncertainty is statistical and the second is systematic. |
Table_3.pdf [74 KiB] HiDef png [65 KiB] Thumbnail [27 KiB] tex code |

|
|
Parameters of the $\rho-\omega$ interference for all relevant amplitudes. The first uncertainty is statistical and the second is systematic. |
Table_4.pdf [72 KiB] HiDef png [115 KiB] Thumbnail [48 KiB] tex code |

|
|
$ C P$ -violation parameters fitted simultaneously to the $ D ^0$ and ( $ C P$ -transformed) $\overline{ D }{} {}^0$ samples. The first uncertainty is statistical and the second is systematic. |
Table_5.pdf [81 KiB] HiDef png [262 KiB] Thumbnail [133 KiB] tex code |

|
|
Modulus and phase of the fit parameters along with the fit fractions of the amplitudes included in the alternative model using the $K^*(1410)^0$ instead of the $K^*(1680)^0$ resonance. |
Table_6.pdf [72 KiB] HiDef png [317 KiB] Thumbnail [151 KiB] tex code |

|
|
Modulus and phase of the fit parameters along with the fit fractions of the amplitudes included in the alternative model using five additional amplitudes. |
Table_7.pdf [72 KiB] HiDef png [375 KiB] Thumbnail [178 KiB] tex code |

|
|
Modulus and phase of the fit parameters along with the fit fractions of the amplitudes of the alternative model that includes the amplitude $ D ^0 \rightarrow \rho(1450)^0\rho(770)^0$ in $D$-wave. |
Table_8.pdf [72 KiB] HiDef png [330 KiB] Thumbnail [156 KiB] tex code |

|
|
Statistical and systematic uncertainties (in %) on the fit fractions. Values smaller than 0.0005% are displayed as "0.000". The sources of systematic uncertainty are described in the text in the same order as shown in this table. |
Table_9.pdf [79 KiB] HiDef png [290 KiB] Thumbnail [99 KiB] tex code |

|
|
Statistical and systematic uncertainties on the fit parameters shown for all floating components. Values smaller than 0.0005 are displayed as "0.000". The sources of systematic uncertainty are described in the text in the same order as shown in this table. For each amplitude, the first value quoted is the modulus and the second is the phase of the complex fit parameter. |
Table_10.pdf [79 KiB] HiDef png [417 KiB] Thumbnail [145 KiB] tex code |

|
|
Statistical and systematic uncertainties (in %) on $A_{\mathcal{F}_k}$. Values smaller than 0.0005% are displayed as "0.000". The sources of systematic uncertainty are described in the text in the same order as shown in this table. |
Table_11.pdf [79 KiB] HiDef png [184 KiB] Thumbnail [66 KiB] tex code |

|
|
Statistical and systematic uncertainties (in %) on the $ C P$ -violation parameters shown for all floating components. Values smaller than 0.0005% are displayed as "0.000". The sources of systematic uncertainty are described in the text in the same order as shown in this table. For each amplitude, the first value quoted is the modulus asymmetry and the second is the phase difference. |
Table_12.pdf [80 KiB] HiDef png [300 KiB] Thumbnail [105 KiB] tex code |

|
Supplementary Material [file]


![HiDef png [279 KiB]](Directory_LHCb-PAPER-2018-041/hidef_Fig1.png)
![HiDef png [46 KiB]](Directory_LHCb-PAPER-2018-041/hidef_Fig2.png)
![HiDef png [198 KiB]](Directory_LHCb-PAPER-2018-041/hidef_Fig3a.png)
![HiDef png [212 KiB]](Directory_LHCb-PAPER-2018-041/hidef_Fig3b.png)
![HiDef png [179 KiB]](Directory_LHCb-PAPER-2018-041/hidef_Fig3c.png)
![HiDef png [168 KiB]](Directory_LHCb-PAPER-2018-041/hidef_Fig3d.png)
![HiDef png [173 KiB]](Directory_LHCb-PAPER-2018-041/hidef_Fig3e.png)
![HiDef png [74 KiB]](Directory_LHCb-PAPER-2018-041/hidef_Fig3f.png)
![HiDef png [57 KiB]](Directory_LHCb-PAPER-2018-041/hidef_Table_1.png)
![HiDef png [246 KiB]](Directory_LHCb-PAPER-2018-041/hidef_Table_2.png)
![HiDef png [65 KiB]](Directory_LHCb-PAPER-2018-041/hidef_Table_3.png)
![HiDef png [115 KiB]](Directory_LHCb-PAPER-2018-041/hidef_Table_4.png)
![HiDef png [262 KiB]](Directory_LHCb-PAPER-2018-041/hidef_Table_5.png)
![HiDef png [317 KiB]](Directory_LHCb-PAPER-2018-041/hidef_Table_6.png)
![HiDef png [375 KiB]](Directory_LHCb-PAPER-2018-041/hidef_Table_7.png)
![HiDef png [330 KiB]](Directory_LHCb-PAPER-2018-041/hidef_Table_8.png)
![HiDef png [290 KiB]](Directory_LHCb-PAPER-2018-041/hidef_Table_9.png)
![HiDef png [417 KiB]](Directory_LHCb-PAPER-2018-041/hidef_Table_10.png)
![HiDef png [184 KiB]](Directory_LHCb-PAPER-2018-041/hidef_Table_11.png)
![HiDef png [300 KiB]](Directory_LHCb-PAPER-2018-041/hidef_Table_12.png)
![HiDef png [192 KiB]](Directory_LHCb-PAPER-2018-041/supplementary/hidef_Fig1a-S.png)
![HiDef png [184 KiB]](Directory_LHCb-PAPER-2018-041/supplementary/hidef_Fig1b-S.png)
![HiDef png [166 KiB]](Directory_LHCb-PAPER-2018-041/supplementary/hidef_Fig1c-S.png)
![HiDef png [171 KiB]](Directory_LHCb-PAPER-2018-041/supplementary/hidef_Fig1d-S.png)
![HiDef png [174 KiB]](Directory_LHCb-PAPER-2018-041/supplementary/hidef_Fig1e-S.png)
![HiDef png [74 KiB]](Directory_LHCb-PAPER-2018-041/supplementary/hidef_Fig1f-S.png)
![HiDef png [184 KiB]](Directory_LHCb-PAPER-2018-041/supplementary/hidef_Fig2a-S.png)
![HiDef png [201 KiB]](Directory_LHCb-PAPER-2018-041/supplementary/hidef_Fig2b-S.png)
![HiDef png [172 KiB]](Directory_LHCb-PAPER-2018-041/supplementary/hidef_Fig2c-S.png)
![HiDef png [164 KiB]](Directory_LHCb-PAPER-2018-041/supplementary/hidef_Fig2d-S.png)
![HiDef png [176 KiB]](Directory_LHCb-PAPER-2018-041/supplementary/hidef_Fig2e-S.png)
![HiDef png [74 KiB]](Directory_LHCb-PAPER-2018-041/supplementary/hidef_Fig2f-S.png)
![HiDef png [184 KiB]](Directory_LHCb-PAPER-2018-041/supplementary/hidef_Fig3a-S.png)
![HiDef png [172 KiB]](Directory_LHCb-PAPER-2018-041/supplementary/hidef_Fig3b-S.png)
![HiDef png [186 KiB]](Directory_LHCb-PAPER-2018-041/supplementary/hidef_Fig3c-S.png)
![HiDef png [191 KiB]](Directory_LHCb-PAPER-2018-041/supplementary/hidef_Fig3d-S.png)
![HiDef png [74 KiB]](Directory_LHCb-PAPER-2018-041/supplementary/hidef_Fig3e-S.png)
![HiDef png [181 KiB]](Directory_LHCb-PAPER-2018-041/supplementary/hidef_Fig4a-S.png)
![HiDef png [184 KiB]](Directory_LHCb-PAPER-2018-041/supplementary/hidef_Fig4b-S.png)
![HiDef png [172 KiB]](Directory_LHCb-PAPER-2018-041/supplementary/hidef_Fig4c-S.png)
![HiDef png [190 KiB]](Directory_LHCb-PAPER-2018-041/supplementary/hidef_Fig4d-S.png)
![HiDef png [74 KiB]](Directory_LHCb-PAPER-2018-041/supplementary/hidef_Fig4e-S.png)
![HiDef png [188 KiB]](Directory_LHCb-PAPER-2018-041/supplementary/hidef_Fig5a-S.png)
![HiDef png [179 KiB]](Directory_LHCb-PAPER-2018-041/supplementary/hidef_Fig5b-S.png)
![HiDef png [186 KiB]](Directory_LHCb-PAPER-2018-041/supplementary/hidef_Fig5c-S.png)
![HiDef png [184 KiB]](Directory_LHCb-PAPER-2018-041/supplementary/hidef_Fig5d-S.png)
![HiDef png [74 KiB]](Directory_LHCb-PAPER-2018-041/supplementary/hidef_Fig5e-S.png)
![HiDef png [199 KiB]](Directory_LHCb-PAPER-2018-041/supplementary/hidef_Fig6a-S.png)
![HiDef png [176 KiB]](Directory_LHCb-PAPER-2018-041/supplementary/hidef_Fig6b-S.png)
![HiDef png [179 KiB]](Directory_LHCb-PAPER-2018-041/supplementary/hidef_Fig6c-S.png)
![HiDef png [182 KiB]](Directory_LHCb-PAPER-2018-041/supplementary/hidef_Fig6d-S.png)
![HiDef png [74 KiB]](Directory_LHCb-PAPER-2018-041/supplementary/hidef_Fig6e-S.png)
Created on 27 April 2024.