Study of the $B^0\to \rho(770)^0 K^*(892)^0$ decay with an amplitude analysis of $B^0\to (\pi^+\pi^-) (K^+\pi^-)$ decays
[to restricted-access page]Information
LHCb-PAPER-2018-042
CERN-EP-2018-316
arXiv:1812.07008 [PDF]
(Submitted on 17 Dec 2018)
JHEP 05 (2019) 026
Inspire 1709949
Tools
Abstract
An amplitude analysis of ${B^0\to (\pi^+\pi^-) (K^+\pi^-)}$ decays is performed in the two-body invariant mass regions ${300 < m(\pi^+\pi^-)<1100}$ MeV/$c^2$, accounting for the $\rho^0$, $\omega$, $f_0(500)$, $f_0(980)$ and $f_0(1370)$ resonances, and ${750 < m(K^+\pi^-)<1200}$ MeV/$c^2$, which is dominated by the $K^{*}(892)^0$ meson. The analysis uses 3 fb$^{-1}$ of proton-proton collision data collected by the LHCb experiment at centre-of-mass energies of 7 and 8 TeV. The $CP$ averages and asymmetries are measured for the magnitudes and phase differences of the contributing amplitudes. The $CP$-averaged longitudinal polarisation fractions of the vector-vector modes are found to be $\tilde{f}^0_{\rho K^{*}} = 0.164 \pm 0.015 \pm 0.022$ and $\tilde{f}^0_{\omega K^{*}} = 0.68 \pm 0.17 \pm 0.16$, and their $CP$ asymmetries, $\mathcal{A}^0_{\rho K^{*}} = -0.62 \pm 0.09 \pm 0.09$ and $\mathcal{A}^0_{\omega K^{*}} = -0.13 \pm 0.27 \pm 0.13$, where the first uncertainty is statistical and the second systematic.
Figures and captions
|
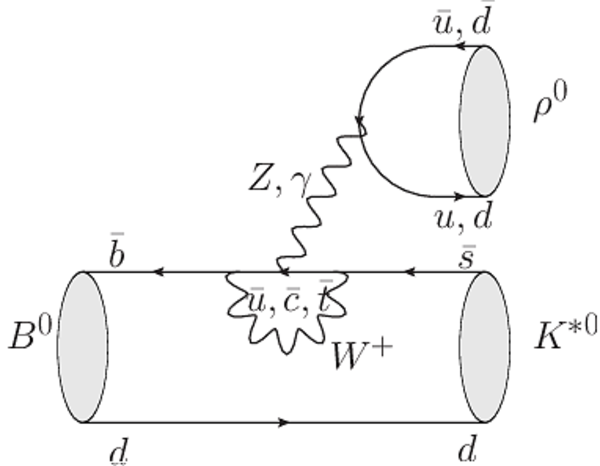
Leading Feynman diagrams in the $ B ^0 \rightarrow \rho ^0 K ^{*0} $ decay, from left to right: doubly Cabibbo-suppressed tree, gluonic-penguin and electroweak-penguin diagrams. |
BRhoKs[..].pdf [8 KiB] HiDef png [204 KiB] Thumbnail [129 KiB] *.C file |

|
|
BRhoKst_GP.pdf [9 KiB] HiDef png [282 KiB] Thumbnail [171 KiB] *.C file |

|
|
|
BRhoKs[..].pdf [9 KiB] HiDef png [243 KiB] Thumbnail [152 KiB] *.C file |
|
|
|
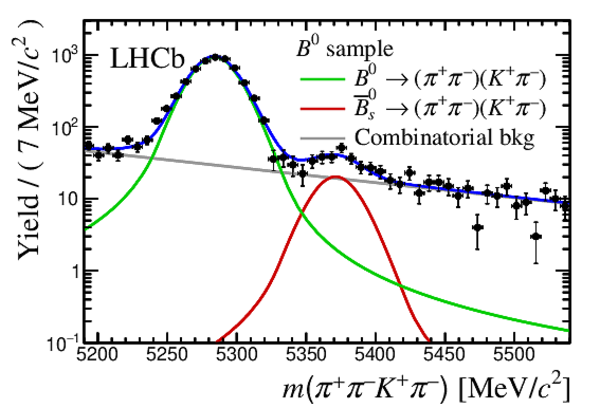
Fit to the invariant-mass distribution of selected (left) $ B ^0$ and (right) $\overline{ B }{} {}^0$ candidates after the subtraction of $ B ^0_ s \rightarrow K ^{*0} \overline{ K }{} {}^{*0} $ background decays. The four trigger and data-taking year categories are aggregated in the figures. The contributions due to the $ B ^0 \rightarrow (\pi ^+ \pi ^- )( K ^+ \pi ^- )$ signal, $\overline{ B }{} {}^0_ s \rightarrow (\pi ^+ \pi ^- )( K ^+ \pi ^- )$ background and combinatorial background are represented by the solid green, red and grey lines, respectively. Data are shown using black dots and the overall fit is represented by the solid blue line. |
paper_mB.pdf [26 KiB] HiDef png [297 KiB] Thumbnail [246 KiB] *.C file |
|
|
paper_[..].pdf [26 KiB] HiDef png [294 KiB] Thumbnail [245 KiB] *.C file |

|
|
|
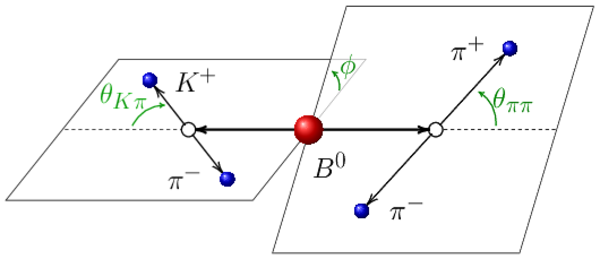
Definition of the helicity angles in the $ B ^0 \rightarrow \rho ^0 K ^{*0} $ decay. |
angles.pdf [26 KiB] HiDef png [136 KiB] Thumbnail [84 KiB] *.C file |
|
|
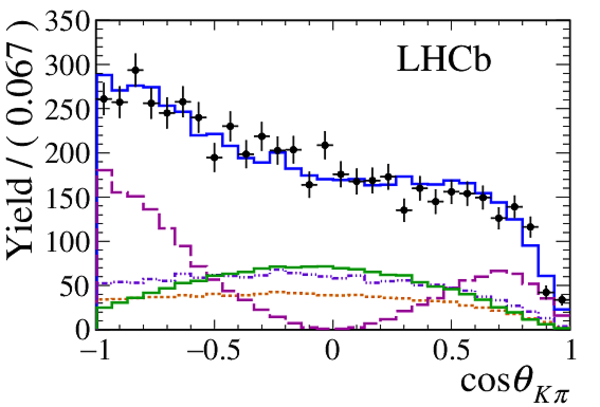
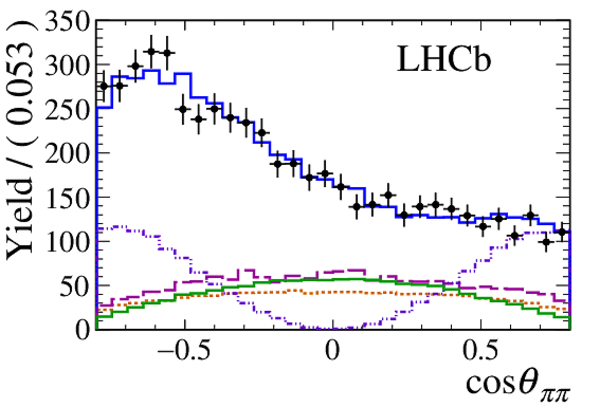
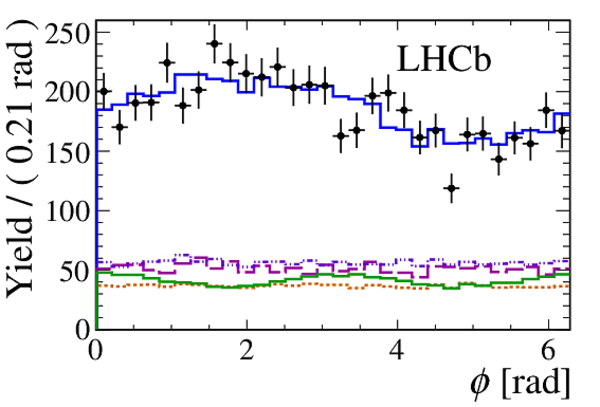
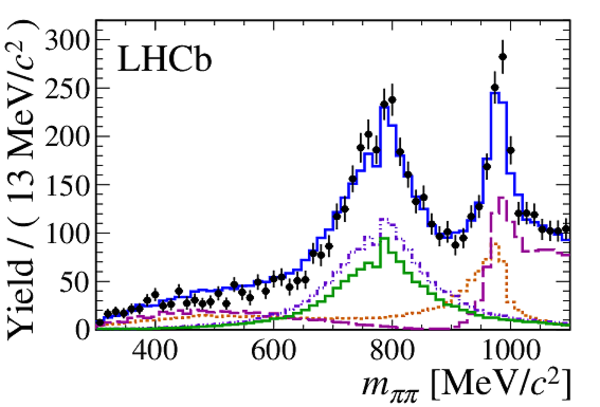
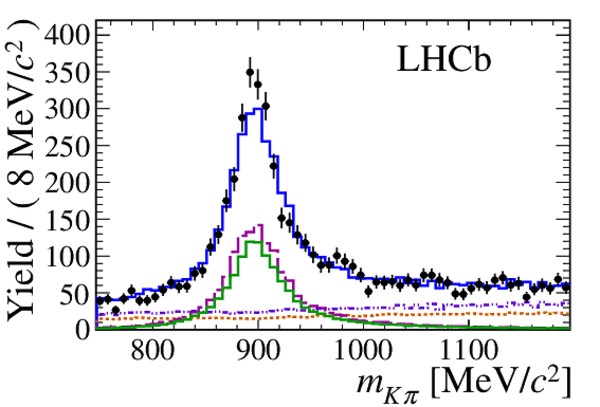
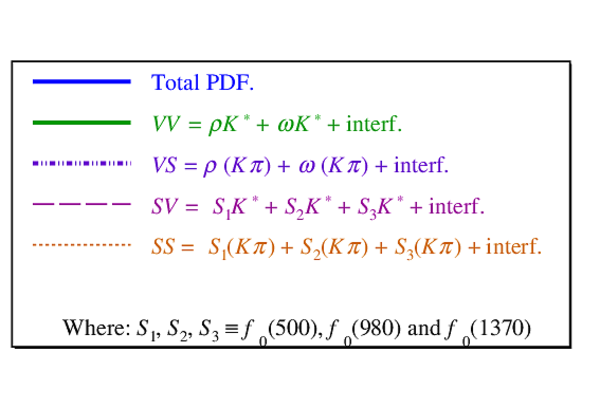
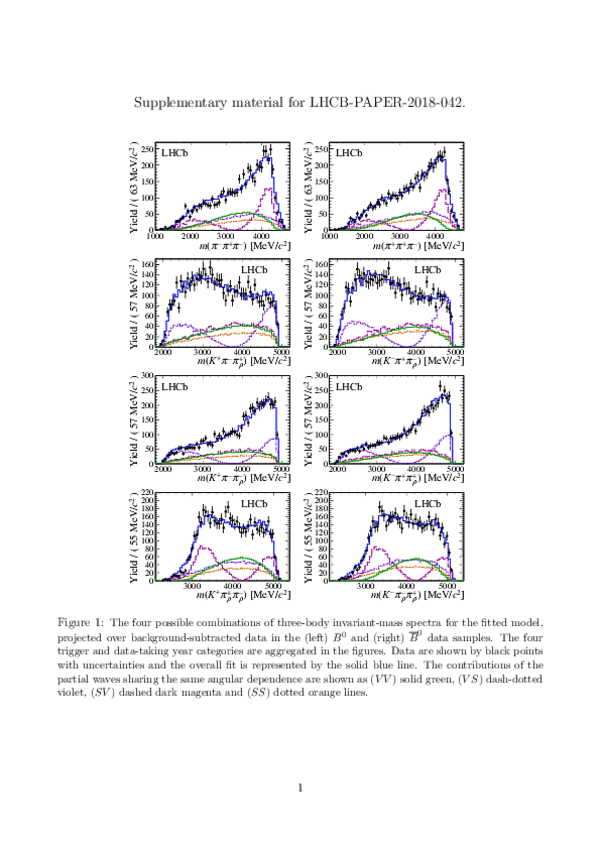
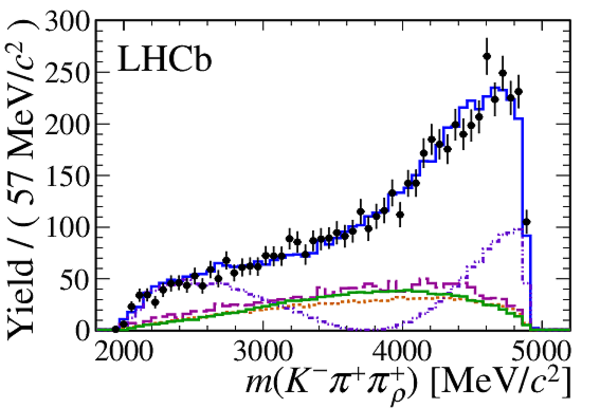
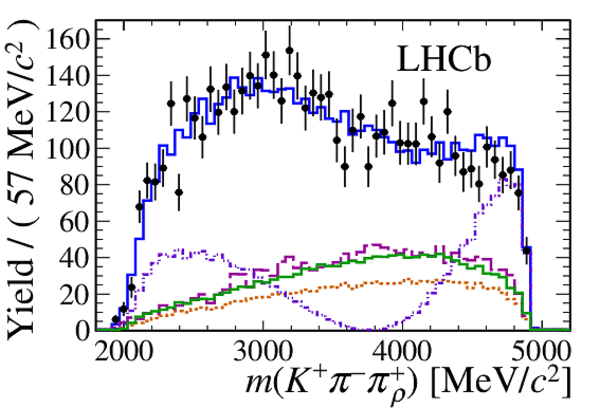
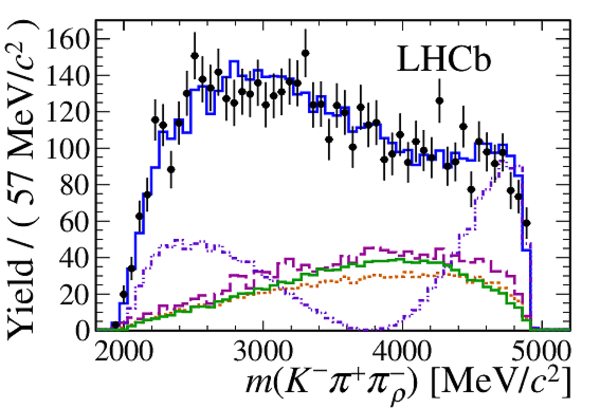
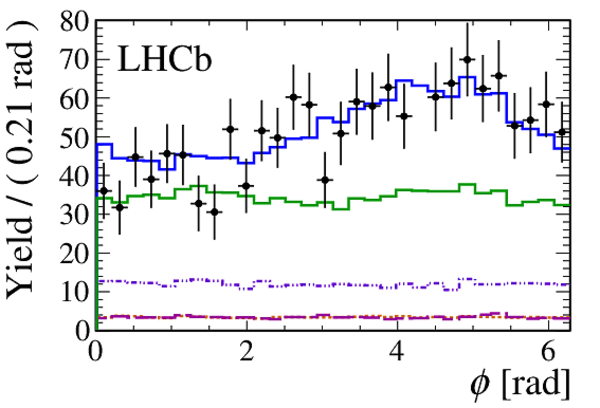
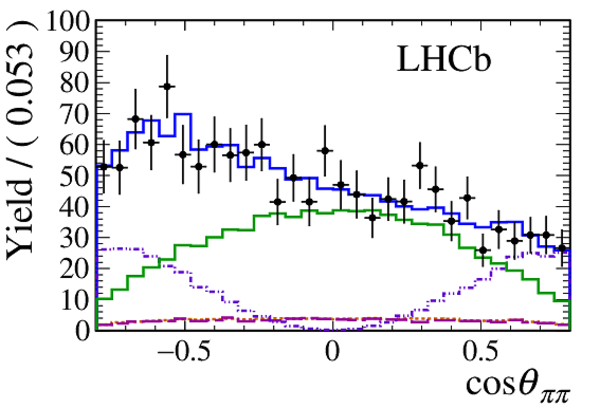
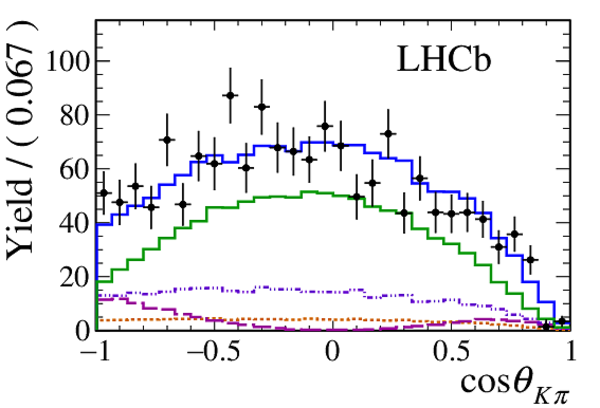
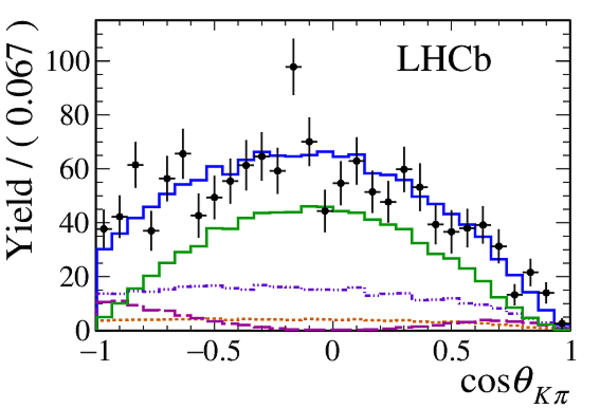
Projections of the amplitude fit to the (left) $ B ^0$ and (right) $\overline{ B }{} {}^0$ data samples. The four trigger and data-taking year categories are aggregated in the figures. Data are shown by black points with uncertainties and the overall fit is represented by the solid blue line. The contributions of the partial waves sharing the same angular dependence are shown as ($VV$) solid green, ($VS$) dash-dotted violet, ($SV$) dashed dark magenta and ($SS$) dotted orange lines. Direct $ C P$ -violating effects are most visible in the projections of the $VV$ component over $\cos\theta_{K\pi}$ and $\cos\theta_{\pi\pi}$ and in the different oscillation frequency in $\phi$. |
B_cosT[..].pdf [17 KiB] HiDef png [213 KiB] Thumbnail [198 KiB] *.C file |
|
|
Bbar_c[..].pdf [17 KiB] HiDef png [216 KiB] Thumbnail [198 KiB] *.C file |

|
|
|
B_cosT[..].pdf [17 KiB] HiDef png [214 KiB] Thumbnail [193 KiB] *.C file |

|
|
|
Bbar_c[..].pdf [17 KiB] HiDef png [218 KiB] Thumbnail [194 KiB] *.C file |
|
|
|
B_phi_[..].pdf [16 KiB] HiDef png [191 KiB] Thumbnail [169 KiB] *.C file |

|
|
|
Bbar_p[..].pdf [16 KiB] HiDef png [194 KiB] Thumbnail [172 KiB] *.C file |
|
|
|
B_m1_MCvis.pdf [24 KiB] HiDef png [254 KiB] Thumbnail [221 KiB] *.C file |

|
|
|
Bbar_m[..].pdf [24 KiB] HiDef png [262 KiB] Thumbnail [229 KiB] *.C file |
|
|
|
B_m2_MCvis.pdf [25 KiB] HiDef png [254 KiB] Thumbnail [227 KiB] *.C file |

|
|
|
Bbar_m[..].pdf [25 KiB] HiDef png [255 KiB] Thumbnail [228 KiB] *.C file |
|
|
|
Legend for the plots. The partial waves sharing the same angular dependence are represented as ($VV$) solid green, ($VS$) dash-dotted violet, ($SV$) dashed dark magenta and ($SS$) dotted orange lines. The overall fit is shown by a solid blue line. |
paper_[..].pdf [13 KiB] HiDef png [220 KiB] Thumbnail [130 KiB] *.C file |
|
|
Animated gif made out of all figures. |
PAPER-2018-042.gif Thumbnail |

|
Tables and captions
|
Yields obtained in the extended simultaneous four-body invariant mass fit to the four categories and for the two final states. The quoted uncertainties are statistical only. |
Table_1.pdf [77 KiB] HiDef png [80 KiB] Thumbnail [40 KiB] tex code |

|
|
Contributions to the total amplitude and their angular and mass dependencies. |
Table_2.pdf [87 KiB] HiDef png [134 KiB] Thumbnail [58 KiB] tex code |

|
|
Numerical fit results for the $ C P$ averages and asymmetries in the (top) modulus and (bottom) phase differences of all the contributing amplitudes and among the $VV$ polarisation fractions. For the numbers in the table, the first and second uncertainties correspond to the statistical and total systematic, respectively. The total systematic uncertainty is obtained from the sum in quadrature of the individual sources detailed in Sect. ???, accounting for 100% correlation of the common systematic uncertainties for $ B ^0$ and $\overline{ B }{} {}^0$ . |
Table_3.pdf [89 KiB] HiDef png [320 KiB] Thumbnail [153 KiB] tex code |

|
|
Comparison of theoretical predictions for the $ B ^0 \rightarrow \rho (770)^0 K ^* (892)^0$ mode with the results obtained from this analysis. It should be noted that the theoretical predictions involving the $ C P$ averaged value of $\delta^\perp_{\rho K ^* }$ have been shifted by $\pi$ on account of the different phase conventions used in the theoretical and experimental works. |
Table_4.pdf [89 KiB] HiDef png [106 KiB] Thumbnail [47 KiB] tex code |

|
|
Table (I) of the systematic uncertainties. The abbreviations $S1, S2$ and $S3$ stand for $f_0(500), f_0(980)$ and $f_0(1370)$, respectively. Negligible values are represented by a dash ($-$). |
Table_5.pdf [84 KiB] HiDef png [189 KiB] Thumbnail [67 KiB] tex code |

|
|
Table (II) of the systematic uncertainties. The abbreviations $S1, S2$ and $S3$ stand for $f_0(500), f_0(980)$ and $f_0(1370)$, respectively. Negligible values are represented by a dash ($-$). |
Table_6.pdf [84 KiB] HiDef png [202 KiB] Thumbnail [73 KiB] tex code |

|
|
Central values of the mass-propagator parameters and their uncertainties, used to estimate the corresponding systematic uncertainties. The values of the parameters used to describe the $f_0(500)$ and $f_0(1370)$ resonances were taken from Ref. \cite{Aaij:2014emv} and the rest, from Ref. \cite{PDG2018}. |
Table_7.pdf [92 KiB] HiDef png [227 KiB] Thumbnail [106 KiB] tex code |

|
Supplementary Material [file]


![HiDef png [204 KiB]](Directory_LHCb-PAPER-2018-042/hidef_BRhoKst_Tree.png)
![HiDef png [282 KiB]](Directory_LHCb-PAPER-2018-042/hidef_BRhoKst_GP.png)
![HiDef png [243 KiB]](Directory_LHCb-PAPER-2018-042/hidef_BRhoKst_EWP.png)
![HiDef png [297 KiB]](Directory_LHCb-PAPER-2018-042/hidef_paper_mB.png)
![HiDef png [294 KiB]](Directory_LHCb-PAPER-2018-042/hidef_paper_mBbar.png)
![HiDef png [136 KiB]](Directory_LHCb-PAPER-2018-042/hidef_angles.png)
![HiDef png [213 KiB]](Directory_LHCb-PAPER-2018-042/hidef_B_cosTheta1_MCvis.png)
![HiDef png [216 KiB]](Directory_LHCb-PAPER-2018-042/hidef_Bbar_cosTheta1_MCvis.png)
![HiDef png [214 KiB]](Directory_LHCb-PAPER-2018-042/hidef_B_cosTheta2_MCvis.png)
![HiDef png [218 KiB]](Directory_LHCb-PAPER-2018-042/hidef_Bbar_cosTheta2_MCvis.png)
![HiDef png [191 KiB]](Directory_LHCb-PAPER-2018-042/hidef_B_phi_MCvis.png)
![HiDef png [194 KiB]](Directory_LHCb-PAPER-2018-042/hidef_Bbar_phi_MCvis.png)
![HiDef png [254 KiB]](Directory_LHCb-PAPER-2018-042/hidef_B_m1_MCvis.png)
![HiDef png [262 KiB]](Directory_LHCb-PAPER-2018-042/hidef_Bbar_m1_MCvis.png)
![HiDef png [254 KiB]](Directory_LHCb-PAPER-2018-042/hidef_B_m2_MCvis.png)
![HiDef png [255 KiB]](Directory_LHCb-PAPER-2018-042/hidef_Bbar_m2_MCvis.png)
![HiDef png [220 KiB]](Directory_LHCb-PAPER-2018-042/hidef_paper_legend.png)
![HiDef png [80 KiB]](Directory_LHCb-PAPER-2018-042/hidef_Table_1.png)
![HiDef png [134 KiB]](Directory_LHCb-PAPER-2018-042/hidef_Table_2.png)
![HiDef png [320 KiB]](Directory_LHCb-PAPER-2018-042/hidef_Table_3.png)
![HiDef png [106 KiB]](Directory_LHCb-PAPER-2018-042/hidef_Table_4.png)
![HiDef png [189 KiB]](Directory_LHCb-PAPER-2018-042/hidef_Table_5.png)
![HiDef png [202 KiB]](Directory_LHCb-PAPER-2018-042/hidef_Table_6.png)
![HiDef png [227 KiB]](Directory_LHCb-PAPER-2018-042/hidef_Table_7.png)
![HiDef png [275 KiB]](Directory_LHCb-PAPER-2018-042/supplementary/hidef_Fig1_MKpi1pi2B.png)
![HiDef png [276 KiB]](Directory_LHCb-PAPER-2018-042/supplementary/hidef_Fig1_MKpi1pi2Bbar.png)
![HiDef png [258 KiB]](Directory_LHCb-PAPER-2018-042/supplementary/hidef_Fig1_MKpipiOSB.png)
![HiDef png [257 KiB]](Directory_LHCb-PAPER-2018-042/supplementary/hidef_Fig1_MKpipiOSBbar.png)
![HiDef png [291 KiB]](Directory_LHCb-PAPER-2018-042/supplementary/hidef_Fig1_MKpipiSSB.png)
![HiDef png [293 KiB]](Directory_LHCb-PAPER-2018-042/supplementary/hidef_Fig1_MKpipiSSBbar.png)
![HiDef png [256 KiB]](Directory_LHCb-PAPER-2018-042/supplementary/hidef_Fig1_m3piB.png)
![HiDef png [260 KiB]](Directory_LHCb-PAPER-2018-042/supplementary/hidef_Fig1_m3piBbar.png)
![HiDef png [198 KiB]](Directory_LHCb-PAPER-2018-042/supplementary/hidef_Fig2_Phi_B.png)
![HiDef png [199 KiB]](Directory_LHCb-PAPER-2018-042/supplementary/hidef_Fig2_Phi_Bbar.png)
![HiDef png [216 KiB]](Directory_LHCb-PAPER-2018-042/supplementary/hidef_Fig2_cosThetaKPi_B.png)
![HiDef png [215 KiB]](Directory_LHCb-PAPER-2018-042/supplementary/hidef_Fig2_cosThetaKPi_Bbar.png)
![HiDef png [192 KiB]](Directory_LHCb-PAPER-2018-042/supplementary/hidef_Fig2_cosThetaPiPi_B.png)
![HiDef png [194 KiB]](Directory_LHCb-PAPER-2018-042/supplementary/hidef_Fig2_cosThetaPiPi_Bbar.png)
Created on 27 April 2024.