Nuclear modification factor of neutral pions in the forward and backward regions in $p$Pb collisions
[to restricted-access page]Information
LHCb-PAPER-2021-053
CERN-EP-2022-050
arXiv:2204.10608 [PDF]
(Submitted on 22 Apr 2022)
Phys. Rev. Lett. 131 (2023) 042302
Inspire 2680578
Tools
Abstract
The nuclear modification factor of neutral pions is measured in proton-lead collisions collected at a center-of-mass energy per nucleon of $8.16 {\rm TeV}$ with the LHCb detector. The $\pi^0$ production cross section is measured differentially in transverse momentum ($p_{\rm T}$) for $1.5<p_{\rm T}<10.0 {\rm GeV}$ and in center-of-mass pseudorapidity ($\eta_{\rm c.m.}$) regions $2.5<\eta_{\rm c.m.}<3.5$ (forward) and $-4.0<\eta_{\rm c.m.}<-3.0$ (backward) defined relative to the proton beam direction. The forward measurement shows a sizable suppression of $\pi^0$ production, while the backward measurement shows the first evidence of $\pi^0$ enhancement in proton-lead collisions at the LHC. Together, these measurements provide precise constraints on models of nuclear structure and particle production in high-energy nuclear collisions.
Figures and captions
|
Example $M(\gamma\gamma)$ distribution in forward $p$-Pb collisions at $\sqrt{s_{\rm NN}}=8.16 \text{ Te V} $ for $2.5<\eta_{\rm c.m.}<3.5$ and $2.0< p_{\mathrm{T}} (\pi ^0 )<2.2 \text{ Ge V} $. Fit results are overlaid with the total fit shown as a solid line. The combinatorial (Comb.) and bremsstrahlung (Brem.) backgrounds are shown as light and dark shaded regions, respectively. |
Fig1.pdf [137 KiB] HiDef png [248 KiB] Thumbnail [251 KiB] *.C file |

|
|
Measured $\pi ^0 $ differential cross sections versus $ p_{\mathrm{T}} $ in the (top) backward and (bottom) forward $\eta_{\rm c.m.}$ regions. Statistical uncertainties are shown by error bars, while systematic uncertainties are shown by boxes. The $pp$ cross sections are scaled by the atomic mass of the lead ion, $A=208$. |
Fig2.pdf [140 KiB] HiDef png [439 KiB] Thumbnail [399 KiB] *.C file |

|
|
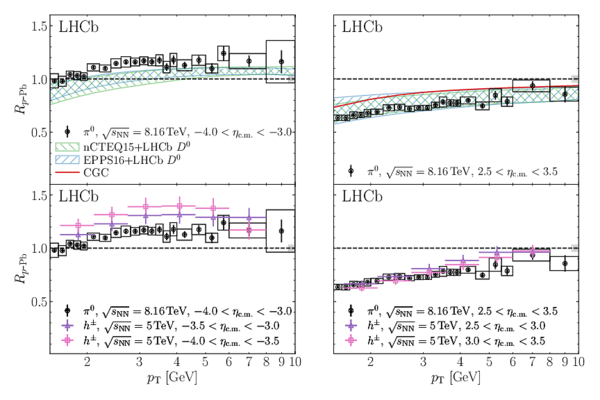
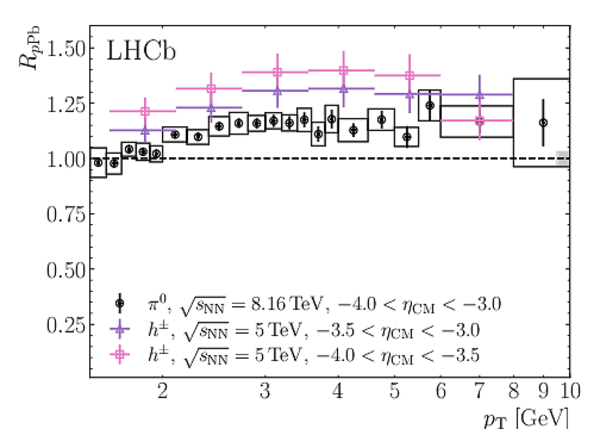
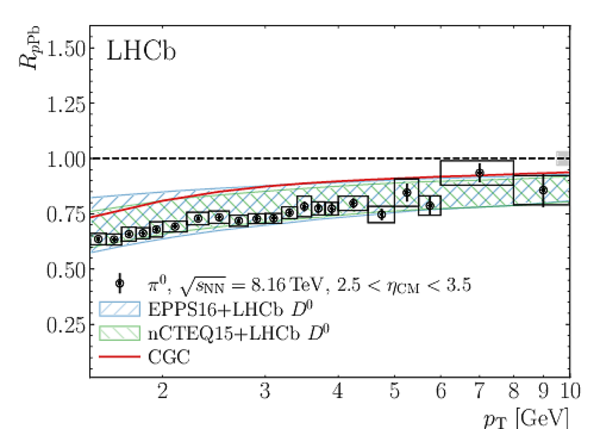
Measured $\pi ^0 $ nuclear modification factor in the (left) backward and (right) forward $\eta_{\rm c.m.}$ regions. Error bars show the statistical uncertainty, while the open boxes show the $ p_{\mathrm{T}}$ -dependent systematic uncertainties. The solid gray boxes show the overall normalization uncertainties from the luminosity estimate and efficiency correction factors. The results are compared to (top) theoretical predictions [47,49,52] and (bottom) to charged-particle data from Ref. [15]. The hatched regions show the NPDF uncertainties of the PQCD calculations. The vertical error bars on the charged-particle results show the combined systematic and statistical uncertainties. |
Fig3.pdf [216 KiB] HiDef png [349 KiB] Thumbnail [271 KiB] *.C file |
|
|
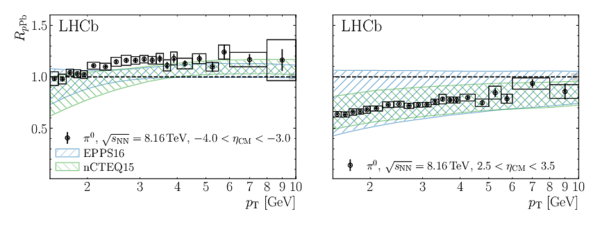
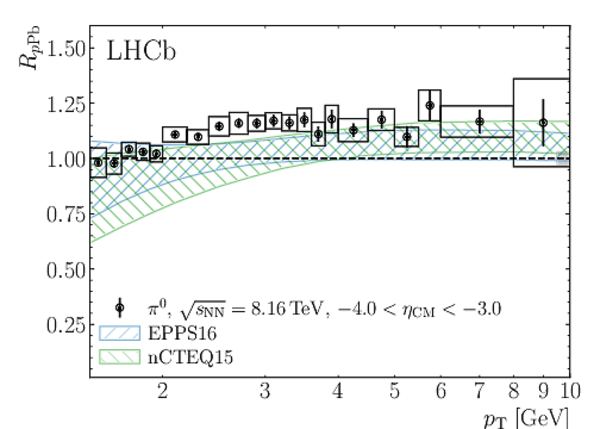
Measured $\pi^0$ nuclear modification factor in the (left) backward and (right) forward $\eta_{\rm CM}$ regions. The error bars show the statistical uncertainties, while the open boxes show the $ p_{\mathrm{T}}$ -dependent systematic uncertainties. The solid black boxes show the overall normalization uncertainties from the luminosity estimate and efficiency correction factors. The measurements are compared to NLO PQCD predictions [47] calculated using the EPPS16 [2] and nCTEQ15 [3] NPDF sets. |
FigS1.pdf [170 KiB] HiDef png [245 KiB] Thumbnail [164 KiB] *.C file |
|
|
Animated gif made out of all figures. |
PAPER-2021-053.gif Thumbnail |

|
Tables and captions
|
Relative systematic and statistical uncertainties in $d\sigma/d p_{\mathrm{T}} $ and $R_{p -{\rm Pb}}$ in percent. The ranges correspond to the minimum and maximum values of the associated uncertainties across all $ p_{\mathrm{T}} $ intervals and both $\eta_{\rm c.m.}$ regions. The $d\sigma/d p_{\mathrm{T}} $ ranges cover the uncertainties for each of the $p$-Pb and $pp$ samples. All sources of systematic uncertainty are fully correlated across $ p_{\mathrm{T}} $ intervals. |
Table_1.pdf [62 KiB] HiDef png [63 KiB] Thumbnail [31 KiB] tex code |

|
Supplementary Material [file]


![HiDef png [248 KiB]](Directory_LHCb-PAPER-2021-053/hidef_Fig1.png)
![HiDef png [439 KiB]](Directory_LHCb-PAPER-2021-053/hidef_Fig2.png)
![HiDef png [349 KiB]](Directory_LHCb-PAPER-2021-053/hidef_Fig3.png)
![HiDef png [245 KiB]](Directory_LHCb-PAPER-2021-053/hidef_FigS1.png)
![HiDef png [63 KiB]](Directory_LHCb-PAPER-2021-053/hidef_Table_1.png)
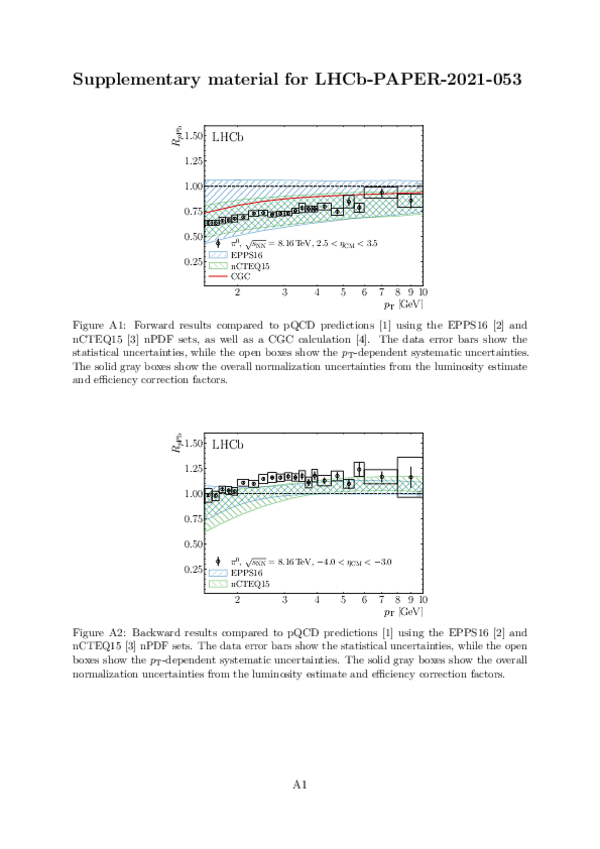
![HiDef png [473 KiB]](Directory_LHCb-PAPER-2021-053/supplementary/hidef_FigA1.png)
![HiDef png [357 KiB]](Directory_LHCb-PAPER-2021-053/supplementary/hidef_FigA2.png)
![HiDef png [188 KiB]](Directory_LHCb-PAPER-2021-053/supplementary/hidef_FigA3.png)
![HiDef png [188 KiB]](Directory_LHCb-PAPER-2021-053/supplementary/hidef_FigA4.png)
![HiDef png [375 KiB]](Directory_LHCb-PAPER-2021-053/supplementary/hidef_FigA5.png)
![HiDef png [320 KiB]](Directory_LHCb-PAPER-2021-053/supplementary/hidef_FigA6.png)
Created on 27 April 2024.