Test of lepton flavour universality using $B^0 \to D^{*-}\tau^+\nu_{\tau}$ decays with hadronic $\tau$ channels
[to restricted-access page]Information
LHCb-PAPER-2022-052
CERN-EP-2023-062
arXiv:2305.01463 [PDF]
(Submitted on 02 May 2023)
Phys. Rev. D108 (2023) 012018
Inspire 2682591
Tools
Abstract
The branching fraction $\mathcal{B}(B^0 \to D^{*-}\tau^+\nu_{\tau})$ is measured relative to that of the normalisation mode $B^0 \to D^{*-}\pi^+\pi^-\pi^+$ using hadronic $\tau^+ \to \pi^+\pi^-\pi^+(\pi^0)\bar{\nu}_{\tau}$ decays in proton-proton collision data at a centre-of-mass energy of 13 TeV collected by the LHCb experiment, corresponding to an integrated luminosity of 2 fb$^{-1}$. The measured ratio is $\mathcal{B}(B^0 \to D^{*-}\tau^+\nu_{\tau})/\mathcal{B}(B^0 \to D^{*-}\pi^+\pi^-\pi^+)= 1.70 \pm 0.10^{+0.11}_{-0.10}$, where the first uncertainty is statistical and the second is related to systematic effects. Using established branching fractions for the $B^0 \to D^{*-}\pi^+\pi^-\pi^+$ and $B^0 \to D^{*-} \mu^+\nu_\mu$ modes, the lepton universality test, $\mathcal{R}(D^{*-}) \equiv \mathcal{B}(B^0 \to D^{*-}\tau^+\nu_{\tau})/\mathcal{B}(B^0 \to D^{*-} \mu^+\nu_\mu)$ is calculated, $$ \mathcal{R}(D^{*-}) = 0.247 \pm 0.015 \pm 0.015 \pm 0.012 , $$ where the third uncertainty is due to the uncertainties on the external branching fractions. This result is consistent with the Standard Model prediction and with previous measurements.
Figures and captions


![HiDef png [134 KiB]](Directory_LHCb-PAPER-2022-052/hidef_Fig1a.png)
![HiDef png [147 KiB]](Directory_LHCb-PAPER-2022-052/hidef_Fig1b.png)
![HiDef png [159 KiB]](Directory_LHCb-PAPER-2022-052/hidef_Fig1c.png)
![HiDef png [170 KiB]](Directory_LHCb-PAPER-2022-052/hidef_Fig1d.png)
![HiDef png [49 KiB]](Directory_LHCb-PAPER-2022-052/hidef_Fig1e.png)
![HiDef png [172 KiB]](Directory_LHCb-PAPER-2022-052/hidef_Fig2a.png)
![HiDef png [176 KiB]](Directory_LHCb-PAPER-2022-052/hidef_Fig2b.png)
![HiDef png [140 KiB]](Directory_LHCb-PAPER-2022-052/hidef_Fig2c.png)
![HiDef png [155 KiB]](Directory_LHCb-PAPER-2022-052/hidef_Fig2d.png)
![HiDef png [57 KiB]](Directory_LHCb-PAPER-2022-052/hidef_Fig2e.png)
![HiDef png [533 KiB]](Directory_LHCb-PAPER-2022-052/hidef_Fig3.png)
![HiDef png [115 KiB]](Directory_LHCb-PAPER-2022-052/hidef_Fig4a.png)
![HiDef png [102 KiB]](Directory_LHCb-PAPER-2022-052/hidef_Fig4b.png)
![HiDef png [100 KiB]](Directory_LHCb-PAPER-2022-052/hidef_Fig4c.png)
![HiDef png [92 KiB]](Directory_LHCb-PAPER-2022-052/hidef_Fig4d.png)
![HiDef png [227 KiB]](Directory_LHCb-PAPER-2022-052/hidef_Fig5a.png)
![HiDef png [197 KiB]](Directory_LHCb-PAPER-2022-052/hidef_Fig5b.png)
Tables and captions
|
Relative fractions of various $ D ^+_ s \rightarrow 3\pi X $ decays obtained from the fit to the $ D ^+_ s $ control sample (see \cref{fig:dspfit}) before applying any bias correction to the mean value of its uncertainty. |
Table_1.pdf [70 KiB] HiDef png [206 KiB] Thumbnail [96 KiB] tex code |

|
|
Decay fractions for $ B \rightarrow D ^{*-} D ^+_ s (X) $ decays obtained from data control samples. The fractions are normalised relative to that of the $ B ^0 \rightarrow D ^{*-} D ^{*+}_ s $ decay. |
Table_2.pdf [91 KiB] HiDef png [61 KiB] Thumbnail [30 KiB] tex code |

|
|
List of components in the signal yield extraction fit and their normalisation. |
[Error creating the table] | |
|
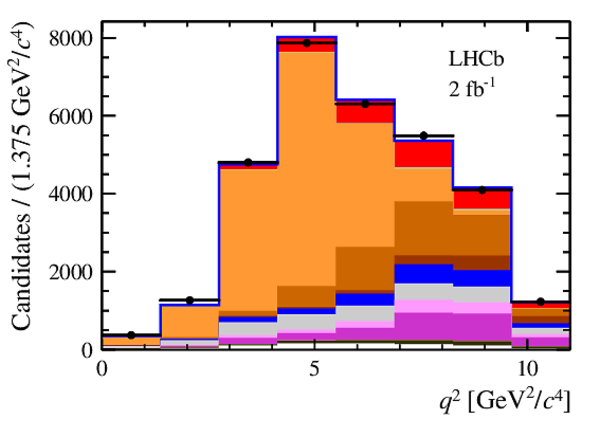
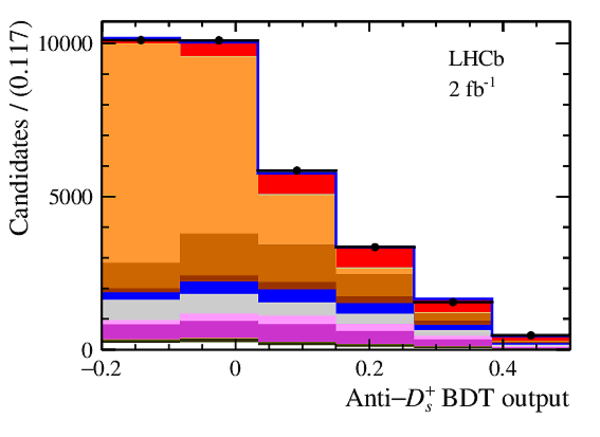
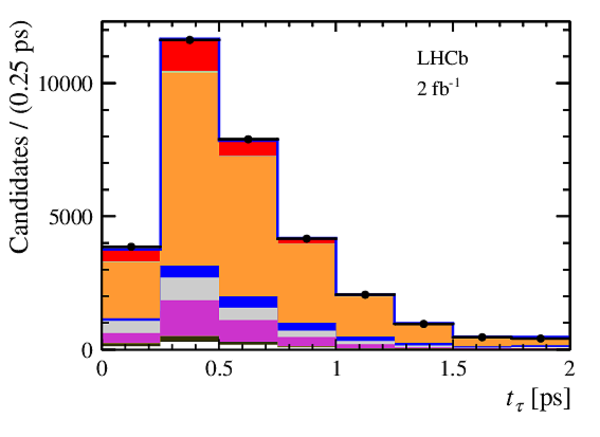
Fit results from the three-dimensional signal-extraction fit to $q^2$, $t_{\tau}$ and anti- $ D ^+_ s $ BDT output in the data. |
Table_4.pdf [93 KiB] HiDef png [153 KiB] Thumbnail [81 KiB] tex code |

|
|
Summary of relative systematic uncertainties on the ratio $\mathcal{K}( D ^{*-} )$ . |
Table_5.pdf [76 KiB] HiDef png [194 KiB] Thumbnail [83 KiB] tex code |

|
![HiDef png [206 KiB]](Directory_LHCb-PAPER-2022-052/hidef_Table_1.png)
![HiDef png [61 KiB]](Directory_LHCb-PAPER-2022-052/hidef_Table_2.png)
![HiDef png [153 KiB]](Directory_LHCb-PAPER-2022-052/hidef_Table_4.png)
![HiDef png [194 KiB]](Directory_LHCb-PAPER-2022-052/hidef_Table_5.png)
Created on 27 April 2024.