Observation of strangeness enhancement with charmed mesons in high-multiplicity $p\mathrm{Pb}$ collisions at $\sqrt {s_{\mathrm{NN}}}=8.16 $TeV
[to restricted-access page]Information
LHCb-PAPER-2023-021
CERN-EP-2023-236
arXiv:2311.08490 [PDF]
(Submitted on 14 Nov 2023)
PRL
Inspire 2722693
Tools
Abstract
The production of prompt $D^+_{s}$ and $D^+$ mesons is measured by the LHCb experiment in proton-lead ($p\mathrm{Pb}$) collisions in both the forward ($1.5<y^*<4.0$) and backward ($-5.0<y^*<-2.5$) rapidity regions at a nucleon-nucleon center-of-mass energy of $\sqrt {s_{\mathrm{NN}}}=8.16 $TeV. The nuclear modification factors of both $D^+_{s}$ and $D^+$ mesons are determined as a function of transverse momentum, $p_{\mathrm{T}}$, and rapidity. In addition, the $D^+_{s}$ to $D^+$ cross-section ratio is measured as a function of the charged particle multiplicity in the event. An enhanced $D^+_{s}$ to $D^+$ production in high-multiplicity events is observed for the whole measured $p_{\mathrm{T}}$ range, in particular at low $p_{\mathrm{T}}$ and backward rapidity, where the significance exceeds six standard deviations. This constitutes the first observation of strangeness enhancement in charm quark hadronization in high-multiplicity $p\mathrm{Pb}$ collisions. The results are also qualitatively consistent with the presence of quark coalescence as an additional charm quark hadronization mechanism in high-multiplicity proton-lead collisions.
Figures and captions
|
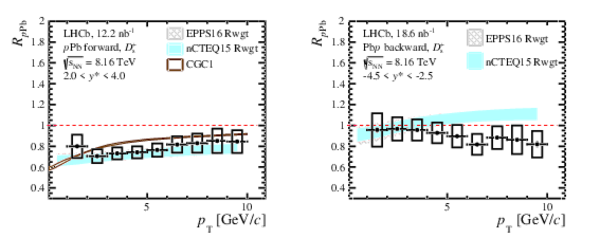
Nuclear modification factor $R_{p\mathrm{Pb}}$ as a function of $ p_{\mathrm{T}}$ for prompt (upper) $ D ^+_ s $ and (lower) $ D ^+$ mesons. Forward rapidity results are shown on the left and backward rapidity on the right. The vertical error bars show the statistical uncertainties and the boxes show the systematic uncertainties. The theoretical calculations are also shown \cite{Eskola:2016oht, Kovarik:2015cma, Ducloue:2015gfa, Ducloue:2016ywt, Ma:2018bax}. |
Fig1a.pdf [20 KiB] HiDef png [264 KiB] Thumbnail [184 KiB] *.C file |
|
|
Fig1b.pdf [20 KiB] HiDef png [273 KiB] Thumbnail [187 KiB] *.C file |

|
|
|
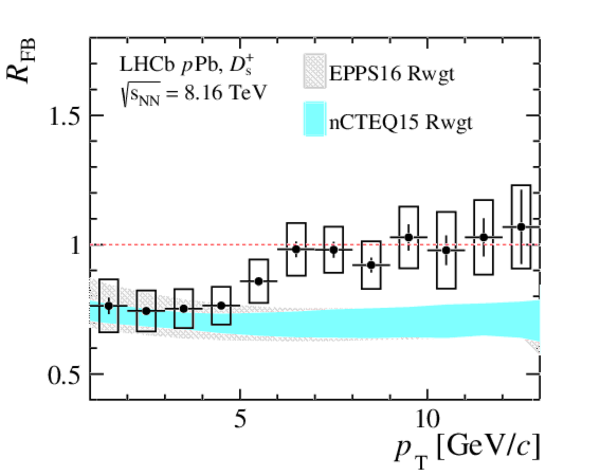
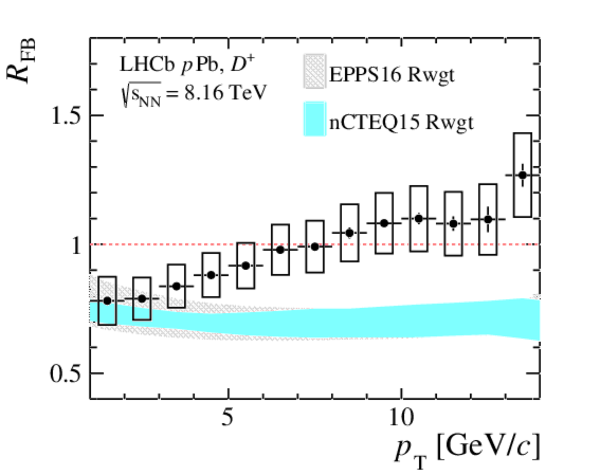
Forward-backward cross-section ratio $R_{\mathrm{FB}}$ for prompt (upper) $ D ^+_ s $ and (lower) $ D ^+$ mesons as a function of (left) $ p_{\mathrm{T}}$ and (right) $y^{*}$. The vertical error bars show the statistical uncertainties and the boxes show the systematic uncertainties. The coloured bands represent the theoretical calculations, incorporating nPDFs EPPS16 (gray) \cite{Eskola:2016oht} and nCTEQ15 (cyan) \cite{Kovarik:2015cma}. |
Fig2a.pdf [18 KiB] HiDef png [267 KiB] Thumbnail [179 KiB] *.C file |
|
|
Fig2b.pdf [16 KiB] HiDef png [274 KiB] Thumbnail [176 KiB] *.C file |

|
|
|
Fig2c.pdf [17 KiB] HiDef png [262 KiB] Thumbnail [178 KiB] *.C file |
|
|
|
Fig2d.pdf [16 KiB] HiDef png [283 KiB] Thumbnail [181 KiB] *.C file |

|
|
|
Cross-section ratio $\sigma_{ D ^+_ s }/\sigma_{ D ^+ }$ versus the normalised event multiplicity in different $D_{(s)}^+$ $ p_{\mathrm{T}}$ ranges for (top) forward and (bottom) backward rapidities. The vertical error bars show the statistical uncertainties and the boxes show the systematic uncertainties. |
Fig3.pdf [25 KiB] HiDef png [104 KiB] Thumbnail [52 KiB] *.C file |

|
|
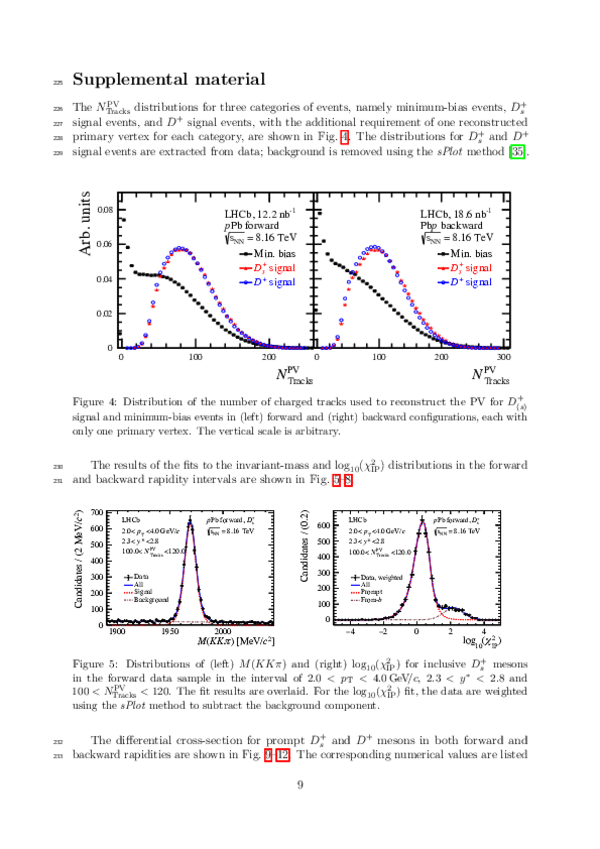
Distribution of the number of charged tracks used to reconstruct the PV for $D_{(s)}^+$ signal and minimum-bias events in (left) forward and (right) backward configurations, each with only one primary vertex. The vertical scale is arbitrary. |
Fig4.pdf [26 KiB] HiDef png [198 KiB] Thumbnail [111 KiB] *.C file |

|
|
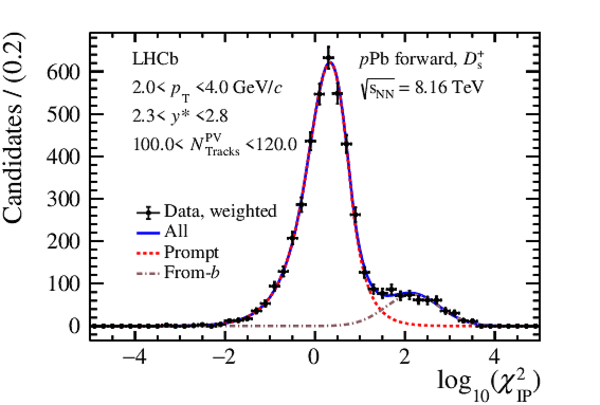
Distributions of (left) $M(KK\pi)$ and (right) $\log_{10}(\chi^2_{\text{IP}} )$ for inclusive $ D ^+_ s $ mesons in the forward data sample in the interval of $2.0 < p_{\mathrm{T}} < 4.0 \text{ Ge V /}c $, $2.3 < y^{*} < 2.8$ and $100 < N^{\text{PV}}_{\text{Tracks}} < 120$. The fit results are overlaid. For the $\log_{10}(\chi^2_{\text{IP}} )$ fit, the data are weighted using the sPlot method to subtract the background component. |
Fig5a.pdf [31 KiB] HiDef png [257 KiB] Thumbnail [212 KiB] *.C file |

|
|
Fig5b.pdf [21 KiB] HiDef png [230 KiB] Thumbnail [187 KiB] *.C file |
|
|
|
Distributions of (left) $M(KK\pi)$ and (right) $\log_{10}(\chi^2_{\text{IP}} )$ for inclusive $ D ^+_ s $ mesons in the backward data sample in the interval of $2.0< p_{\mathrm{T}} <4.0\text{ Ge V /}c $, $-3.8< y^{*} <-3.3$ and $100< N^{\text{PV}}_{\text{Tracks}} <120$. The fit results are overlaid. For the $\log_{10}(\chi^2_{\text{IP}} )$ fit, the data are weighted using the sPlot method to subtract the background component. |
Fig6a.pdf [32 KiB] HiDef png [270 KiB] Thumbnail [225 KiB] *.C file |

|
|
Fig6b.pdf [22 KiB] HiDef png [248 KiB] Thumbnail [203 KiB] *.C file |

|
|
|
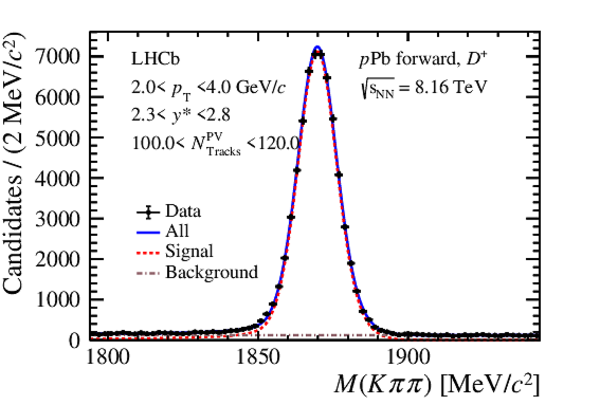
Distributions of (left) $M(K\pi\pi)$ and (right) $\log_{10}(\chi^2_{\text{IP}} )$ for inclusive $ D ^+$ mesons in the forward data sample in the interval of $2.0 < p_{\mathrm{T}} < 4.0 \text{ Ge V /}c $, $2.3 < y^{*} < 2.8$ and $100 < N^{\text{PV}}_{\text{Tracks}} < 120$. The fit results are overlaid. For the $\log_{10}(\chi^2_{\text{IP}} )$ fit, the data are weighted using the sPlot method to subtract the background component. |
Fig7a.pdf [31 KiB] HiDef png [260 KiB] Thumbnail [217 KiB] *.C file |
|
|
Fig7b.pdf [21 KiB] HiDef png [212 KiB] Thumbnail [167 KiB] *.C file |

|
|
|
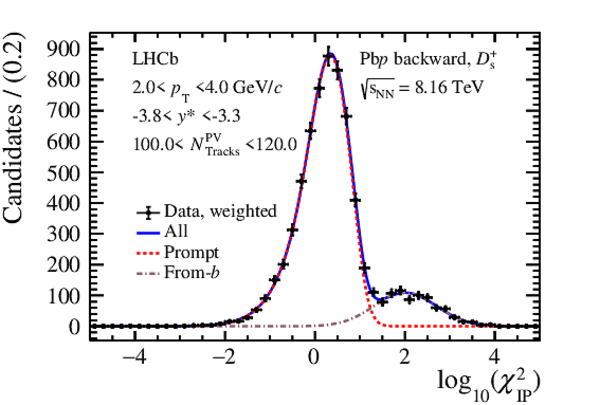
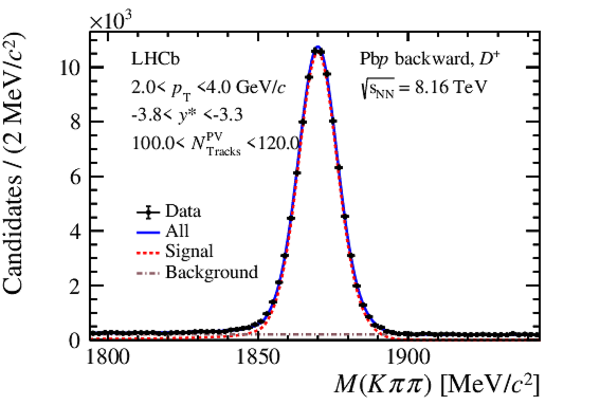
Distributions of (left) $M(K\pi\pi)$ and (right) $\log_{10}(\chi^2_{\text{IP}} )$ for inclusive $ D ^+$ mesons in the backward data sample in the interval of $2.0< p_{\mathrm{T}} < 4.0\text{ Ge V /}c $, $-3.8< y^{*}< -3.3$ and $100< N^{\text{PV}}_{\text{Tracks}} <120$. The fit results are overlaid. For the $\log_{10}(\chi^2_{\text{IP}} )$ fit, the data are weighted using the sPlot method to subtract the background component. |
Fig8a.pdf [31 KiB] HiDef png [234 KiB] Thumbnail [190 KiB] *.C file |

|
|
Fig8b.pdf [21 KiB] HiDef png [216 KiB] Thumbnail [179 KiB] *.C file |

|
|
|
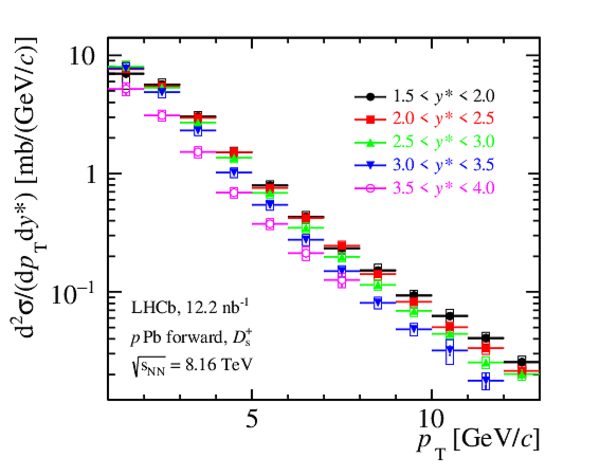
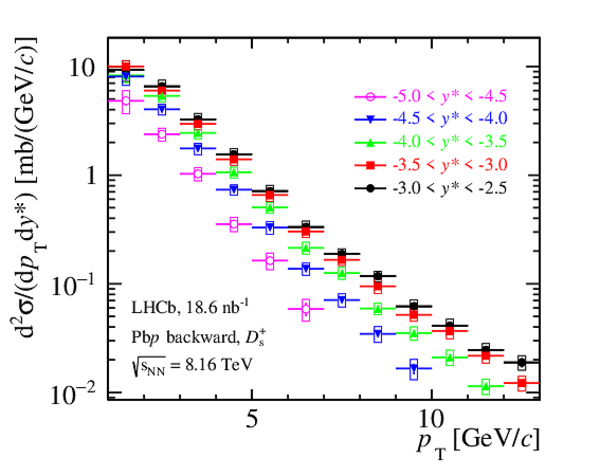
Double-differential cross-section of prompt $ D ^+_ s $ production in $p$Pb collisions at (left) forward and (right) backward rapidities. The vertical error bars show the statistical uncertainties and the boxes show the systematic uncertainties. |
Fig9a.pdf [16 KiB] HiDef png [186 KiB] Thumbnail [152 KiB] *.C file |
|
|
Fig9b.pdf [16 KiB] HiDef png [191 KiB] Thumbnail [160 KiB] *.C file |
|
|
|
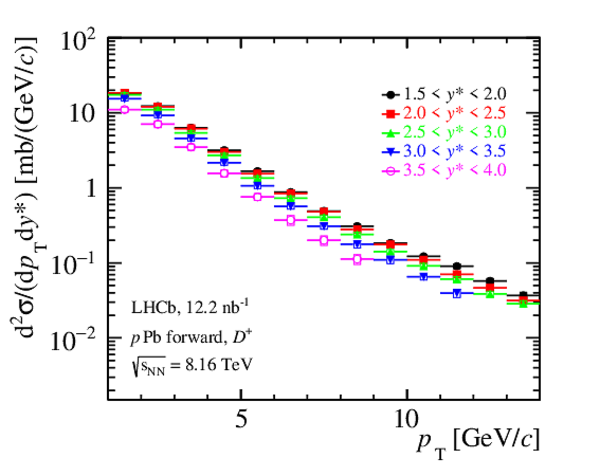
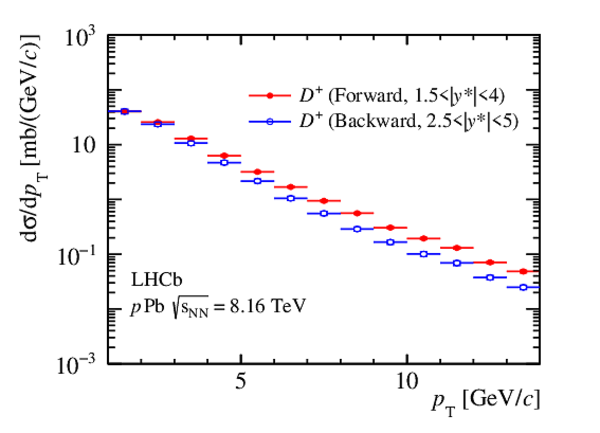
Double-differential cross-section of prompt $ D ^+ $ production in $p$Pb collisions at (left) forward and (right) backward rapidities. The vertical error bars show the statistical uncertainties and the boxes show the systematic uncertainties. |
Fig10a.pdf [17 KiB] HiDef png [185 KiB] Thumbnail [159 KiB] *.C file |
|
|
Fig10b.pdf [17 KiB] HiDef png [192 KiB] Thumbnail [167 KiB] *.C file |

|
|
|
Differential cross-section of prompt $ D ^+_ s $ production in $p$Pb collisions as a function of (left) $ p_{\mathrm{T}}$ and (right) $y^{*}$. The vertical error bars show the statistical uncertainties and the boxes show the systematic uncertainties. |
Fig11a.pdf [15 KiB] HiDef png [140 KiB] Thumbnail [124 KiB] *.C file |

|
|
Fig11b.pdf [14 KiB] HiDef png [106 KiB] Thumbnail [96 KiB] *.C file |

|
|
|
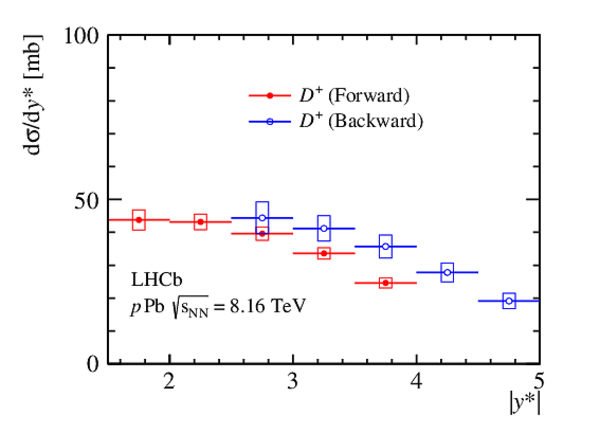
Differential cross-section of prompt $ D ^+ $ production in $p$Pb collisions as a function of (left) $ p_{\mathrm{T}}$ and (right) $y^{*}$. The vertical error bars show the statistical uncertainties and the boxes show the systematic uncertainties. |
Fig12a.pdf [15 KiB] HiDef png [139 KiB] Thumbnail [132 KiB] *.C file |

|
|
Fig12b.pdf [13 KiB] HiDef png [100 KiB] Thumbnail [88 KiB] *.C file |

|
|
|
Nuclear modification factor $R_{p\mathrm{Pb}}$ for prompt $ D ^+_ s $ production as a function of $ p_{\mathrm{T}}$ in different $y^{*}$ intervals. The vertical error bars show the statistical uncertainties and the boxes show the systematic uncertainties. The coloured bands represent the theoretical calculations using the HELAC-Onia generator \cite{Shao:2012iz,Shao:2015vga}, incorporating nPDFs EPPS16 (grey) \cite{Eskola:2016oht} and nCTEQ15 (blue) \cite{Kovarik:2015cma}. |
Fig13a.pdf [26 KiB] HiDef png [497 KiB] Thumbnail [365 KiB] *.C file |

|
|
Fig13b.pdf [25 KiB] HiDef png [500 KiB] Thumbnail [367 KiB] *.C file |

|
|
|
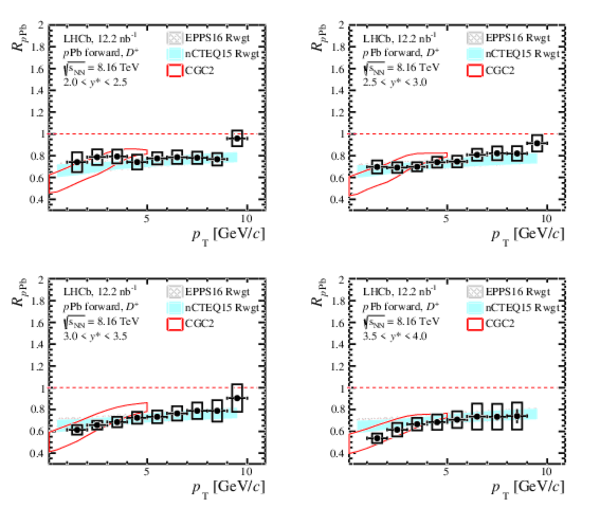
Nuclear modification factor $R_{p\mathrm{Pb}}$ for prompt $ D ^+$ production as a function of $ p_{\mathrm{T}}$ in different $y^{*}$ intervals. The vertical error bars show the statistical uncertainties and the boxes show the systematic uncertainties. The coloured bands represent the theoretical calculations using the HELAC-Onia generator \cite{Shao:2012iz,Shao:2015vga}, incorporating nPDFs EPPS16 (grey) \cite{Eskola:2016oht} and nCTEQ15 (blue) \cite{Kovarik:2015cma}. The coloured line represent the CGC2 (red) calculations \cite{Ma:2018bax}. |
Fig14a.pdf [26 KiB] HiDef png [544 KiB] Thumbnail [380 KiB] *.C file |

|
|
Fig14b.pdf [25 KiB] HiDef png [504 KiB] Thumbnail [375 KiB] *.C file |

|
|
|
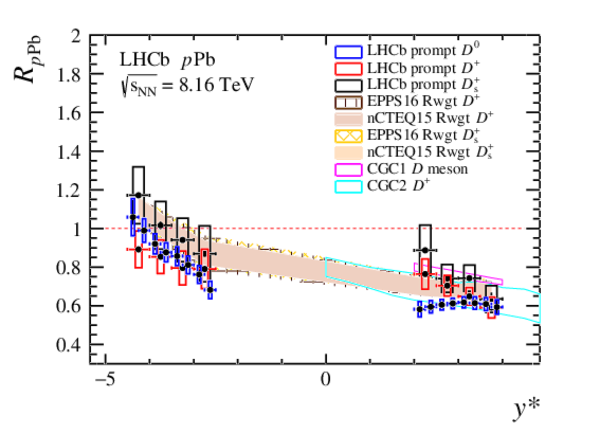
Nuclear modification factor as a function of $y^*$ for prompt $ D ^+$ and $ D ^+_ s $ mesons integrated over $1 < p_{\mathrm{T}} < 10$ $\text{ Ge V /}c$ . The vertical error bars show the statistical uncertainties and the boxes show the systematic uncertainties. The LHCb $ D ^0$ results at $\sqrt{s_{\scriptscriptstyle\text{NN}}}$ = 8.16 TeV \cite{LHCb:2022dmh} and theoretical calculations at $\sqrt{s_{\scriptscriptstyle\text{NN}}}$ = 8.16 TeV are also shown \cite{Eskola:2016oht, Kovarik:2015cma, Ducloue:2015gfa, Ducloue:2016ywt, Ma:2018bax}. |
Fig15.pdf [19 KiB] HiDef png [356 KiB] Thumbnail [235 KiB] *.C file |
|
|
The production cross-section ratio $\sigma_{ D ^+_ s }/\sigma_{ D ^+ }$ as a function of $ p_{\mathrm{T}}$ and $y^{*}$ in $p$Pb collisions. The error bars show the statistical uncertainty, the red boxes the uncorrelated systematic uncertainty and the blue boxes the correlated systematic uncertainty. The coloured bands correspond to the theoretical calculations, incorporating nPDFs EPPS16 (gray) \cite{Eskola:2016oht} and nCTEQ15 (cyan) \cite{Kovarik:2015cma}. |
Fig16a.pdf [28 KiB] HiDef png [380 KiB] Thumbnail [175 KiB] *.C file |

|
|
Fig16b.pdf [29 KiB] HiDef png [436 KiB] Thumbnail [210 KiB] *.C file |

|
|
|
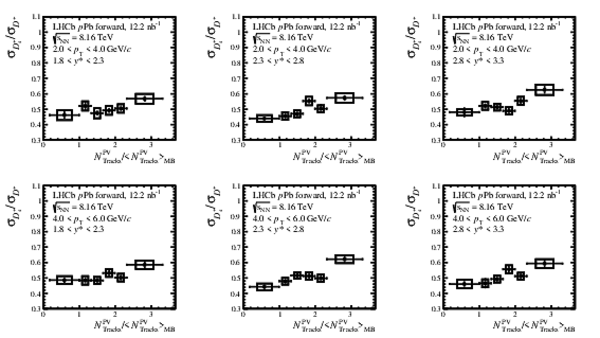
The production cross-section ratio, $\sigma_{ D ^+_ s }/\sigma_{ D ^+ }$, versus normalized event multiplicity in different $D$-meson $ p_{\mathrm{T}}$ (2-6 $\text{ Ge V /}c$ ) and $y^{*}$ ranges for the (six upper plots) forward and (six lower plots) backward rapidities. The vertical error bars show the statistical uncertainty, the boxes the systematic. |
Fig17a.pdf [24 KiB] HiDef png [234 KiB] Thumbnail [71 KiB] *.C file |
|
|
Fig17b.pdf [25 KiB] HiDef png [245 KiB] Thumbnail [79 KiB] *.C file |

|
|
|
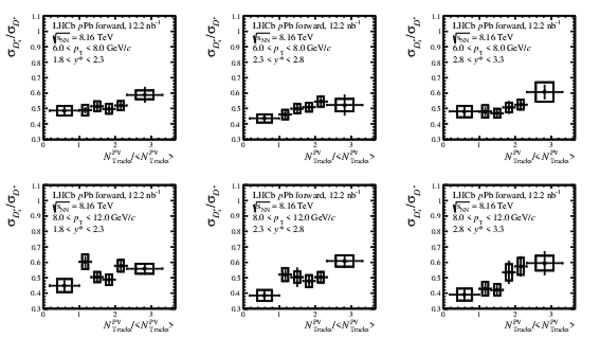
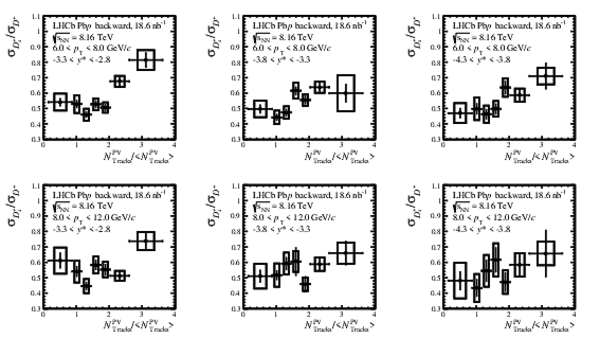
The production cross-section ratio, $\sigma_{ D ^+_ s }/\sigma_{ D ^+ }$, versus normalized event multiplicity in different $D$-meson $ p_{\mathrm{T}}$ (6-12 $\text{ Ge V /}c$ ) and $y^{*}$ ranges for the (six upper plots) forward and (six lower plots) backward rapidities. The vertical error bars show the statistical uncertainty, the boxes the systematic. |
Fig18a.pdf [24 KiB] HiDef png [232 KiB] Thumbnail [76 KiB] *.C file |
|
|
Fig18b.pdf [25 KiB] HiDef png [244 KiB] Thumbnail [85 KiB] *.C file |

|
|
|
Animated gif made out of all figures. |
PAPER-2023-021.gif Thumbnail |

|
Tables and captions
|
Systematic uncertainties on the measured double-differential cross-section. Each range indicates the minimum and the maximum value across all kinematic intervals. The uncertainties due to the mass and $\text{log}_{10}(\chi^2_{\text{IP}} )$ fits are uncorrelated across the intervals. The other sources of uncertainty are 100% correlated between the different intervals. |
Table_1.pdf [58 KiB] HiDef png [99 KiB] Thumbnail [47 KiB] tex code |

|
|
Double-differential cross-section for prompt $ D ^+_ s $ production as a function of $ p_{\mathrm{T}}$ and $y^{*}$ in $p$Pb collisions at forward and backward rapidities. The first uncertainty is statistical, the second the component of the systematic uncertainty that is uncorrelated between bins and the third the correlated systematic component. |
Table_2.pdf [64 KiB] HiDef png [205 KiB] Thumbnail [70 KiB] tex code |

|
|
Double-differential cross-section for prompt $ D ^+$ production as a function of $ p_{\mathrm{T}}$ and $y^{*}$ in $p$Pb collisions at forward and backward rapidities. The first uncertainty is statistical, the second the component of the systematic uncertainty that is uncorrelated between bins and the third the correlated systematic component. |
Table_3.pdf [64 KiB] HiDef png [203 KiB] Thumbnail [66 KiB] tex code |

|
|
Differential cross-section for prompt $ D ^+_ s $ production as a function of $ p_{\mathrm{T}} $ in $p$Pb collisions at forward and backward rapidities. The first uncertainty is statistical, the second the component of the systematic uncertainty that is uncorrelated between bins and the third the correlated systematic component. |
Table_4.pdf [54 KiB] HiDef png [312 KiB] Thumbnail [160 KiB] tex code |

|
|
Differential cross-section for prompt $ D ^+$ production as a function of $ p_{\mathrm{T}} $ in $p$Pb collisions at forward and backward rapidities. The first uncertainty is statistical, the second the component of the systematic uncertainty that is uncorrelated between bins and the third the correlated systematic component. |
Table_5.pdf [54 KiB] HiDef png [333 KiB] Thumbnail [171 KiB] tex code |

|
|
Differential cross-section for prompt $ D ^+_ s $ production as a function of $y^{*}$ in $p$Pb collisions at forward and backward rapidities. The first uncertainty is statistical, the second the component of the systematic uncertainty that is uncorrelated between bins and the third the correlated systematic component. |
Table_6.pdf [53 KiB] HiDef png [182 KiB] Thumbnail [91 KiB] tex code |

|
|
Differential cross-section for prompt $ D ^+$ production as a function of $y^{*}$ in $p$Pb collisions at forward and backward rapidities. The first uncertainty is statistical, the second the component of the systematic uncertainty that is uncorrelated between bins and the third the correlated systematic component. |
Table_7.pdf [53 KiB] HiDef png [182 KiB] Thumbnail [92 KiB] tex code |

|
|
Nuclear modification factor $R_{p\mathrm{Pb}}$ for prompt $ D ^+_ s $ production as a function of $ p_{\mathrm{T}}$ at forward (integrated over the common rapidity region of $2.0 < y^{*} < 4.0$) and backward (integrated over the common rapidity region of $-4.5 < y^{*} < -2.5$) rapidity. The first uncertainty is statistical, the second systematic. |
Table_8.pdf [61 KiB] HiDef png [298 KiB] Thumbnail [143 KiB] tex code |

|
|
Nuclear modification factor $R_{p\mathrm{Pb}}$ for prompt $ D ^+_ s $ production as a function of $y^{*}$, integrated over $1 < p_{\mathrm{T}} < 10$ $\text{ Ge V /}c$ . The first uncertainty is statistical, the second systematic. |
Table_9.pdf [63 KiB] HiDef png [143 KiB] Thumbnail [70 KiB] tex code |

|
|
Nuclear modification factor $R_{p\mathrm{Pb}}$ for prompt $ D ^+_ s $ production as a function of $ p_{\mathrm{T}}$ and $y^{*}$. The first uncertainty is statistical, the second systematic. |
Table_10.pdf [69 KiB] HiDef png [181 KiB] Thumbnail [76 KiB] tex code |

|
|
Nuclear modification factor $R_{p\mathrm{Pb}}$ for prompt $ D ^+$ production as a function of $ p_{\mathrm{T}}$ at forward (integrated over the common rapidity region of $2.0 < y^{*} < 4.0$) and backward (integrated over the common rapidity region of $-4.5 < y^{*} < -2.5$) rapidity. The first uncertainty is statistical, the second systematic. |
Table_11.pdf [60 KiB] HiDef png [306 KiB] Thumbnail [144 KiB] tex code |

|
|
Nuclear modification factor $R_{p\mathrm{Pb}}$ for prompt $ D ^+$ production as a function of $y^{*}$, integrated over $1 < p_{\mathrm{T}} < 10$ $\text{ Ge V /}c$ . The first uncertainty is statistical, the second systematic. |
Table_12.pdf [63 KiB] HiDef png [156 KiB] Thumbnail [73 KiB] tex code |

|
|
Nuclear modification factor $R_{p\mathrm{Pb}}$ for prompt $ D ^+$ production as a function of $ p_{\mathrm{T}}$ and $y^{*}$. The first uncertainty is statistical, the second systematic. |
Table_13.pdf [69 KiB] HiDef png [195 KiB] Thumbnail [80 KiB] tex code |

|
|
Forward and backward production ratio $R_{\mathrm{FB}}$ for prompt $ D ^+_ s $ mesons as a function of $ p_{\mathrm{T}}$ and $y^{*}$. The first uncertainty is statistical, the second systematic. |
Table_14.pdf [58 KiB] HiDef png [238 KiB] Thumbnail [117 KiB] tex code |

|
|
Forward and backward production ratio $R_{\mathrm{FB}}$ for prompt $ D ^+$ mesons as a function of $ p_{\mathrm{T}}$ and $y^{*}$. The first uncertainty is statistical, the second systematic. |
Table_15.pdf [59 KiB] HiDef png [251 KiB] Thumbnail [123 KiB] tex code |

|
|
The production cross-section ratio $\sigma_{ D ^+_ s }/\sigma_{ D ^+ }$ as a function of $ p_{\mathrm{T}}$ and $y^{*}$ in $p$Pb collisions at (upper) forward and (lower) backward rapidities. The first uncertainty is statistical, the second the component of the systematic uncertainty that is uncorrelated between bins and the third the correlated systematic component. |
Table_16.pdf [83 KiB] HiDef png [195 KiB] Thumbnail [82 KiB] tex code |

|
|
The production cross-section ratio $\sigma_{ D ^+_ s }/\sigma_{ D ^+ }$ as a function of $ p_{\mathrm{T}}$ , $y^{*}$ and $N^{\text{PV}}_{\text{Tracks}}$ in $p$Pb collisions at (upper) forward and (lower) backward rapidities. The first uncertainty is statistical, the second the component of the systematic uncertainty that is uncorrelated between bins and the third the correlated systematic component. |
Table_17.pdf [85 KiB] HiDef png [197 KiB] Thumbnail [72 KiB] tex code |

|
Supplementary Material [file]


![HiDef png [264 KiB]](Directory_LHCb-PAPER-2023-021/hidef_Fig1a.png)
![HiDef png [273 KiB]](Directory_LHCb-PAPER-2023-021/hidef_Fig1b.png)
![HiDef png [267 KiB]](Directory_LHCb-PAPER-2023-021/hidef_Fig2a.png)
![HiDef png [274 KiB]](Directory_LHCb-PAPER-2023-021/hidef_Fig2b.png)
![HiDef png [262 KiB]](Directory_LHCb-PAPER-2023-021/hidef_Fig2c.png)
![HiDef png [283 KiB]](Directory_LHCb-PAPER-2023-021/hidef_Fig2d.png)
![HiDef png [104 KiB]](Directory_LHCb-PAPER-2023-021/hidef_Fig3.png)
![HiDef png [198 KiB]](Directory_LHCb-PAPER-2023-021/hidef_Fig4.png)
![HiDef png [257 KiB]](Directory_LHCb-PAPER-2023-021/hidef_Fig5a.png)
![HiDef png [230 KiB]](Directory_LHCb-PAPER-2023-021/hidef_Fig5b.png)
![HiDef png [270 KiB]](Directory_LHCb-PAPER-2023-021/hidef_Fig6a.png)
![HiDef png [248 KiB]](Directory_LHCb-PAPER-2023-021/hidef_Fig6b.png)
![HiDef png [260 KiB]](Directory_LHCb-PAPER-2023-021/hidef_Fig7a.png)
![HiDef png [212 KiB]](Directory_LHCb-PAPER-2023-021/hidef_Fig7b.png)
![HiDef png [234 KiB]](Directory_LHCb-PAPER-2023-021/hidef_Fig8a.png)
![HiDef png [216 KiB]](Directory_LHCb-PAPER-2023-021/hidef_Fig8b.png)
![HiDef png [186 KiB]](Directory_LHCb-PAPER-2023-021/hidef_Fig9a.png)
![HiDef png [191 KiB]](Directory_LHCb-PAPER-2023-021/hidef_Fig9b.png)
![HiDef png [185 KiB]](Directory_LHCb-PAPER-2023-021/hidef_Fig10a.png)
![HiDef png [192 KiB]](Directory_LHCb-PAPER-2023-021/hidef_Fig10b.png)
![HiDef png [140 KiB]](Directory_LHCb-PAPER-2023-021/hidef_Fig11a.png)
![HiDef png [106 KiB]](Directory_LHCb-PAPER-2023-021/hidef_Fig11b.png)
![HiDef png [139 KiB]](Directory_LHCb-PAPER-2023-021/hidef_Fig12a.png)
![HiDef png [100 KiB]](Directory_LHCb-PAPER-2023-021/hidef_Fig12b.png)
![HiDef png [497 KiB]](Directory_LHCb-PAPER-2023-021/hidef_Fig13a.png)
![HiDef png [500 KiB]](Directory_LHCb-PAPER-2023-021/hidef_Fig13b.png)
![HiDef png [544 KiB]](Directory_LHCb-PAPER-2023-021/hidef_Fig14a.png)
![HiDef png [504 KiB]](Directory_LHCb-PAPER-2023-021/hidef_Fig14b.png)
![HiDef png [356 KiB]](Directory_LHCb-PAPER-2023-021/hidef_Fig15.png)
![HiDef png [380 KiB]](Directory_LHCb-PAPER-2023-021/hidef_Fig16a.png)
![HiDef png [436 KiB]](Directory_LHCb-PAPER-2023-021/hidef_Fig16b.png)
![HiDef png [234 KiB]](Directory_LHCb-PAPER-2023-021/hidef_Fig17a.png)
![HiDef png [245 KiB]](Directory_LHCb-PAPER-2023-021/hidef_Fig17b.png)
![HiDef png [232 KiB]](Directory_LHCb-PAPER-2023-021/hidef_Fig18a.png)
![HiDef png [244 KiB]](Directory_LHCb-PAPER-2023-021/hidef_Fig18b.png)
![HiDef png [99 KiB]](Directory_LHCb-PAPER-2023-021/hidef_Table_1.png)
![HiDef png [205 KiB]](Directory_LHCb-PAPER-2023-021/hidef_Table_2.png)
![HiDef png [203 KiB]](Directory_LHCb-PAPER-2023-021/hidef_Table_3.png)
![HiDef png [312 KiB]](Directory_LHCb-PAPER-2023-021/hidef_Table_4.png)
![HiDef png [333 KiB]](Directory_LHCb-PAPER-2023-021/hidef_Table_5.png)
![HiDef png [182 KiB]](Directory_LHCb-PAPER-2023-021/hidef_Table_6.png)
![HiDef png [182 KiB]](Directory_LHCb-PAPER-2023-021/hidef_Table_7.png)
![HiDef png [298 KiB]](Directory_LHCb-PAPER-2023-021/hidef_Table_8.png)
![HiDef png [143 KiB]](Directory_LHCb-PAPER-2023-021/hidef_Table_9.png)
![HiDef png [181 KiB]](Directory_LHCb-PAPER-2023-021/hidef_Table_10.png)
![HiDef png [306 KiB]](Directory_LHCb-PAPER-2023-021/hidef_Table_11.png)
![HiDef png [156 KiB]](Directory_LHCb-PAPER-2023-021/hidef_Table_12.png)
![HiDef png [195 KiB]](Directory_LHCb-PAPER-2023-021/hidef_Table_13.png)
![HiDef png [238 KiB]](Directory_LHCb-PAPER-2023-021/hidef_Table_14.png)
![HiDef png [251 KiB]](Directory_LHCb-PAPER-2023-021/hidef_Table_15.png)
![HiDef png [195 KiB]](Directory_LHCb-PAPER-2023-021/hidef_Table_16.png)
![HiDef png [197 KiB]](Directory_LHCb-PAPER-2023-021/hidef_Table_17.png)
![HiDef png [185 KiB]](Directory_LHCb-PAPER-2023-021/supplementary/hidef_Fig10a.png)
![HiDef png [192 KiB]](Directory_LHCb-PAPER-2023-021/supplementary/hidef_Fig10b.png)
![HiDef png [140 KiB]](Directory_LHCb-PAPER-2023-021/supplementary/hidef_Fig11a.png)
![HiDef png [106 KiB]](Directory_LHCb-PAPER-2023-021/supplementary/hidef_Fig11b.png)
![HiDef png [139 KiB]](Directory_LHCb-PAPER-2023-021/supplementary/hidef_Fig12a.png)
![HiDef png [100 KiB]](Directory_LHCb-PAPER-2023-021/supplementary/hidef_Fig12b.png)
![HiDef png [497 KiB]](Directory_LHCb-PAPER-2023-021/supplementary/hidef_Fig13a.png)
![HiDef png [500 KiB]](Directory_LHCb-PAPER-2023-021/supplementary/hidef_Fig13b.png)
![HiDef png [544 KiB]](Directory_LHCb-PAPER-2023-021/supplementary/hidef_Fig14a.png)
![HiDef png [504 KiB]](Directory_LHCb-PAPER-2023-021/supplementary/hidef_Fig14b.png)
![HiDef png [356 KiB]](Directory_LHCb-PAPER-2023-021/supplementary/hidef_Fig15.png)
![HiDef png [380 KiB]](Directory_LHCb-PAPER-2023-021/supplementary/hidef_Fig16a.png)
![HiDef png [436 KiB]](Directory_LHCb-PAPER-2023-021/supplementary/hidef_Fig16b.png)
![HiDef png [234 KiB]](Directory_LHCb-PAPER-2023-021/supplementary/hidef_Fig17a.png)
![HiDef png [245 KiB]](Directory_LHCb-PAPER-2023-021/supplementary/hidef_Fig17b.png)
![HiDef png [232 KiB]](Directory_LHCb-PAPER-2023-021/supplementary/hidef_Fig18a.png)
![HiDef png [244 KiB]](Directory_LHCb-PAPER-2023-021/supplementary/hidef_Fig18b.png)
![HiDef png [198 KiB]](Directory_LHCb-PAPER-2023-021/supplementary/hidef_Fig4.png)
![HiDef png [257 KiB]](Directory_LHCb-PAPER-2023-021/supplementary/hidef_Fig5a.png)
![HiDef png [230 KiB]](Directory_LHCb-PAPER-2023-021/supplementary/hidef_Fig5b.png)
![HiDef png [270 KiB]](Directory_LHCb-PAPER-2023-021/supplementary/hidef_Fig6a.png)
![HiDef png [248 KiB]](Directory_LHCb-PAPER-2023-021/supplementary/hidef_Fig6b.png)
![HiDef png [260 KiB]](Directory_LHCb-PAPER-2023-021/supplementary/hidef_Fig7a.png)
![HiDef png [212 KiB]](Directory_LHCb-PAPER-2023-021/supplementary/hidef_Fig7b.png)
![HiDef png [234 KiB]](Directory_LHCb-PAPER-2023-021/supplementary/hidef_Fig8a.png)
![HiDef png [216 KiB]](Directory_LHCb-PAPER-2023-021/supplementary/hidef_Fig8b.png)
![HiDef png [186 KiB]](Directory_LHCb-PAPER-2023-021/supplementary/hidef_Fig9a.png)
![HiDef png [191 KiB]](Directory_LHCb-PAPER-2023-021/supplementary/hidef_Fig9b.png)
Created on 27 April 2024.