

Compact Muon Solenoid
LHC, CERN
| CMS-B2G-13-005 ; CERN-PH-EP-2015-228 | ||
| Search for vector-like charge 2/3 T quarks in proton-proton collisions at $ \sqrt{s} =$ 8 TeV | ||
| CMS Collaboration | ||
| 15 September 2015 | ||
| Phys. Rev. D 93 (2016) 012003 | ||
| Abstract: A search for fermionic top quark partners T of charge 2/3 is presented. The search is carried out in proton-proton collisions corresponding to an integrated luminosity of 19.7 fb$^{-1}$ collected at a center-of-mass energy of $\sqrt{s} =$ 8 TeV with the CMS detector at the LHC. The T quarks are assumed to be produced strongly in pairs and can decay into tH, tZ, and bW. The search is performed in five exclusive channels: a single-lepton channel, a multilepton channel, two all-hadronic channels optimized either for the bW or the tH decay, and one channel in which the Higgs boson decays into two photons. The results are found to be compatible with the standard model expectations in all the investigated final states. A statistical combination of these results is performed and lower limits on the T quark mass are set. Depending on the branching fractions, lower mass limits between 720 and 920 GeV at 95% confidence level are found. These are among the strongest limits on vector-like T quarks obtained to date. | ||
| Links: e-print arXiv:1509.04177 [hep-ex] (PDF) ; CDS record ; inSPIRE record ; CADI line (restricted) ; | ||
| Figures | |
png pdf |
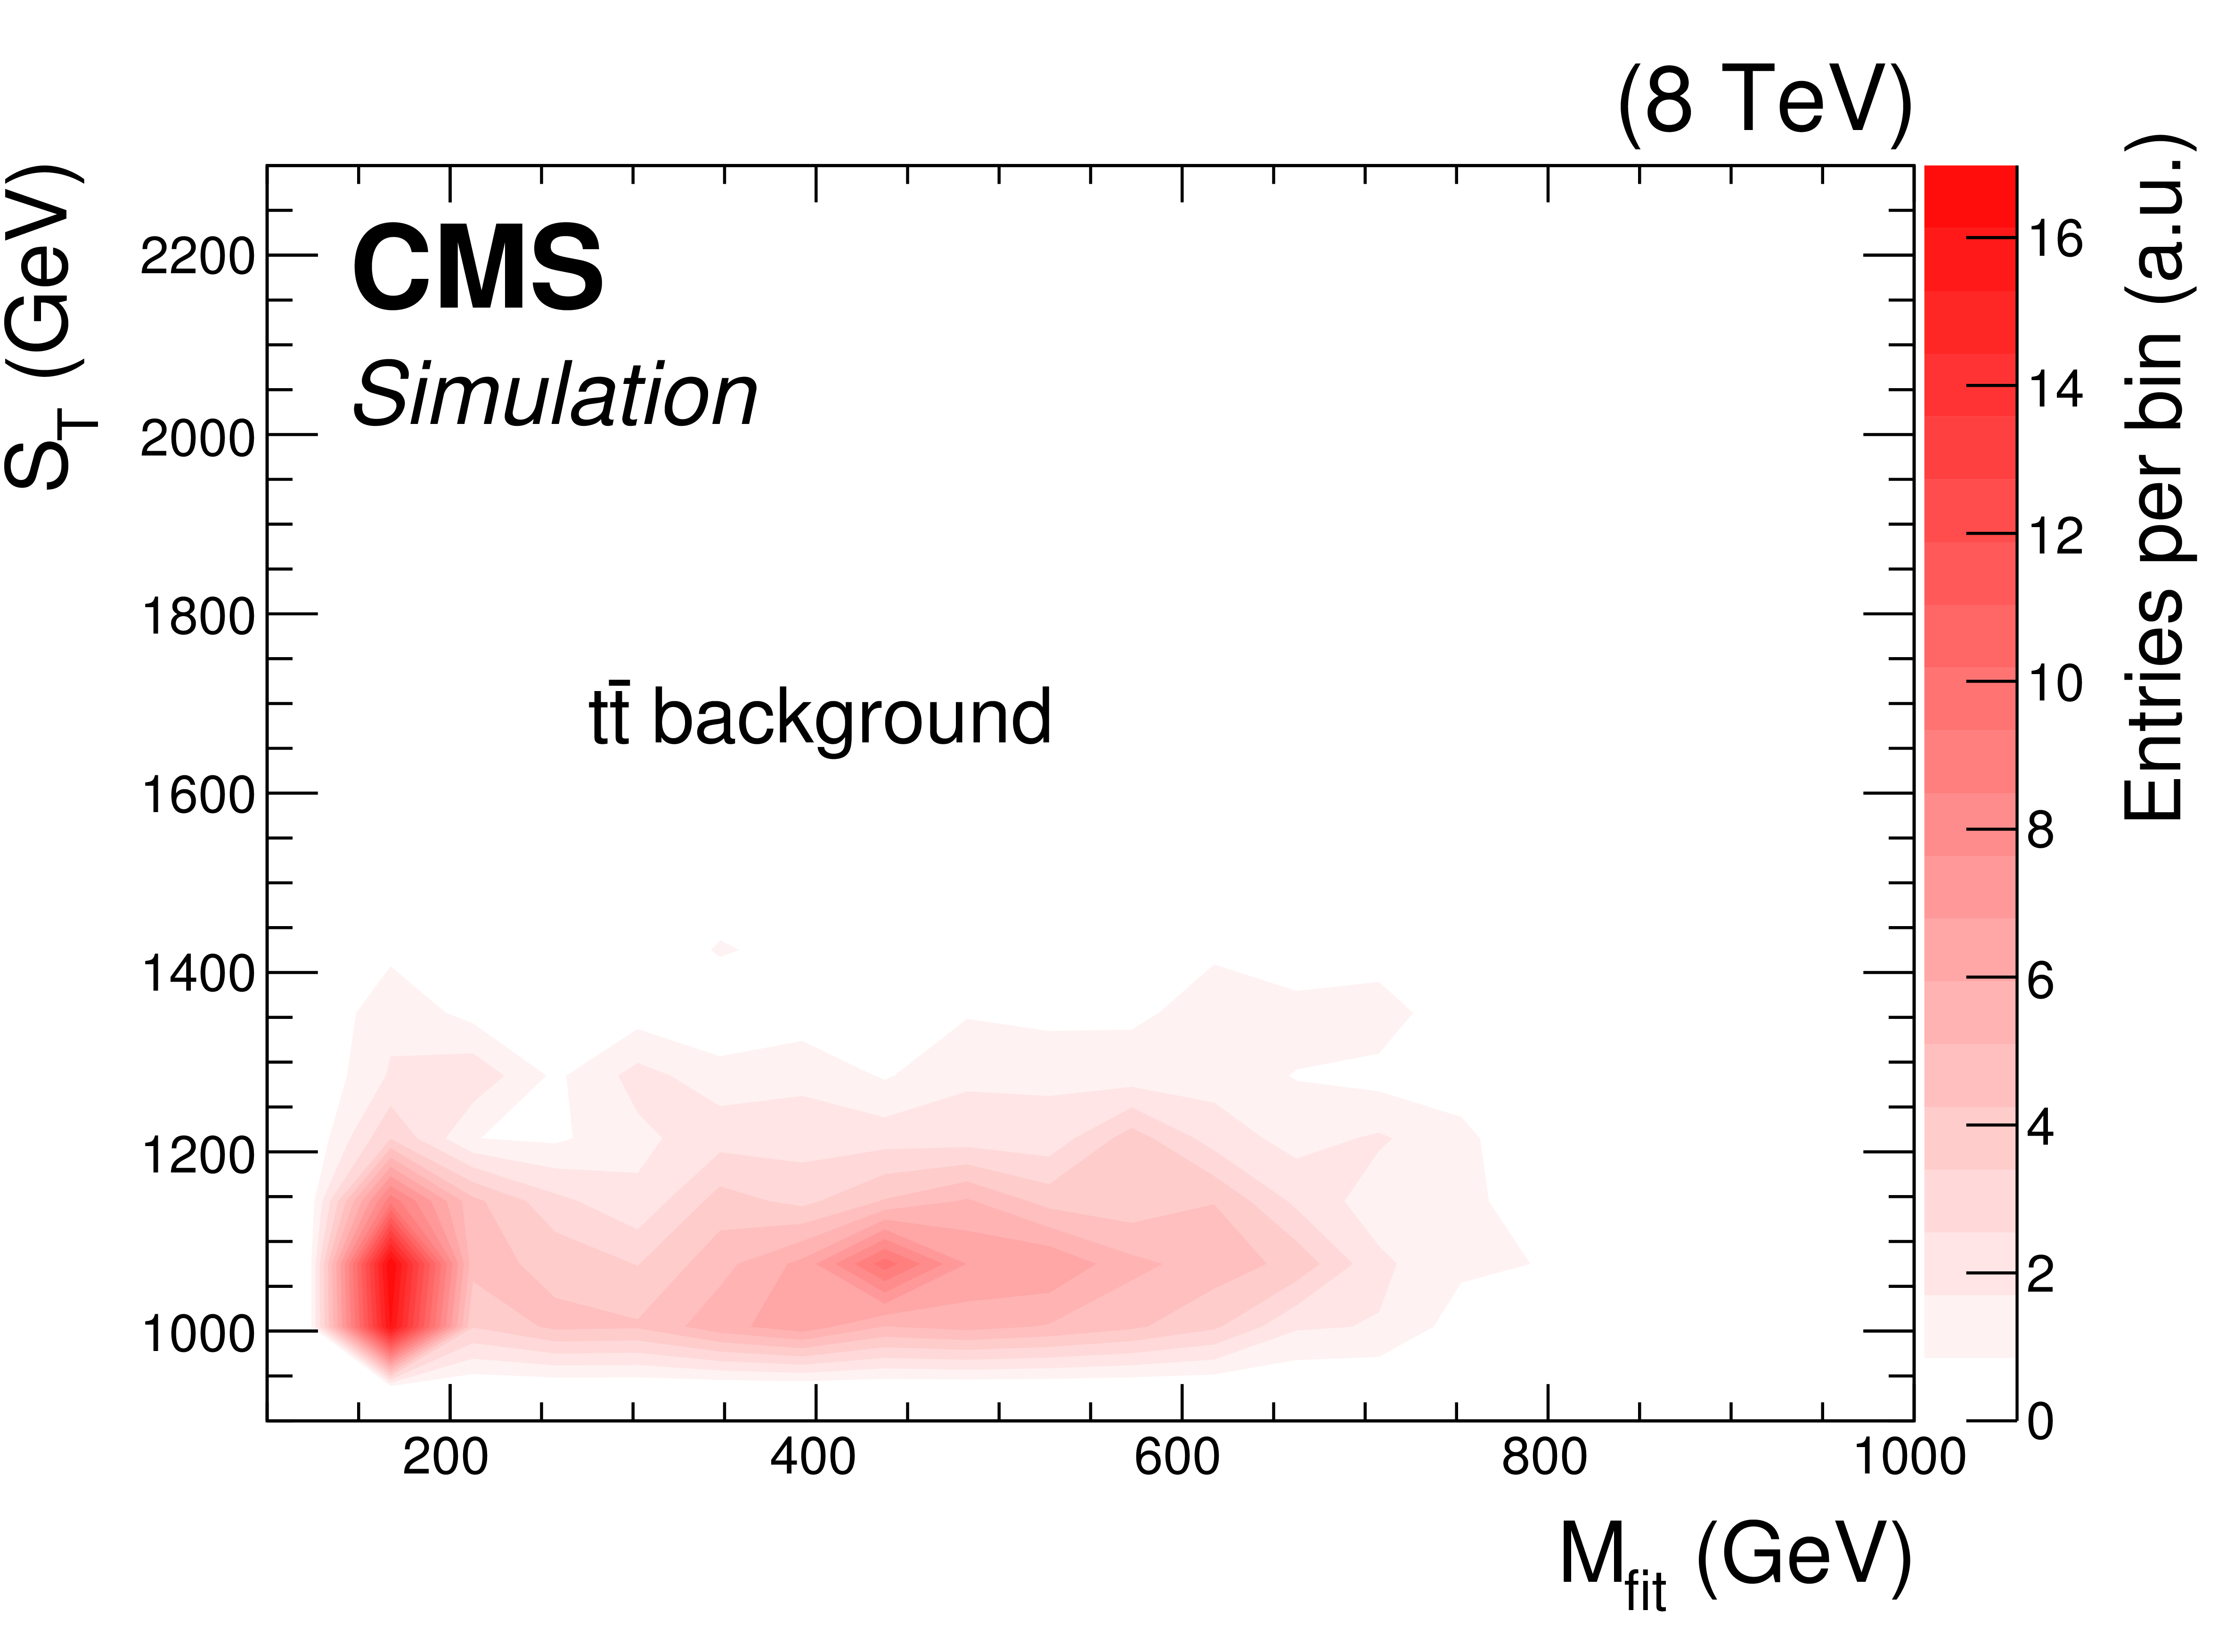
Figure 1-a:
Correlation between the $ {S_{\mathrm {T}}} $ and the $ {M_\text {fit} }$ observables in the search for $ {\mathrm {T}} \to { {\mathrm {b}} {\mathrm {W}}} $ with single leptons, for background processes (a) and for a simulated signal, with a $ {\mathrm {T}} $ quark mass of 800 GeV (b). The color gradient indicates the entries per bin in arbitrary units (a.u.). |
png pdf |
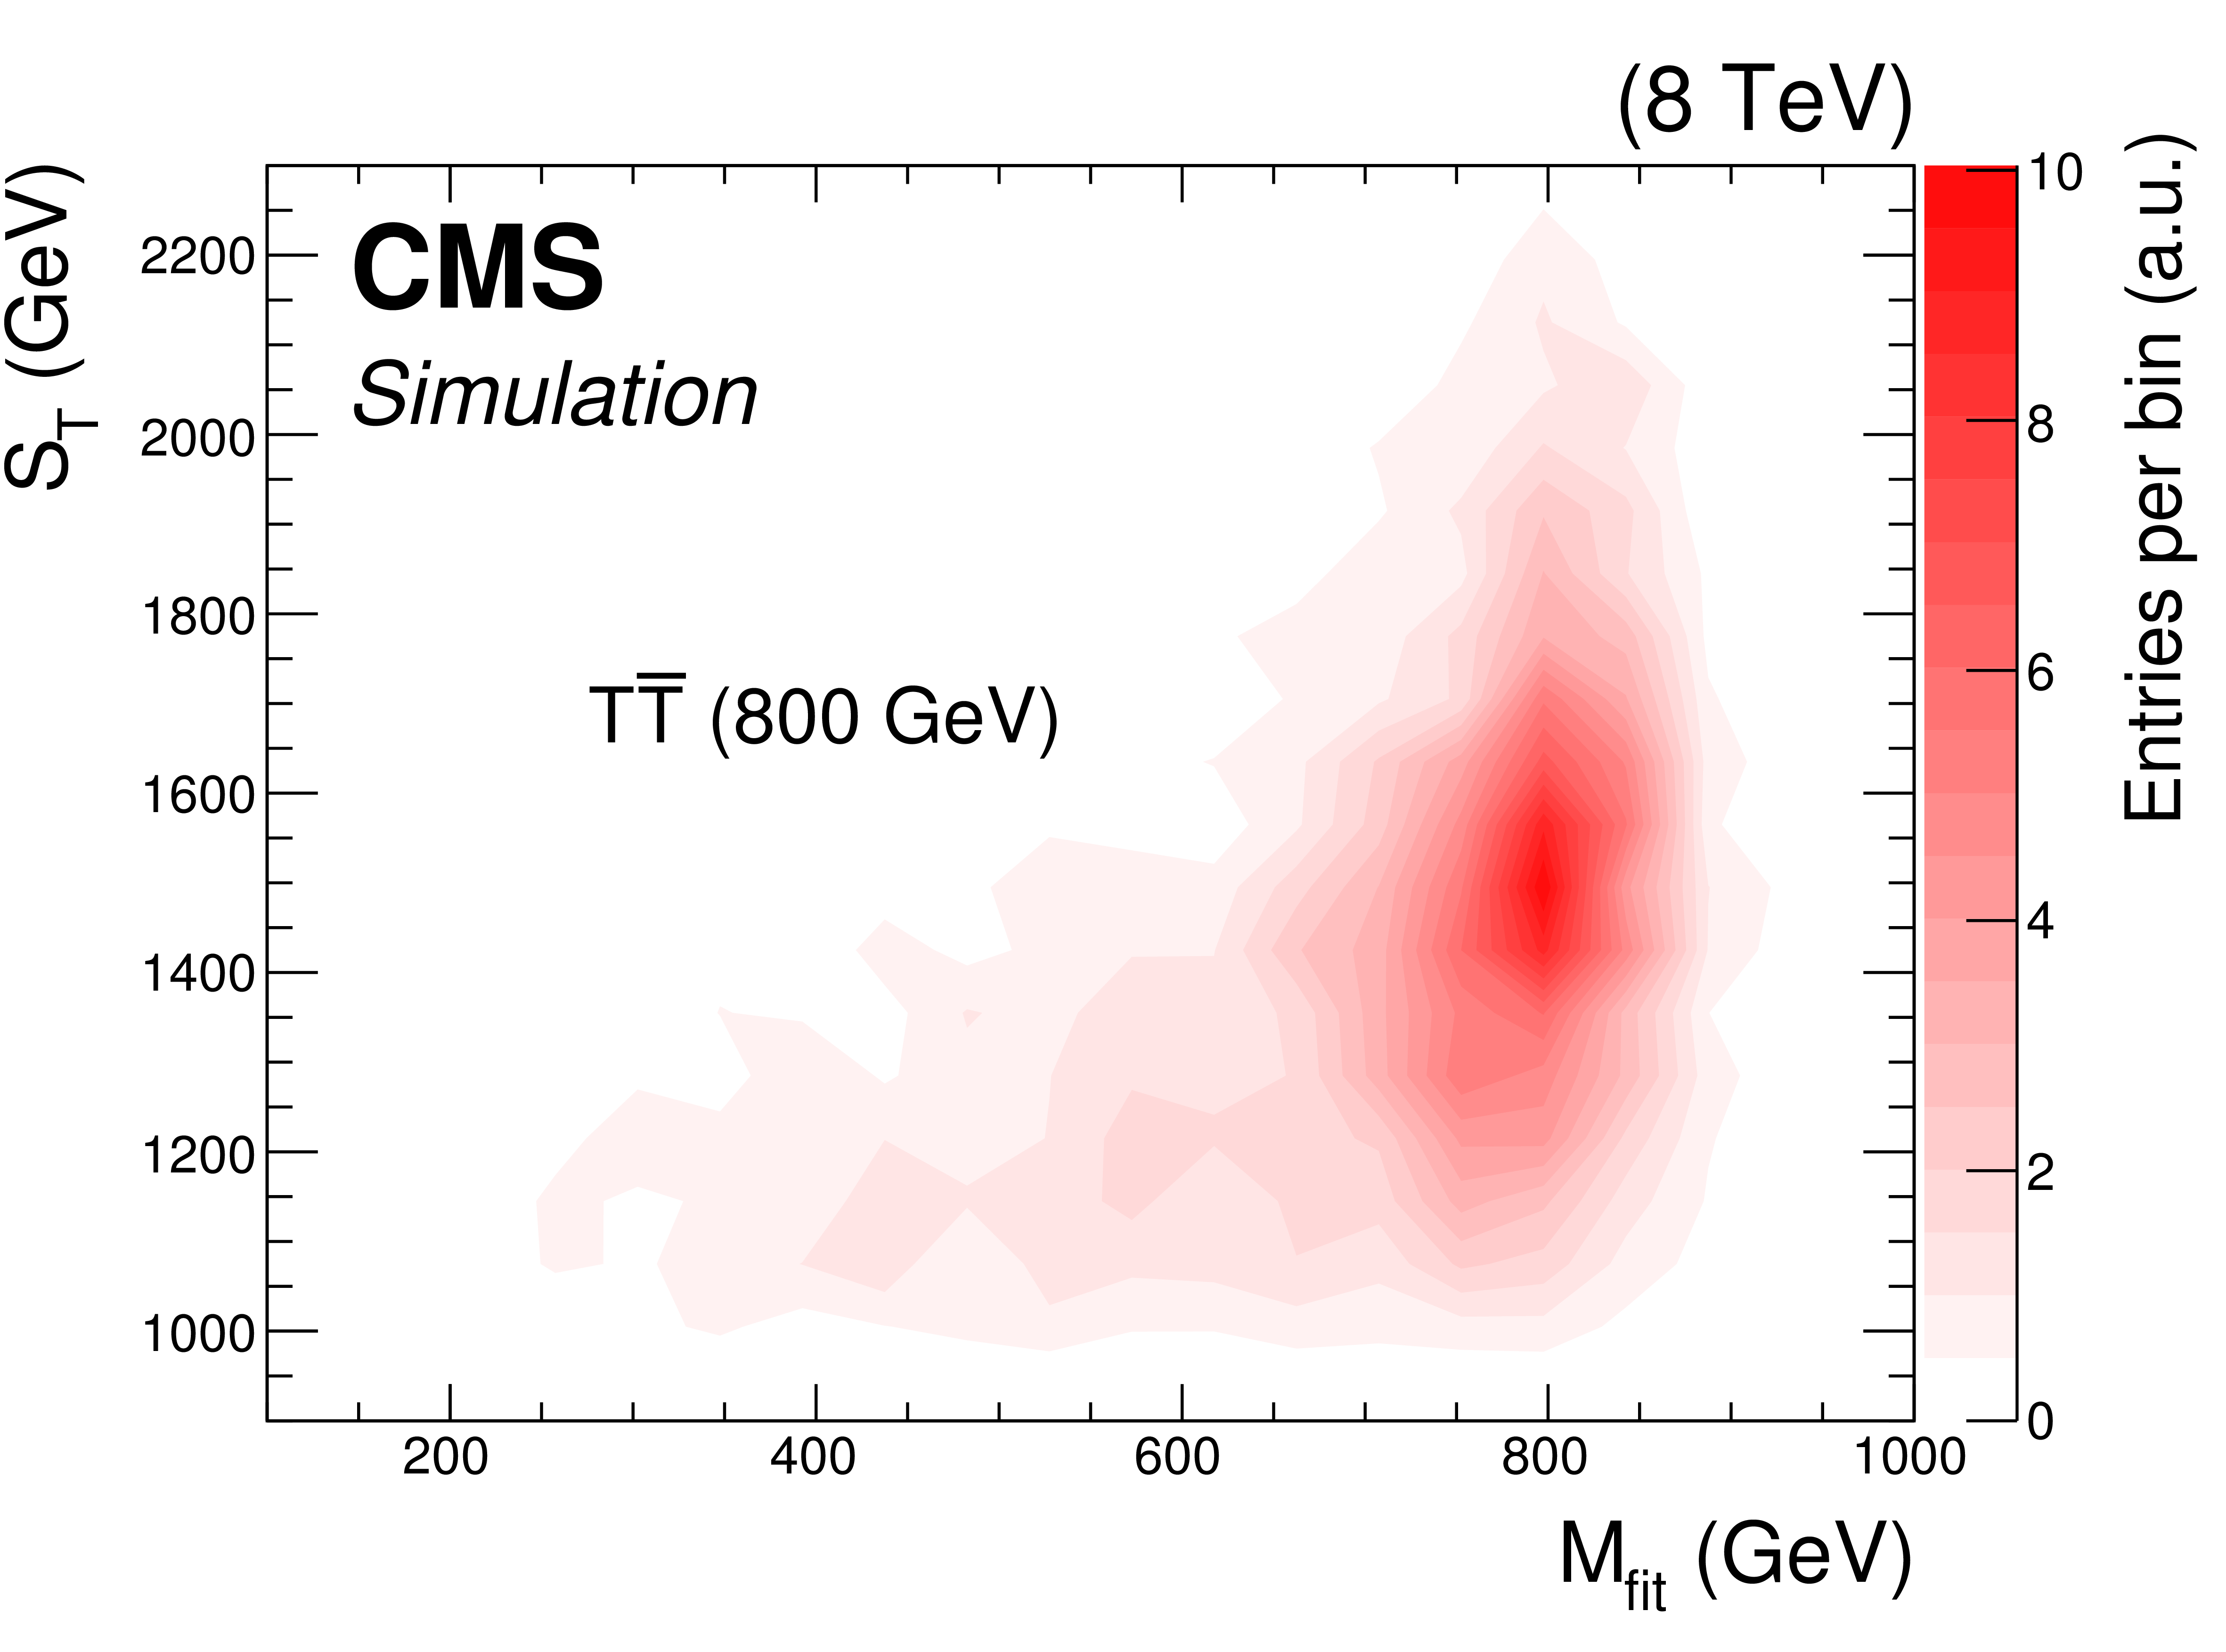
Figure 1-b:
Correlation between the $ {S_{\mathrm {T}}} $ and the $ {M_\text {fit} }$ observables in the search for $ {\mathrm {T}} \to { {\mathrm {b}} {\mathrm {W}}} $ with single leptons, for background processes (a) and for a simulated signal, with a $ {\mathrm {T}} $ quark mass of 800 GeV (b). The color gradient indicates the entries per bin in arbitrary units (a.u.). |

png pdf |
Figure 2-a:
Distributions of the reconstructed mass $ {M_\text {fit} }$ for $\mu $+jets (a) and $ {\mathrm {e}}$+jets (b) events. The data are shown as points and the simulated backgrounds as shaded histograms. The hatched region and the shaded area in the lower panel represent the statistical uncertainty in the background. The expected signal (dotted line) for a $ {\mathrm {T}} $ quark with a mass of 800 GeV is multiplied by a factor of 5 for better visibility. The lower panel represents the ratio between data and the sum of the backgrounds (BG). The overflow of the distributions is added to the last bin. |
png pdf |
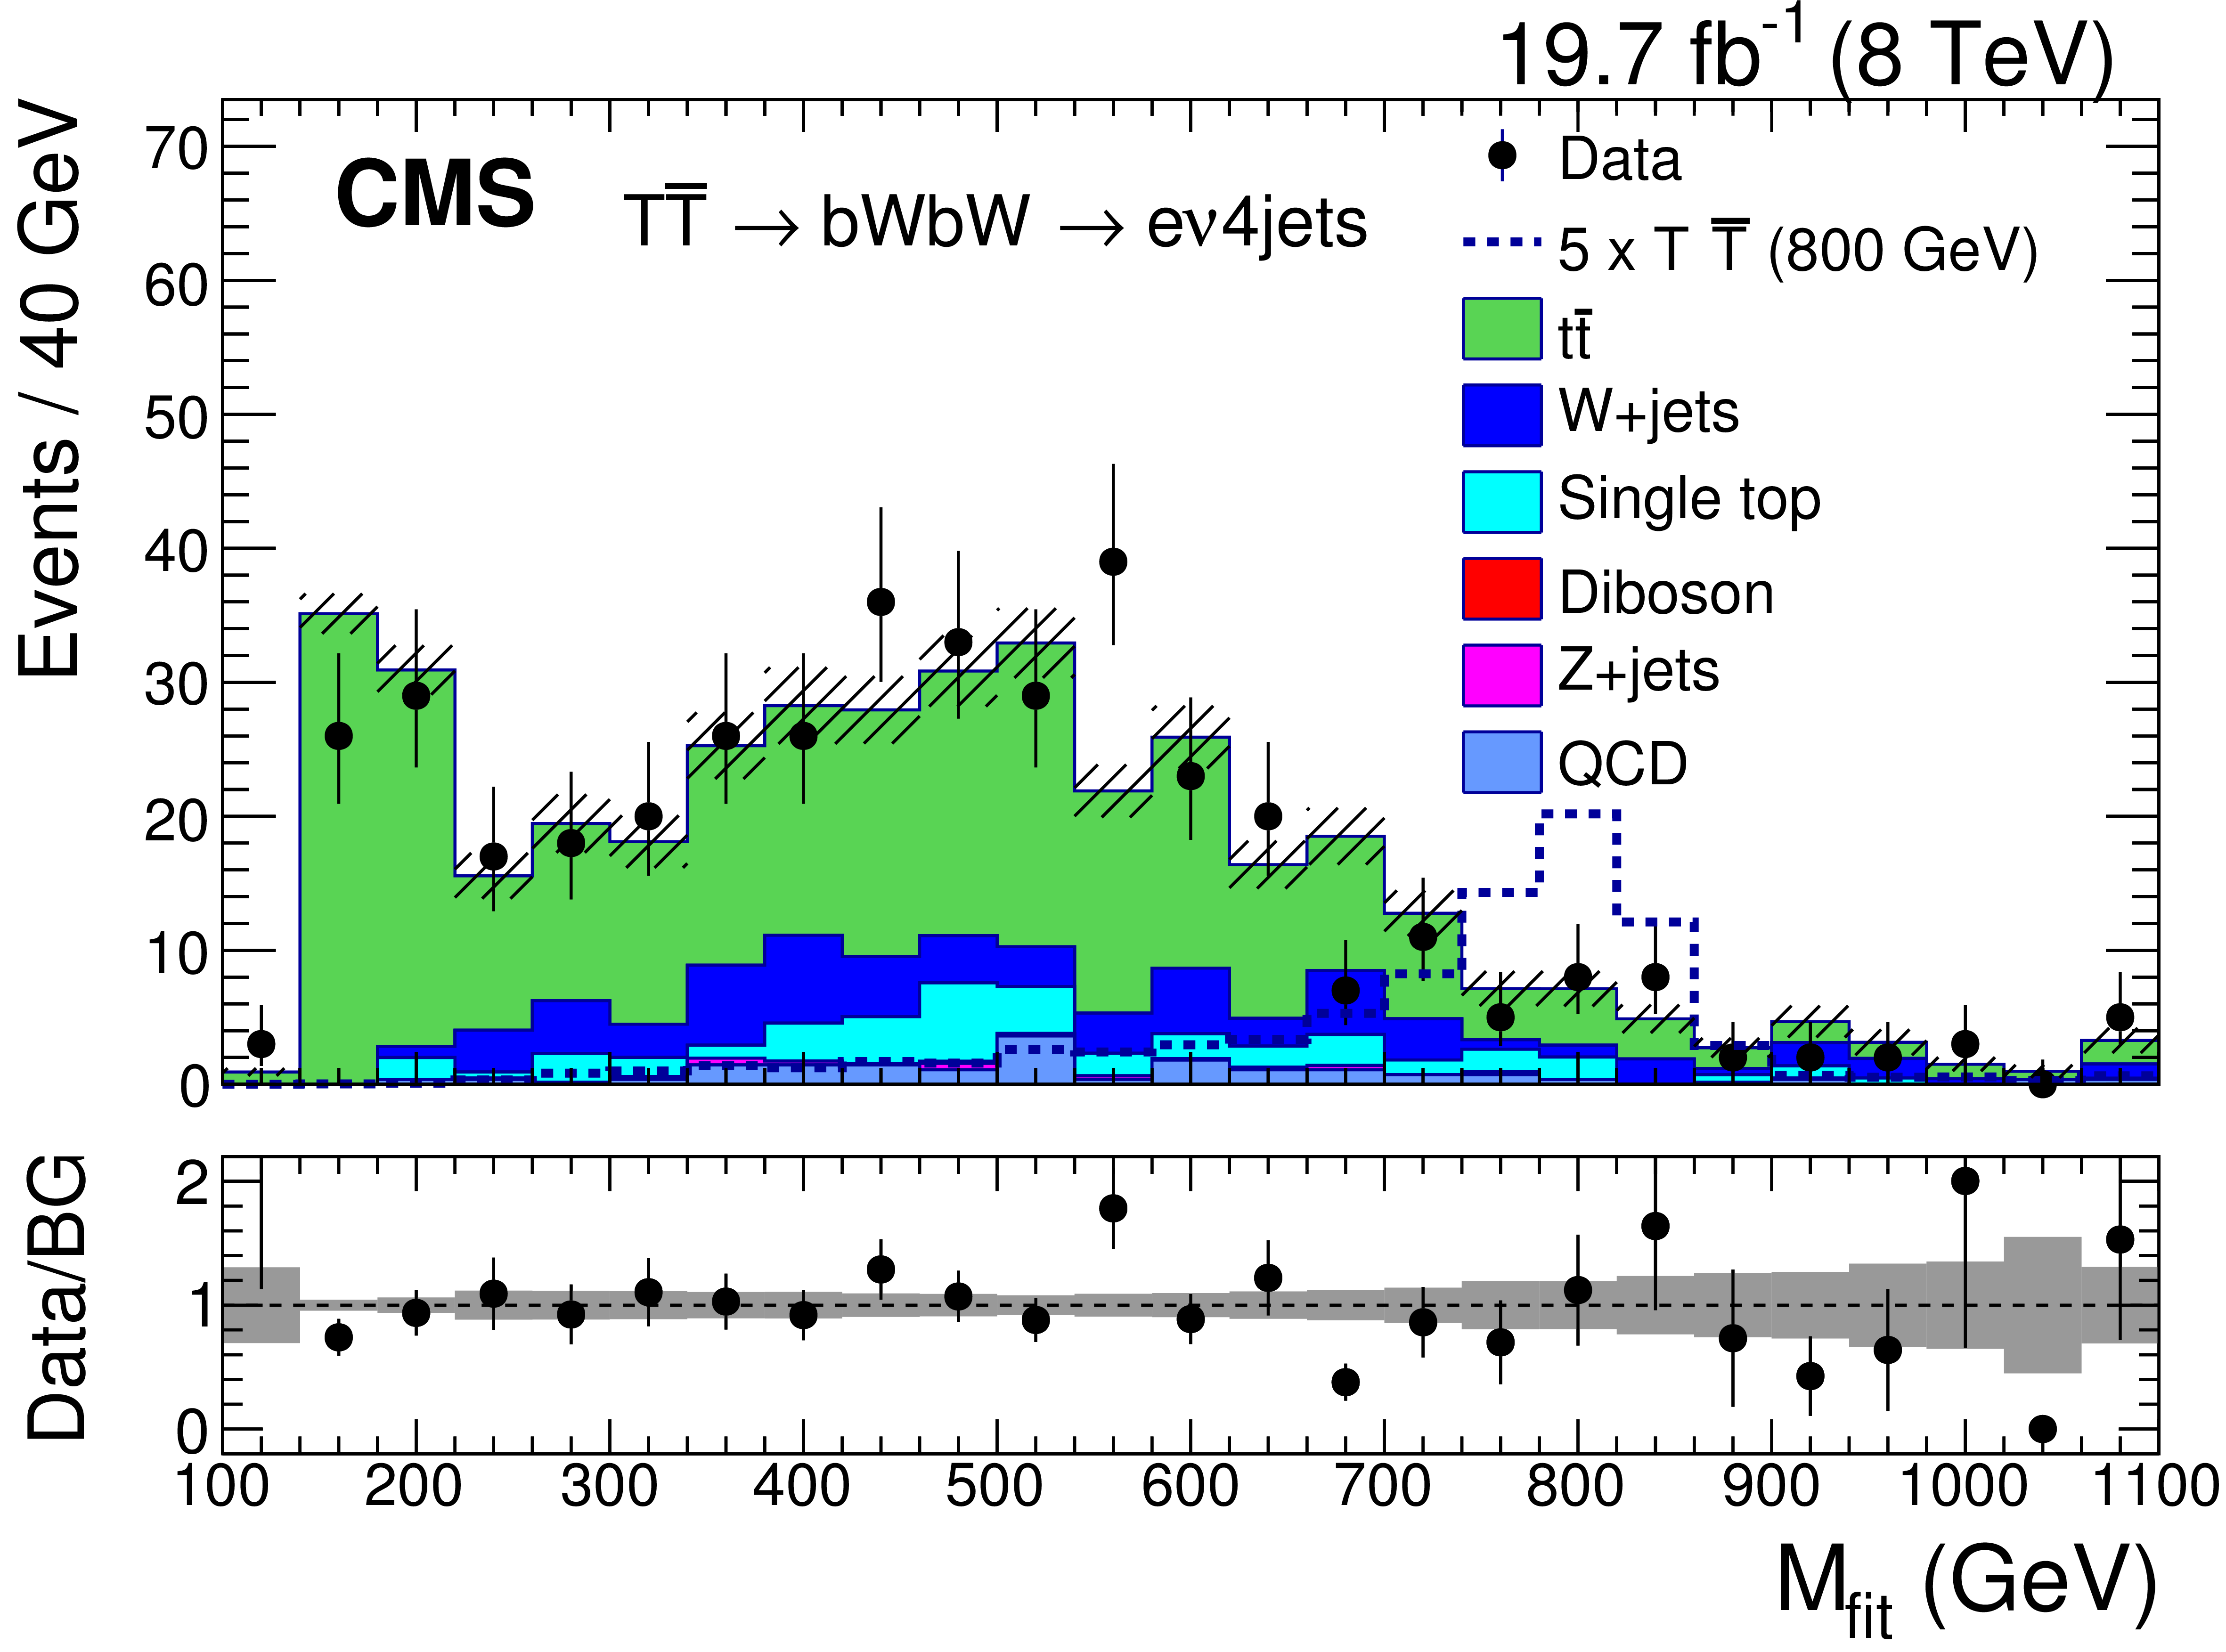
Figure 2-b:
Distributions of the reconstructed mass $ {M_\text {fit} }$ for $\mu $+jets (a) and $ {\mathrm {e}}$+jets (b) events. The data are shown as points and the simulated backgrounds as shaded histograms. The hatched region and the shaded area in the lower panel represent the statistical uncertainty in the background. The expected signal (dotted line) for a $ {\mathrm {T}} $ quark with a mass of 800 GeV is multiplied by a factor of 5 for better visibility. The lower panel represents the ratio between data and the sum of the backgrounds (BG). The overflow of the distributions is added to the last bin. |
png pdf |
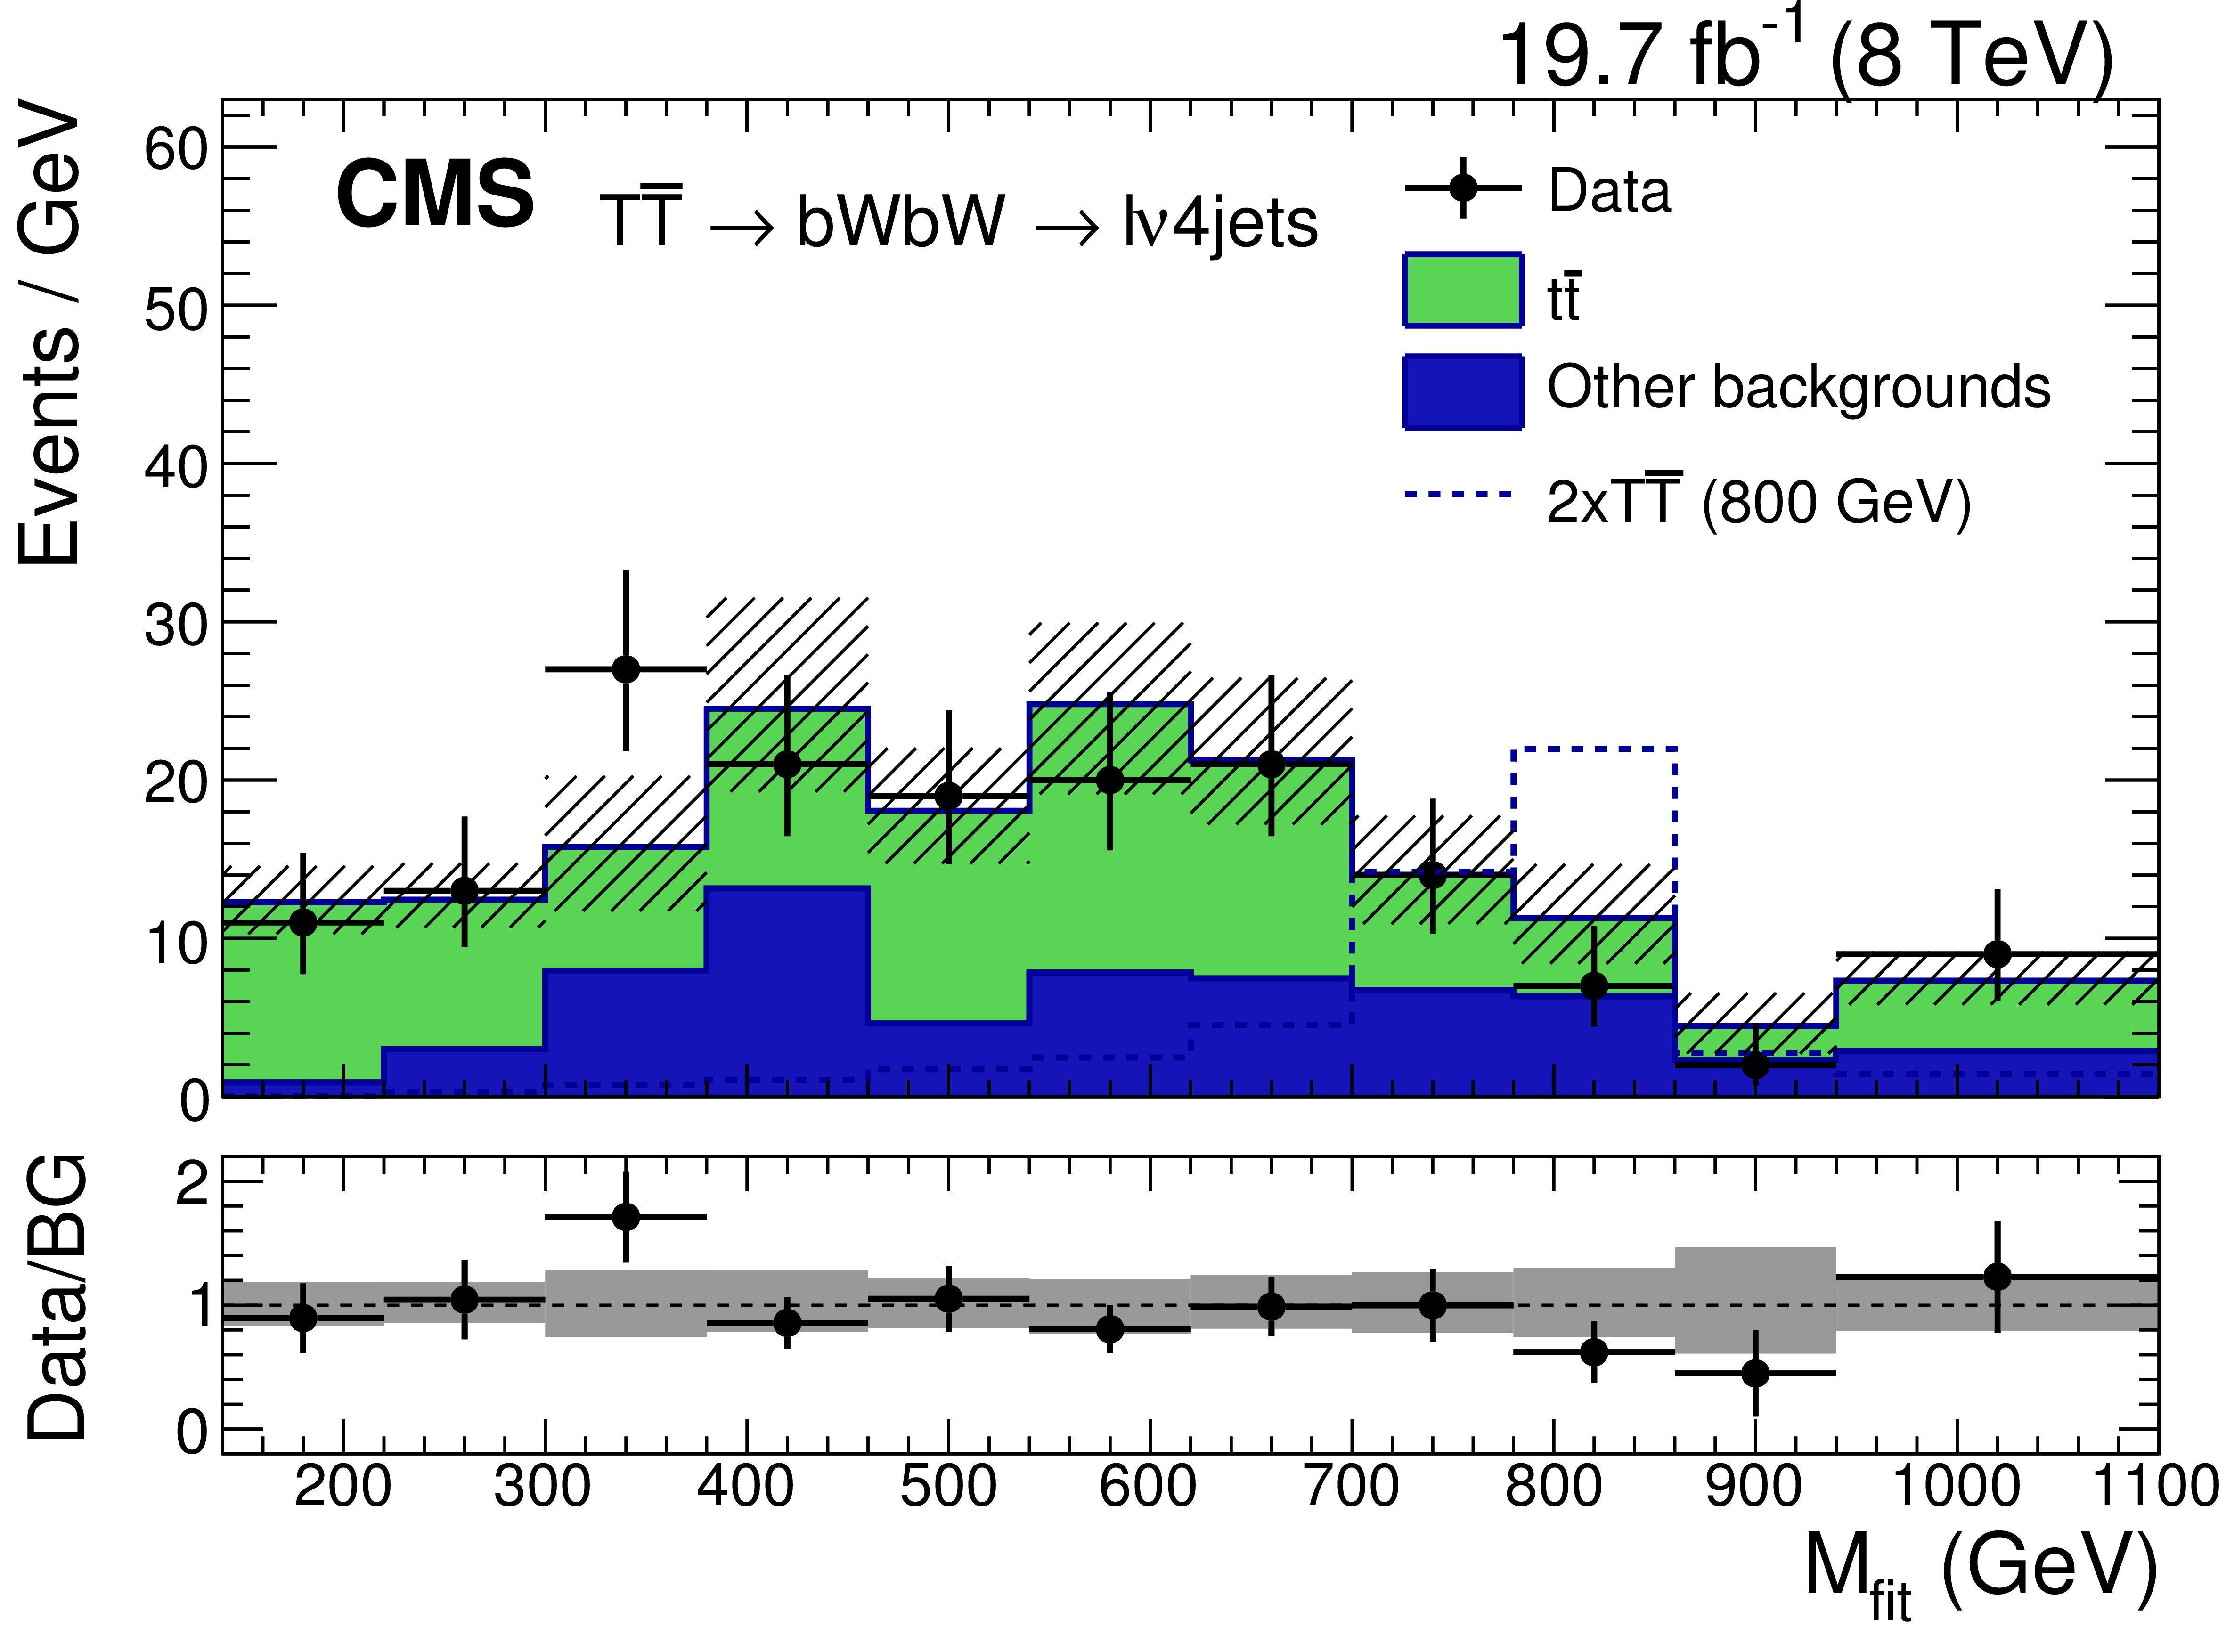
Figure 3:
Distributions of the reconstructed $ {\mathrm {T}} $ quark mass $ {M_\text {fit} }$ for $ { {\mathrm {b}} {\mathrm {W}}} { {\mathrm {b}} {\mathrm {W}}} $ candidate events in the search for $ {\mathrm {T}} \to { {\mathrm {b}} {\mathrm {W}}} $ with single leptons, combining the $\mu $+jets and $ {\mathrm {e}}$+jets samples after the selection $ {S_{\mathrm {T}}} > $ 1240 GeV. Data are shown as points and the simulated backgrounds as shaded histograms. The hatched region and the shaded area in the lower panel represent both the statistical and the systematic uncertainties in the total background. The expected signal for a $ {\mathrm {T}} $ quark of mass 800 GeV is multiplied by a factor of 2. The lower panel represents the ratio between data and the sum of the backgrounds (BG). The horizontal error bars represent the bin width. The overflow of the distribution is added to the last bin. |
png pdf |
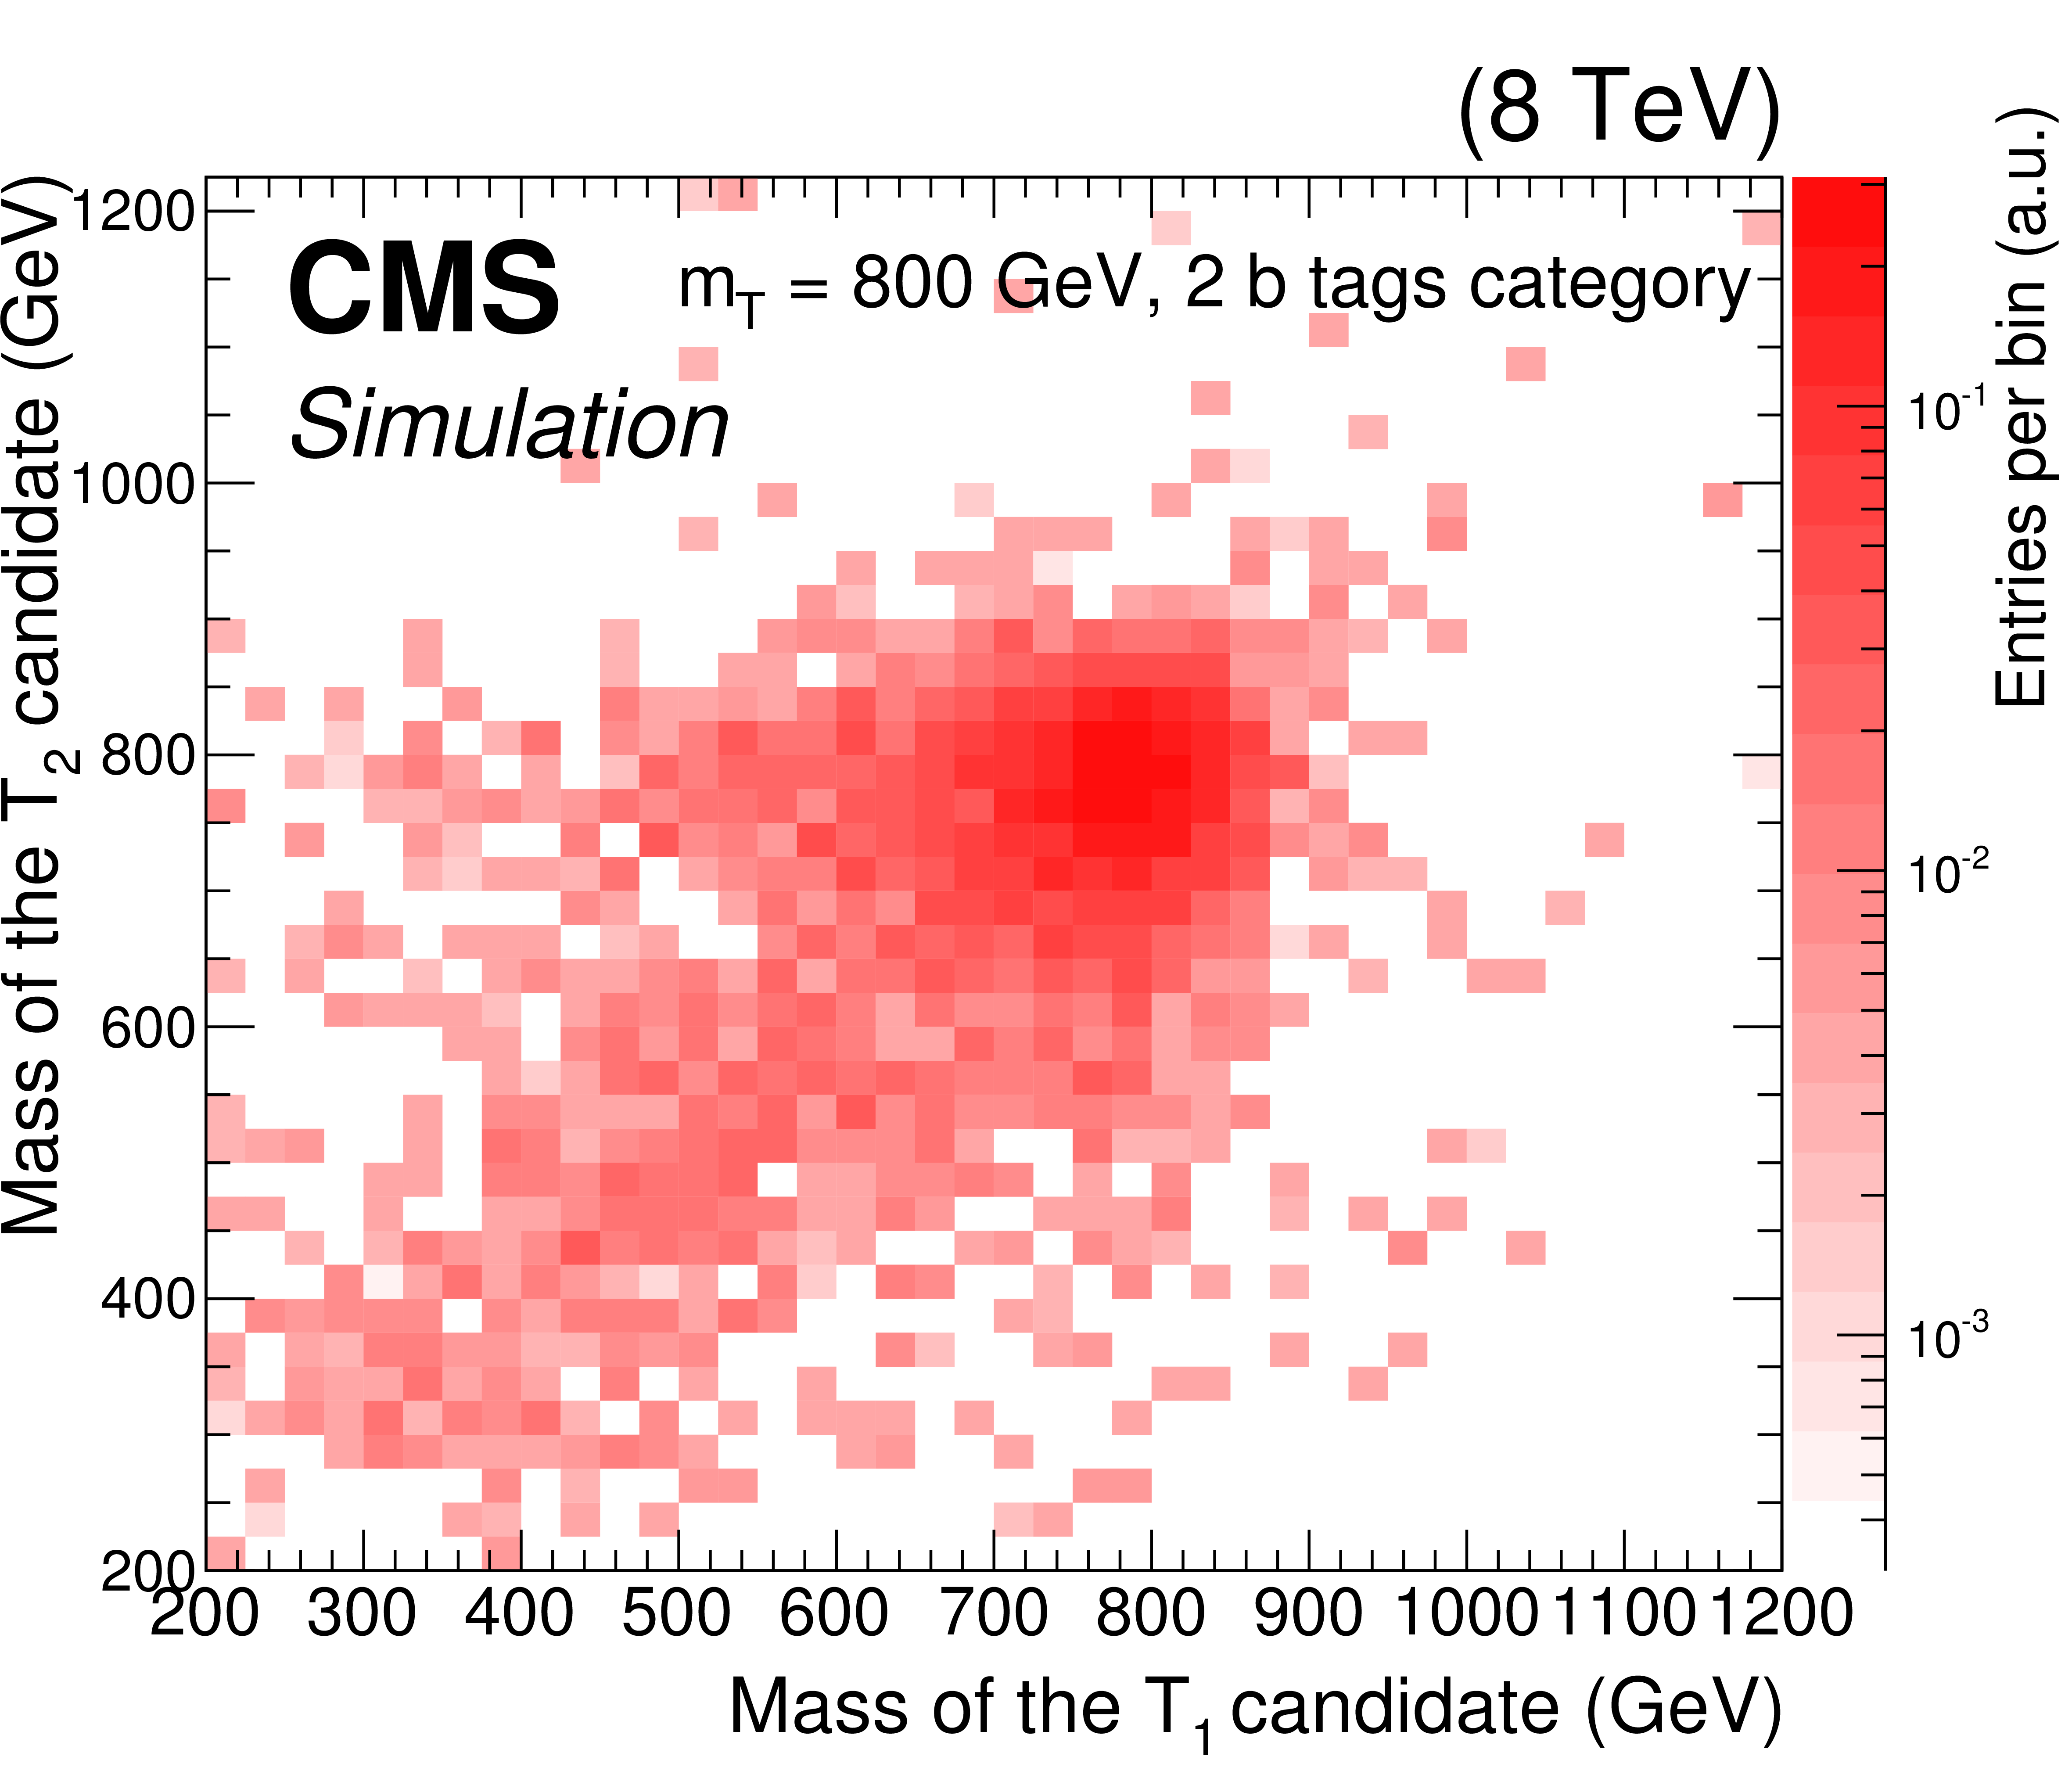
Figure 4:
Two-dimensional distribution of the masses of each reconstructed $ {\mathrm {T}} $ candidate in the selected events for the all-hadronic search for $ {\mathrm {T}} \to { {\mathrm {b}} {\mathrm {W}}} $, for a simulated signal sample with a $ {\mathrm {T}} $ quark mass of 800 GeV. The order of $ {\mathrm {T}} _1$ and $ {\mathrm {T}} _2$ is arbitrary. |
png pdf |
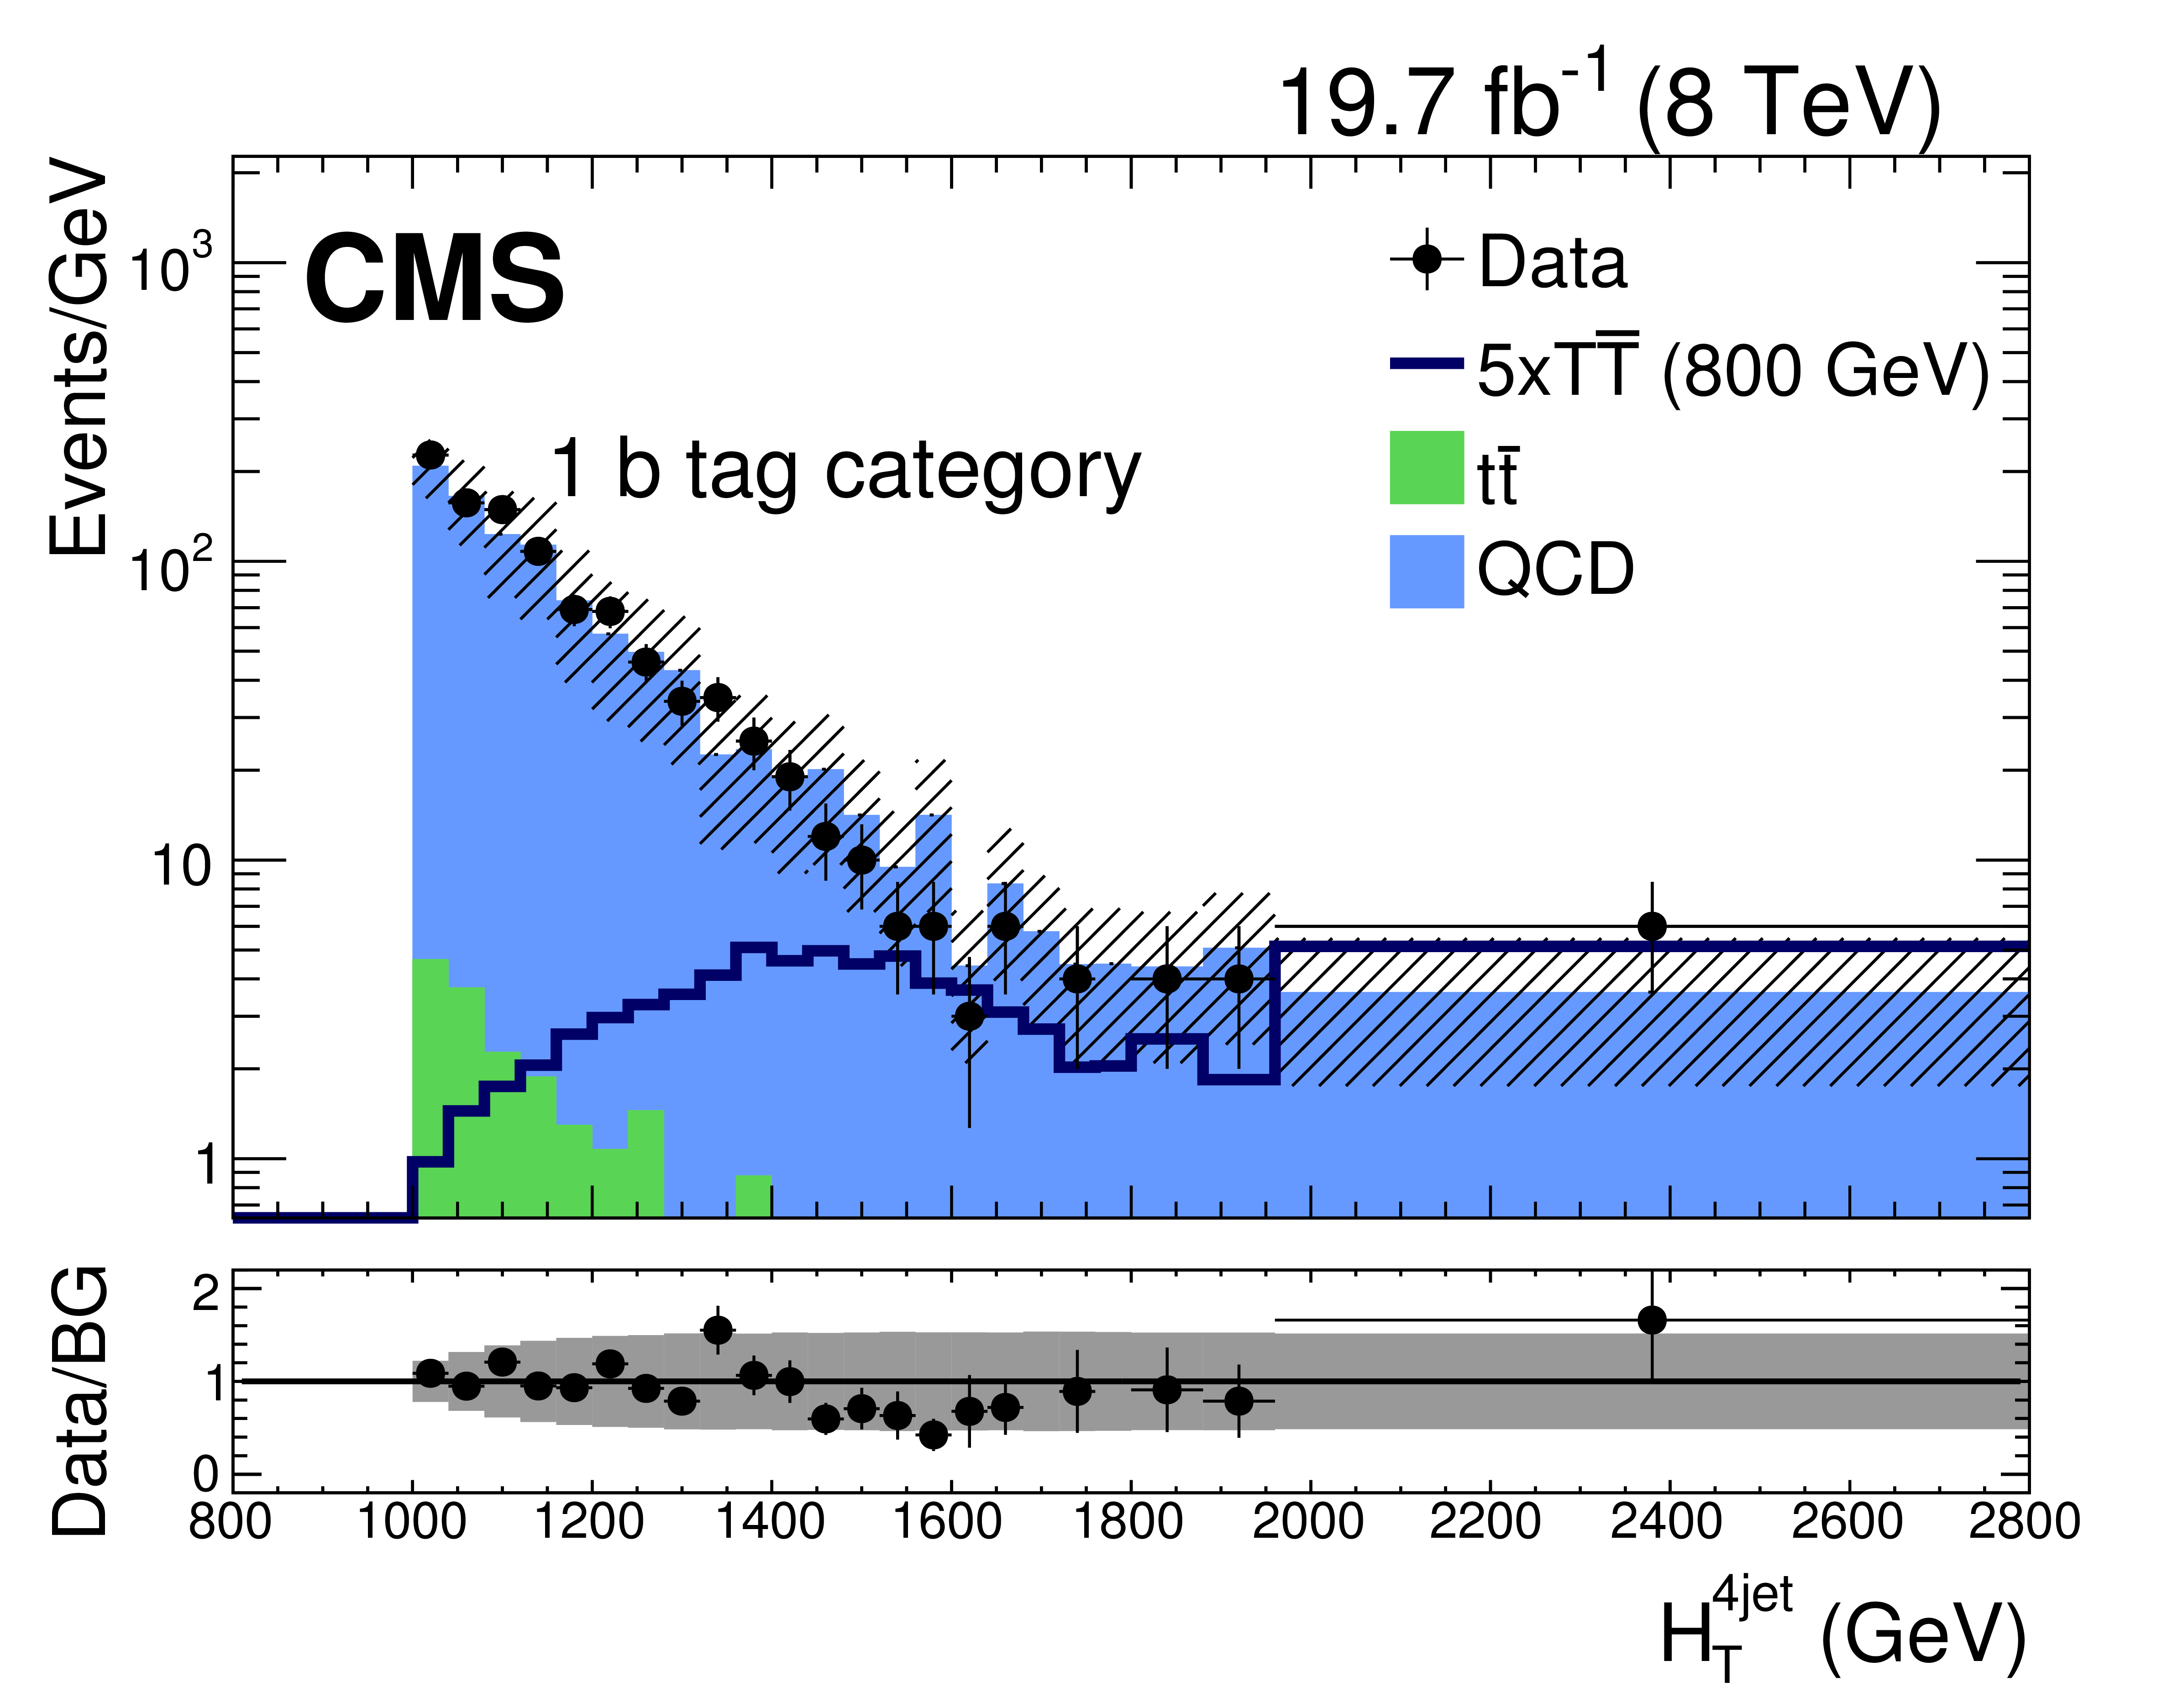
Figure 5-a:
The $ {H_{\mathrm {T}}} ^{\rm 4jet}$ distributions for single $ {\mathrm {b}} $ tag events (a) and for events with at least two $ {\mathrm {b}} $ tags (right) for the all-hadronic search for $ {\mathrm {T}} \to { {\mathrm {b}} {\mathrm {W}}} $, including the QCD multijet background estimate obtained from data and the $ {\mathrm {T}} $ quark signal with a mass of 800 GeV. The hatched region and the shaded area in the lower panel represent both the statistical and the systematic uncertainties in the total background. The lower panel represents the ratio between data and the sum of the backgrounds (BG). The horizontal error bars represent the bin width. |
png pdf |
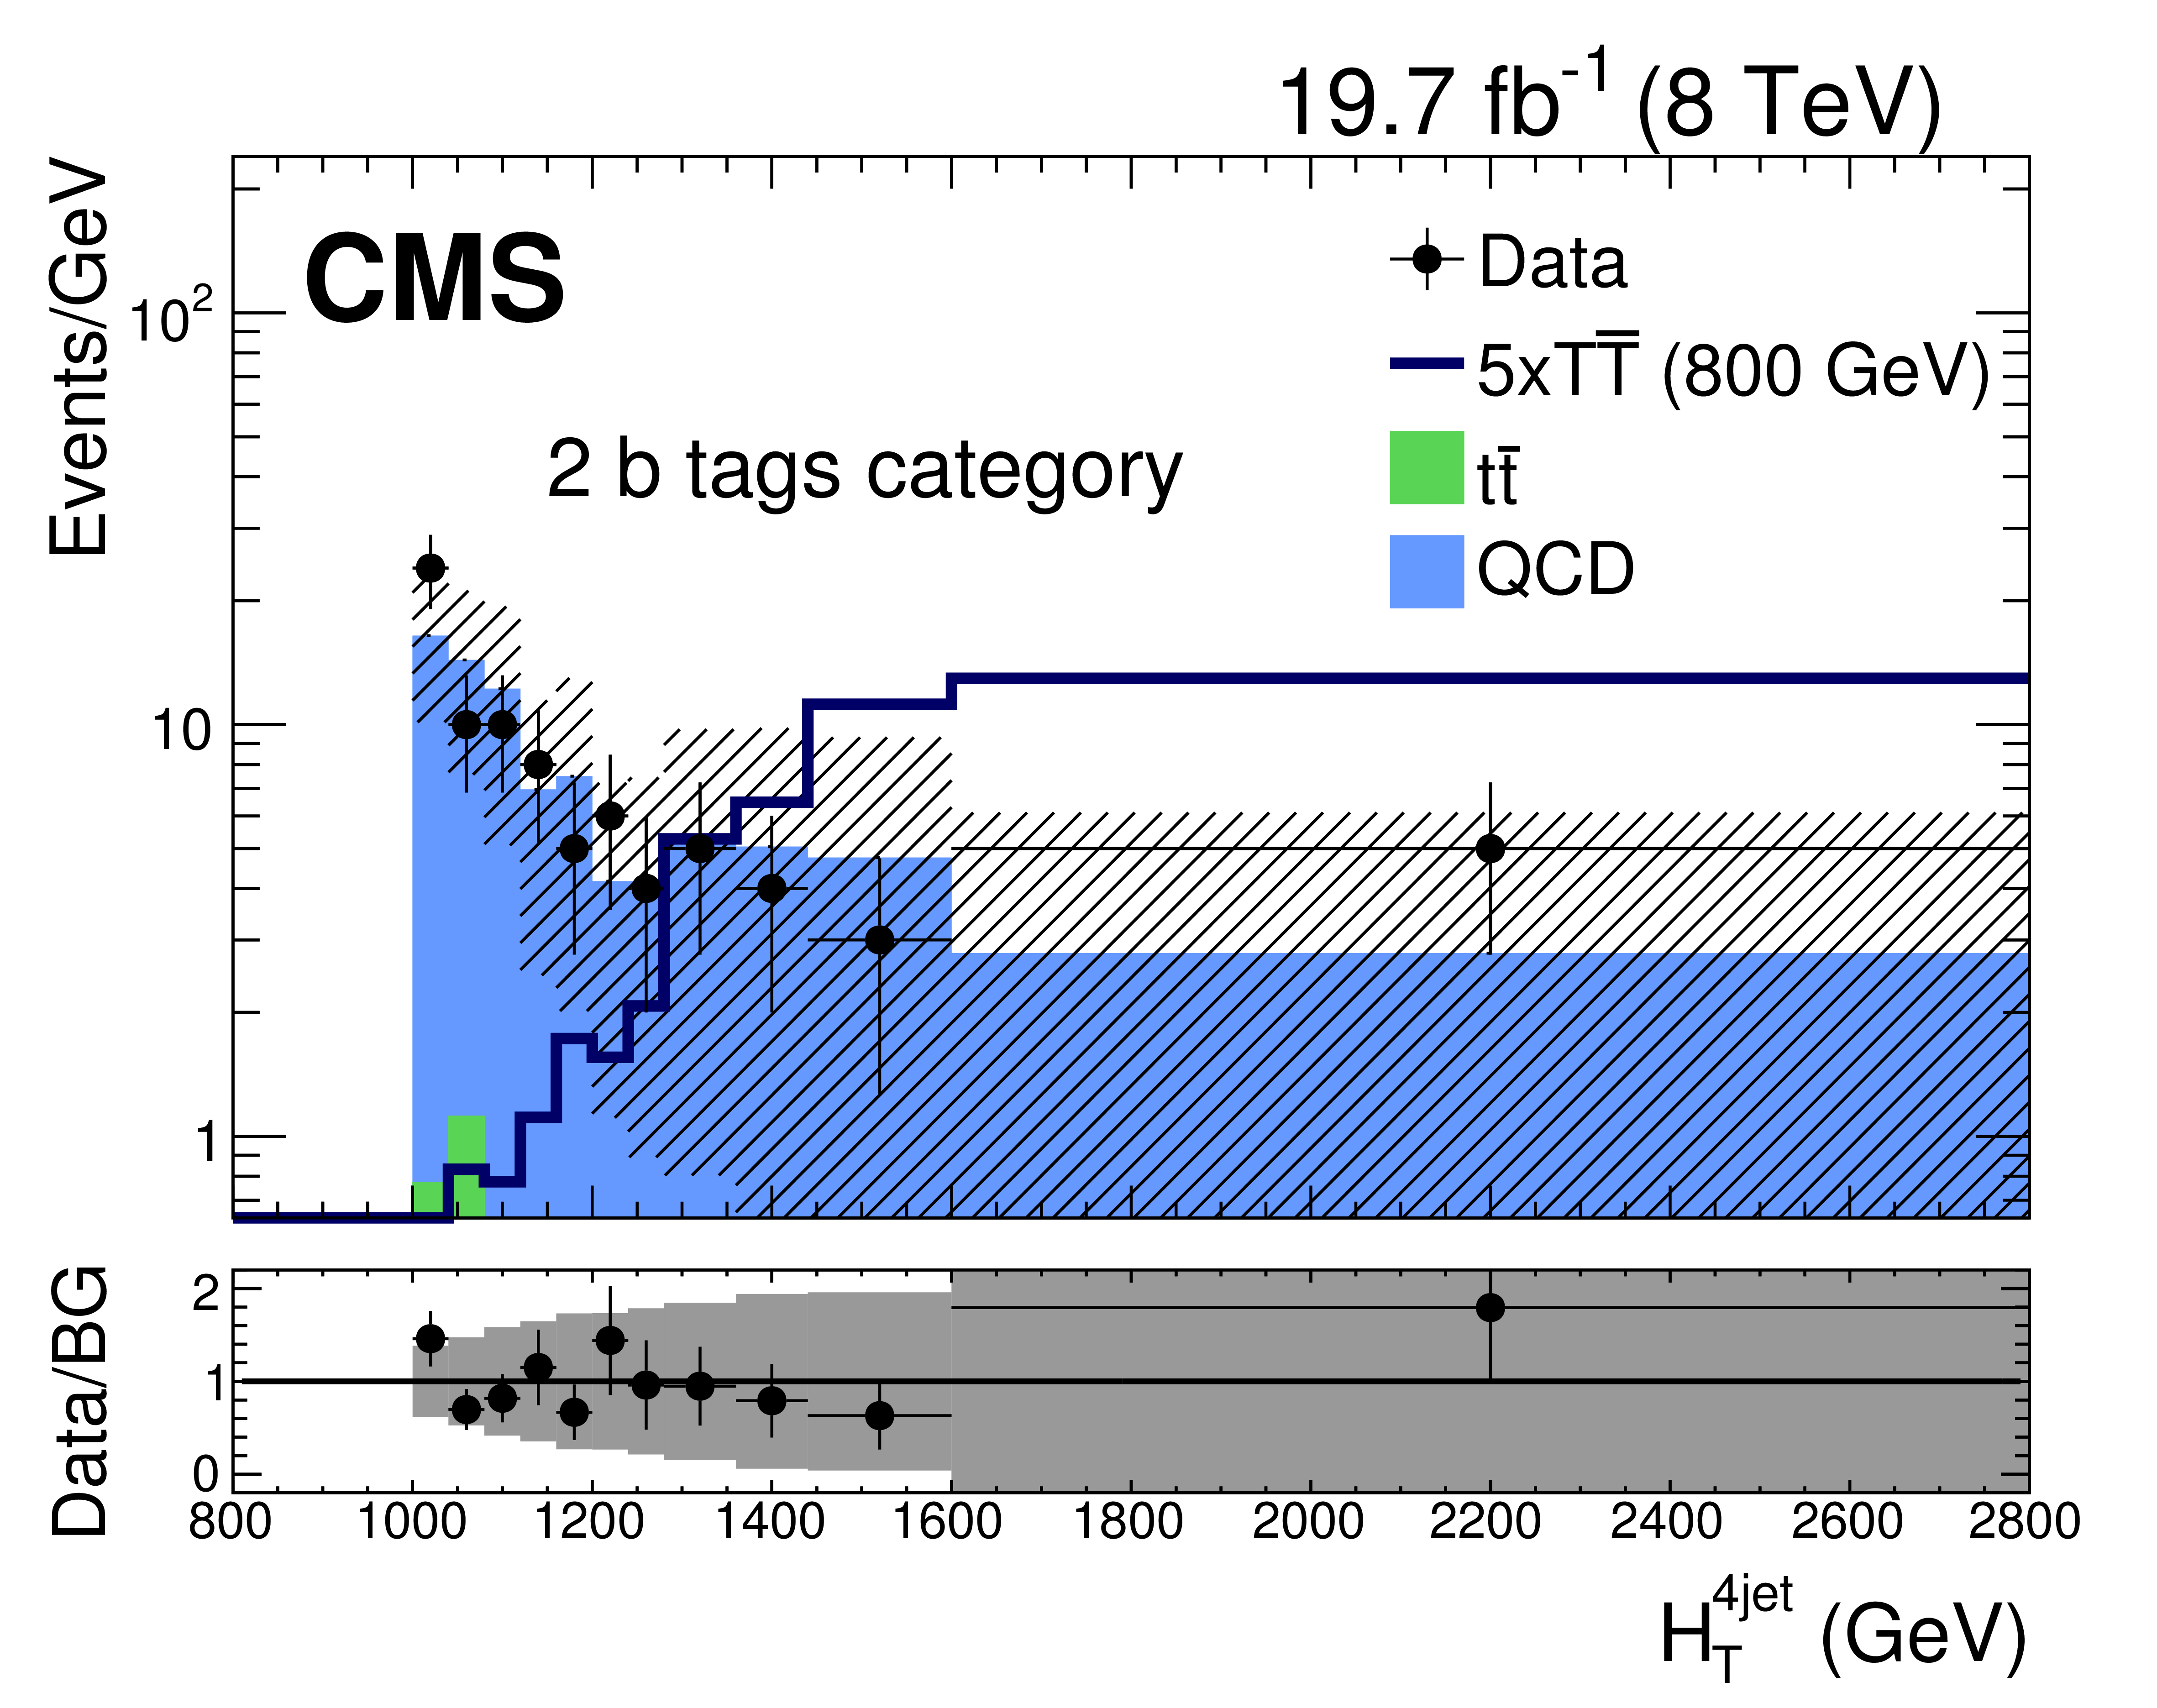
Figure 5-b:
The $ {H_{\mathrm {T}}} ^{\rm 4jet}$ distributions for single $ {\mathrm {b}} $ tag events (a) and for events with at least two $ {\mathrm {b}} $ tags (right) for the all-hadronic search for $ {\mathrm {T}} \to { {\mathrm {b}} {\mathrm {W}}} $, including the QCD multijet background estimate obtained from data and the $ {\mathrm {T}} $ quark signal with a mass of 800 GeV. The hatched region and the shaded area in the lower panel represent both the statistical and the systematic uncertainties in the total background. The lower panel represents the ratio between data and the sum of the backgrounds (BG). The horizontal error bars represent the bin width. |

png pdf |
Figure 6-a:
Diphoton invariant mass distribution for the leptonic (a) and hadronic (b) channels of the search for $ {\mathrm {T}} \to { {\mathrm {t}} {\mathrm {H}} } $ with $ \mathrm{H} \to {\gamma } {\gamma }$. The signal is normalized to the predicted theoretical cross section corresponding to $m_{\mathrm {T}}=$ 700 GeV. The backgrounds predicted by the fit are shown as a solid line while the corresponding uncertainties are shown as bands around the line, where the inner band indicates the $1\sigma $ and the outer band indicates the $2\sigma $ uncertainties. Bins with zero entries are not shown. |

png pdf |
Figure 6-b:
Diphoton invariant mass distribution for the leptonic (a) and hadronic (b) channels of the search for $ {\mathrm {T}} \to { {\mathrm {t}} {\mathrm {H}} } $ with $ \mathrm{H} \to {\gamma } {\gamma }$. The signal is normalized to the predicted theoretical cross section corresponding to $m_{\mathrm {T}}=$ 700 GeV. The backgrounds predicted by the fit are shown as a solid line while the corresponding uncertainties are shown as bands around the line, where the inner band indicates the $1\sigma $ and the outer band indicates the $2\sigma $ uncertainties. Bins with zero entries are not shown. |
png pdf |
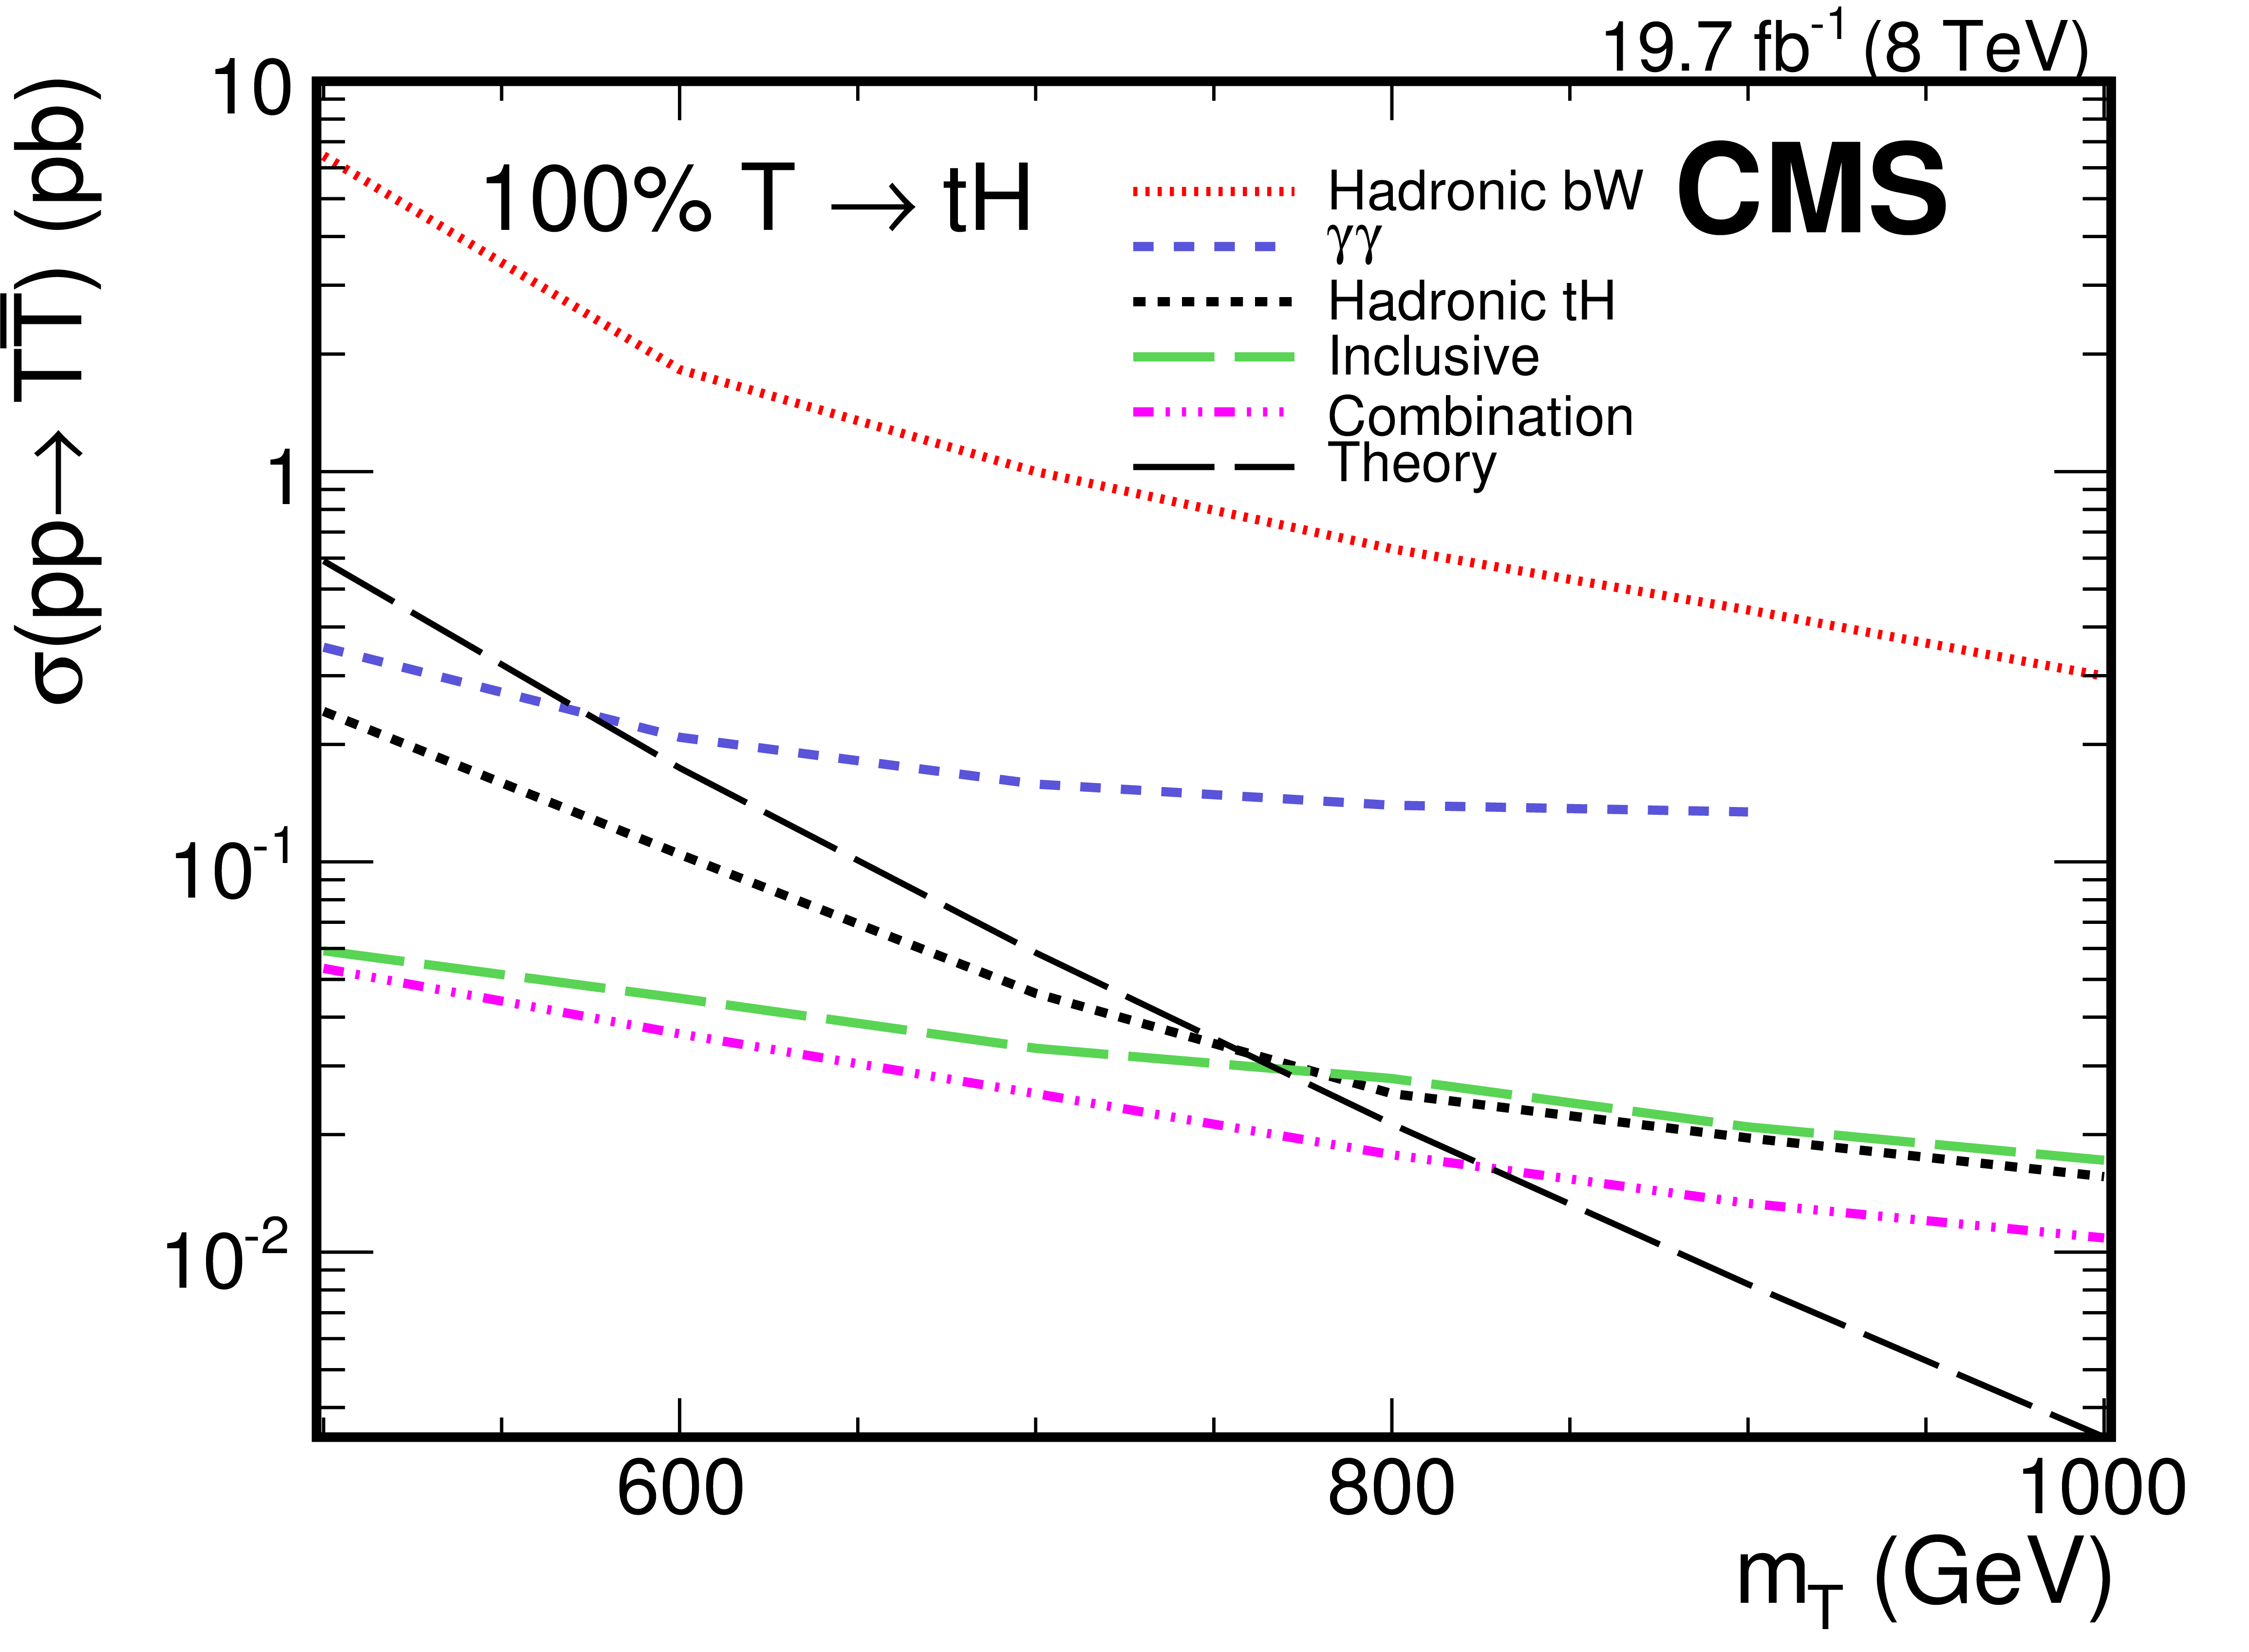
Figure 7-a:
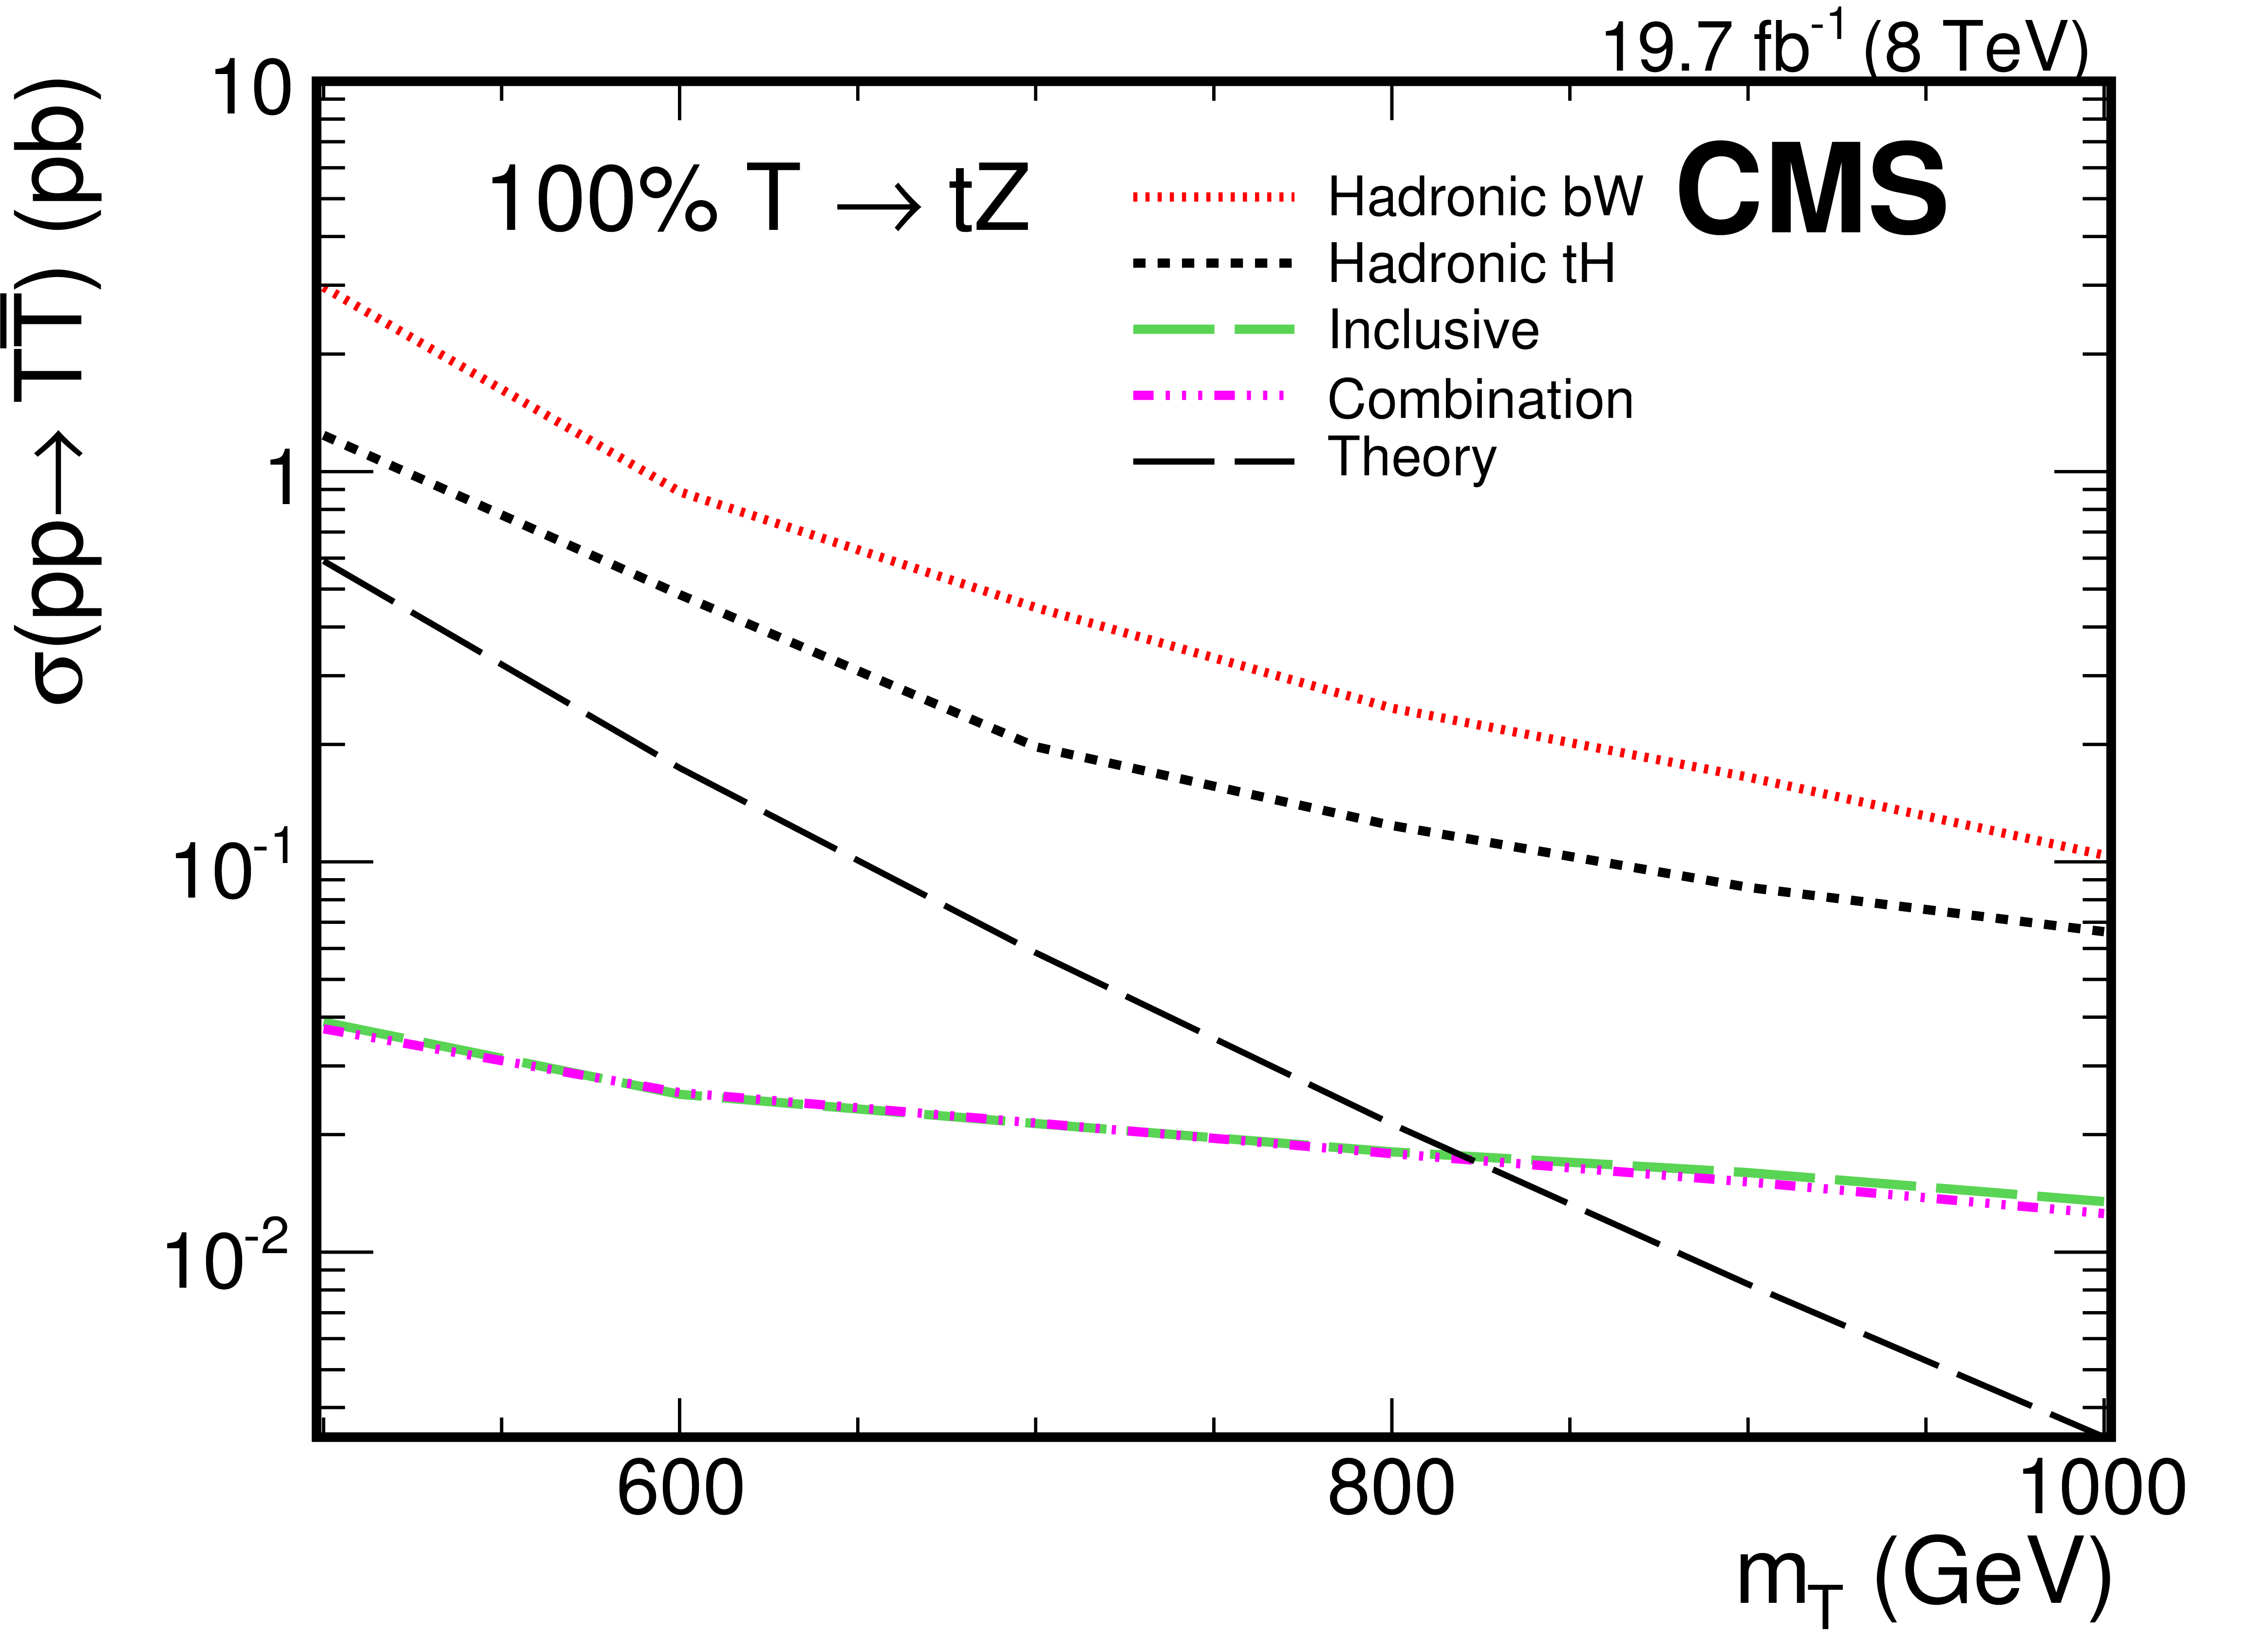
Expected limits at 95% CL of the individual analyses in comparison to the combination for exclusive decays of the $ {\mathrm {T}} $ quark to $ { {\mathrm {t}} {\mathrm {H}} } $, $ { {\mathrm {t}} {\mathrm {Z}}} $, and $ { {\mathrm {b}} {\mathrm {W}}} $. |
png pdf |
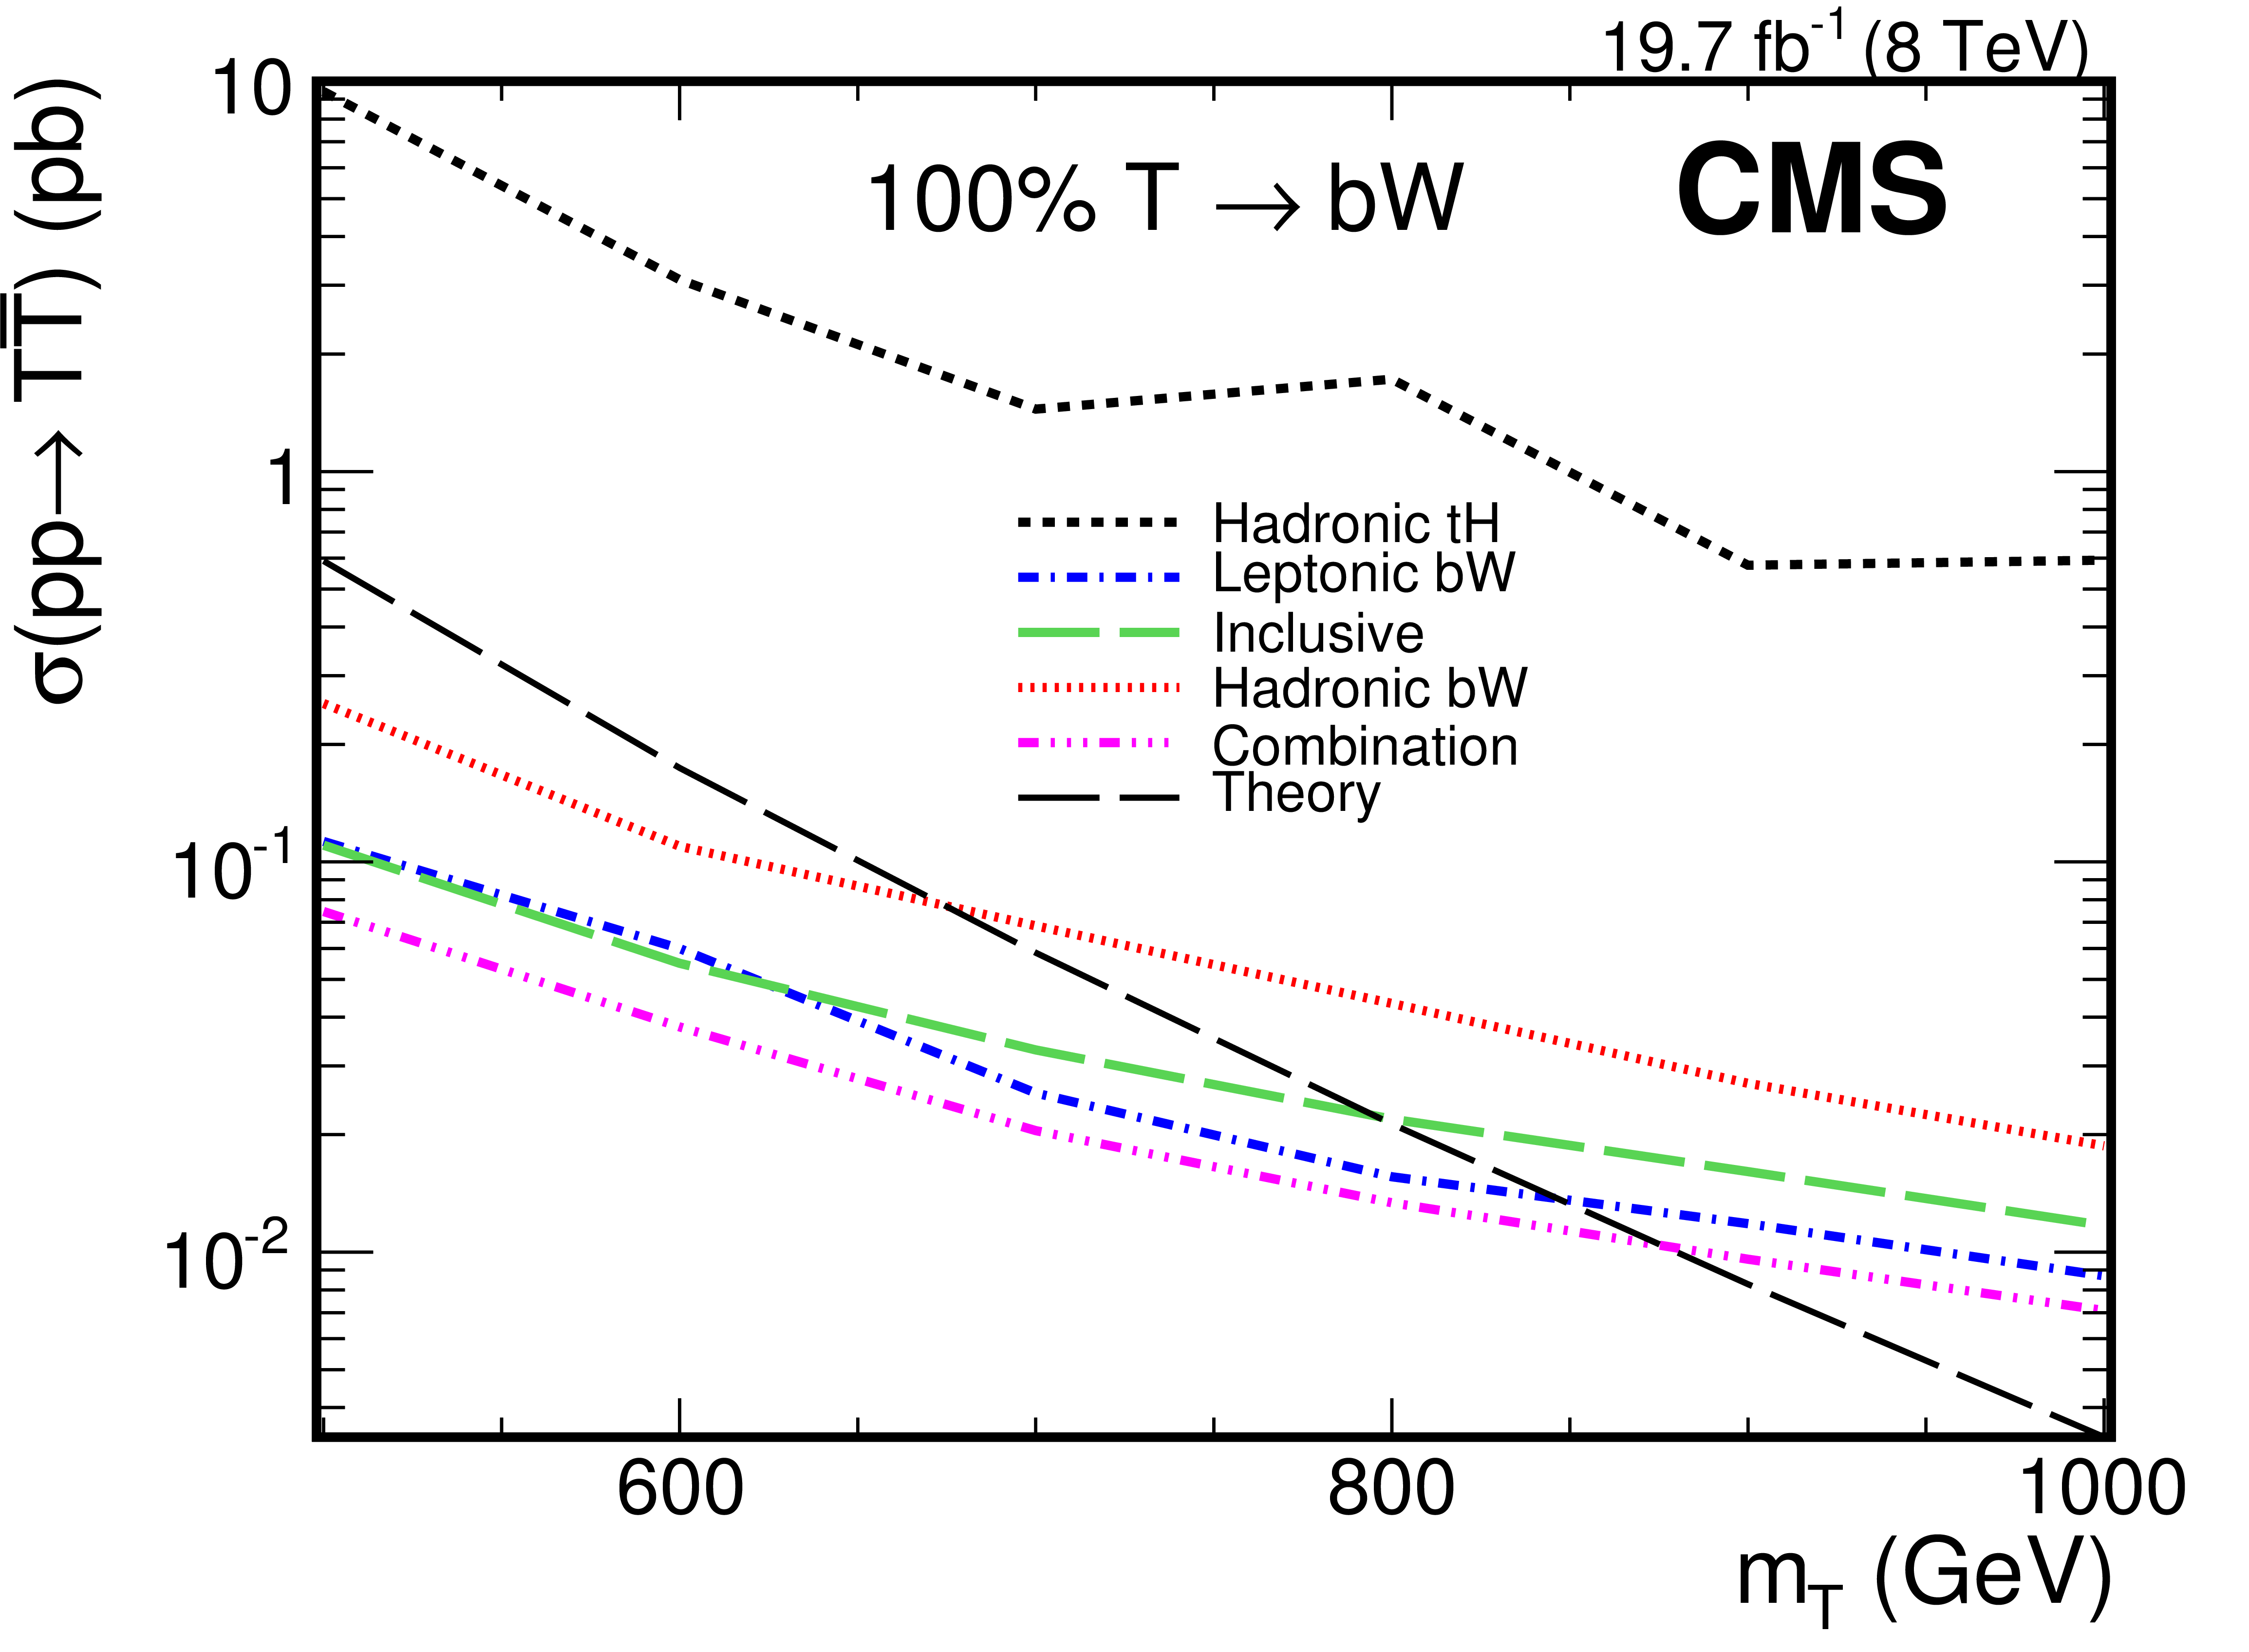
Figure 7-b:
Expected limits at 95% CL of the individual analyses in comparison to the combination for exclusive decays of the $ {\mathrm {T}} $ quark to $ { {\mathrm {t}} {\mathrm {H}} } $, $ { {\mathrm {t}} {\mathrm {Z}}} $, and $ { {\mathrm {b}} {\mathrm {W}}} $. |
png pdf |
Figure 7-c:
Expected limits at 95% CL of the individual analyses in comparison to the combination for exclusive decays of the $ {\mathrm {T}} $ quark to $ { {\mathrm {t}} {\mathrm {H}} } $, $ { {\mathrm {t}} {\mathrm {Z}}} $, and $ { {\mathrm {b}} {\mathrm {W}}} $. |
png pdf |
Figure 8-a:
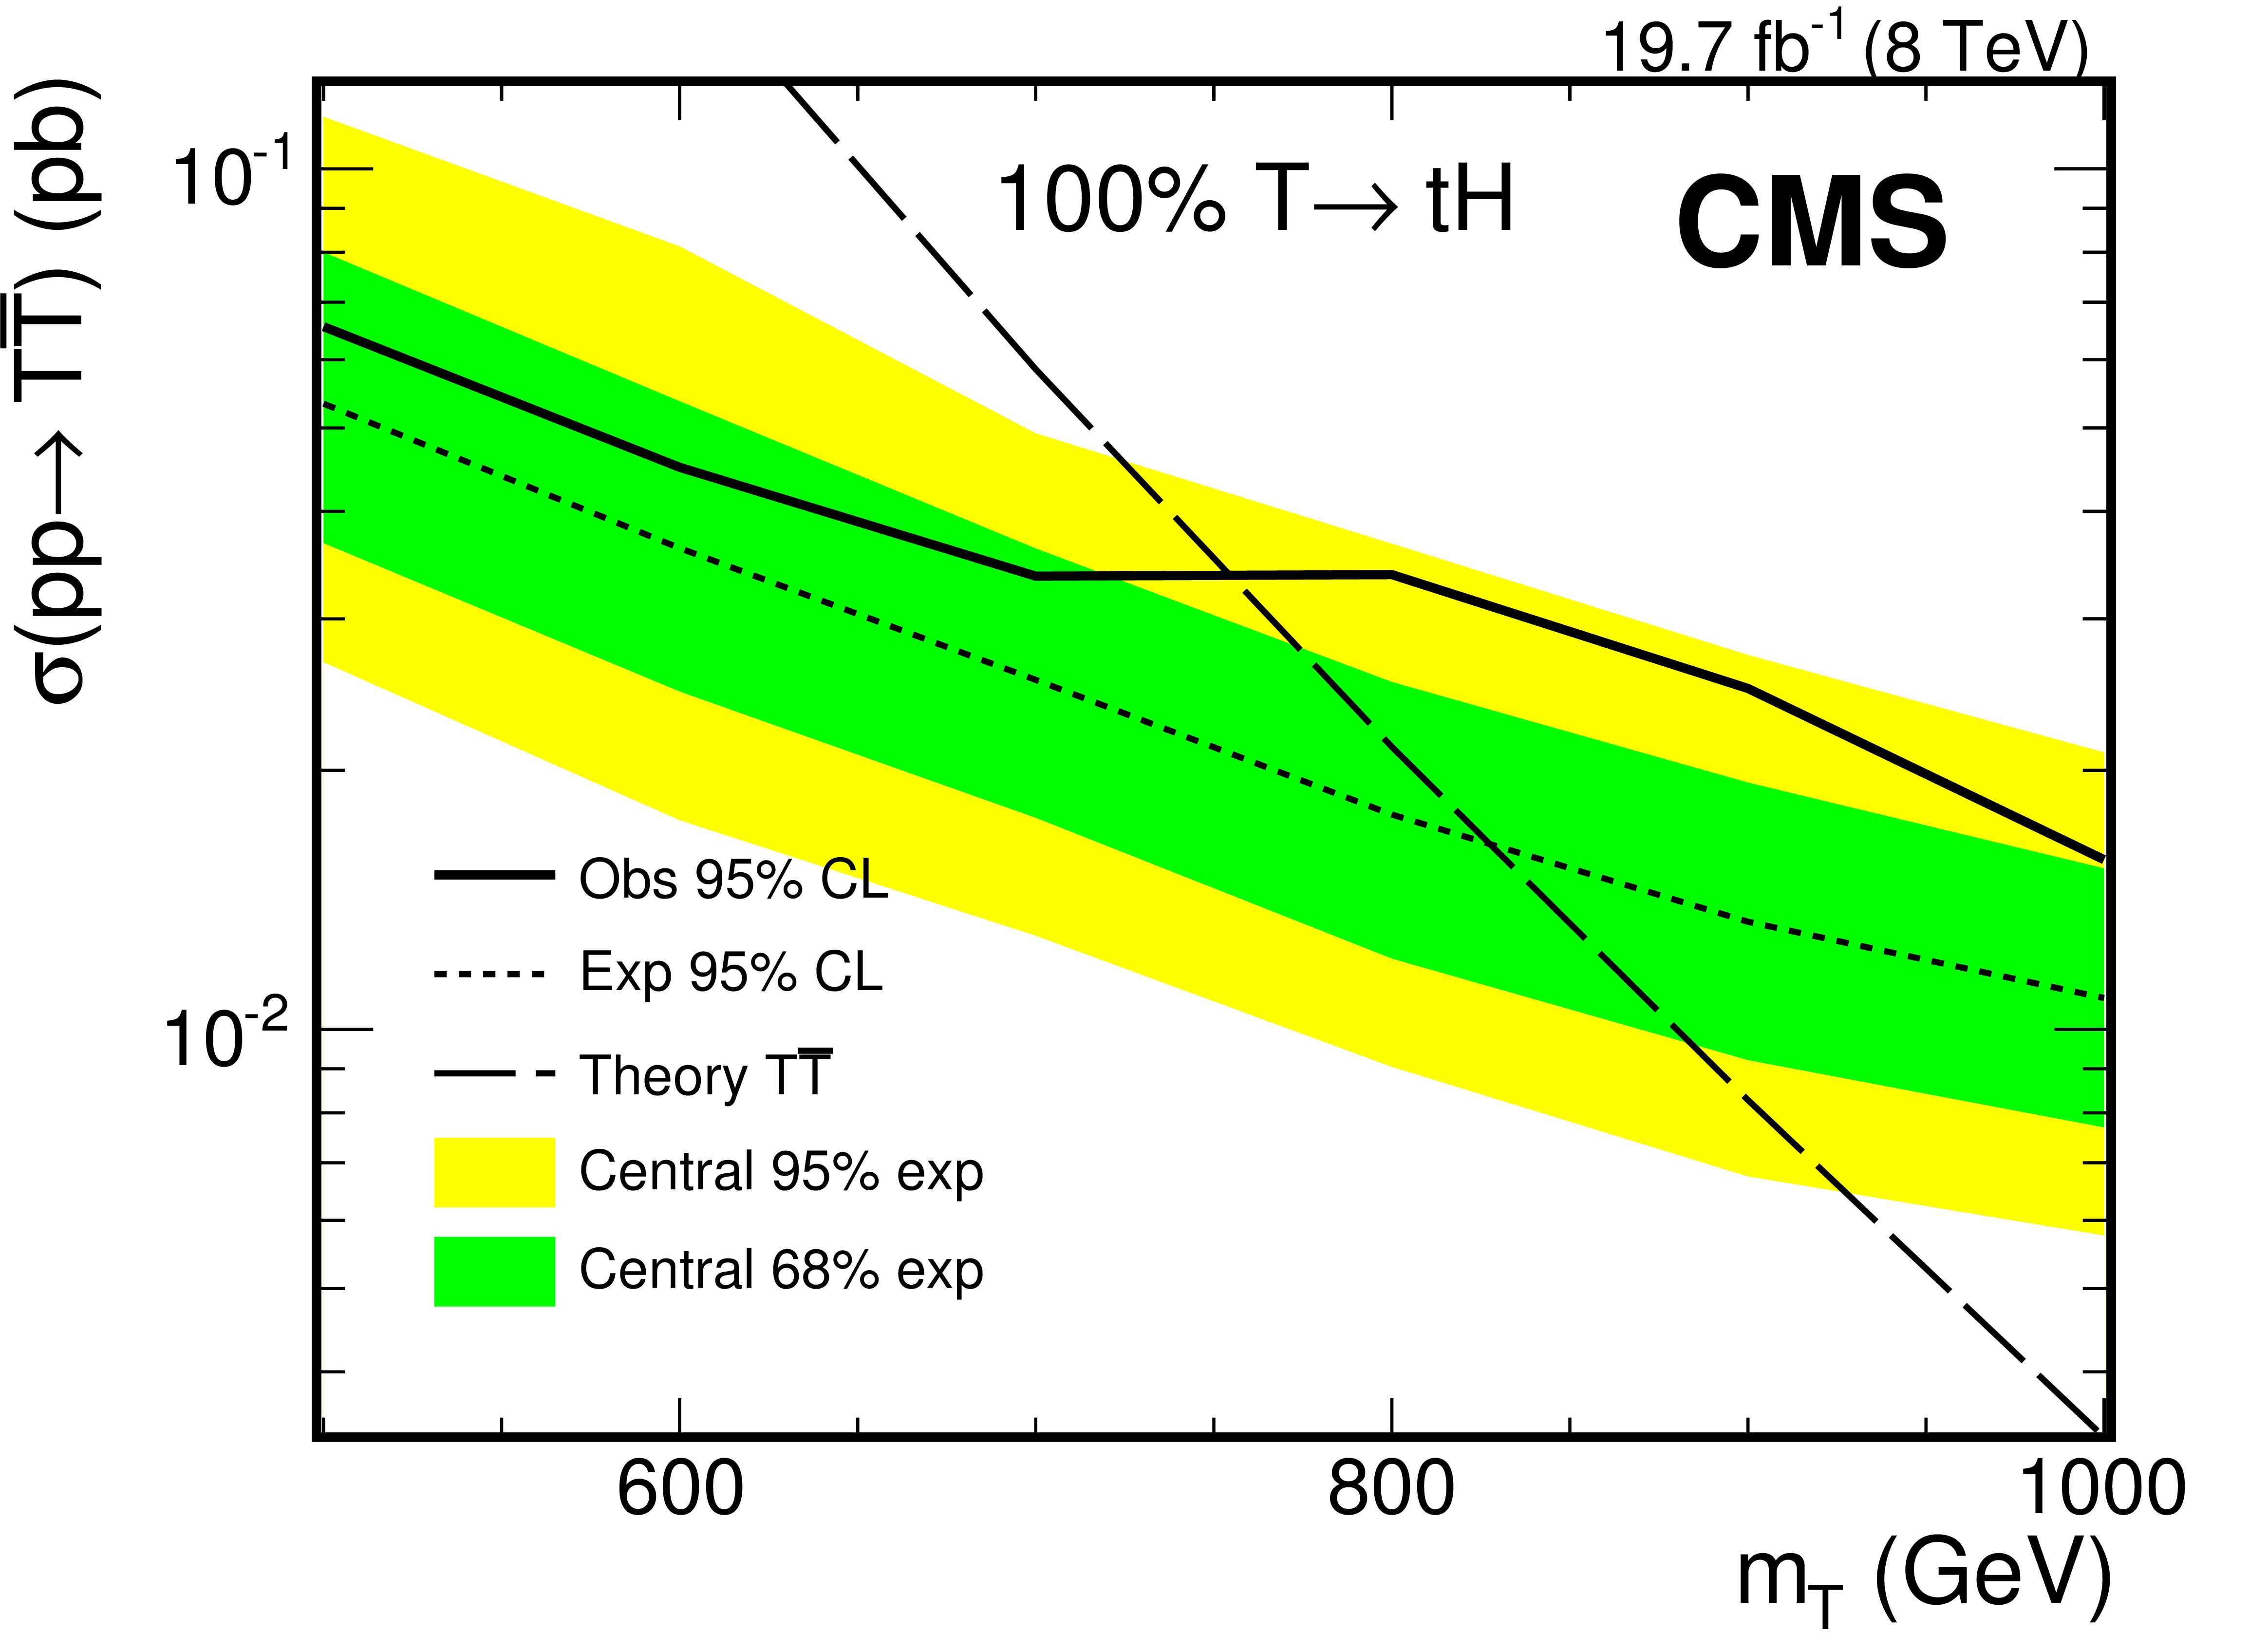
Observed and expected Bayesian upper limits at 95% CL on the $ {\mathrm {T}} $ quark production cross section for exclusive $ {\mathrm {T}} $ quark decays to $ { {\mathrm {t}} {\mathrm {H}} } $, $ { {\mathrm {t}} {\mathrm {Z}}} $, and $ { {\mathrm {b}} {\mathrm {W}}} $. The green (inner) and yellow (outer) bands show the $1 \sigma $ ($2 \sigma $) uncertainty ranges in the expected limits, respectively. The dashed line shows the prediction of the theory. |

png pdf |
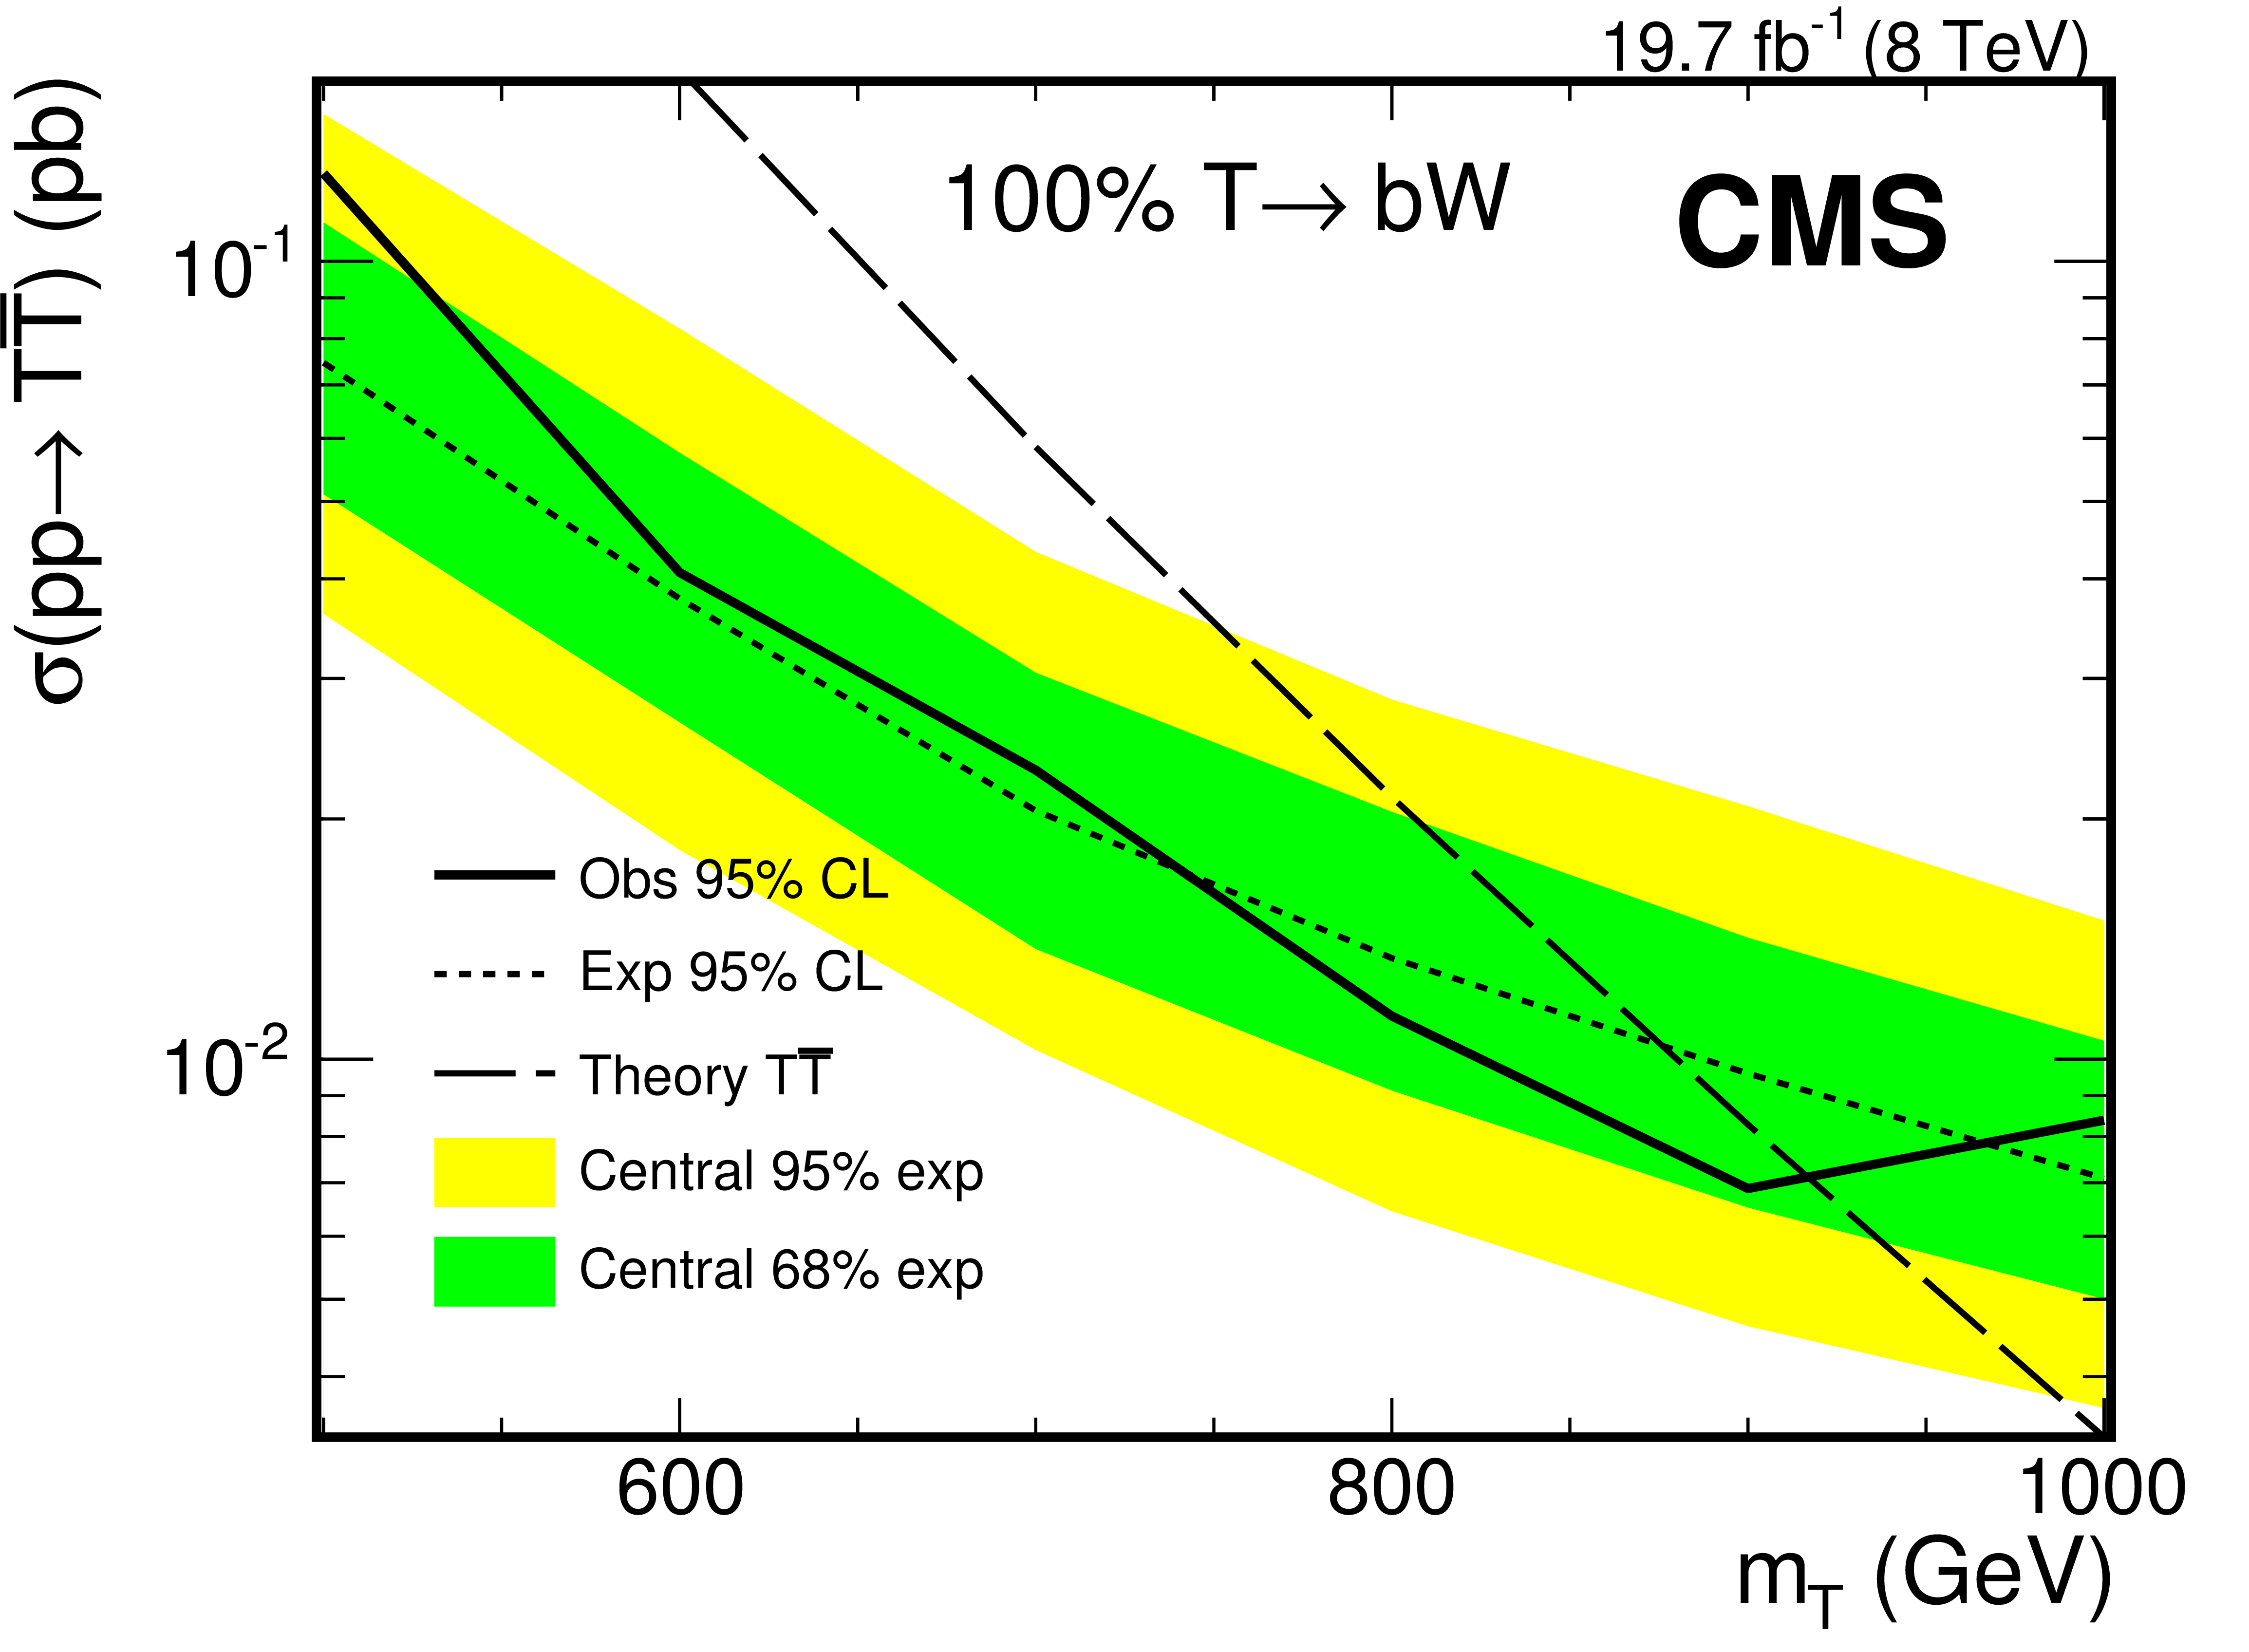
Figure 8-b:
Observed and expected Bayesian upper limits at 95% CL on the $ {\mathrm {T}} $ quark production cross section for exclusive $ {\mathrm {T}} $ quark decays to $ { {\mathrm {t}} {\mathrm {H}} } $, $ { {\mathrm {t}} {\mathrm {Z}}} $, and $ { {\mathrm {b}} {\mathrm {W}}} $. The green (inner) and yellow (outer) bands show the $1 \sigma $ ($2 \sigma $) uncertainty ranges in the expected limits, respectively. The dashed line shows the prediction of the theory. |
png pdf |
Figure 8-c:
Observed and expected Bayesian upper limits at 95% CL on the $ {\mathrm {T}} $ quark production cross section for exclusive $ {\mathrm {T}} $ quark decays to $ { {\mathrm {t}} {\mathrm {H}} } $, $ { {\mathrm {t}} {\mathrm {Z}}} $, and $ { {\mathrm {b}} {\mathrm {W}}} $. The green (inner) and yellow (outer) bands show the $1 \sigma $ ($2 \sigma $) uncertainty ranges in the expected limits, respectively. The dashed line shows the prediction of the theory. |

png pdf |
Figure 9-a:
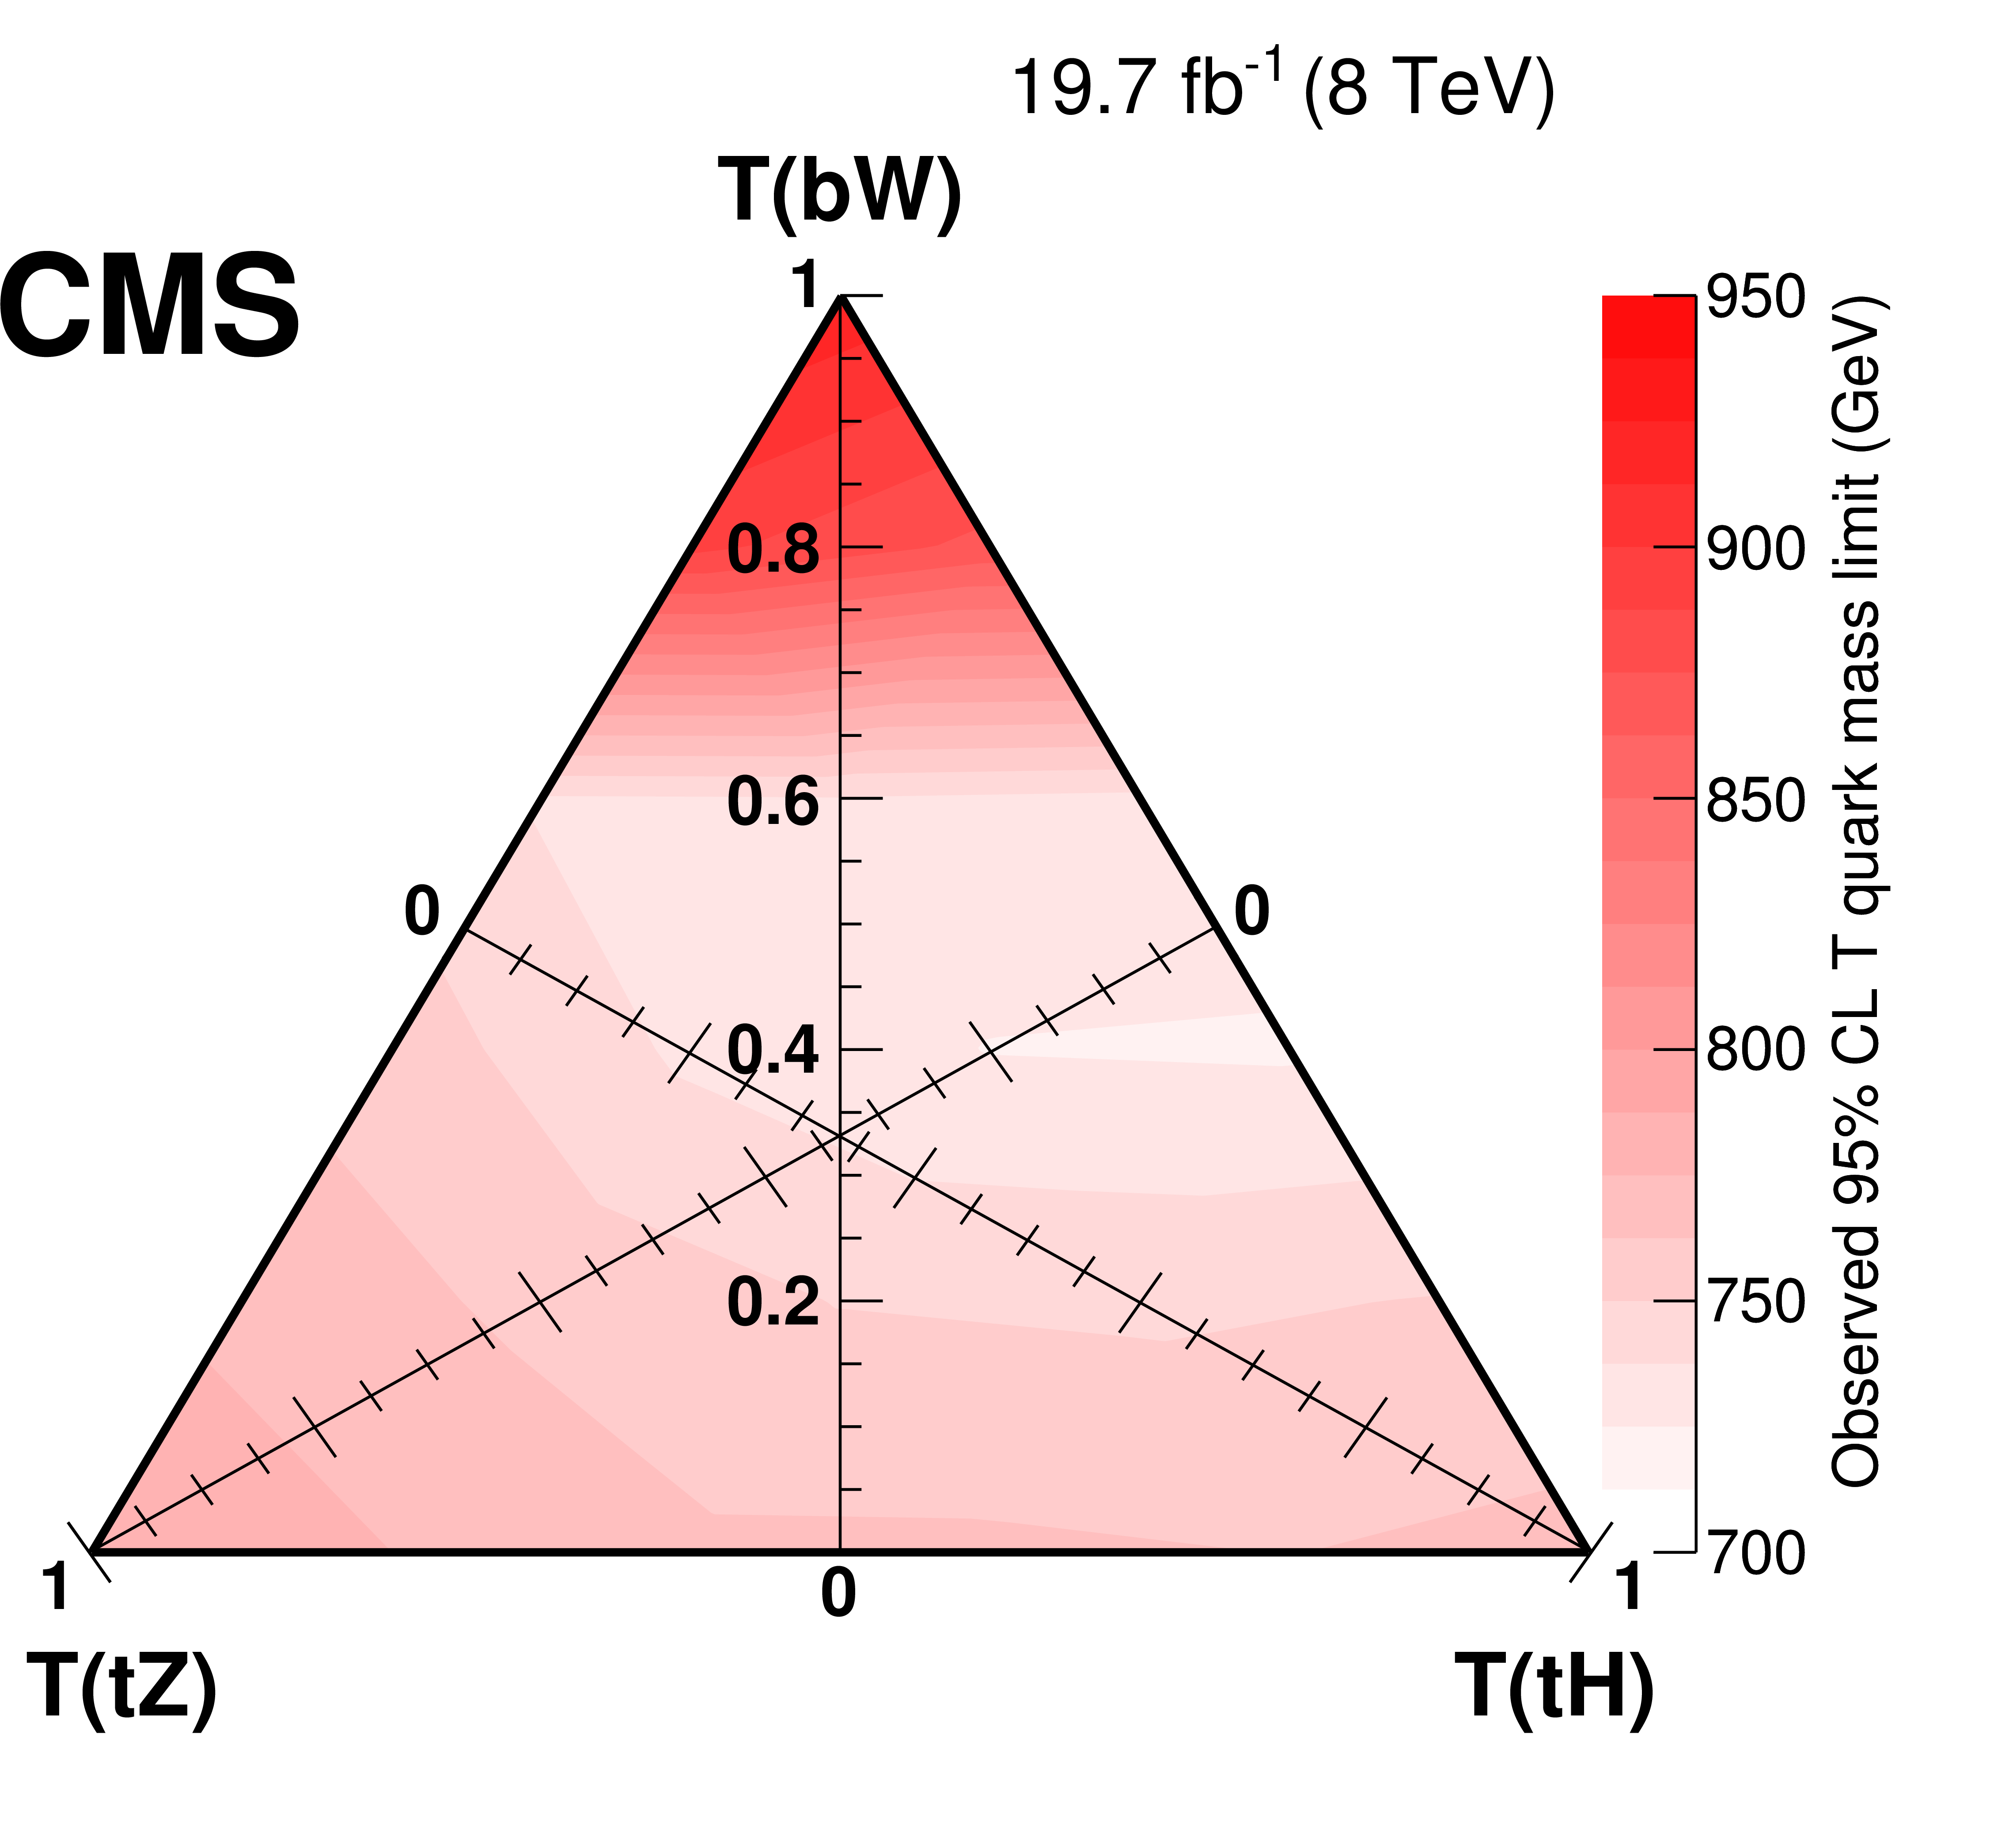
Expected (a) and observed (b) 95% CL limits of the combined analysis, visualized in a triangle representing the branching fractions of the $ {\mathrm {T}} $ quark decay. |
png pdf |
Figure 9-b:
Expected (a) and observed (b) 95% CL limits of the combined analysis, visualized in a triangle representing the branching fractions of the $ {\mathrm {T}} $ quark decay. |
png pdf |
Figure 10-a:
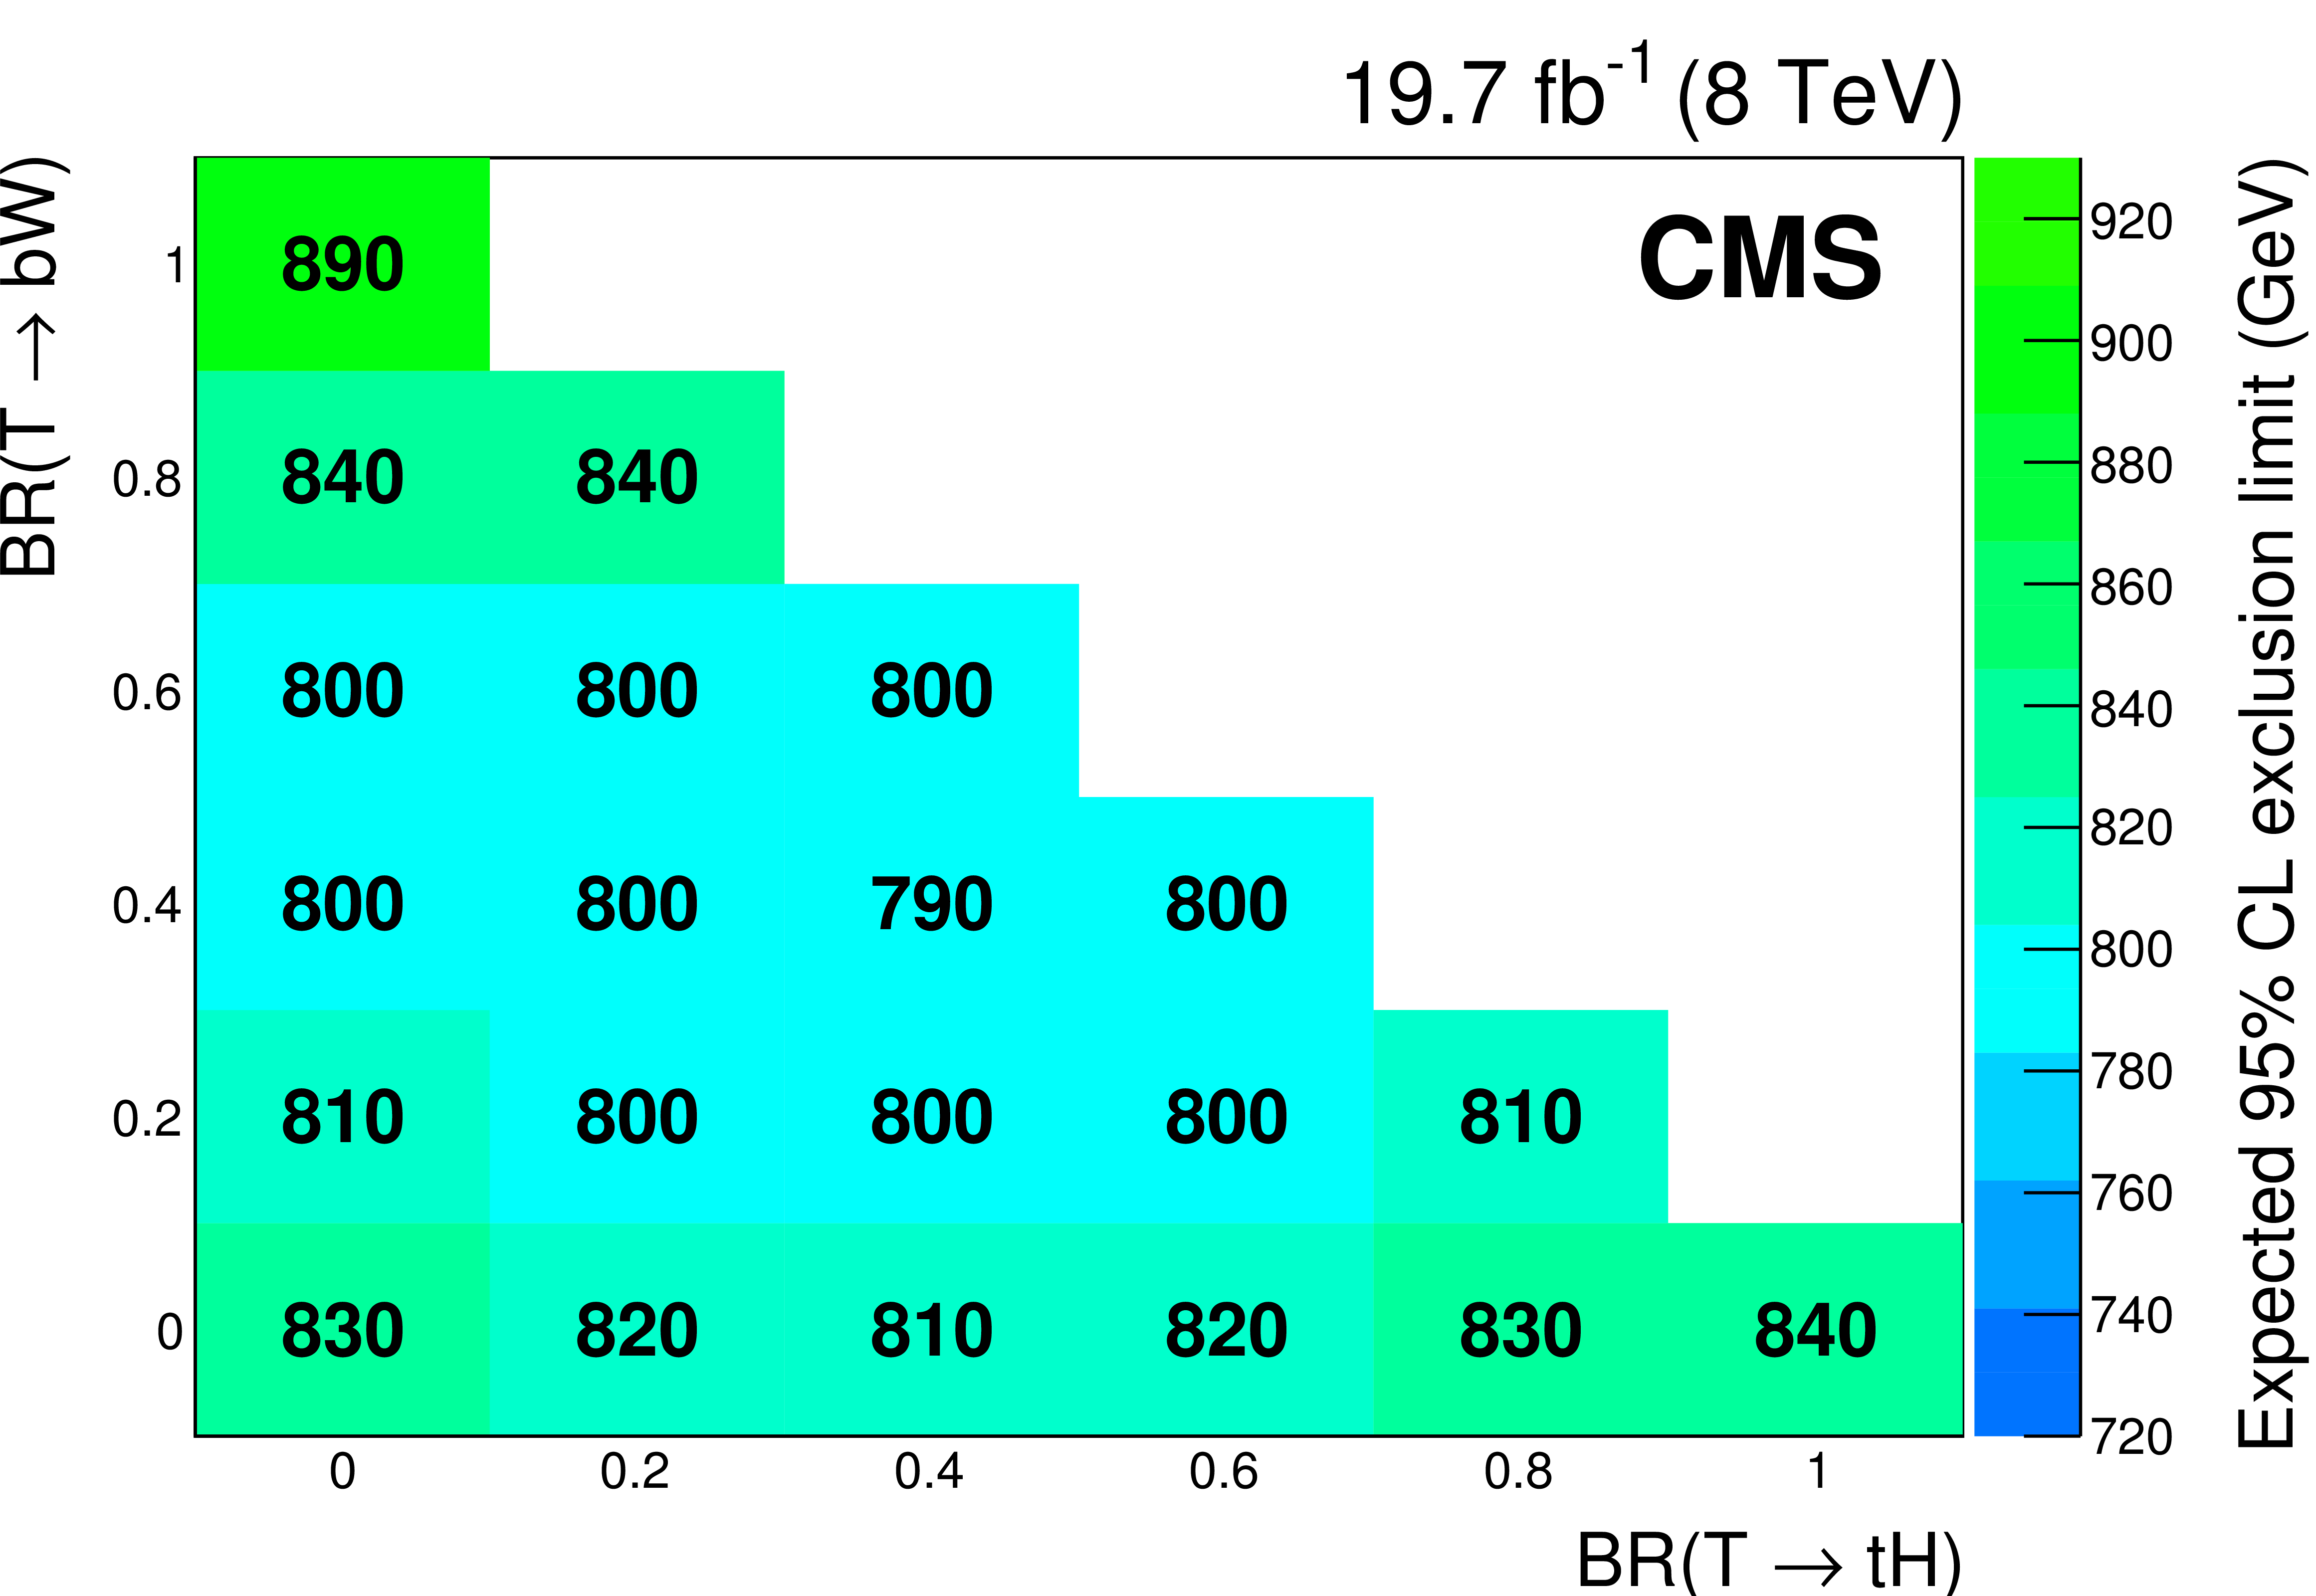
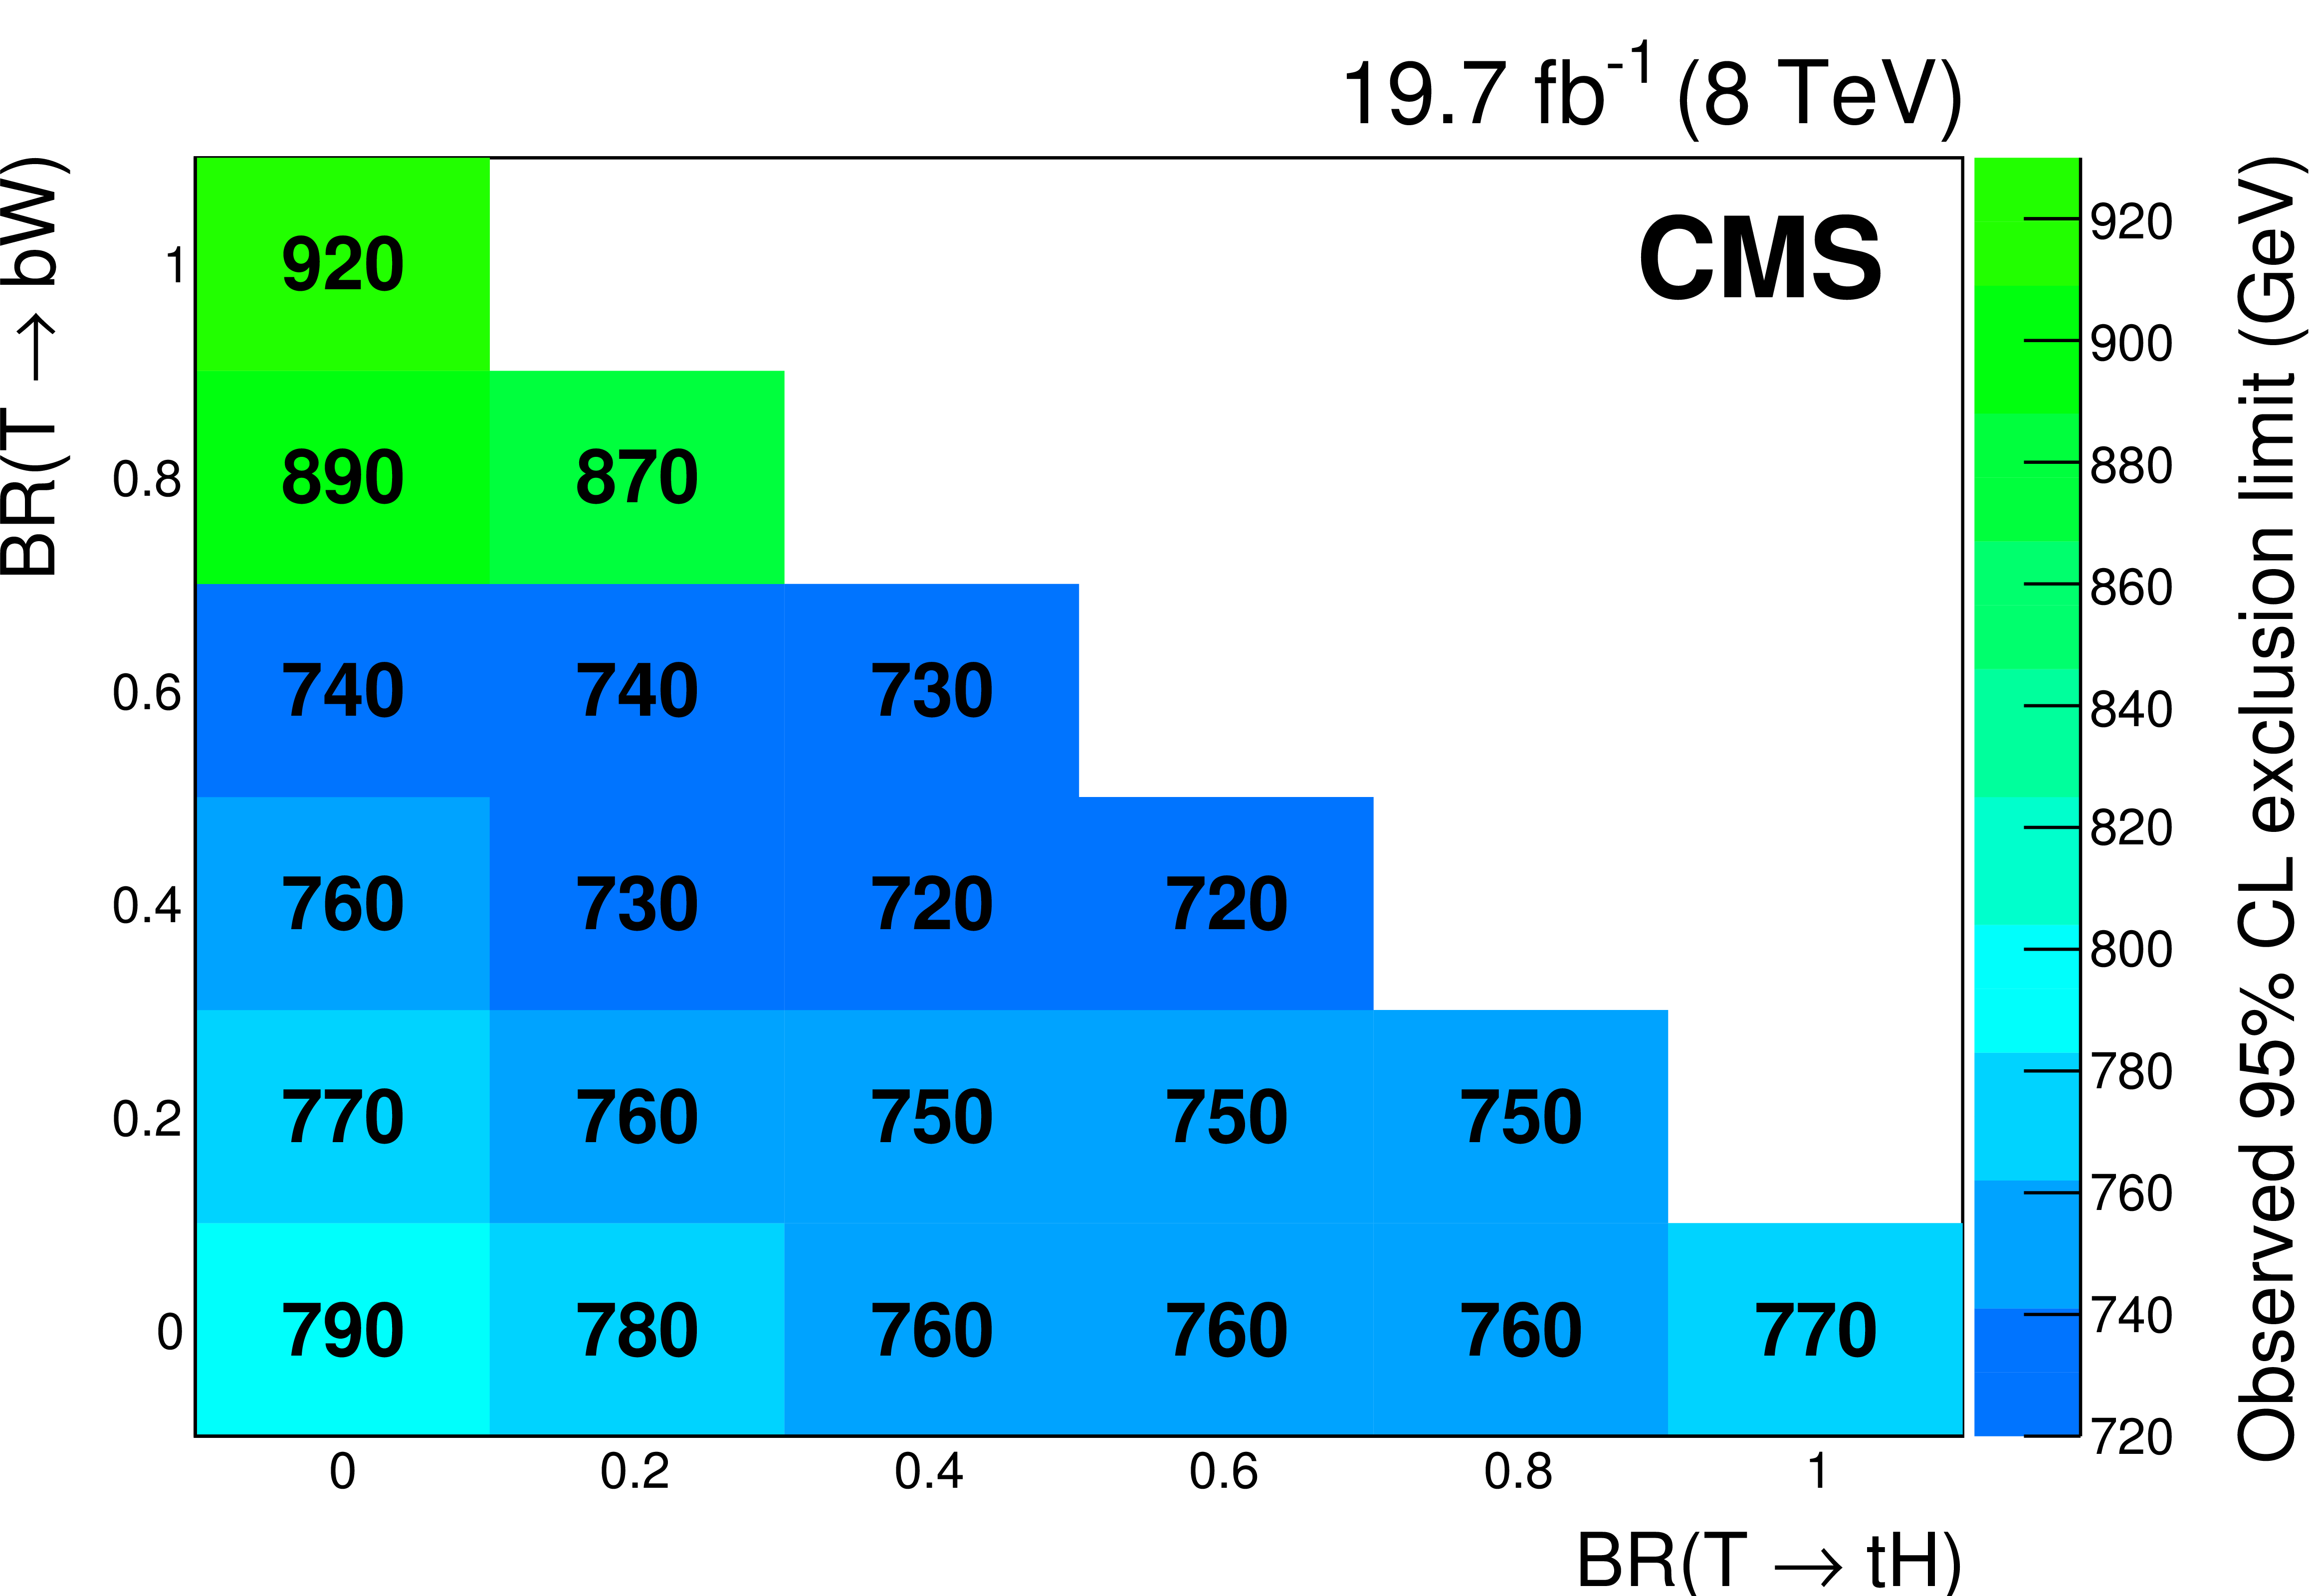
Expected (a) and observed (b) 95% CL limits of the combined analysis, for combinations of branching fractions to $ { {\mathrm {t}} {\mathrm {H}} } $, ${ {\mathrm {t}} {\mathrm {Z}}} $, and $ { {\mathrm {b}} {\mathrm {W}}} $. The branching fraction to $ { {\mathrm {t}} {\mathrm {Z}}} $ is not explicitly reported, since it is given by $\rm 1-\mathcal {B}( { {\mathrm {t}} {\mathrm {H}} } )-\mathcal {B}( { {\mathrm {b}} {\mathrm {W}}} )$. |
png pdf |
Figure 10-b:
Expected (a) and observed (b) 95% CL limits of the combined analysis, for combinations of branching fractions to $ { {\mathrm {t}} {\mathrm {H}} } $, ${ {\mathrm {t}} {\mathrm {Z}}} $, and $ { {\mathrm {b}} {\mathrm {W}}} $. The branching fraction to $ { {\mathrm {t}} {\mathrm {Z}}} $ is not explicitly reported, since it is given by $\rm 1-\mathcal {B}( { {\mathrm {t}} {\mathrm {H}} } )-\mathcal {B}( { {\mathrm {b}} {\mathrm {W}}} )$. |
| Tables | |

png pdf |
Table 1:
The NNLO $ {\mathrm {T}} {\overline {\mathrm {T}}} $ pair production cross section for different values of the $ {\mathrm {T}} $ quark mass. |
png pdf |
Table 2:
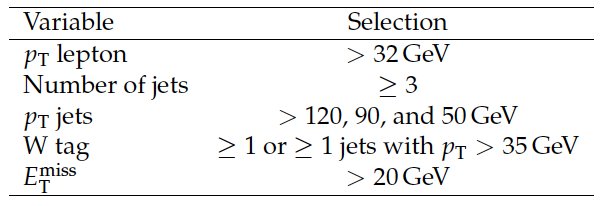
Main selection requirements for the single-lepton analysis. |
png pdf |
Table 3:
Numbers of events predicted for background processes and observed in collision data for the single-lepton analysis. The uncertainties include those in the luminosity, the cross sections and the correction factors on lepton and trigger efficiencies. |
png pdf |
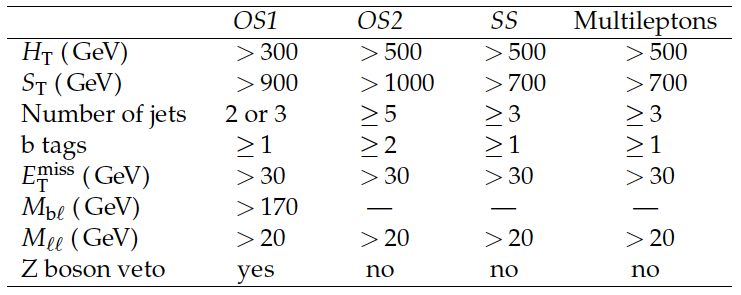
Table 4:
Main selection requirements for the four multilepton channels: the opposite-sign dilepton samples with two or three jets $(\textit {OS1}) $ and with at least five jets ($\textit {OS2}$), the same-sign dilepton sample ($\textit{SS}$), and the multilepton sample. The smallest mass obtained from all the possible combinations of leptons and b jets is indicated by $M_{\rm {b}\ell }$. |
png pdf |
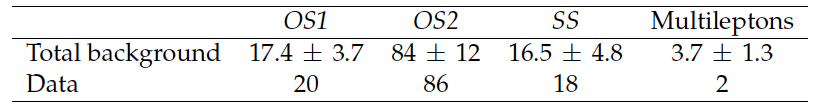
Table 5:
Numbers of events selected in data and expected for the backgrounds. Shown are the opposite-sign dilepton samples with two or three jets ($\textit {OS1}$) and with at least 5 jets ($\textit {OS2}$), the same-sign dilepton sample ($\textit{SS}$), and the multilepton sample. The background sources not contributing to the channel are indicated by a dash (``--''). The uncertainties include statistical, normalization, and luminosity uncertainties. |
png pdf |
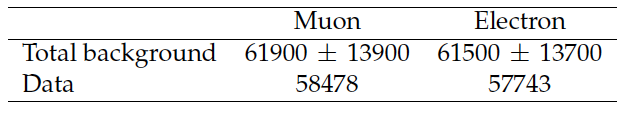
Table 6:
Numbers of observed and expected background events after the event selection. The uncertainties in the predicted numbers of events include both the statistical and systematic uncertainties. |
png pdf |
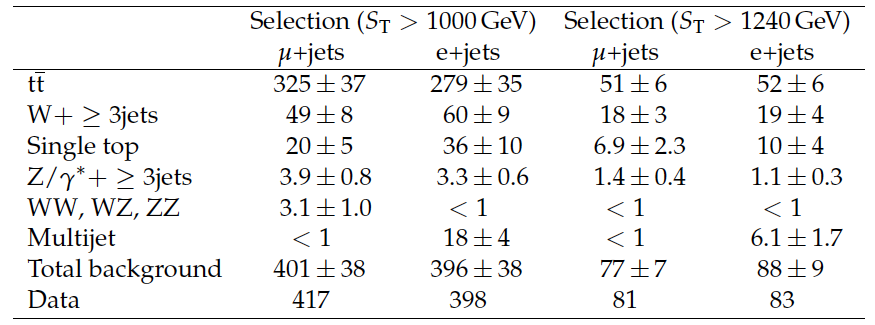
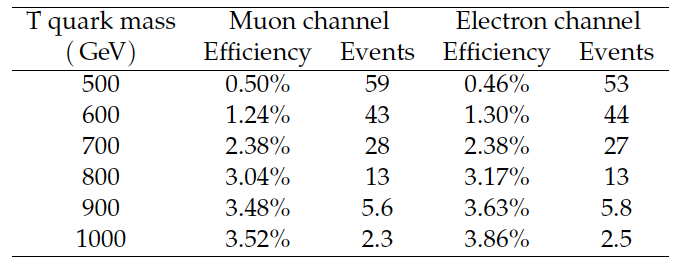
Table 7:
Selection efficiencies and numbers of expected signal events for the selection $ {S_{\mathrm {T}}} >$ 1240 GeV, for the two channels of the $ {\mathrm {T}} \to { {\mathrm {b}} {\mathrm {W}}} $ search with single leptons. Different $ {\mathrm {T}} $ quark mass hypotheses are considered and a 100% branching fraction to $ { {\mathrm {b}} {\mathrm {W}}} $ is assumed. |
png pdf |
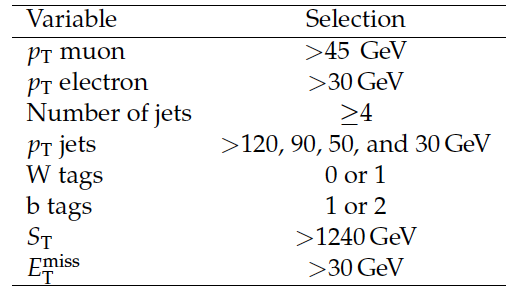
Table 8:
Main selection requirements for the $ {\mathrm {T}} \to { {\mathrm {b}} {\mathrm {W}}} $ search with single leptons. |
png pdf |
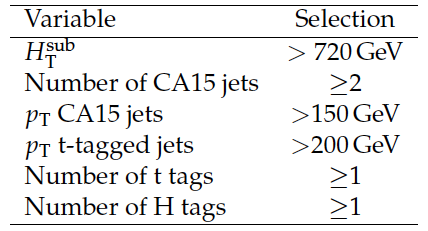
Table 9:
Main selection requirements for the all-hadronic search for $ {\mathrm {T}} \to { {\mathrm {t}} {\mathrm {H}} } $. |
png pdf |
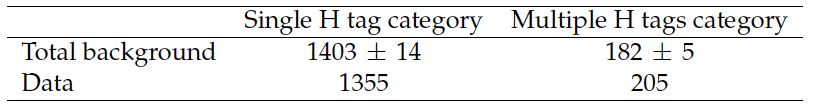
Table 10:
Predicted numbers of total background events and observed events for the two event categories with one and with multiple H tags, for the all-hadronic search for $ {\mathrm {T}} \to { {\mathrm {t}} {\mathrm {H}} } $. The quoted uncertainties are statistical only. |

png pdf |
Table 11:
Main selection requirements for the all-hadronic search for $ {\mathrm {T}} \to { {\mathrm {b}} {\mathrm {W}}} $. |
png pdf |
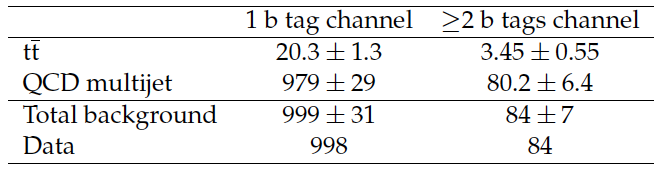
Table 12:
Summary of expected and observed background yields for the two channels of the $ {\mathrm {T}} \to { {\mathrm {b}} {\mathrm {W}}} $ search in the all-hadronic final state. |

png pdf |
Table 13:
Selection efficiencies and numbers of expected signal events, for the two channels of the $ {\mathrm {T}} \to { {\mathrm {b}} {\mathrm {W}}} $ search in the hadronic final state. Different $ {\mathrm {T}} $ quark mass hypotheses are considered and a 100% branching fraction to $ { {\mathrm {b}} {\mathrm {W}}} $ is assumed. |
png pdf |
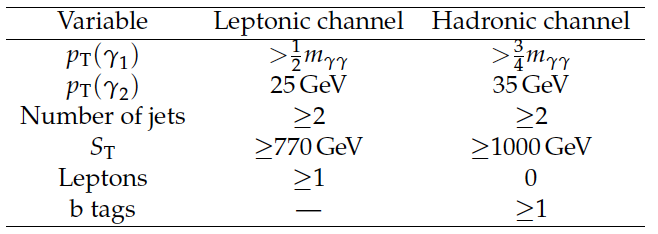
Table 14:
Final selection criteria for hadronic and leptonic channels of the search for $ {\mathrm {T}} \to { {\mathrm {t}} {\mathrm {H}} } $ with $ {\mathrm {H}} \to {\gamma } {\gamma }$. |
png pdf |
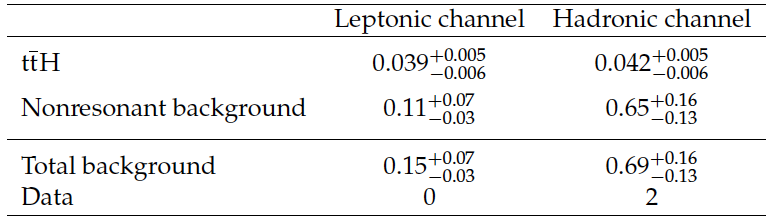
Table 15:
Expected yields for $ {\mathrm {t}\overline {\mathrm {t}}} {\mathrm {H}} $ and nonresonant background (from the fit to data) and the numbers of observed events in data after full event selection for the two channels of the $ {\mathrm {T}} \to { {\mathrm {t}} {\mathrm {H}} } $ search in the final state with photons. All the yields are computed in a window of 1 full width at half maximum i.e. , 125 $\pm$ 1.5 GeV. |
png pdf |
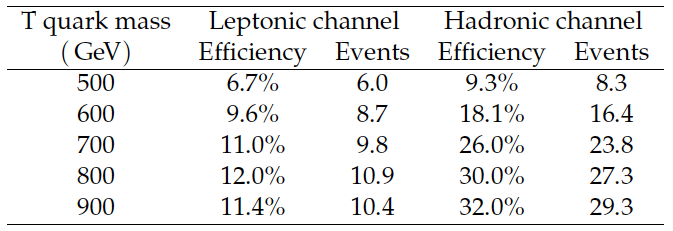
Table 16:
Selection efficiencies and numbers of expected signal events, for the two channels of the $ {\mathrm {T}} \to { {\mathrm {t}} {\mathrm {H}} } $ search in the final state with photons. Different $ {\mathrm {T}} $ quark mass hypotheses are considered and a 100% branching fraction to $ { {\mathrm {t}} {\mathrm {H}} } $ is assumed. |
png pdf |
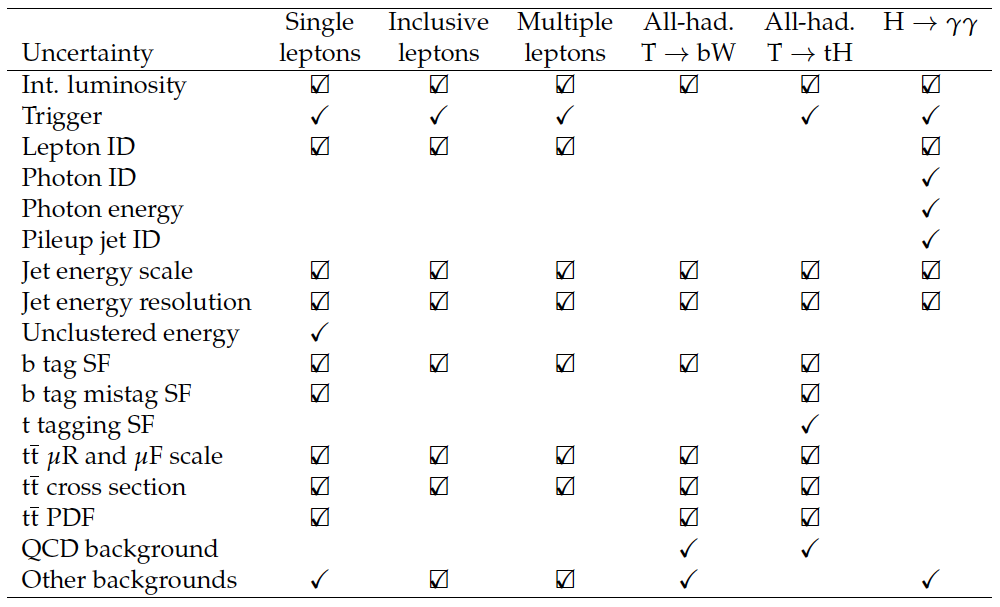
Table 17:
Correlated and uncorrelated systematic uncertainties. The "check" symbol indicates that the uncertainty has been taken into account in the analysis, but it is not correlated with any of the other analyses. The "square" symbol indicates that the uncertainty has been taken into account and that it is correlated with the other analysis that have a "square" sign as well. A missing symbol indicates that this uncertainty is not relevant for this analysis channel. |

png pdf |
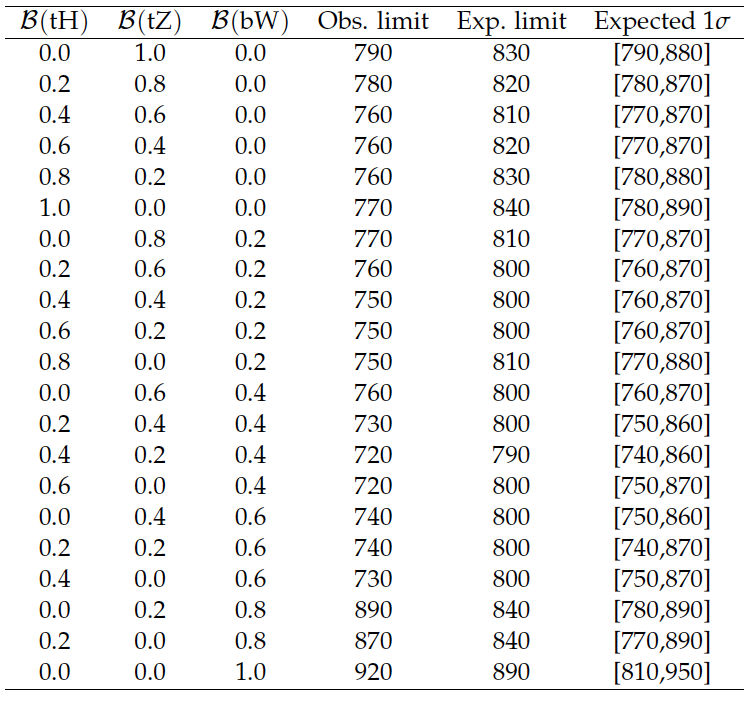
Table 18:
Branching fractions (first three columns) and the observed and expected upper limits on the $ {\mathrm {T}} $ quark production cross section at 95% CL for different values of the $ {\mathrm {T}} $ quark mass. The expected limits are quoted with their corresponding uncertainties, for different branching fractions hypotheses. The cross section limits are given in units of pb. |
png pdf |
Table 19:
Lower limits on the mass of the $ {\mathrm {T}} $ quark at 95% CL, for different combinations of $ {\mathrm {T}} $ quark branching fractions. The $1\sigma $ uncertainty range on the expected limits are given as well. |
| Summary |
| A search for pair production of vector-like T quarks of charge 2/3 has been performed. In most models the hypothetical T quark has three decay modes:$\mathrm{ T \to tH }$, $ \mathrm{ T \to tZ } $, and $ \mathrm{ T \to bW } $. The following five distinct topologies have been investigated: inclusive lepton events covering all possible decay modes, single-lepton events optimized to find $ \mathrm{ T \to bW } $ decays, all-hadronic events optimized either for $ \\mathrm{ T \to tH } $ or $ \mathrm{ T \to bW } $ decays, and events containing a Higgs boson decaying to a pair of photons. Data and SM background expectations are found to be in agreement. Upper limits on the production cross sections of vector-like T quarks are set. The expected 95% CL lower mass limits are between 790 and 890 GeV depending on the branching fraction of the T quark. For a branching fraction of $\mathcal{B}(tH)=$ 100% an expected (observed) limit of 840 (770) GeV is found. For $\mathcal{B}(tZ)=$ 100% the expected (observed) limit is 830 (790) GeV and for $\mathcal{B}(bW)=$ 100% the limit is 890 (920) GeV. These are among the strongest limits on vector-like T quarks obtained to date. |
|
|
Compact Muon Solenoid LHC, CERN |
|

|

|

|

|

|