

Compact Muon Solenoid
LHC, CERN
| CMS-BPH-12-006 ; CERN-PH-EP-2015-007 | ||
| Measurements of the $\Upsilon(1\mathrm{S})$, $\Upsilon(2\mathrm{S})$, and $\Upsilon(3\mathrm{S})$ differential cross sections in pp collisions at $\sqrt{s}$ = 7 TeV | ||
| CMS Collaboration | ||
| 30 January 2015 | ||
| Phys. Lett. B 749 (2015) 14 | ||
| Abstract: Differential cross sections as a function of transverse momentum $p_\mathrm{T}$ are presented for the production of $\Upsilon(n\mathrm{S})$ ($n$ = 1, 2, 3) states decaying into a pair of muons. Data corresponding to an integrated luminosity of 4.9 fb$^{-1}$ in pp collisions at $\sqrt{s}$ = 7 TeV were collected with the CMS detector at the LHC. The analysis selects events with dimuon absolute rapidity $y$ lower than 1.2 and dimuon transverse momentum in the range of $p_\mathrm{T} $ between 10 and 100 GeV. The measurements show a transition from an exponential to a power-law behavior at $p_\mathrm{T} \approx 20$ GeV for the three $\Upsilon$ states. Above that transition, the $\Upsilon(3\mathrm{S})$ spectrum is significantly harder than that of the $\Upsilon(1\mathrm{S})$ and $\Upsilon(2\mathrm{S})$. The ratios of the $\Upsilon(3\mathrm{S})$ and $\Upsilon(2\mathrm{S})$ differential cross sections to the $\Upsilon(1\mathrm{S})$ cross section show a rise as $p_\mathrm{T}$ increases at low $p_\mathrm{T}$, then become flatter at higher $p_\mathrm{T}$. | ||
| Links: e-print arXiv:1501.07750 [hep-ex] (PDF) ; CDS record ; inSPIRE record ; Public twiki page ; HepData record ; CADI line (restricted) ; | ||
| Figures | |
png pdf |
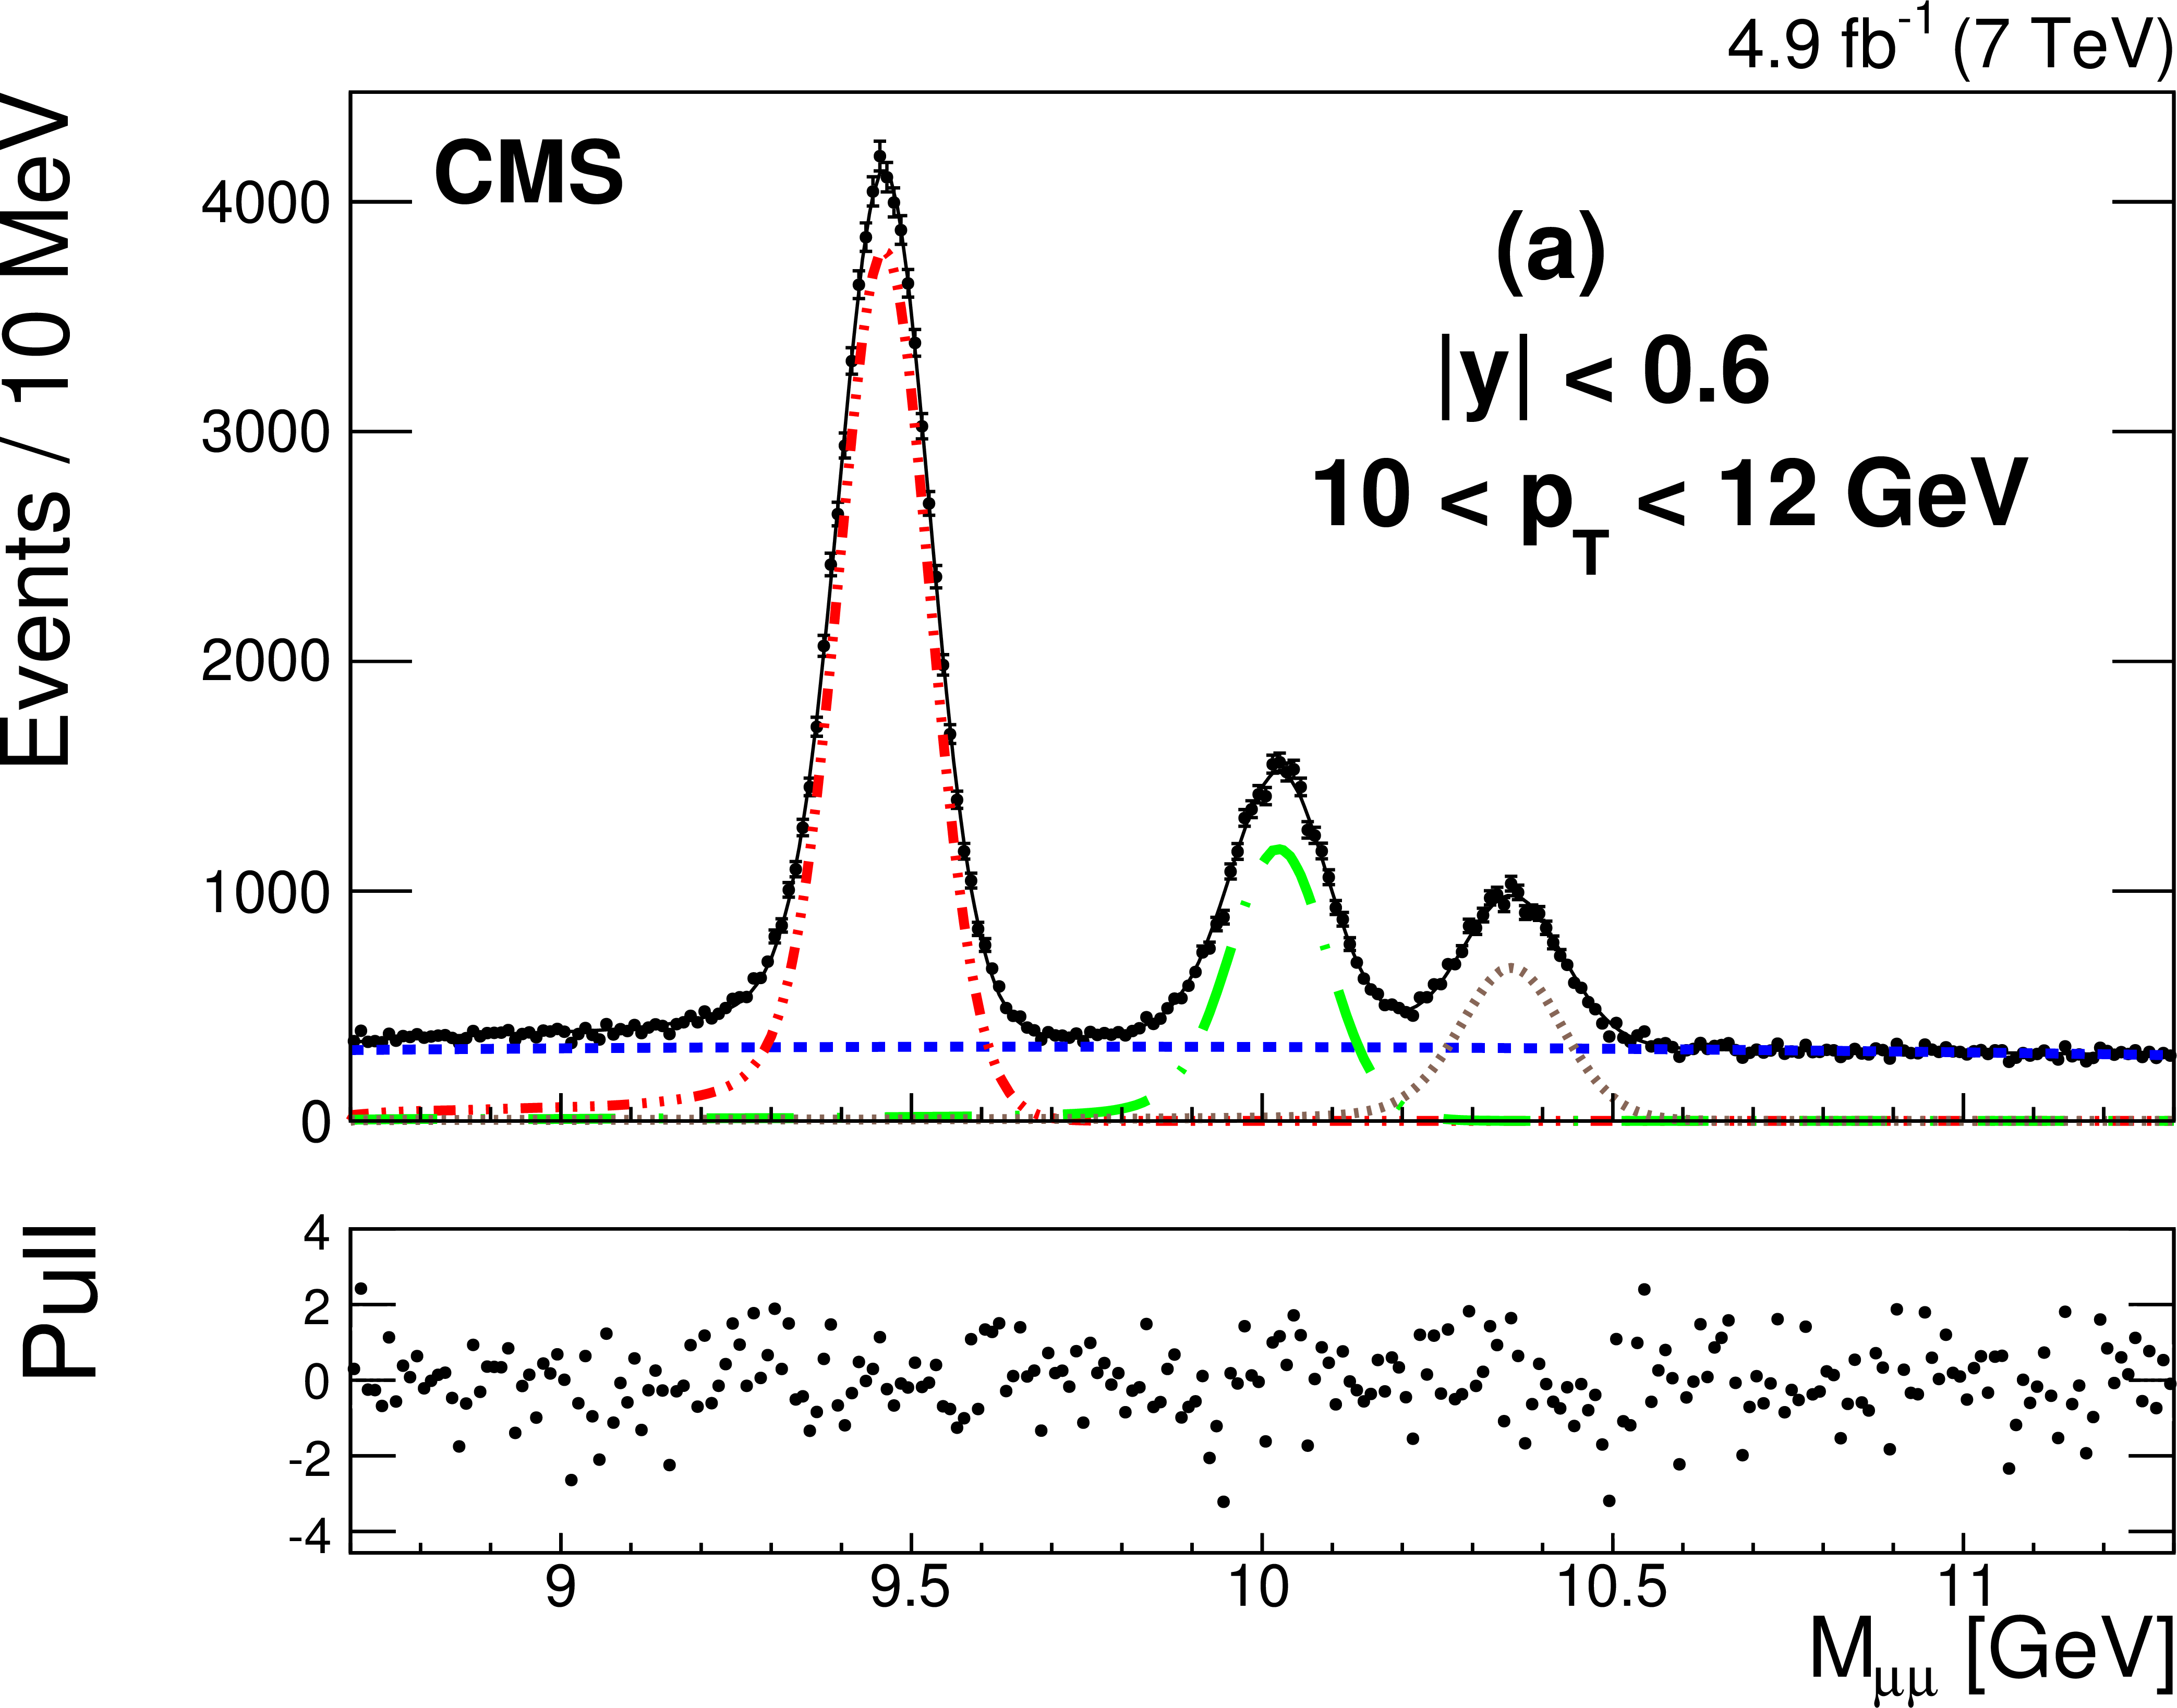
Figure 1-a:
Results of the fits to the dimuon invariant mass distribution for events in two bins: (a): $ {| y | }< 0.6$, $10 < {p_{\mathrm {T}}} < 12$ GeV and (b): $0.6 < {| y | }< 1.2$, $50 < {p_{\mathrm {T}}} < 55$ GeV. The solid line is the result of the full fit. The dash-dotted line is the $ {\Upsilon \mathrm {(1S)}}$ signal fit, the long-dashed line is the $ {\Upsilon \mathrm {(2S)}}$ signal fit, and the dotted line is the $ {\Upsilon \mathrm {(3S)}}$ signal fit. The short-dashed line is the background contribution. The lower plots show the pull for each mass bin. |
png pdf |
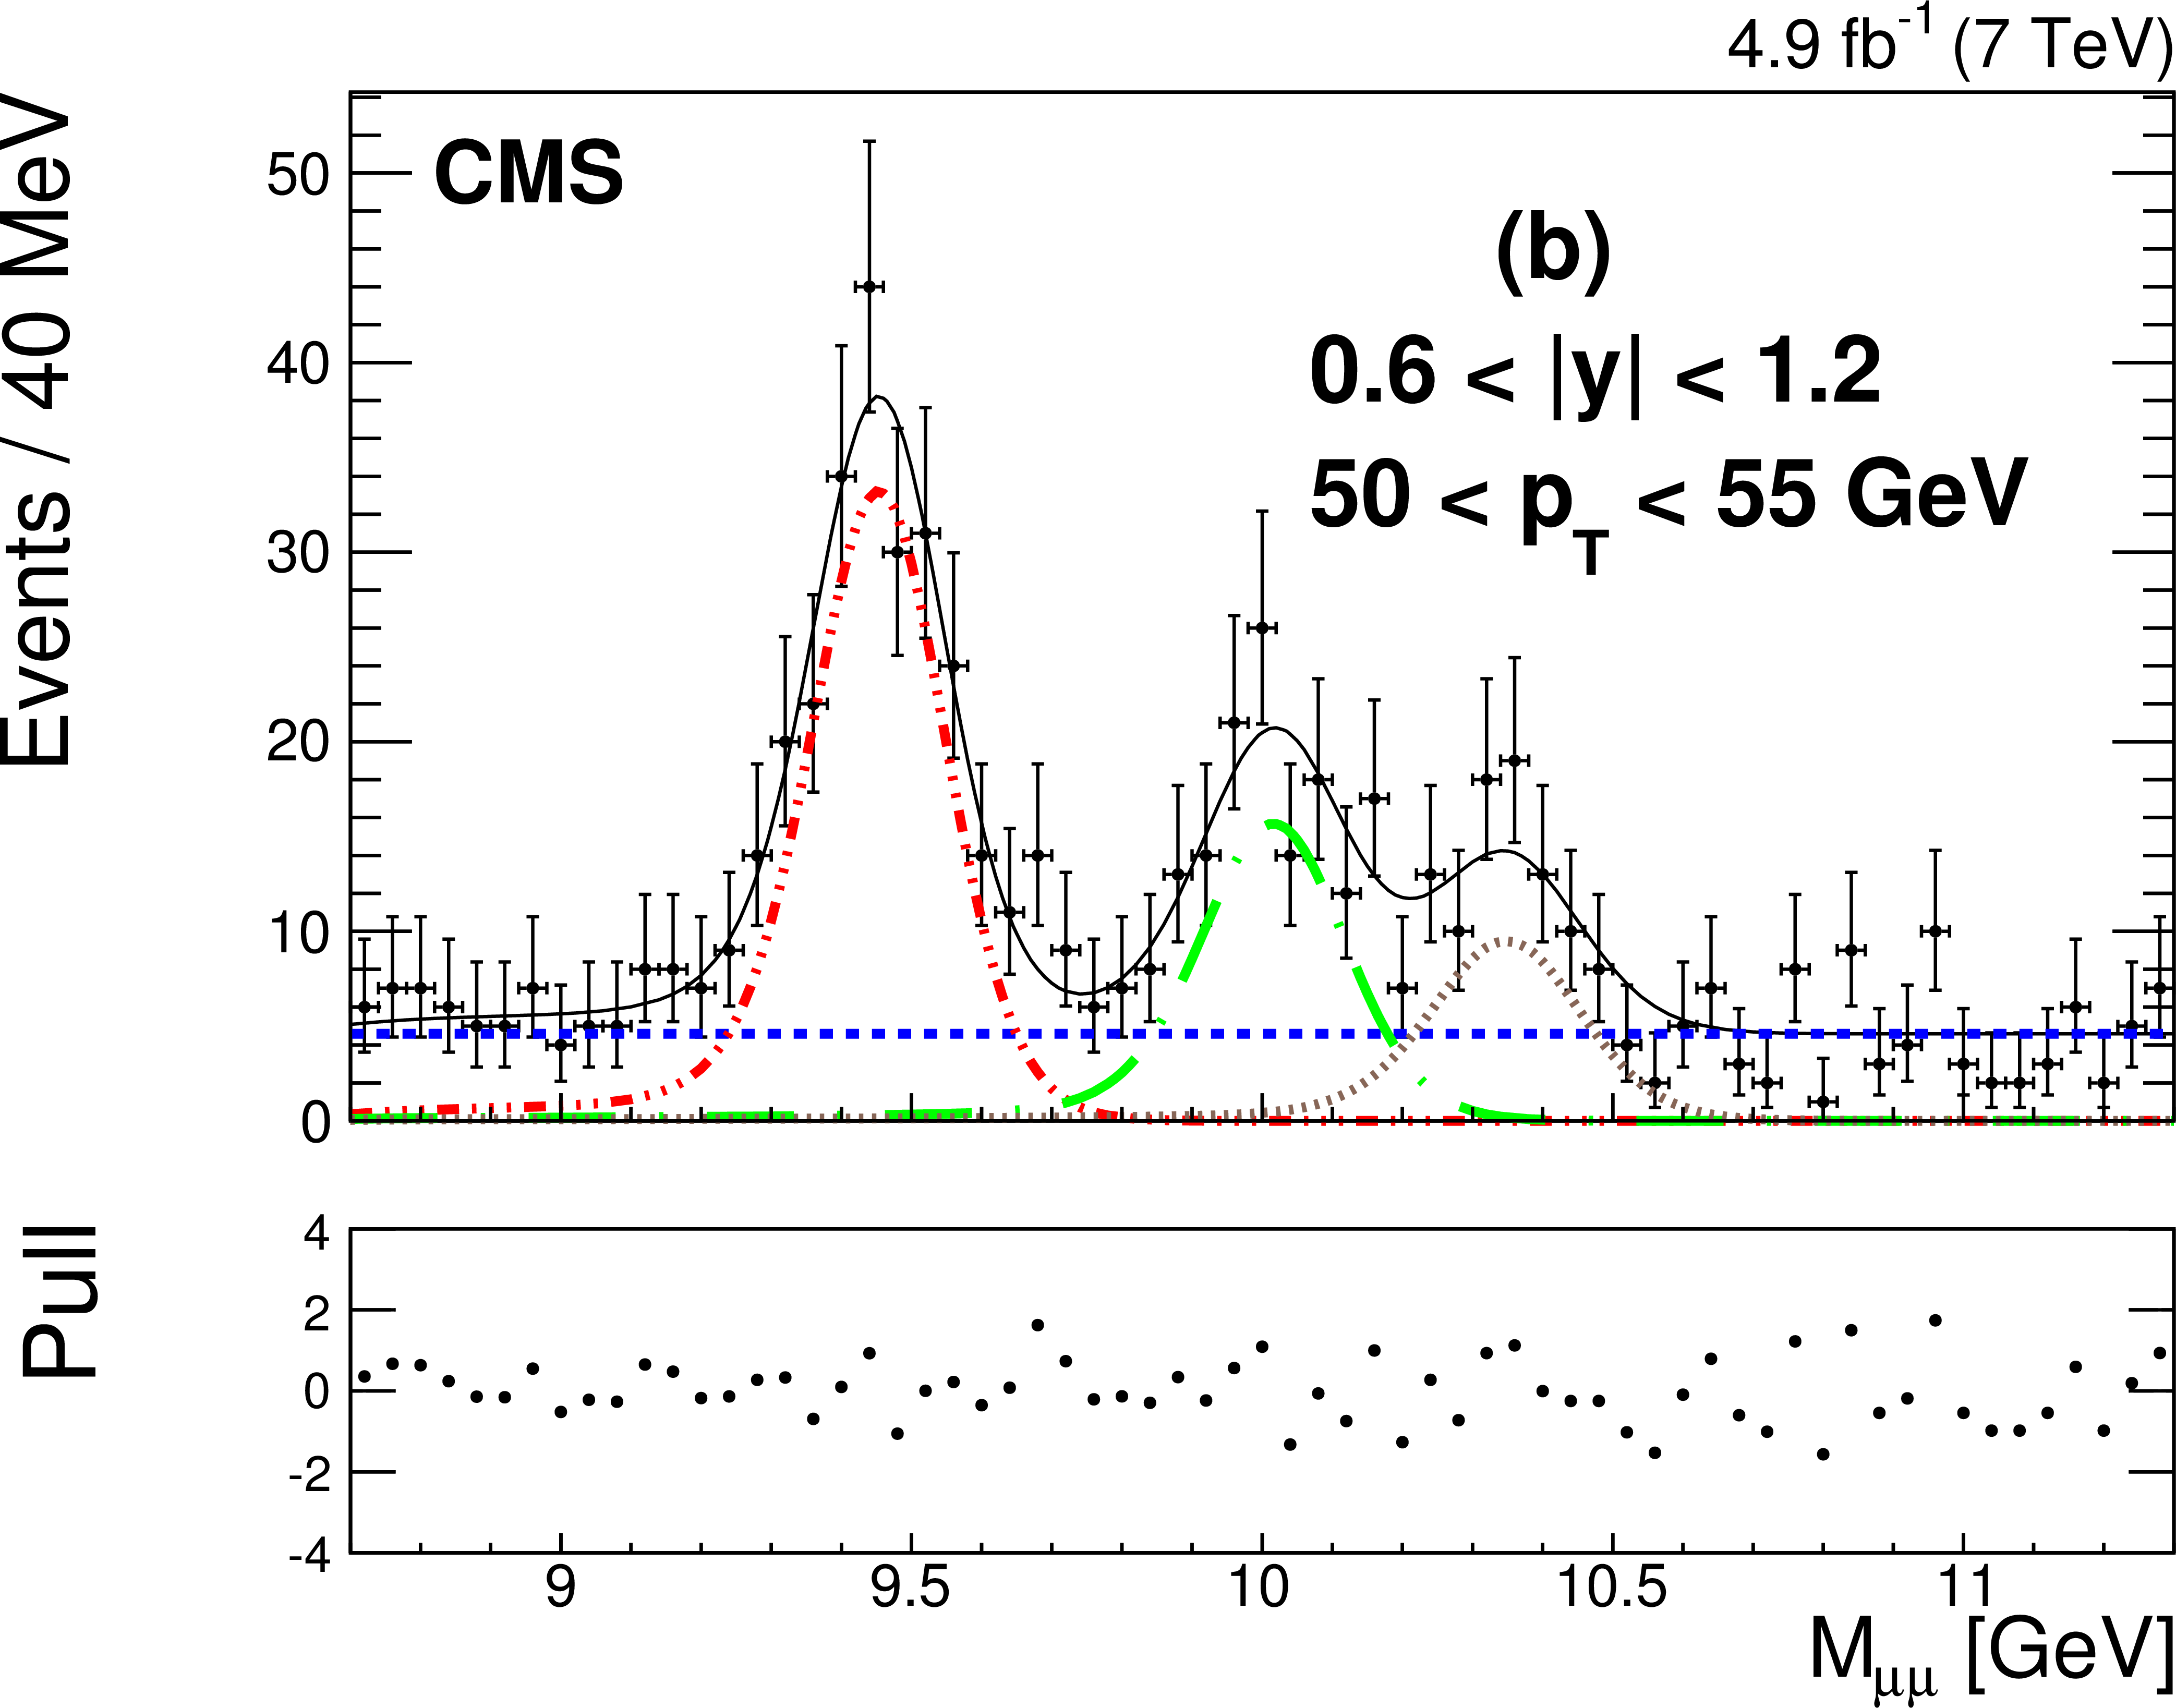
Figure 1-b:
Results of the fits to the dimuon invariant mass distribution for events in two bins: (a): $ {| y | }< 0.6$, $10 < {p_{\mathrm {T}}} < 12$ GeV and (b): $0.6 < {| y | }< 1.2$, $50 < {p_{\mathrm {T}}} < 55$ GeV. The solid line is the result of the full fit. The dash-dotted line is the $ {\Upsilon \mathrm {(1S)}}$ signal fit, the long-dashed line is the $ {\Upsilon \mathrm {(2S)}}$ signal fit, and the dotted line is the $ {\Upsilon \mathrm {(3S)}}$ signal fit. The short-dashed line is the background contribution. The lower plots show the pull for each mass bin. |
png pdf |
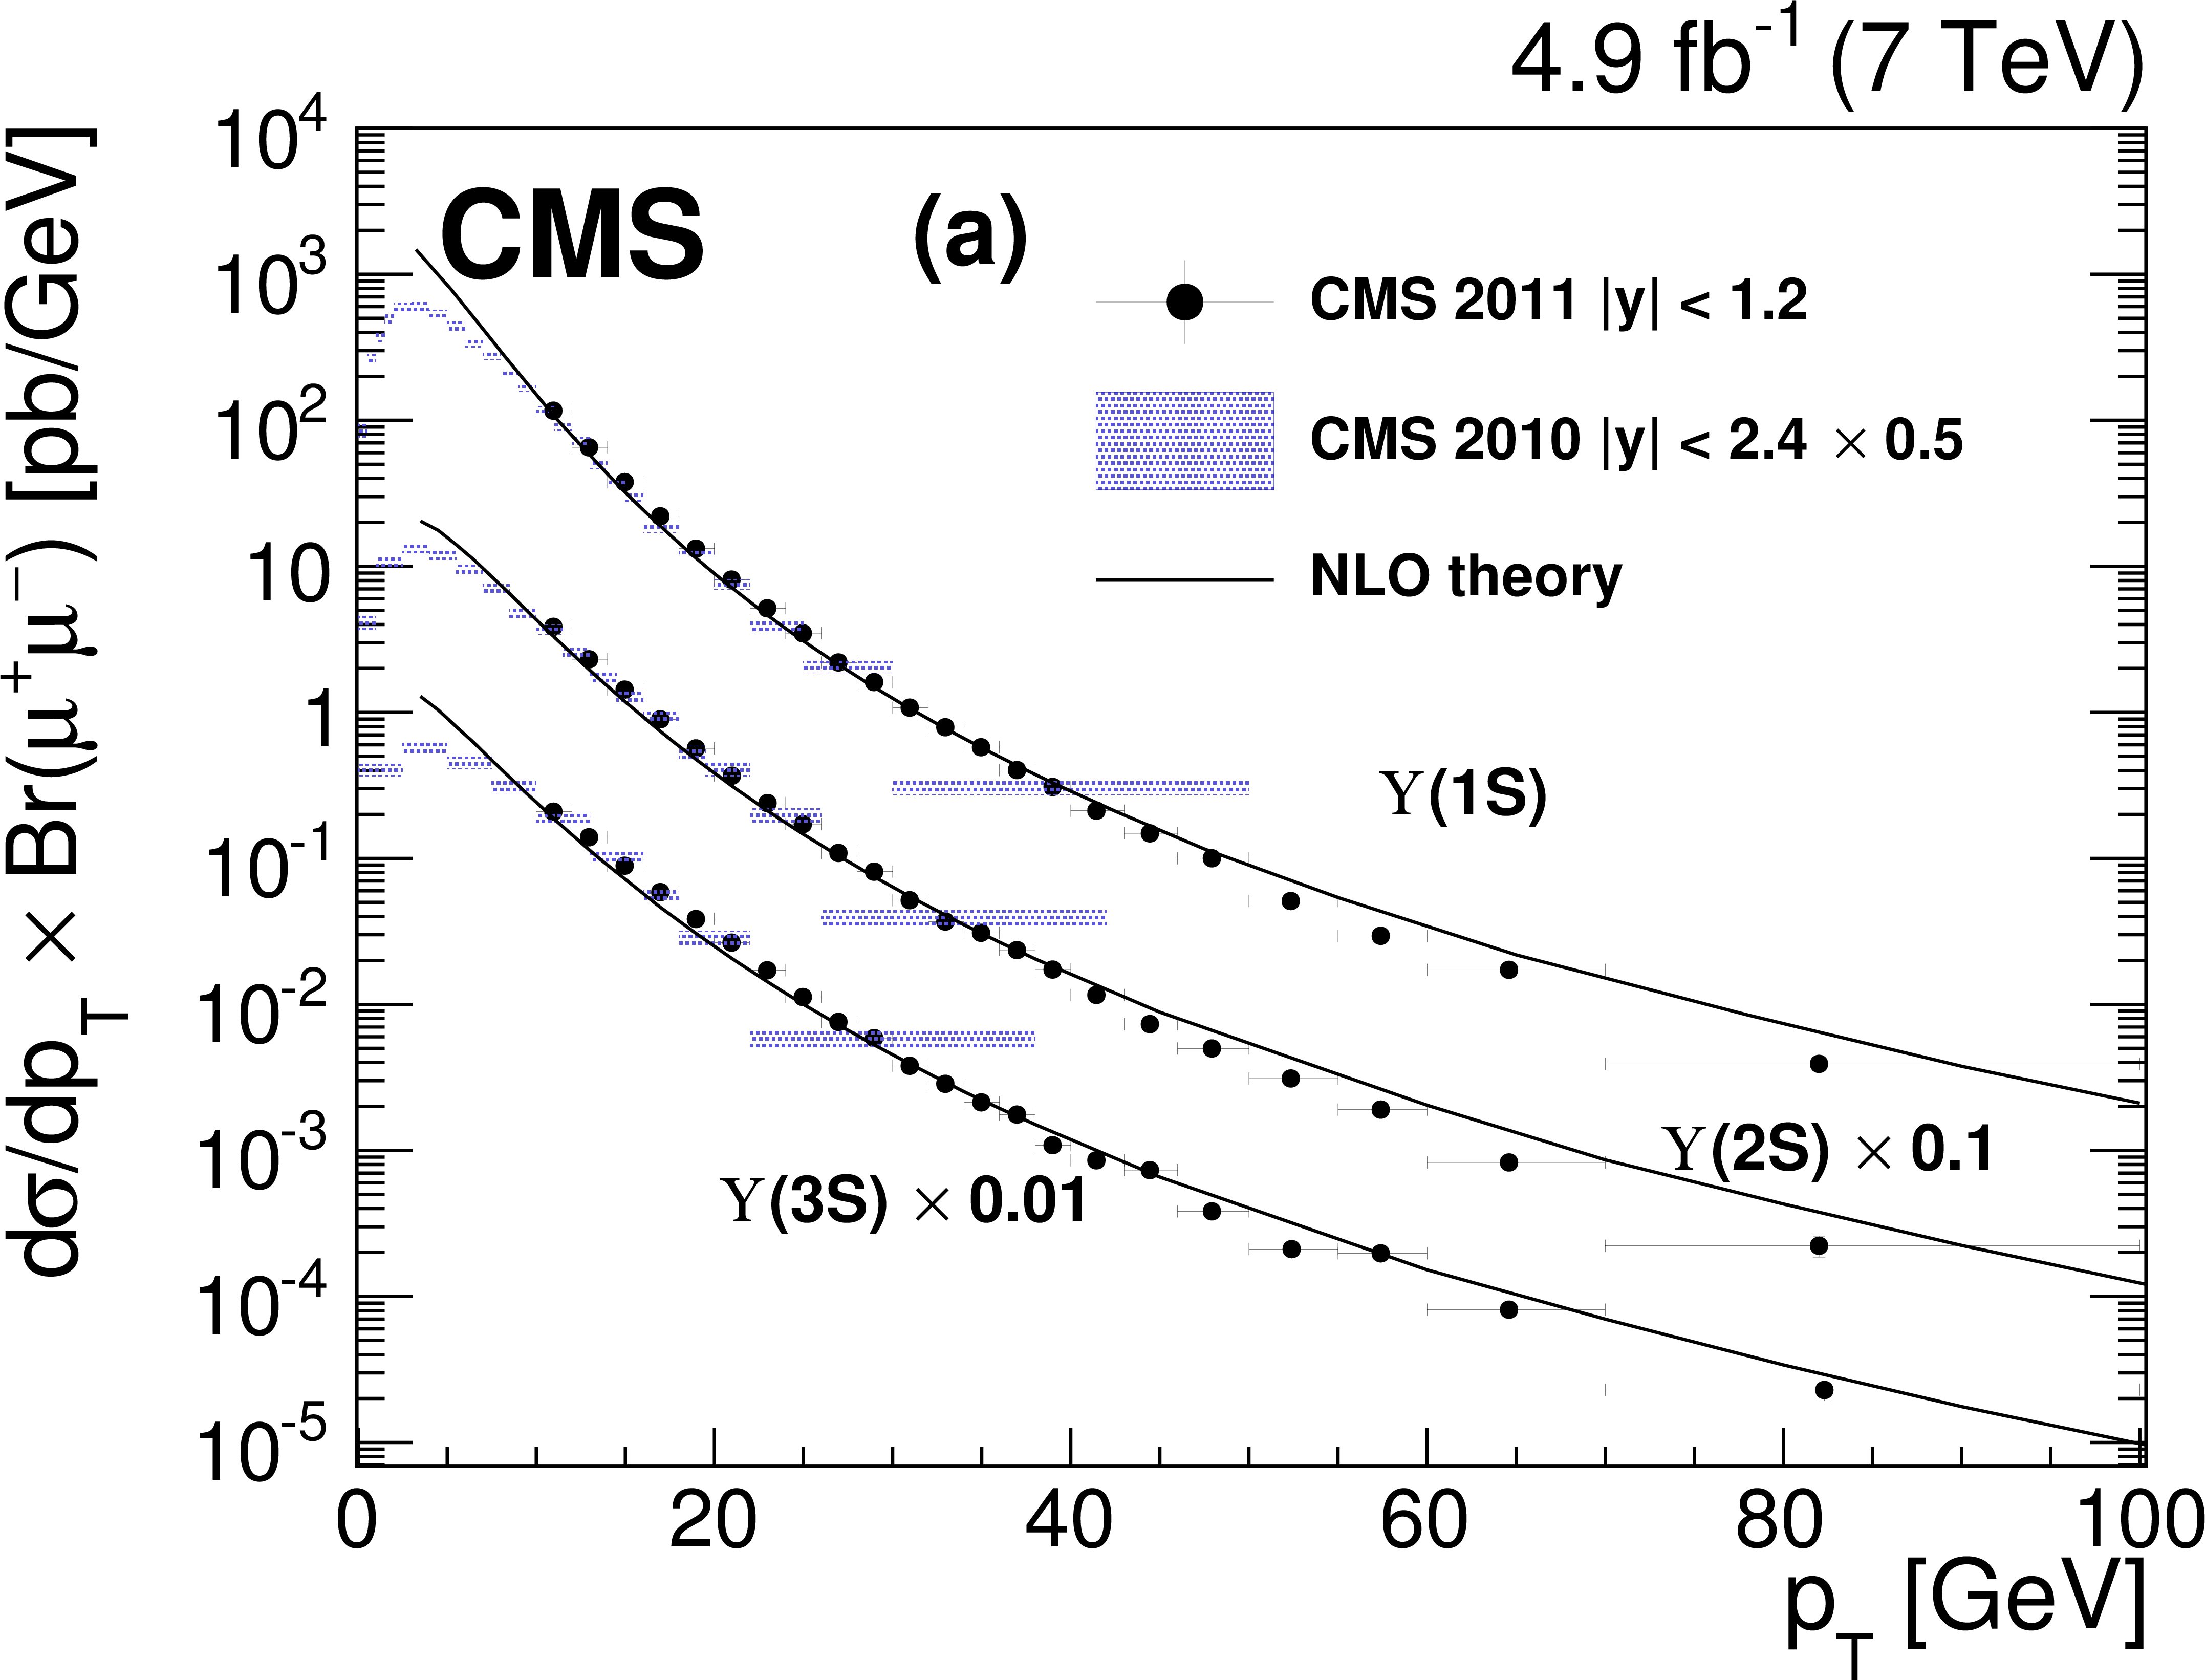
Figure 2-a:
(a) The $ { {\Upsilon }\mathrm {(}n\mathrm {S)}} $ differential $ {p_{\mathrm {T}}} $ cross sections times dimuon branching fractions for $ {| y | } < $ 1.2. The $ {\Upsilon \mathrm {(2S)}}$ and $ {\Upsilon \mathrm {(3S)}}$ measurements are scaled by 0.1 and 0.01, respectively, for display purposes. The vertical bars show the total uncertainty, excluding the systematic uncertainty in the integrated luminosity. The horizontal bars show the bin widths. Previous CMS measurements for $ {| y | } < $ 2.4 are shown as cross-hatched areas. These results have been scaled by 0.5 to account for the smaller $ {| y | }$ range in the latest measurement, where the scaling assumes that the rapidity distribution is flat. The solid lines are the NLO calculations from Ref.[Gong] extended by the authors to cover the range $ {p_{\mathrm {T}}} < $100 GeV. (b) Details of the parametrized cross section fit described in the text for $ {\Upsilon \mathrm {(1S)}} $ with $ {| y | } < $1.2. In this plot the solid line is the result of the power-law fit for $ {p_{\mathrm {T}}} >$ 20 GeV. The dashed line shows an exponential fit to the data for 10 $< {p_{\mathrm {T}}} <$ 20 GeV. The lower plot shows the pulls of the fit as defined in the text. |
png pdf |
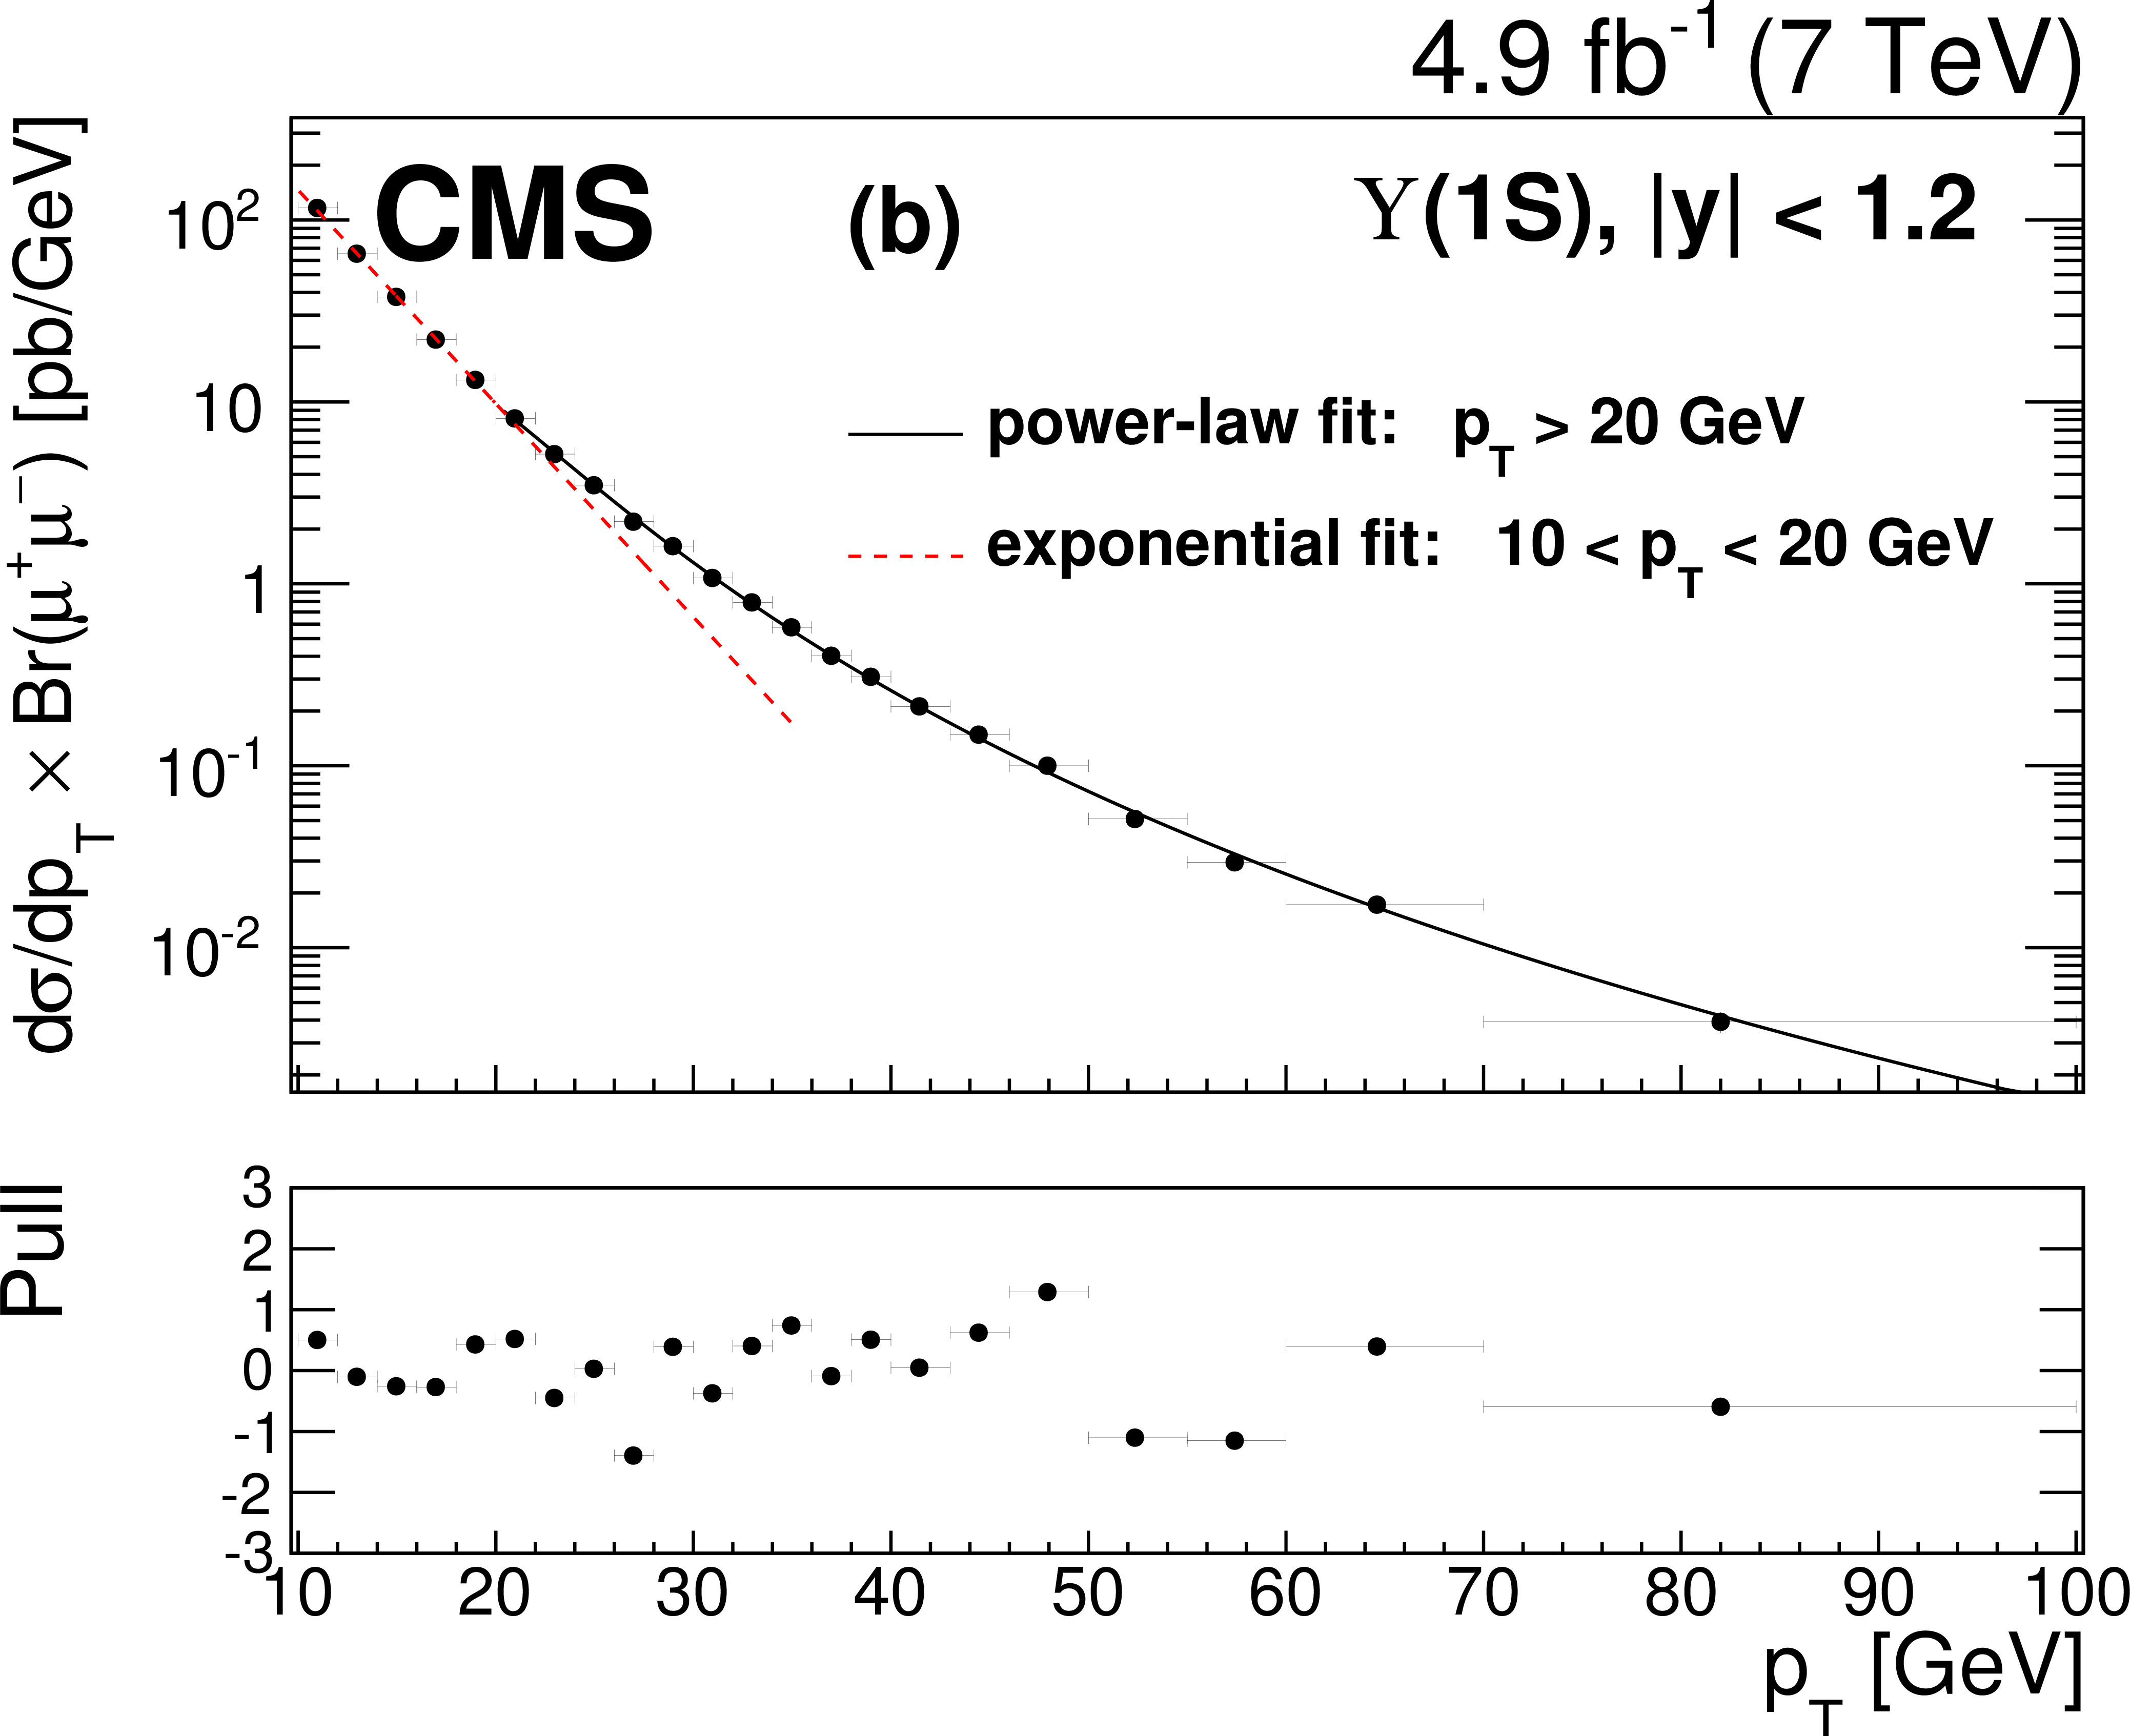
Figure 2-b:
(a) The $ { {\Upsilon }\mathrm {(}n\mathrm {S)}} $ differential $ {p_{\mathrm {T}}} $ cross sections times dimuon branching fractions for $ {| y | } < $ 1.2. The $ {\Upsilon \mathrm {(2S)}}$ and $ {\Upsilon \mathrm {(3S)}}$ measurements are scaled by 0.1 and 0.01, respectively, for display purposes. The vertical bars show the total uncertainty, excluding the systematic uncertainty in the integrated luminosity. The horizontal bars show the bin widths. Previous CMS measurements for $ {| y | } < $ 2.4 are shown as cross-hatched areas. These results have been scaled by 0.5 to account for the smaller $ {| y | }$ range in the latest measurement, where the scaling assumes that the rapidity distribution is flat. The solid lines are the NLO calculations from Ref.[Gong] extended by the authors to cover the range $ {p_{\mathrm {T}}} < $100 GeV. (b) Details of the parametrized cross section fit described in the text for $ {\Upsilon \mathrm {(1S)}} $ with $ {| y | } < $1.2. In this plot the solid line is the result of the power-law fit for $ {p_{\mathrm {T}}} >$ 20 GeV. The dashed line shows an exponential fit to the data for 10 $< {p_{\mathrm {T}}} <$ 20 GeV. The lower plot shows the pulls of the fit as defined in the text. |
png pdf |
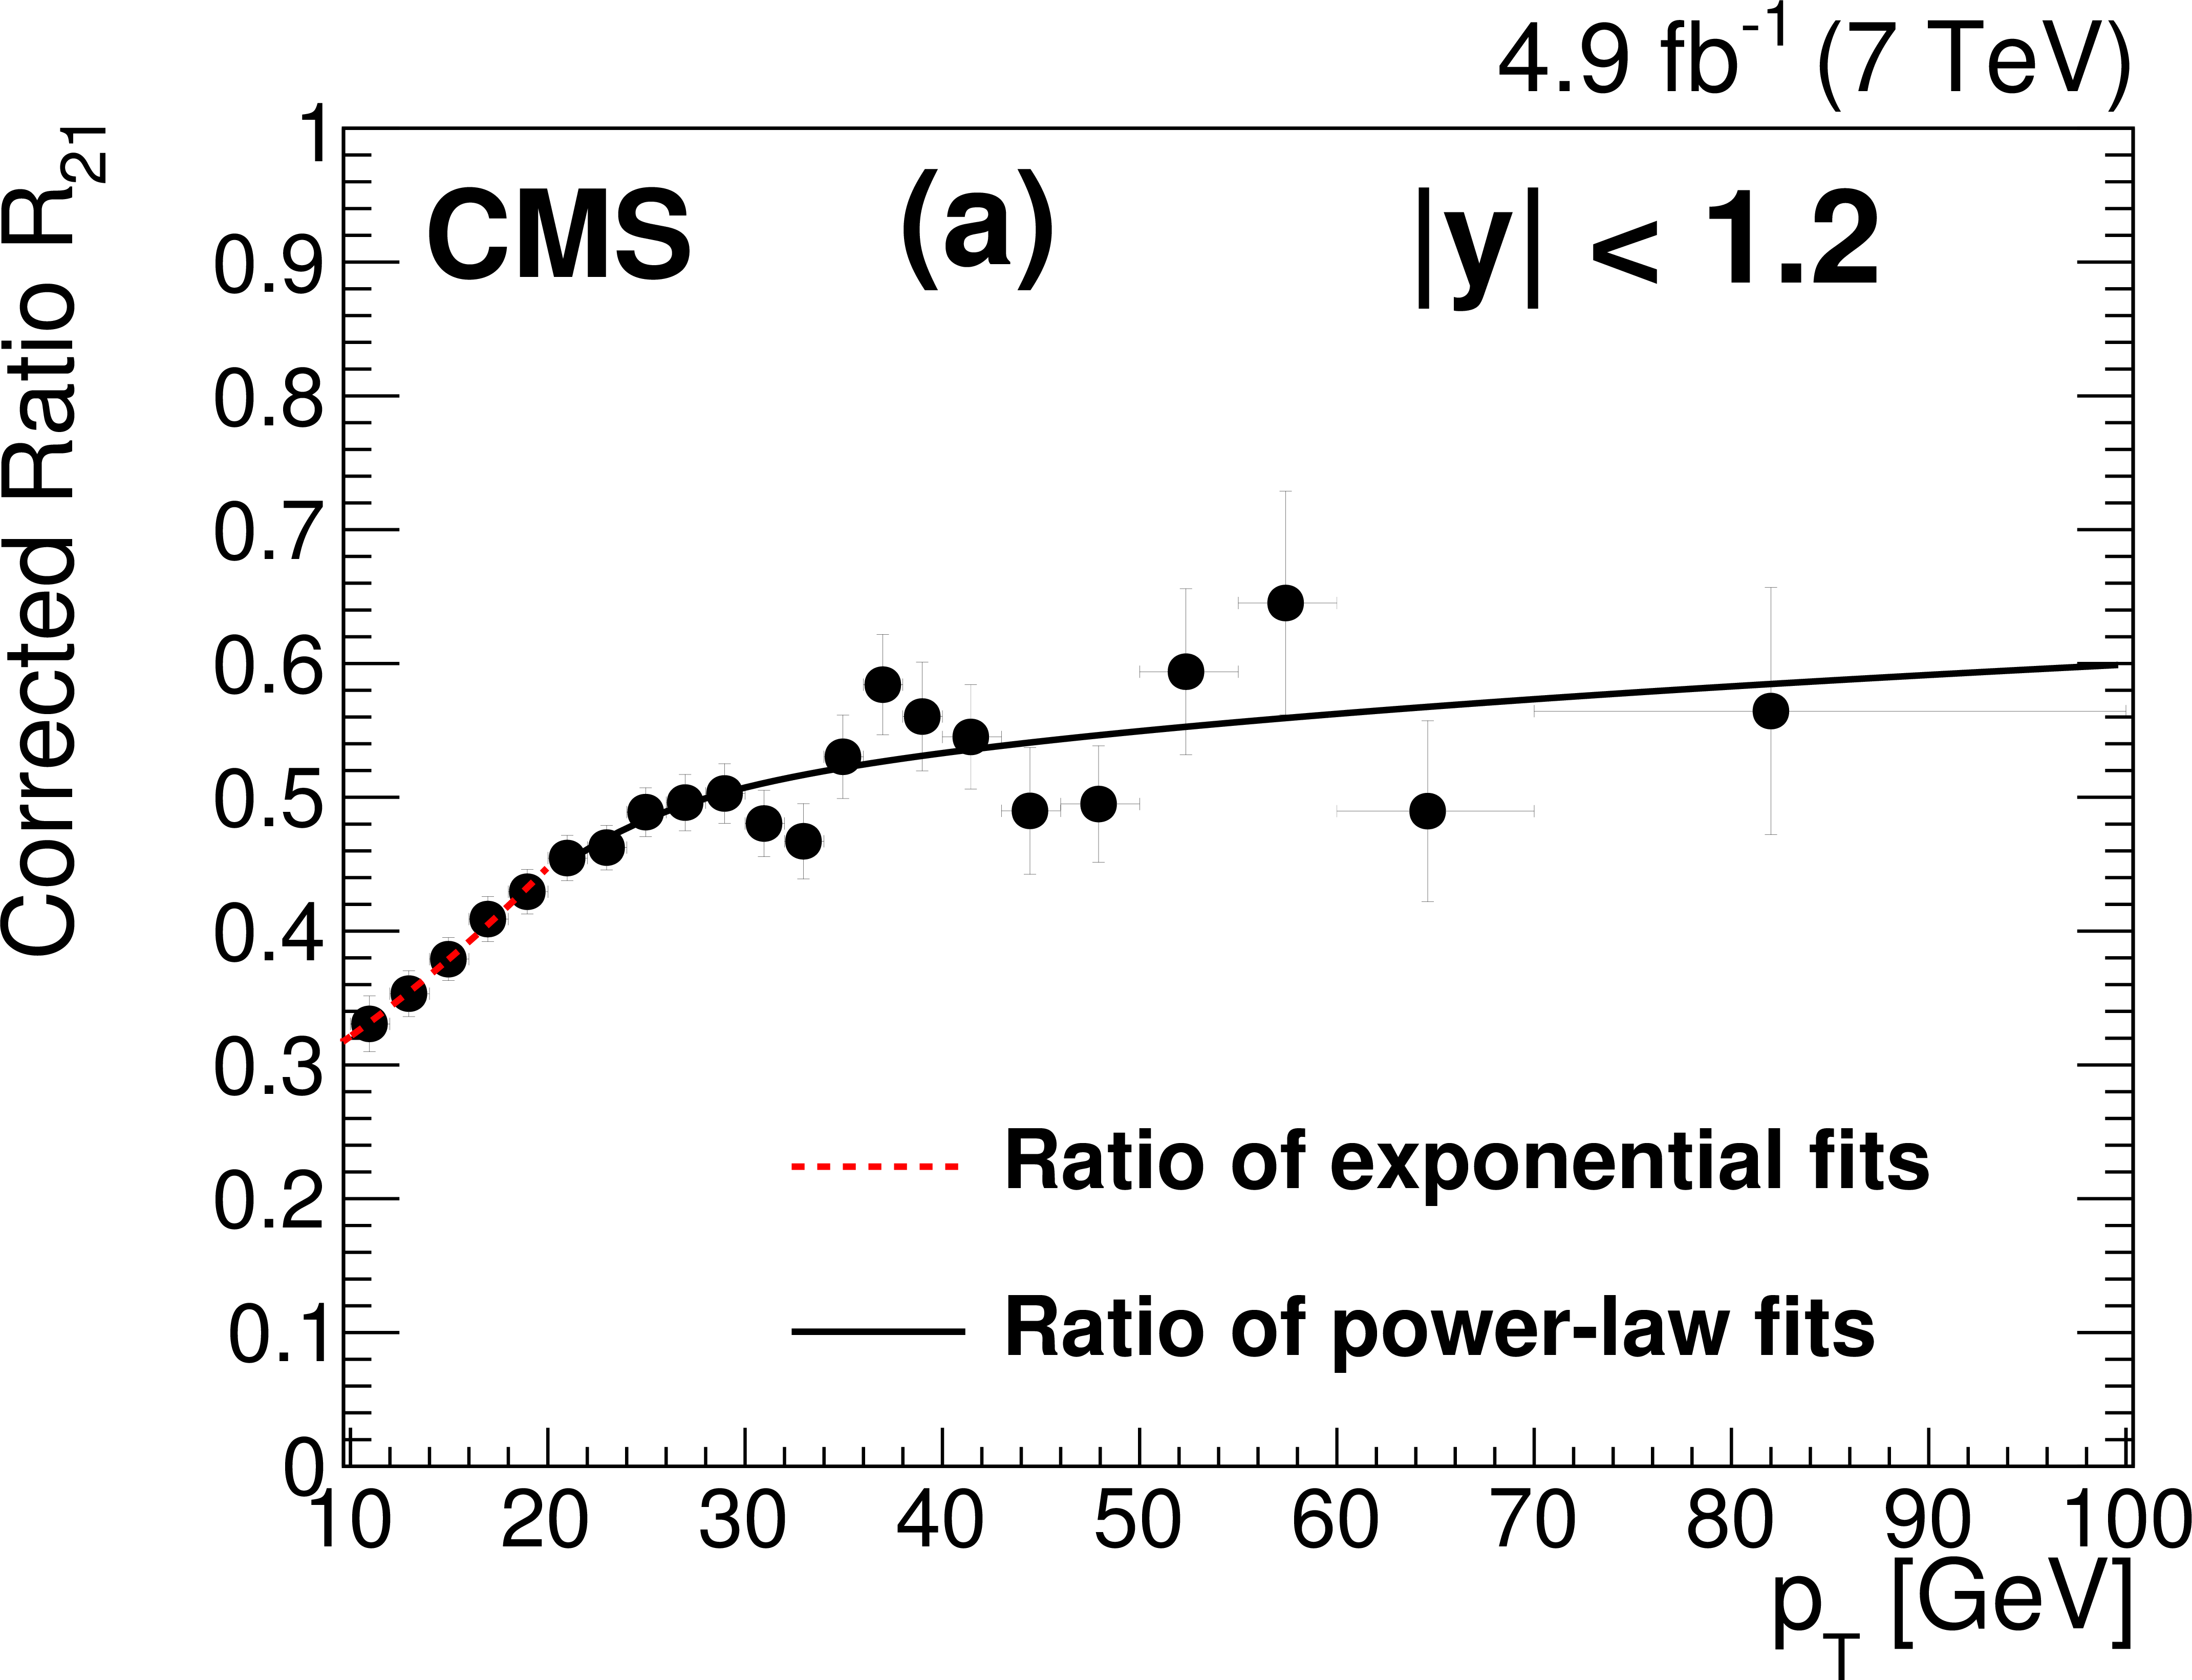
Figure 3-a:
Measured differential cross section ratios as a function of $ {p_{\mathrm {T}}} $. Corrected yield ratios: (a) $R_{21}$; (b) $R_{31}$. The dashed line is the ratio of the exponential fits to the individual differential cross sections for 10 $< {p_{\mathrm {T}}} <$ 20 GeV. The solid line is the ratio of the corresponding power-law fits for $ {p_{\mathrm {T}}} > $ 20 GeV. |

png pdf |
Figure 3-b:
Measured differential cross section ratios as a function of $ {p_{\mathrm {T}}} $. Corrected yield ratios: (a) $R_{21}$; (b) $R_{31}$. The dashed line is the ratio of the exponential fits to the individual differential cross sections for 10 $< {p_{\mathrm {T}}} <$ 20 GeV. The solid line is the ratio of the corresponding power-law fits for $ {p_{\mathrm {T}}} > $ 20 GeV. |
| Tables | |
png pdf |
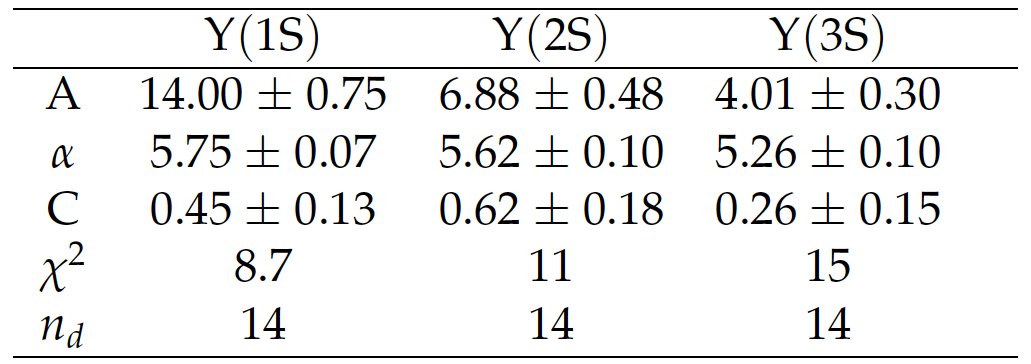
Table 1:
The values of the parameters in Eq.(6) from the power-law fit to $ {\Upsilon \mathrm {(1S)}}$ events with $ {p_{\mathrm {T}}} >$ 20 GeV and $ {| y | } < $ 1.2, along with the $\chi ^2$ value and the number of degrees of freedom $n_{d}$. |
| Summary |
| Measurements of the differential production cross sections as a function of $ {p_{\mathrm {T}}} $ for the $ {\Upsilon \mathrm {(1S)}}$, $ {\Upsilon \mathrm {(2S)}}$, and $ {\Upsilon \mathrm {(3S)}}$ states in pp collisions at $\sqrt{s} =$ 7 TeV have been presented, based on a data sample corresponding to an integrated luminosity of 4.9 fb$^{-1}$ collected by the CMS experiment at the LHC. Not only do these measurements significantly improve the precision of the results in previously analyzed $ {p_{\mathrm {T}}} $ ranges [1--3], they also extend the maximum $ {p_{\mathrm {T}}} $ range from 70 to 100 GeV. Evidence has been presented for the first time of the power-law nature of the $ {p_{\mathrm {T}}} $ distributions for all three $ {\Upsilon \mathrm {(nS)}}$ states at high $ {p_{\mathrm {T}}} $. Combined with the CMS $ {\Upsilon \mathrm {(nS)}}$ polarization results [5], the new bottomonium measurements are a formidable challenge to our theoretical understanding of the production of heavy-quark bound states. |
|
|
Compact Muon Solenoid LHC, CERN |
|

|

|

|

|

|