

Compact Muon Solenoid
LHC, CERN
| CMS-BPH-13-012 ; CERN-PH-EP-2015-192 | ||
| Measurement of the CP-violating weak phase $\phi_\mathrm{s}$ and the decay width difference $\Delta\Gamma_\mathrm{s}$ using the ${\mathrm{B^0_s} \to \mathrm{ J } / \psi \phi(1020)}$ decay channel in pp collisions at $ \sqrt{s} = $ 8 TeV | ||
| CMS Collaboration | ||
| 27 July 2015 | ||
| Phys. Lett. B 757 (2016) 97 | ||
| Abstract: The CP-violating weak phase $\phi_\mathrm{s}$ of the $ {\mathrm{B}^0_s} $ meson and the decay width difference $\Delta\Gamma_\mathrm{s}$ of the $ {\mathrm{B}^0_s} $ light and heavy mass eigenstates are measured with the CMS detector at the LHC using a data sample of ${\mathrm{B^0_s} \to \mathrm{ J } / \psi \phi(1020)} \to \mu^+\mu^-\mathrm{ K }^+\mathrm{ K }^-$ decays. The analysed data set corresponds to an integrated luminosity of 19.7 fb$^{-1}$ collected in pp collisions at a centre-of-mass energy of 8 TeV. A total of 49 200 reconstructed $ {\mathrm{B}^0_s} $ decays are used to extract the values of $\phi_\mathrm{s}$ and $\Delta\Gamma_\mathrm{s}$ by performing a time-dependent and flavour-tagged angular analysis of the $\mu^+ \mu^- \mathrm{ K }^+\mathrm{ K }^-$ final state. The weak phase is measured to be $\phi_\mathrm{s} = -0.075 \pm 0.097 \mathrm{(stat)} \pm 0.031\mathrm{(syst)} $ rad, and the decay width difference is $\Delta\Gamma_\mathrm{s} = 0.095 \pm 0.013 \mathrm{(stat)} \pm 0.007 \mathrm{(syst)} $ ps$^{-1}$. | ||
| Links: e-print arXiv:1507.07527 [hep-ex] (PDF) ; CDS record ; inSPIRE record ; Public twiki page ; CADI line (restricted) ; | ||
| Figures | |
png pdf |
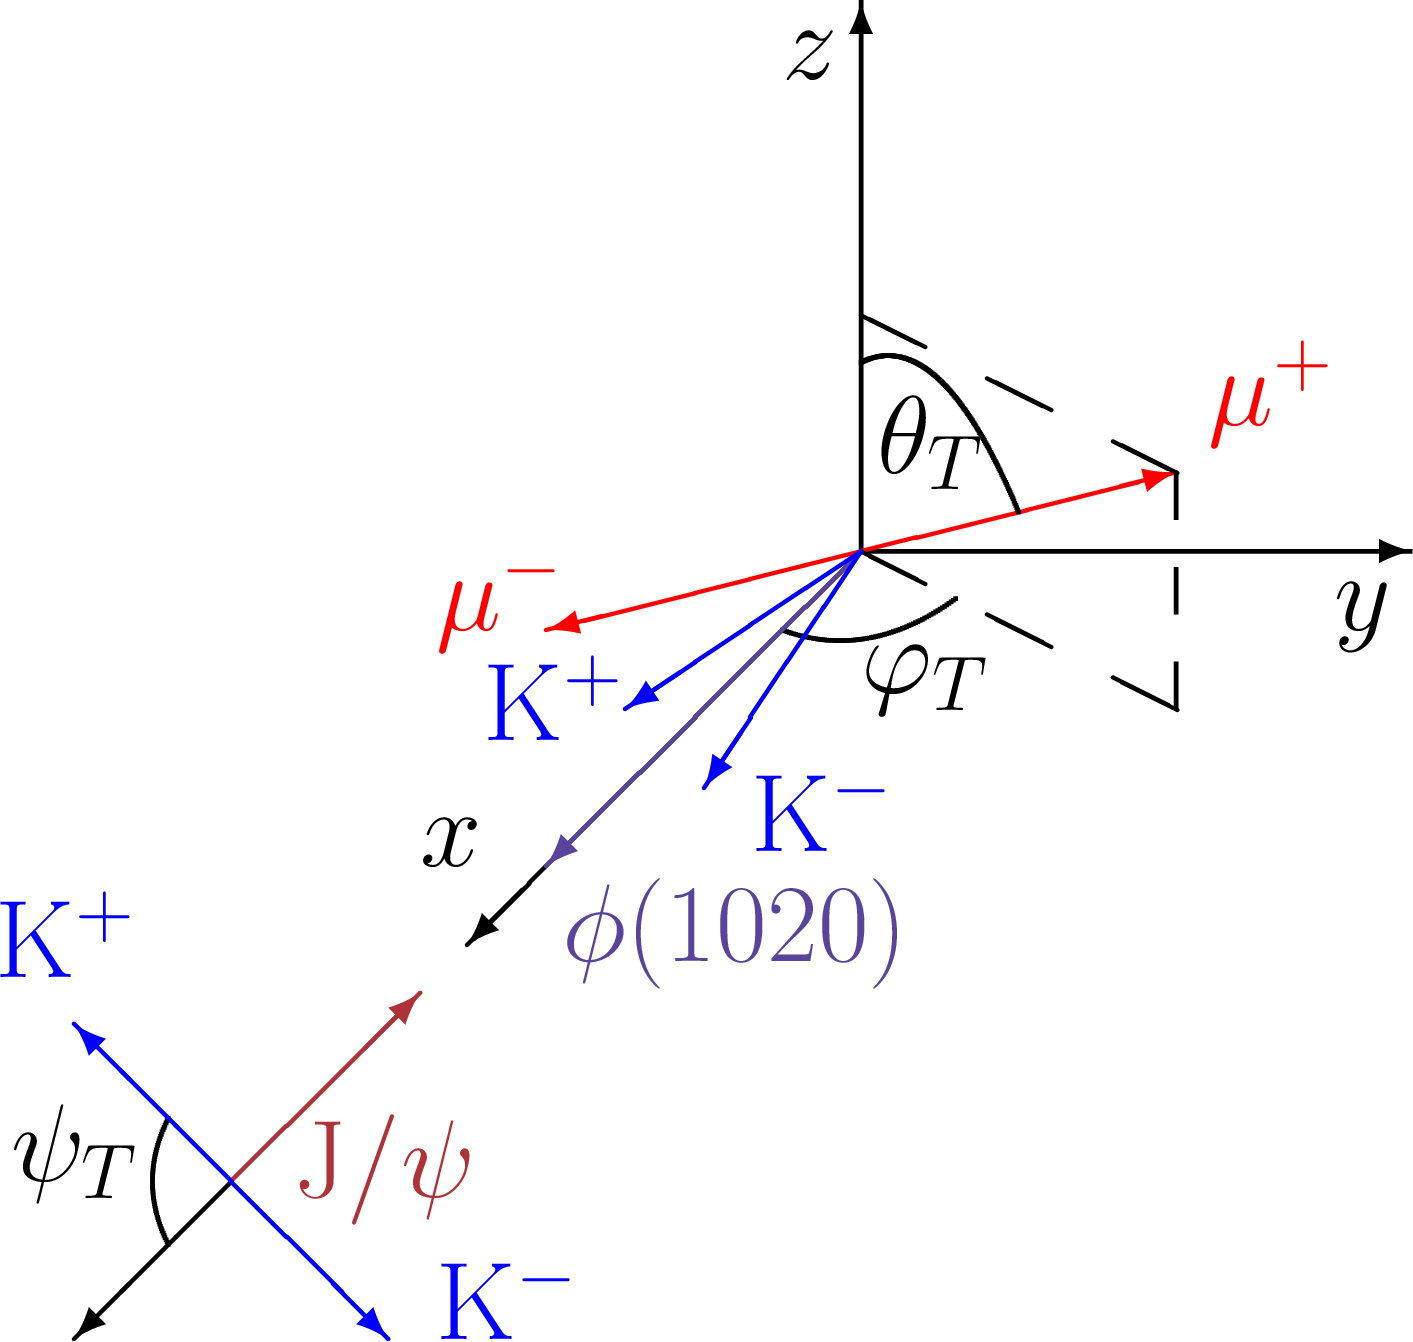
Figure 1:
Definition of the three angles $\theta _\mathrm {T}$, $\psi _\mathrm {T}$, and $\varphi _\mathrm {T}$ describing the decay topology of ${\mathrm {B^0_s} \to \mathrm{ J } / \psi \phi (1020)} $. See text for details. |

png pdf |
Figure 2:
The $\mathrm{ J } / \psi \mathrm{ K }^+ \mathrm{ K }^- $ invariant mass distribution of the ${\mathrm {B}^0_s} $ candidates. The solid line is a fit to the data (solid markers), the dashed line is the signal component and the dot-dashed line is the background component. |
png pdf |
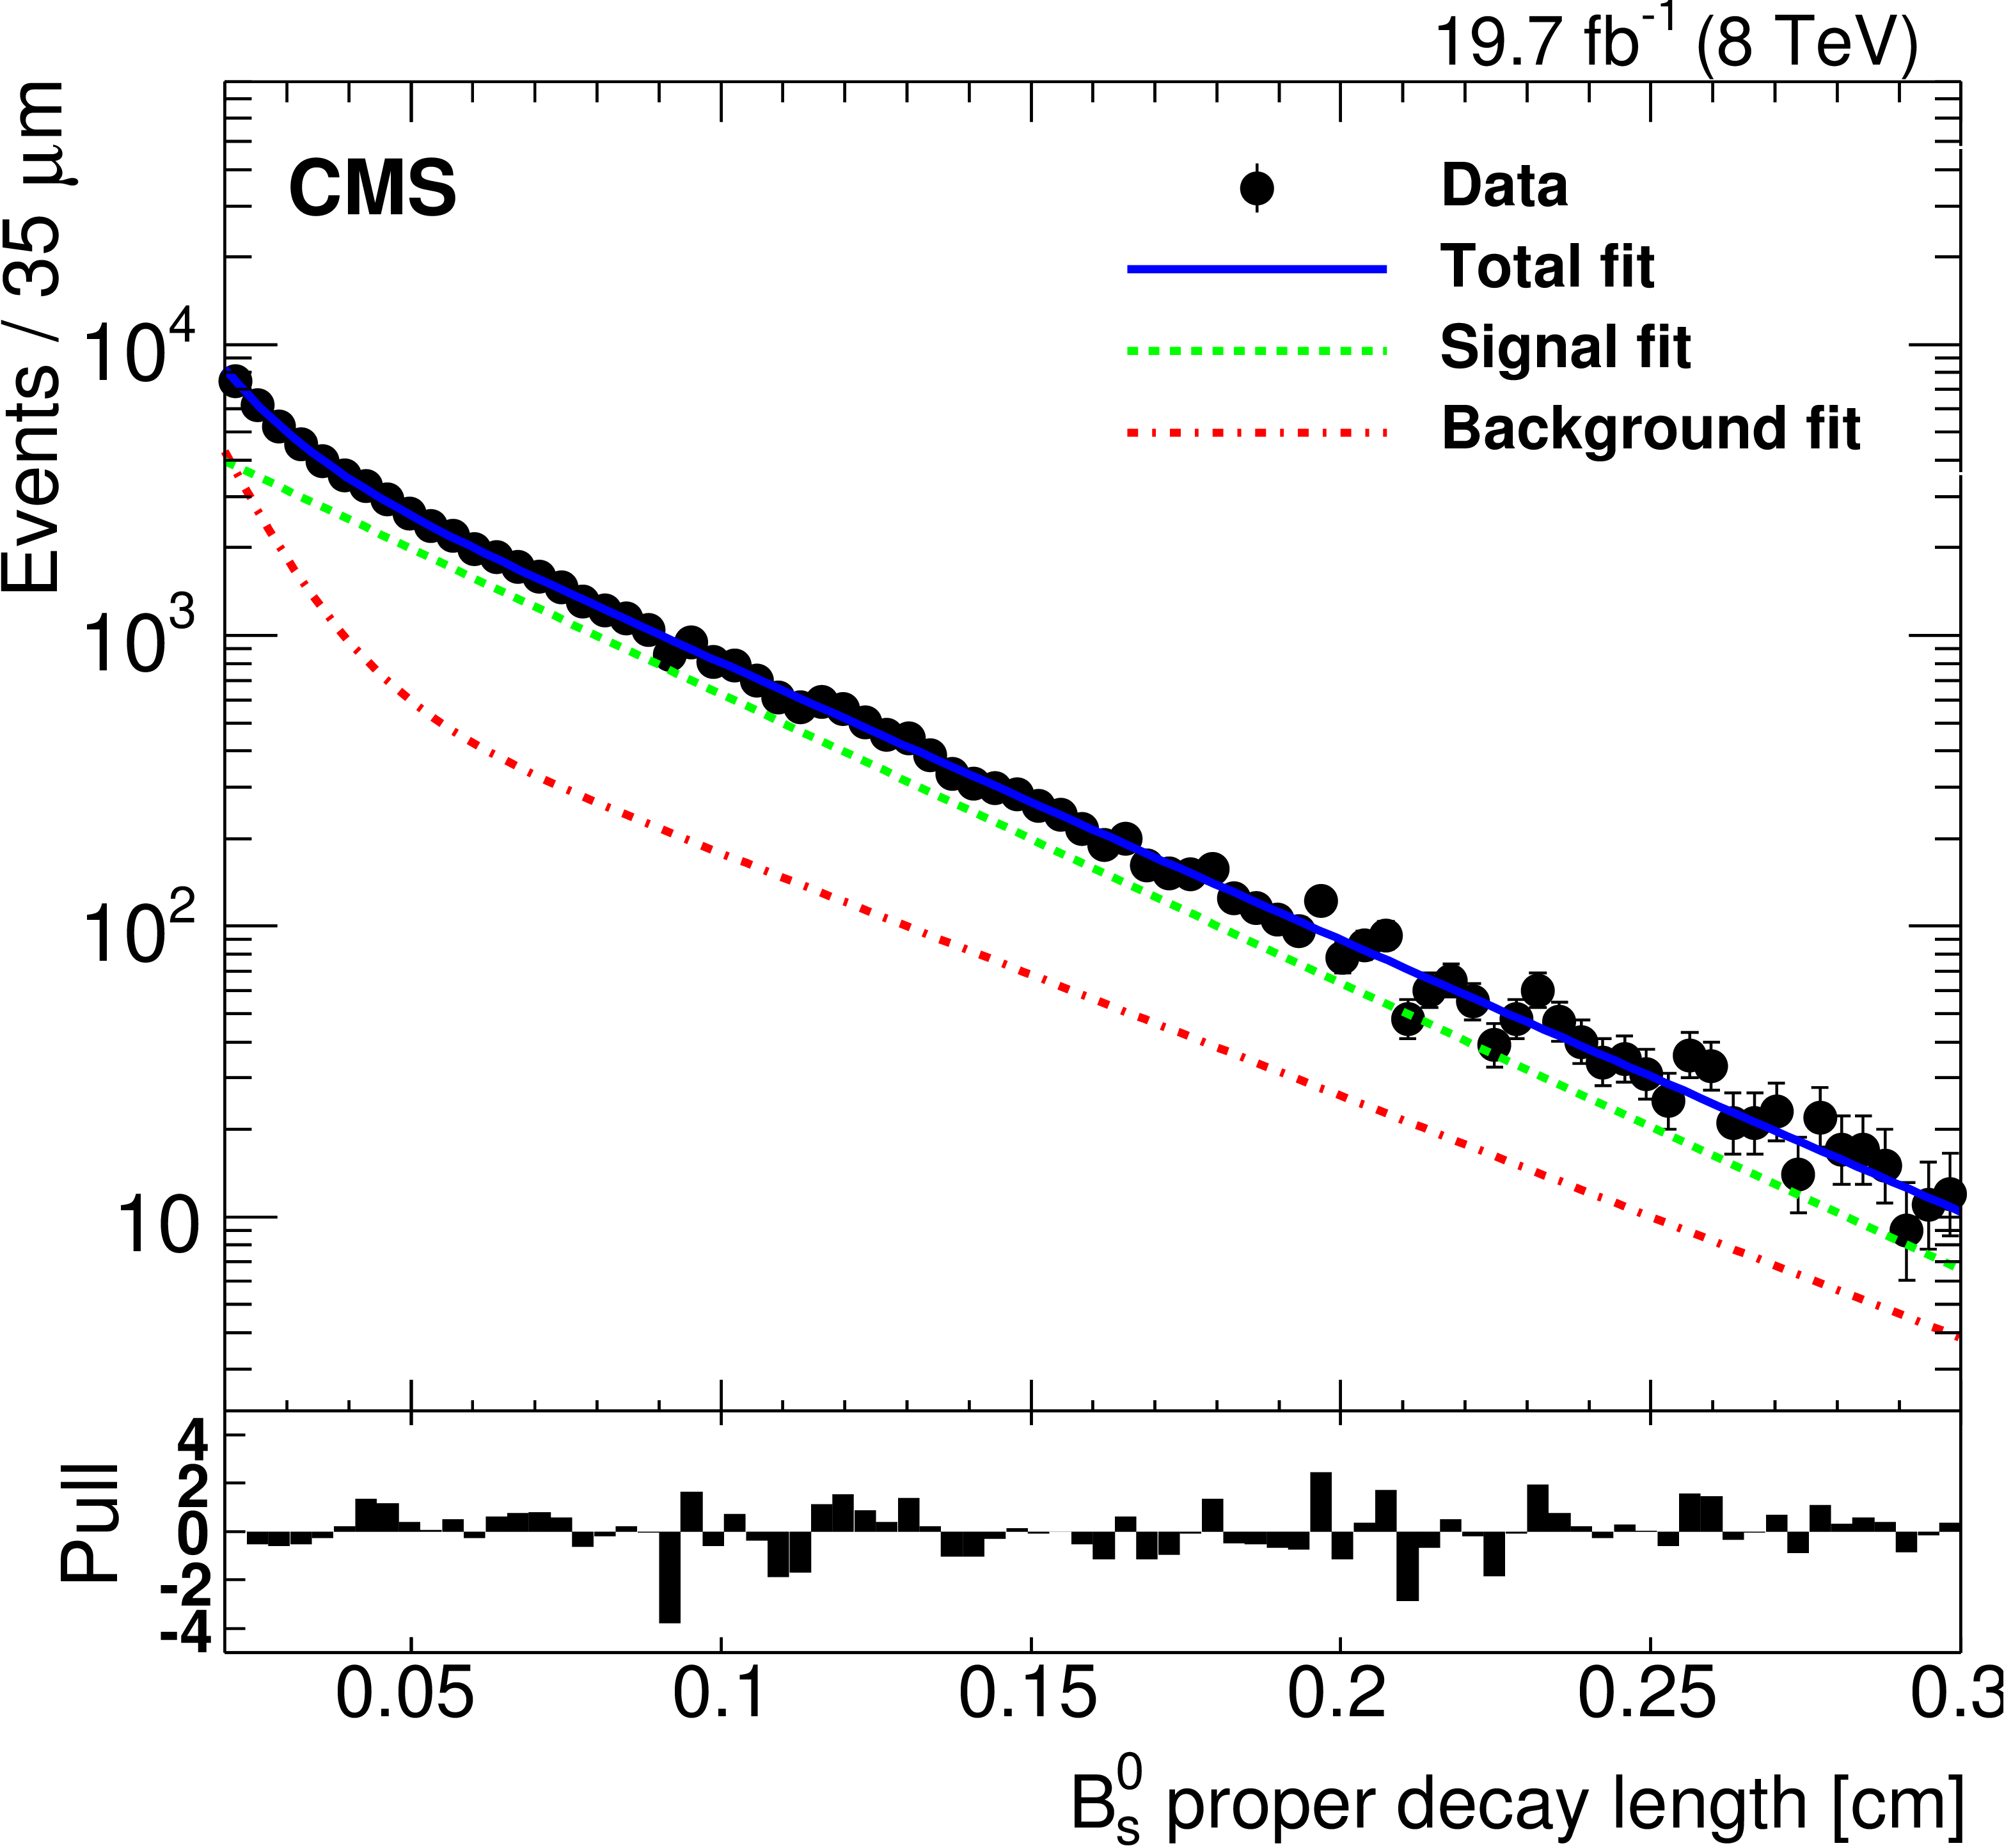
Figure 3-a:
The $ct$ distribution (a) and its uncertainty $\sigma _{ct}$ (b) of the ${\mathrm {B}^0_s} $ candidates. The solid line is a fit to the data (solid markers), the dashed line is the signal component and the dot-dashed line is the background component. For the $ct$ distribution the pull, defined as the difference between the observed events and the fit function applied to the sum of the signal and background, divided by the statistical uncertainty in the observed events, is displayed in the histogram in the lower panel. |

png pdf |
Figure 3-b:
The $ct$ distribution (a) and its uncertainty $\sigma _{ct}$ (b) of the ${\mathrm {B}^0_s} $ candidates. The solid line is a fit to the data (solid markers), the dashed line is the signal component and the dot-dashed line is the background component. For the $ct$ distribution the pull, defined as the difference between the observed events and the fit function applied to the sum of the signal and background, divided by the statistical uncertainty in the observed events, is displayed in the histogram in the lower panel. |
png pdf |
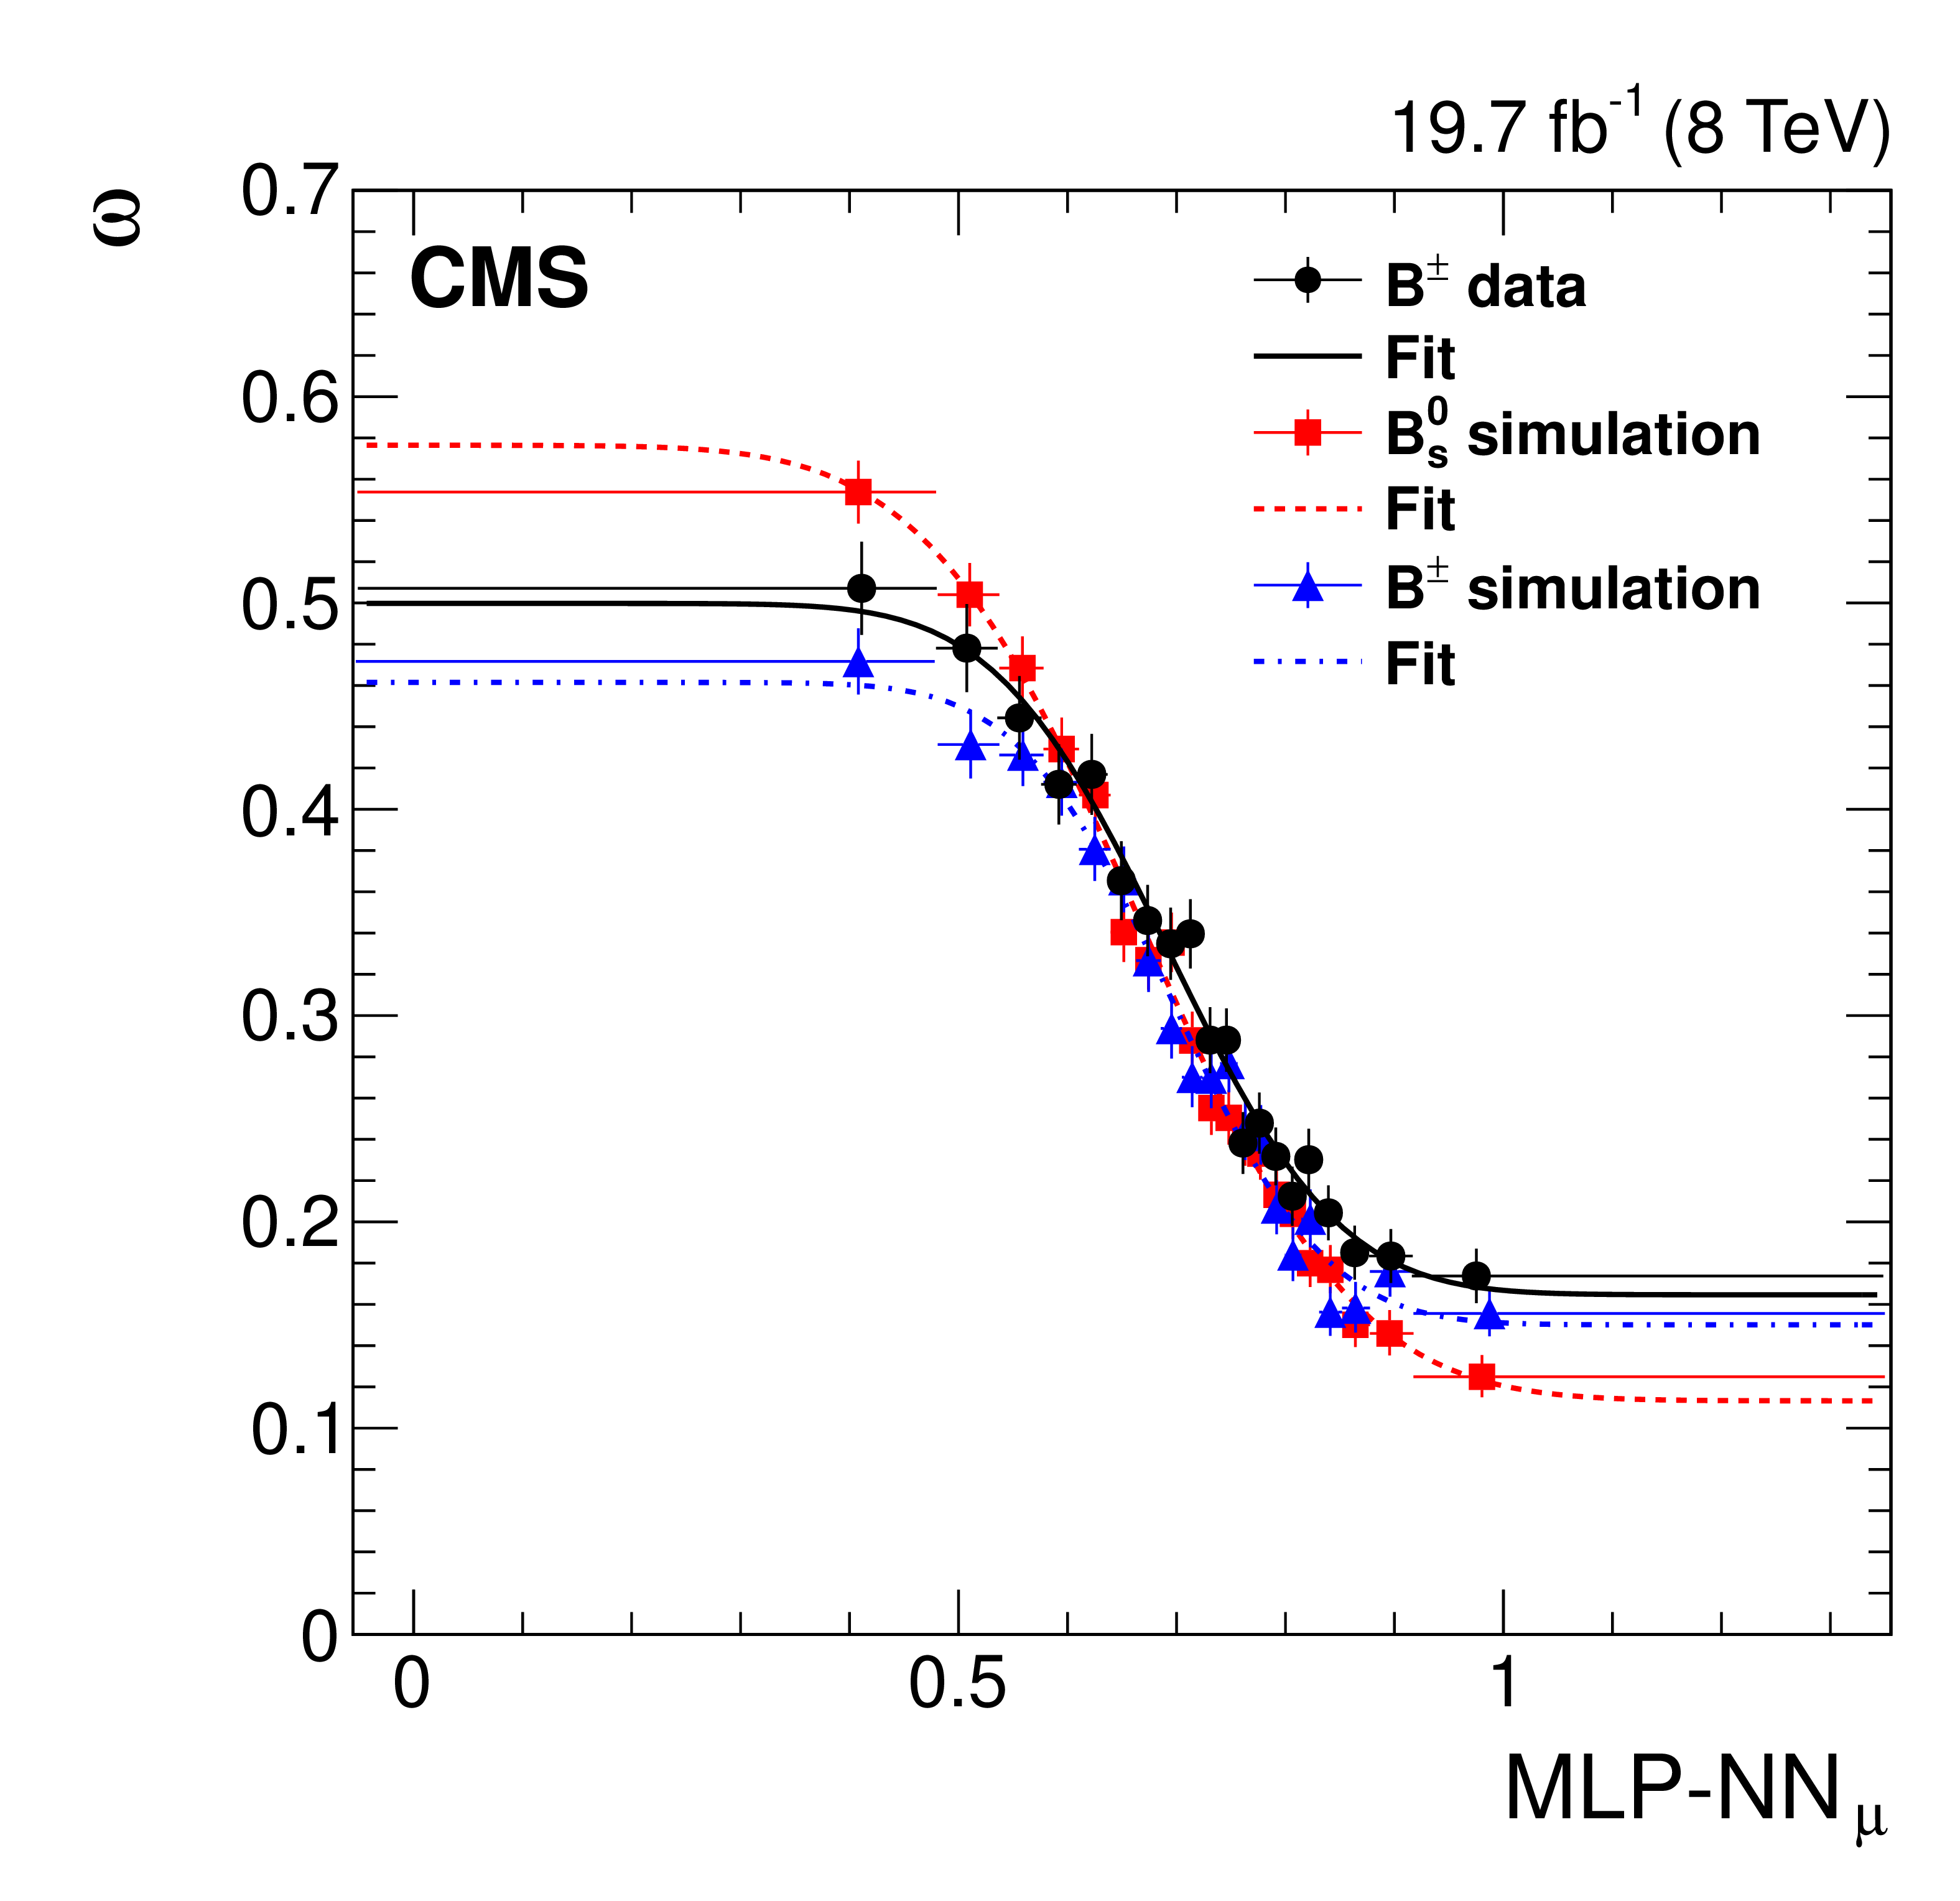
Figure 4-a:
The mistag probabilities $\omega $, defined as the ratio of the number of wrongly tagged events divided by the total number of tagged events, as a function of the MLP-NN discriminators for muons (a) and electrons (b). The data points (solid markers) are placed at the average weighted value of the events in each bin. The vertical bars show the statistical uncertainties and the horizontal bars the bin width. The solid line represents the parametrisation curve extracted from the background-subtracted ${\mathrm {B}^\pm } $ data; the dashed and dot-dashed lines refer to the parametrisations extracted from the simulated ${\mathrm {B}^0_s} $ and ${\mathrm {B}^\pm } $ samples, respectively. |
png pdf |
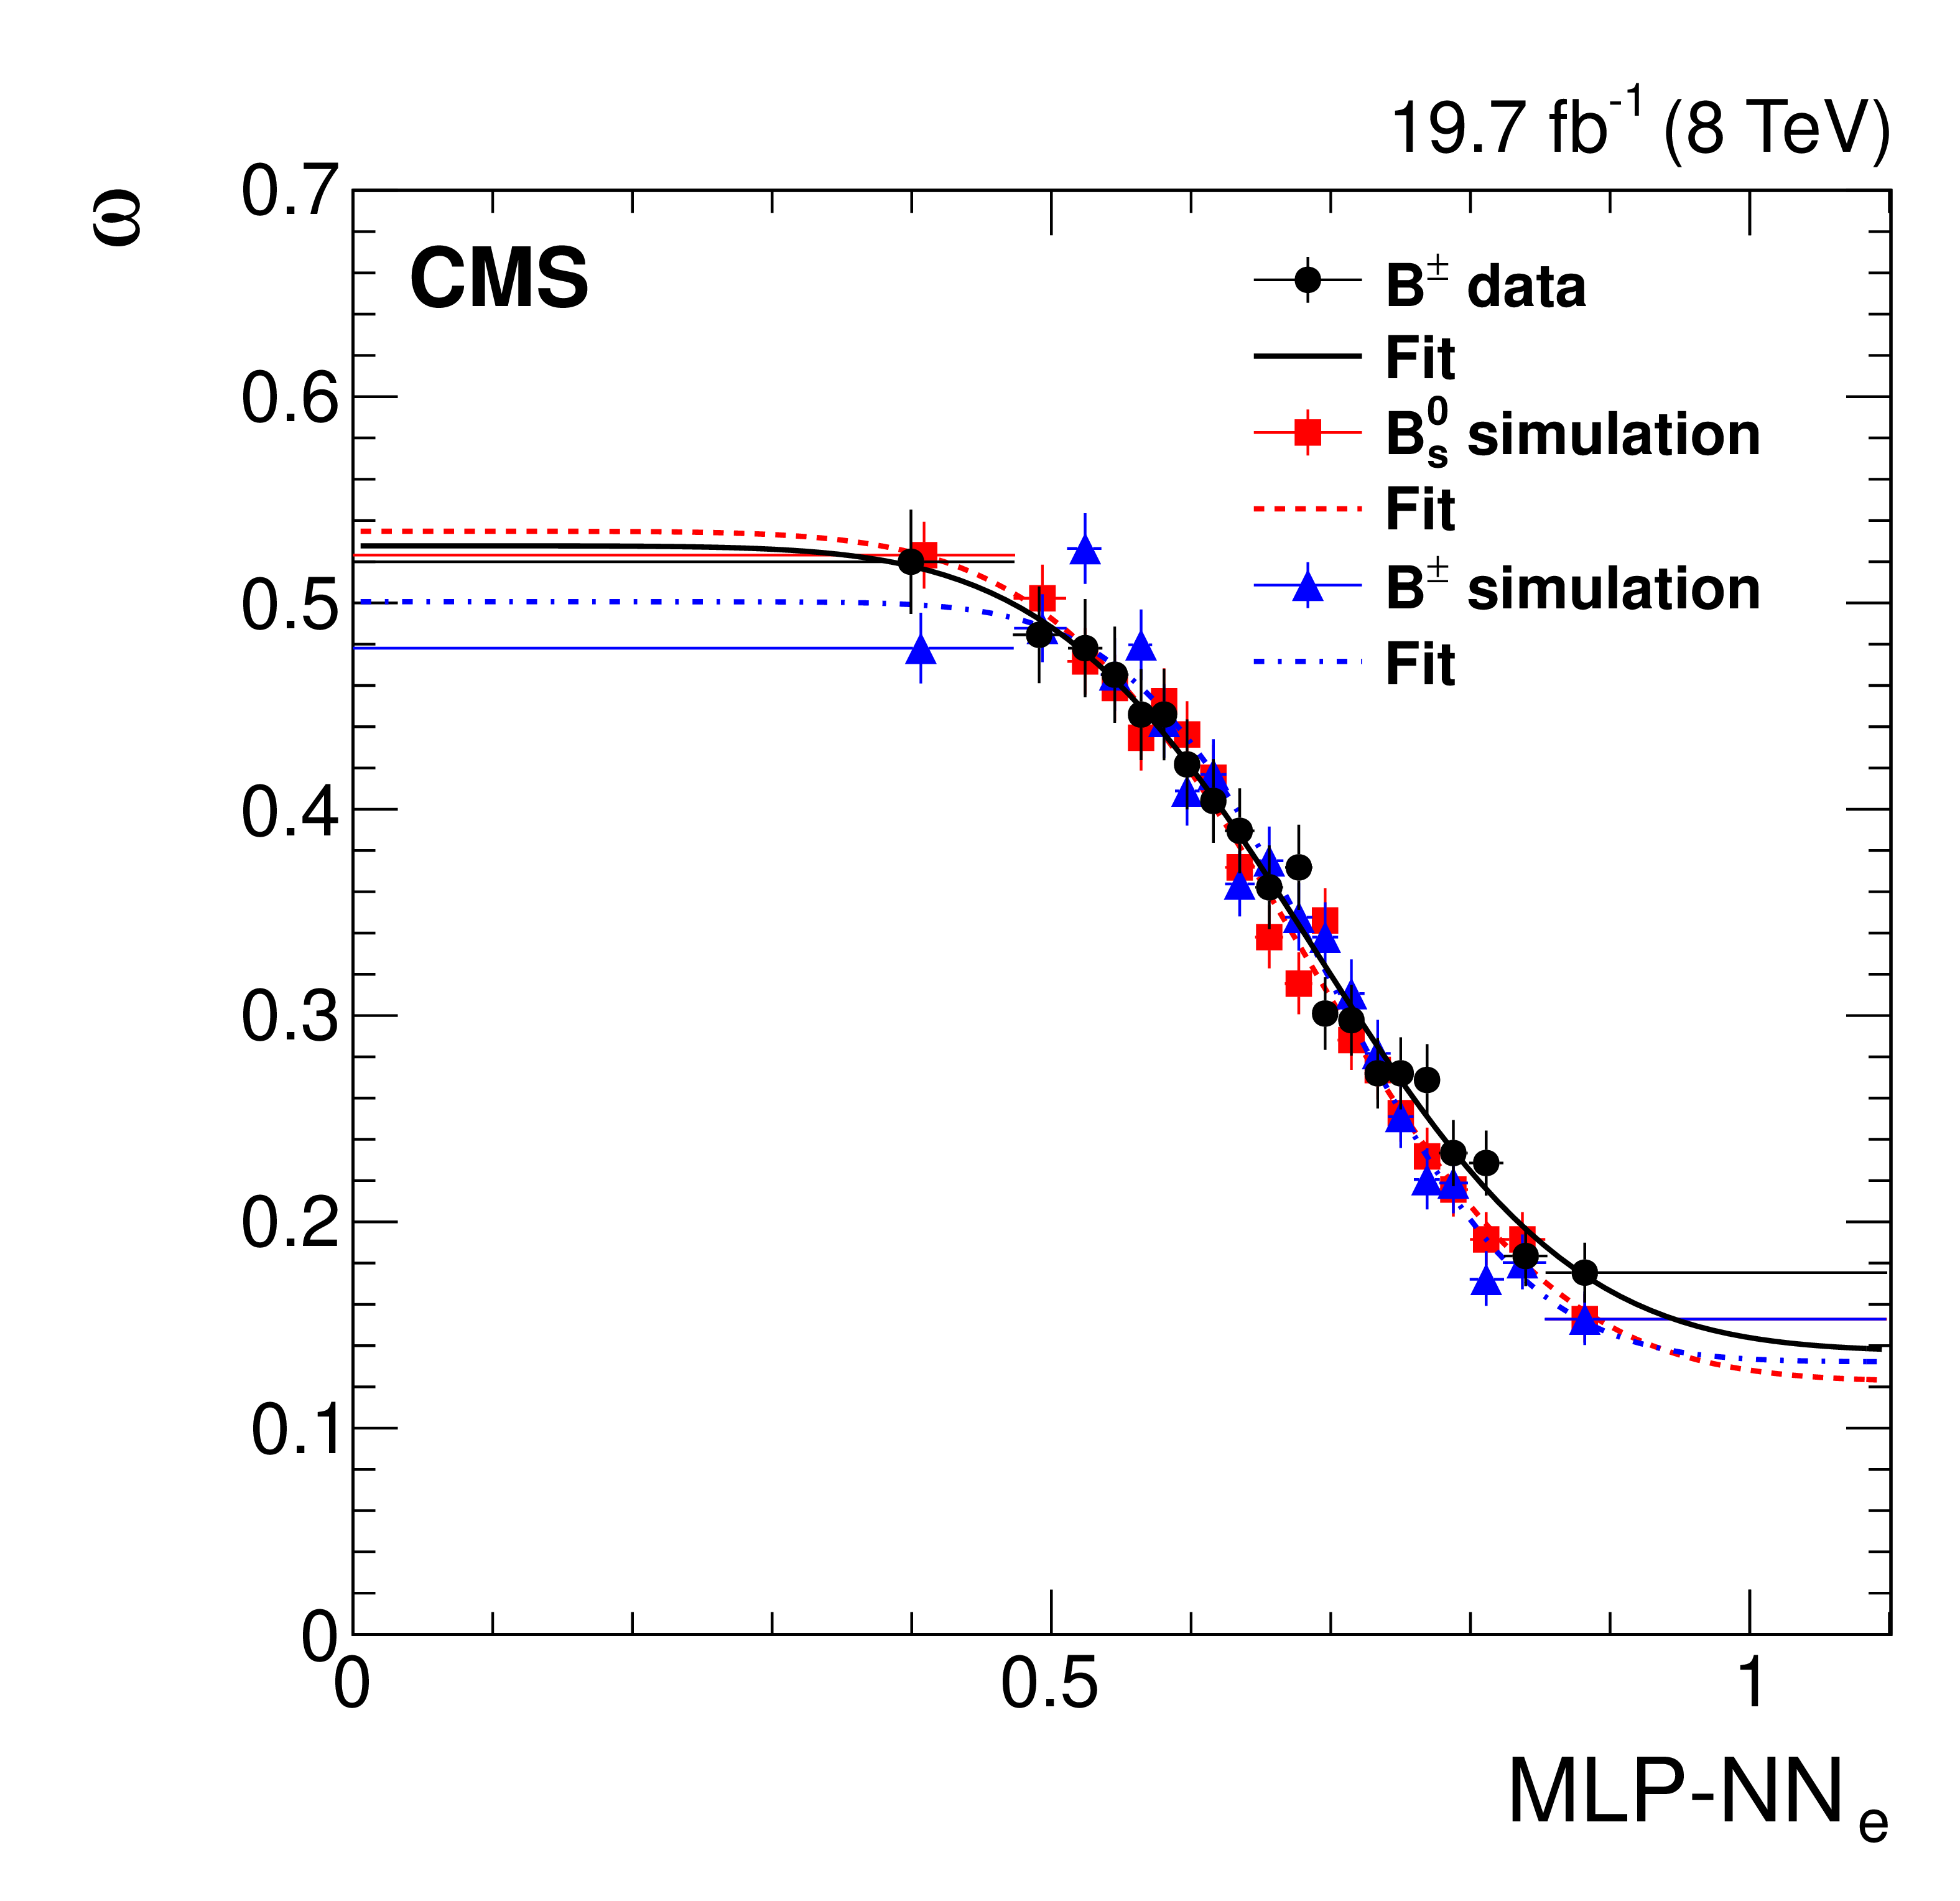
Figure 4-b:
The mistag probabilities $\omega $, defined as the ratio of the number of wrongly tagged events divided by the total number of tagged events, as a function of the MLP-NN discriminators for muons (a) and electrons (b). The data points (solid markers) are placed at the average weighted value of the events in each bin. The vertical bars show the statistical uncertainties and the horizontal bars the bin width. The solid line represents the parametrisation curve extracted from the background-subtracted ${\mathrm {B}^\pm } $ data; the dashed and dot-dashed lines refer to the parametrisations extracted from the simulated ${\mathrm {B}^0_s} $ and ${\mathrm {B}^\pm } $ samples, respectively. |
png pdf |
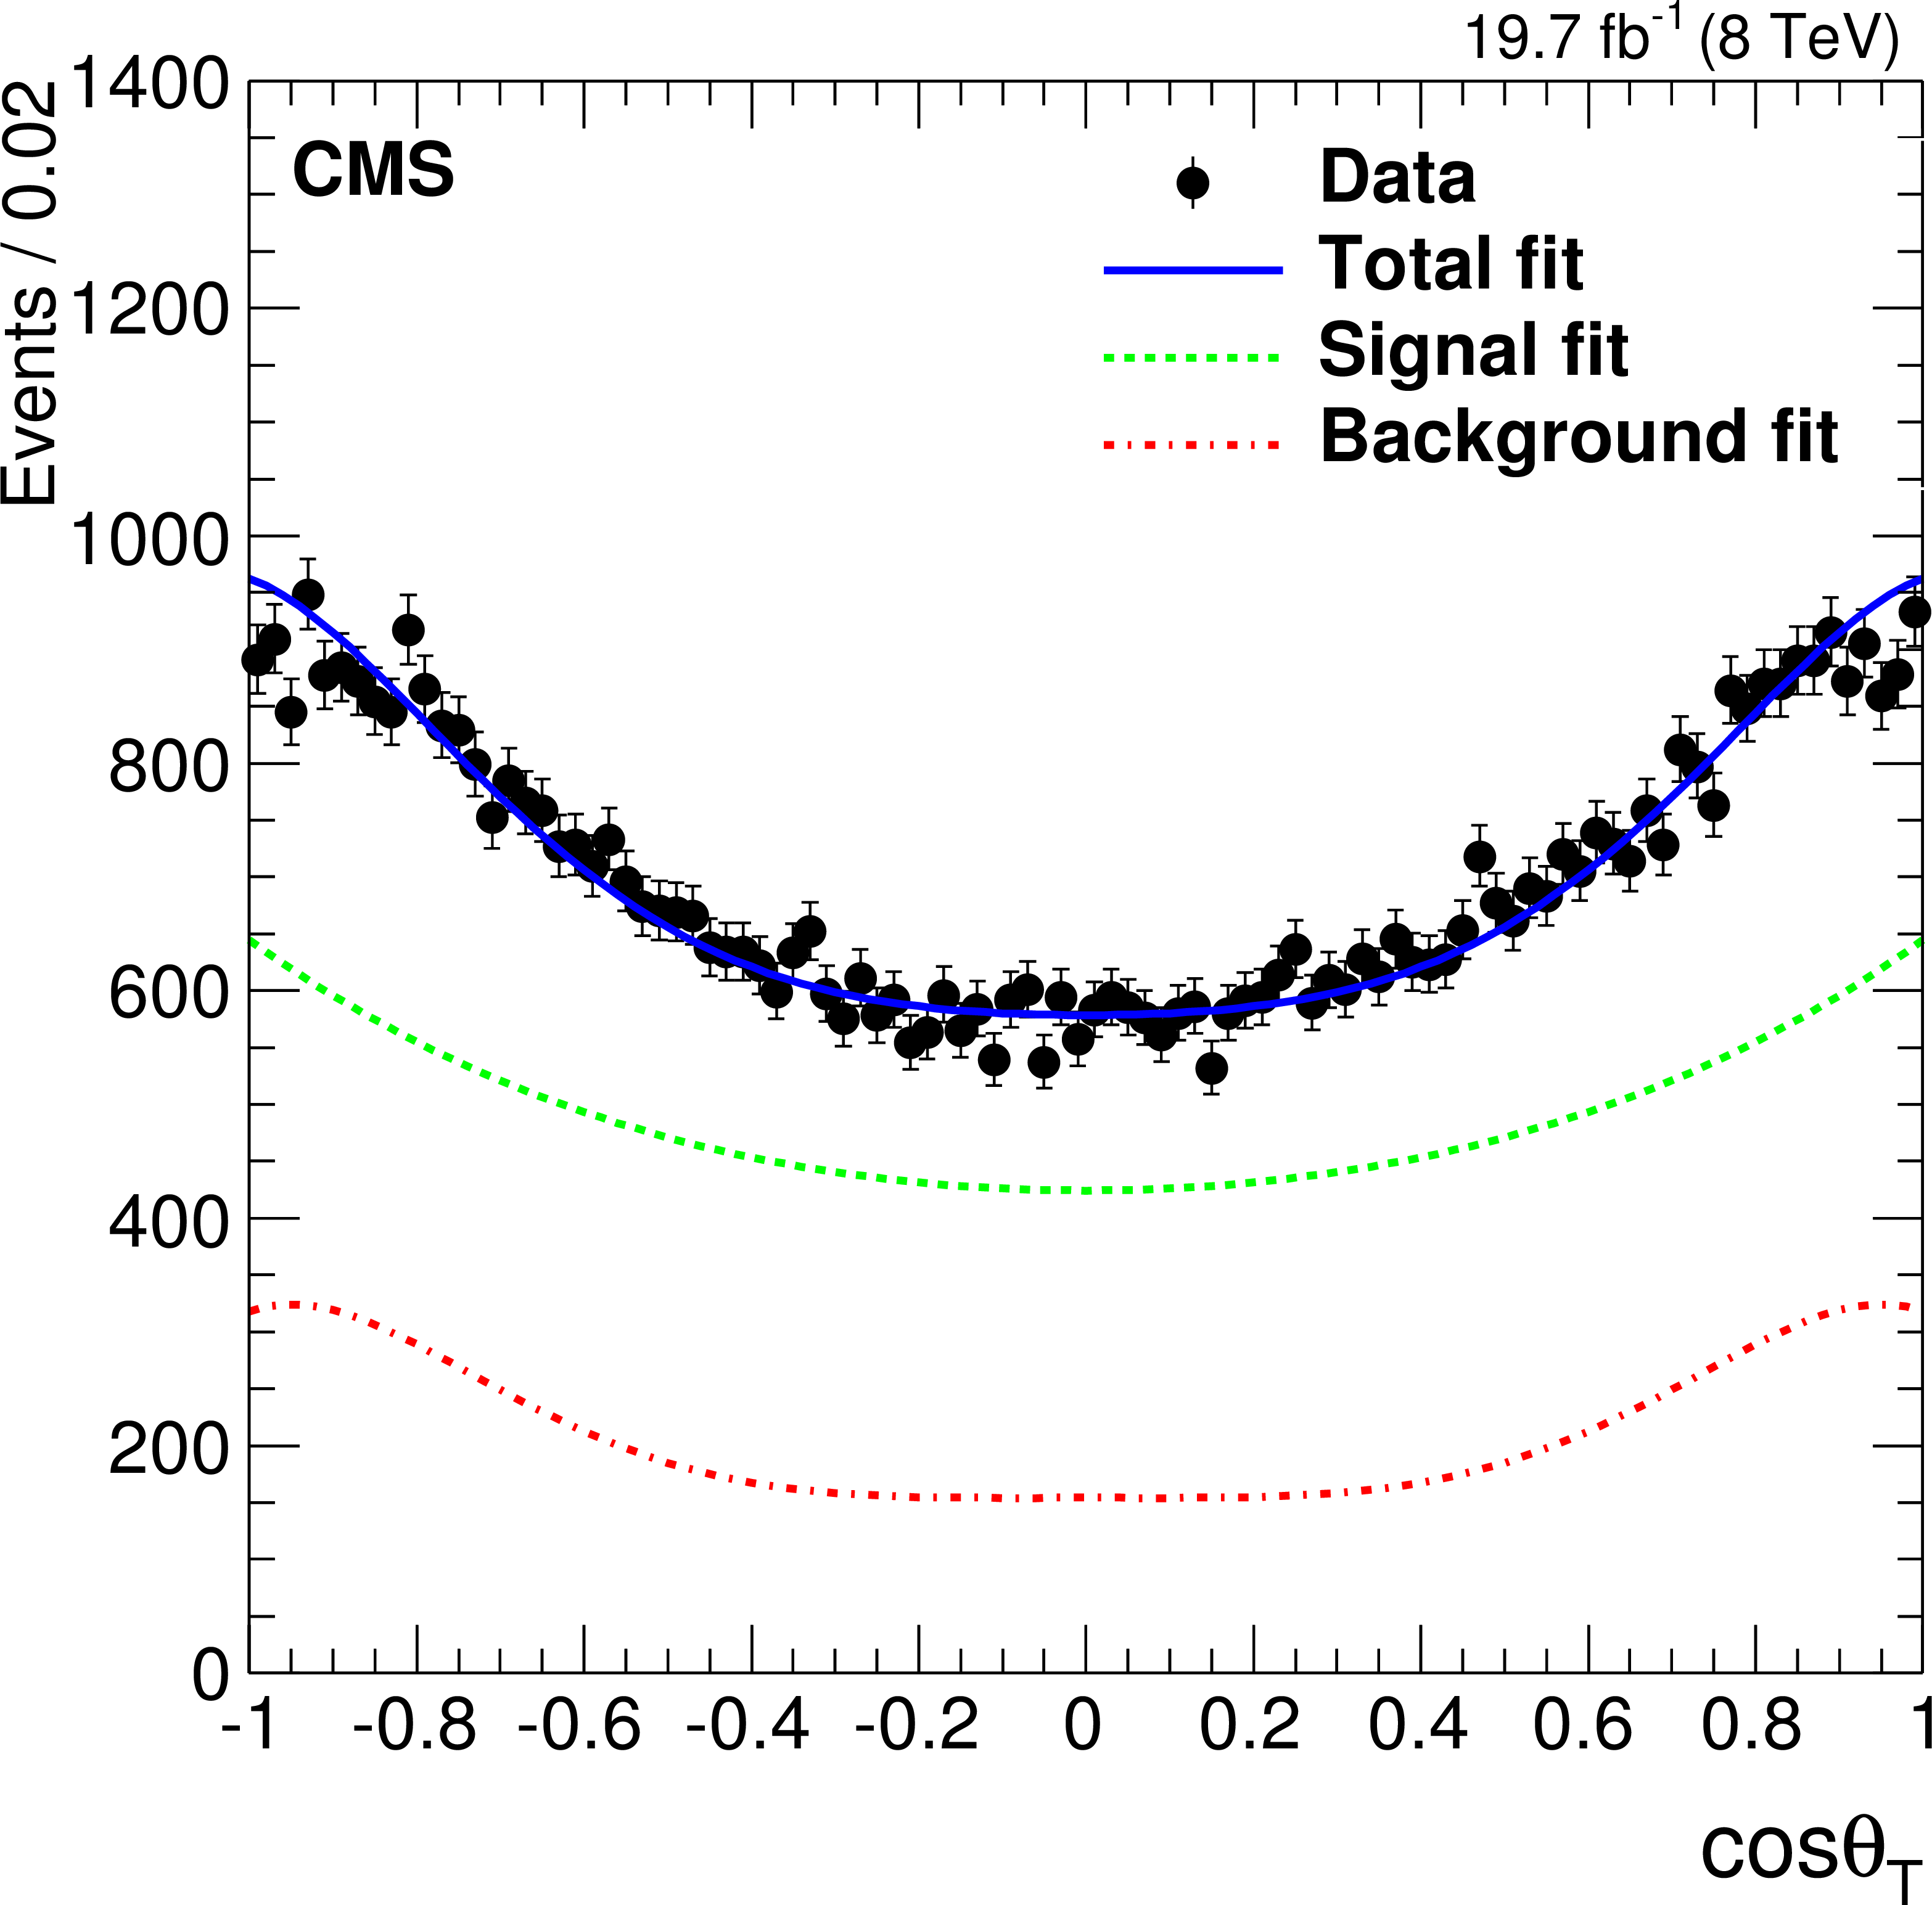
Figure 5-a:
The angular distributions ($\cos\theta _\mathrm {T}$, $\cos\psi _\mathrm {T}$, $\varphi _\mathrm {T}$) of the ${\mathrm {B}^0_s} $ candidates from data (solid markers). The solid line is the result of the fit, the dashed line is the signal component, and the dot-dashed line is the background component. |

png pdf |
Figure 5-b:
The angular distributions ($\cos\theta _\mathrm {T}$, $\cos\psi _\mathrm {T}$, $\varphi _\mathrm {T}$) of the ${\mathrm {B}^0_s} $ candidates from data (solid markers). The solid line is the result of the fit, the dashed line is the signal component, and the dot-dashed line is the background component. |
png pdf |
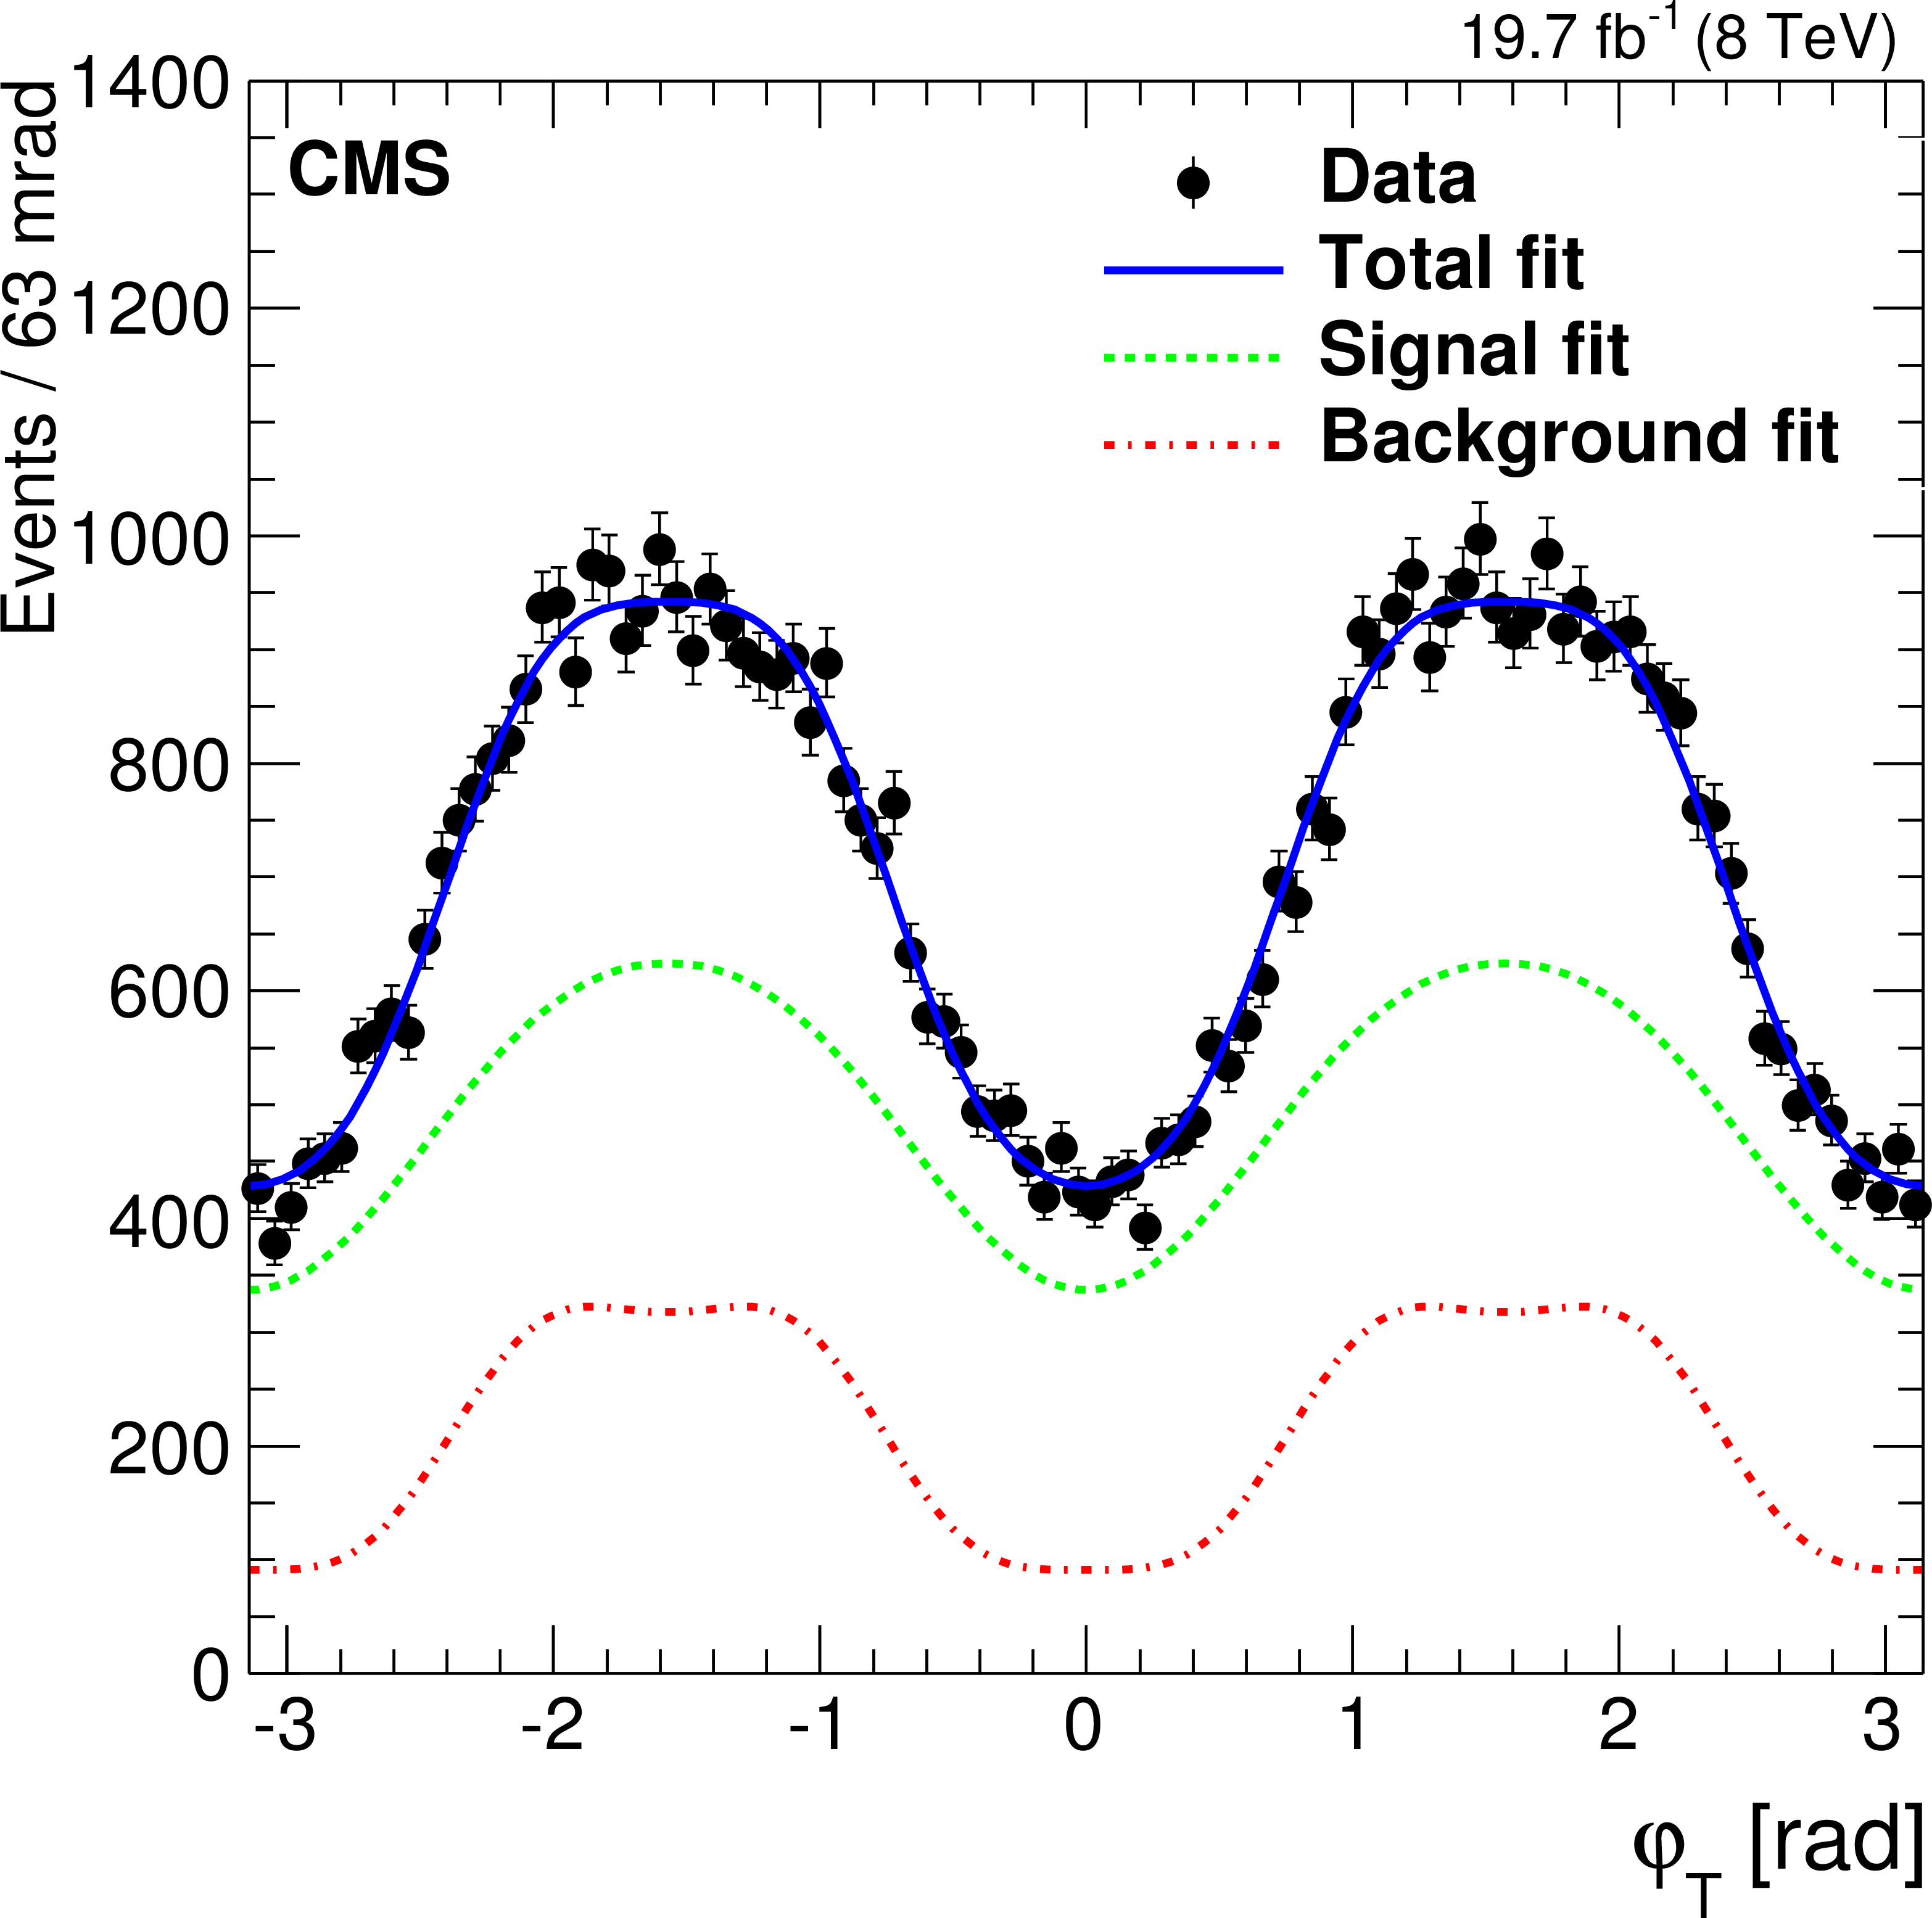
Figure 5-c:
The angular distributions ($\cos\theta _\mathrm {T}$, $\cos\psi _\mathrm {T}$, $\varphi _\mathrm {T}$) of the ${\mathrm {B}^0_s} $ candidates from data (solid markers). The solid line is the result of the fit, the dashed line is the signal component, and the dot-dashed line is the background component. |

png pdf |
Figure 6:
The CMS measured central value and the 68%, 90%, and 95% CL contours in the ${\Delta \Gamma _\mathrm {s}} $ versus $\phi _\mathrm {s}$ plane, together with the SM prediction [3,4]. Uncertainties are statistical only. |
| Tables | |

png pdf |
Table 1:
Angular and time-dependent terms of the signal model. |
png pdf |
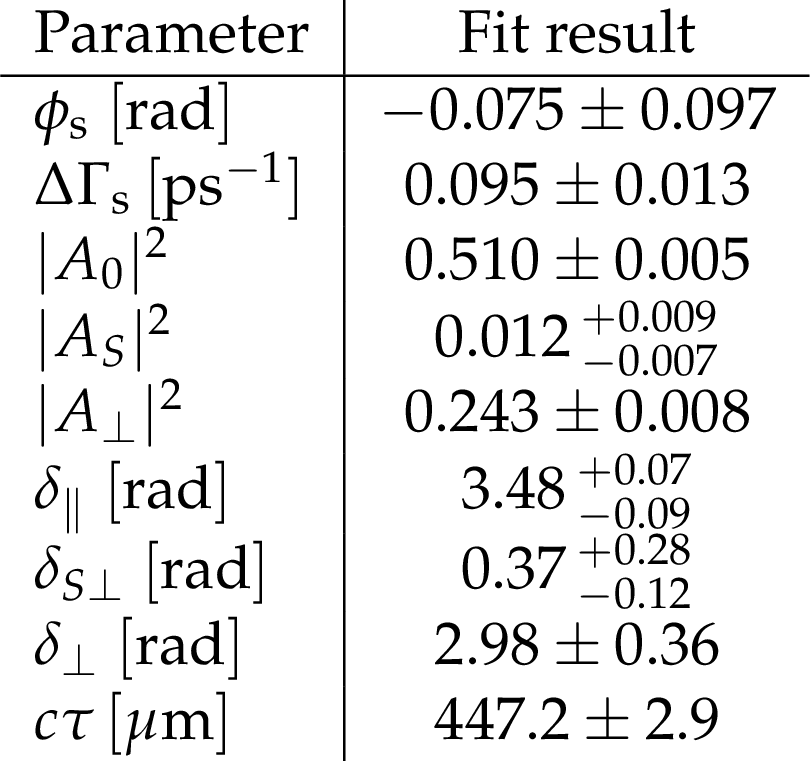
Table 2:
Results of the fit to the data. Uncertainties are statistical only. |
png pdf |
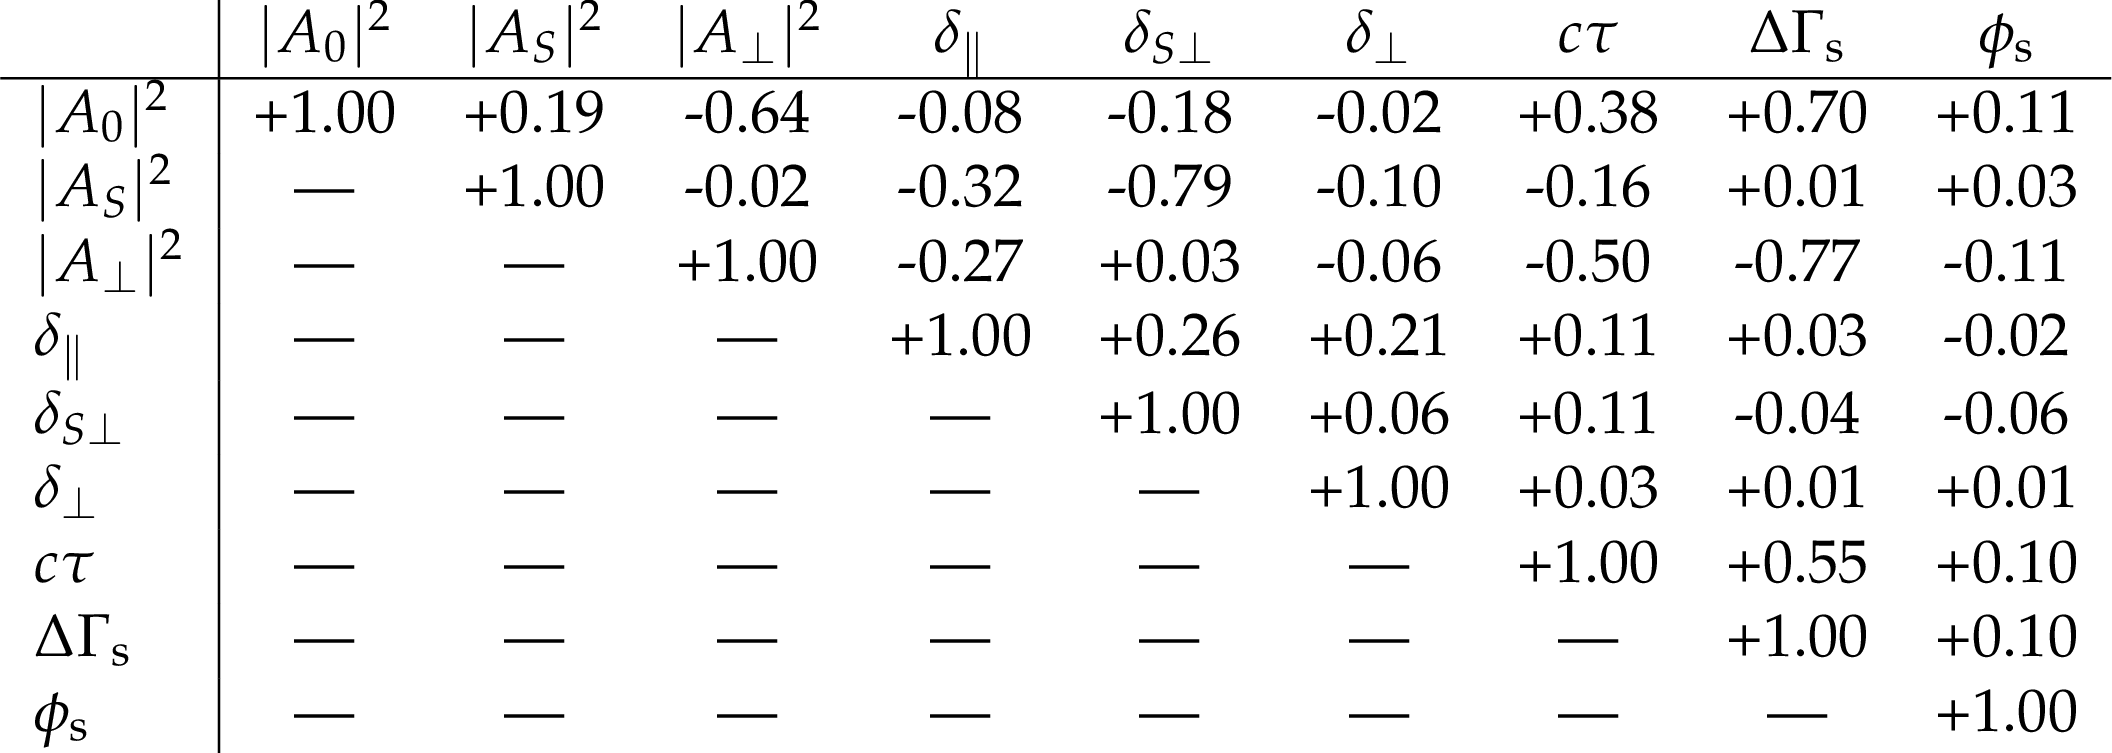
Table 3:
Correlation matrix for the statistical uncertainties in the physics fit parameters. |

png pdf |
Table 4:
Summary of the uncertainties in the measurements of the various ${\mathrm {B}^0_s} $ parameters. If no value is reported, then the systematic uncertainty is negligible with respect to the statistical and other systematic uncertainties. The total systematic uncertainty is the quadratic sum of the listed systematic uncertainties. |
| Summary |
|
Using pp collision data collected by the CMS experiment at a centre-of-mass energy of 8 TeV and corresponding to an integrated luminosity of 19.7 fb$^{-1}$, 49 200 $ {\mathrm{B}^0_s} \mathrm{ J } / \psi \phi $ signal candidates were used to measure the weak phase $\phi_\mathrm{s}$ and the decay width difference ${\Delta \Gamma_\mathrm{s}} $. The analysis was performed by using opposite-side lepton tagging of the $ {\mathrm{B}^0_s} $ flavour at the production time. Both muon and electron tags were used. The measured values for the weak phase and the decay width difference between the $ {\mathrm{B}^0_s} $ mass eigenstates are $\phi_\mathrm{s} = -0.075 \pm 0.097\mathrm{(stat)}\pm 0.031\mathrm{(syst)}$ rad and $\Delta\Gamma_\mathrm{s}= 0.095 \pm 0.013\mathrm{(stat)}\pm 0.007\mathrm{(syst)} $ ps$^{-1}$, respectively. The measured values are consistent with those obtained by the LHCb Collaboration using $ {\mathrm{B}^0_s} \to \mathrm{ J } / \psi\mathrm{ K }^+\mathrm{ K }^-$ decays [34]. Our measured value of $\phi_\mathrm{s}$ agrees with the SM prediction. Our result confirms ${\Delta \Gamma_\mathrm{s}} $ to be nonzero, with a value consistent with theoretical predictions. The uncertainties in our $\phi_\mathrm{s}$ and ${\Delta \Gamma_\mathrm{s}} $ measurements are dominated by statistical uncertainties. Our results provide independent reference measurements of $\phi_\mathrm{s}$ and ${\Delta \Gamma_\mathrm{s}} $, and contribute to improving the overall precision of these quantities and thereby probing the SM further. Since our measurement precision is still limited by statistical uncertainty, substantial improvement is expected from LHC $\sqrt{s} =$ 13 TeV high-luminosity running that will be available over the next few years. |
| References | ||||
| 1 | B. Bhattacharya, A. Datta, and D. London | Reducing penguin pollution | Int. J. Mod. Phys. A 28 (2013) 1350063 | |
| 2 | S. Faller, R. Fleischer, and T. Mannel | Precision Physics with $ B^0_s \to J/\psi \phi $ at the LHC: The Quest for New Physics | PRD 79 (2009) 014005 | 0810.4248 |
| 3 | J. Charles et al. | Predictions of selected flavour observables within the standard model | PRD 84 (2011) 033005 | 1106.4041 |
| 4 | A. Lenz and U. Nierste | Numerical updates of lifetimes and mixing parameters of B mesons | 1102.4274 | |
| 5 | CDF Collaboration | First Flavor-Tagged Determination of Bounds on Mixing-Induced CP Violation in $ \mathrm{B^0_{s}} \to \mathrm{J}/\psi \phi $ Decays | PRL 100 (2008) 161802 | 0712.2397 |
| 6 | D0 Collaboration | Measurement of $ \mathrm{B^0_{s}} $ Mixing Parameters from the Flavor-Tagged Decay $ \mathrm{B^0_{s}} \to \mathrm{J}/\psi \phi $ | PRL 101 (2008) 241801 | 0802.2255 |
| 7 | CDF Collaboration | Measurement of the CP-violating phase $ \beta_{\mathrm{s}}^{\mathrm{J}/\psi\phi} $ in $ \mathrm{B^0_s} \to \mathrm{J}/\psi \phi $ decays with the CDF II detector | PRD 85 (2012) 072002 | 1112.1726 |
| 8 | D0 Collaboration | Measurement of the CP-violating phase $ \phi_{\mathrm{s}}^{\mathrm{J}/\psi \phi} $ using the flavor-tagged decay $ \mathrm{B_s^0} \rightarrow \mathrm{J}/\psi \phi $ in 8 fb$ ^{-1} $ of p$ \overline{\textrm{p}} $ collisions | PRD 85 (2012) 032006 | 1109.3166 |
| 9 | LHCb Collaboration | Measurement of the CP-violating phase $ \phi_{\mathrm{s}} $ in $ \mathrm{\overline{B}_s^0}\to \mathrm{J}/\psi\pi^+\pi^- $ decays | PLB 736 (2014) 186 | 1405.4140 |
| 10 | LHCb Collaboration | Measurement of CP violation and the $ \mathrm{B_s^0} $ meson decay width difference with $ \mathrm{B_s^0} \to \mathrm{J}/\psi \mathrm{K}^+\mathrm{K}^- $ and $ \mathrm{B_s^0}\to \mathrm{J}/\psi\pi^+\pi^- $ decays | PRD 87 (2013) 112010 | 1304.2600 |
| 11 | LHCb Collaboration | Measurement of the CP-violating phase $ \phi_{\mathrm{s}} $ in $ \mathrm{\overline{B}^0_s} \to \mathrm{J}/\psi\pi^+\pi^- $ decays | PLB 713 (2012) 378 | 1204.5675 |
| 12 | ATLAS Collaboration | Time-dependent angular analysis of the decay $ \mathrm{B_{s}^{0}} \to \mathrm{J}/{\psi\phi} $ and extraction of $ \Delta\Gamma_{\mathrm{s}} $ and the CP-violating weak phase $ \phi_{\mathrm{s}} $ by ATLAS | JHEP 12 (2012) 072 | 1208.0572 |
| 13 | ATLAS Collaboration | Flavor tagged time-dependent angular analysis of the $ \mathrm{{B}_{s}^{0}} {\rightarrow}\mathrm{J}/ {\psi} {\phi} $ decay and extraction of $ \Delta\Gamma_{\mathrm{s}} $ and the weak phase $ \phi_{\mathrm{s}} $ in ATLAS | PRD 90 (2014) 052007 | |
| 14 | A. S. Dighe, I. Dunietz, and R. Fleischer | Extracting CKM phases and $ \mathrm{B^0_s} - \mathrm{\bar{B}_s} $ mixing parameters from angular distributions of non-leptonic B decays | EPJC 6 (1999) 647 | hep-ph/9804253 |
| 15 | A. S. Dighe, I. Dunietz, H. J. Lipkin, and J. L. Rosner | Angular distributions and lifetime differences in $ \mathrm{B^0_s} \to \mathrm{J}/\psi \phi $ decays | PLB 369 (1996) 144 | hep-ph/9511363 |
| 16 | G. Branco, L. Lavoura, and J. Silva | CP violation | Clarendon Press, Oxford, 1999. Int. Ser. Monogr. Phys. (103) | |
| 17 | LHCb Collaboration | Measurement of the flavour-specific CP-violating asymmetry $ a_{sl}^s $ in $ \mathrm{B_s^0} $ decays | PLB 728 (2014) 607 | 1308.1048 |
| 18 | CMS Collaboration | Description and performance of track and primary-vertex reconstruction with the CMS tracker | JINST 9 (2014) P10009 | CMS-TRK-11-001 1405.6569 |
| 19 | CMS Collaboration | Performance of CMS muon reconstruction in $ \textrm{pp} $ collision events at $ \sqrt{s}=7 $ TeV | JINST 7 (2012) P10002 | CMS-MUO-10-004 1206.4071 |
| 20 | CMS Collaboration | The CMS experiment at the CERN LHC | JINST 3 (2008) S08004 | CMS-00-001 |
| 21 | Particle Data Group, K. A. Olive et al. | Review of Particle Physics | CPC 38 (2014) 090001 | |
| 22 | T. Sj\"ostrand, S. Mrenna, and P. Z. Skands | PYTHIA 6.4 physics and manual | JHEP 05 (2006) 026 | hep-ph/0603175 |
| 23 | D. J. Lange | The EvtGen particle decay simulation package | NIMA 462 (2001) 152 | |
| 24 | E. Barberio, B. van Eijk, and Z. Was | PHOTOS -- a universal Monte Carlo for QED radiative corrections in decays | Comp. Phys. Commun. 66 (1991) 115 | |
| 25 | E. Barberio and Z. W\cas | PHOTOS -- a universal Monte Carlo for QED radiative corrections: version 2.0 | Comp. Phys. Commun. 79 (1994) 291 | |
| 26 | GEANT4 Collaboration | GEANT4---a simulation toolkit | NIMA 506 (2003) 250 | |
| 27 | CMS Collaboration | Particle--Flow Event Reconstruction in CMS and Performance for Jets, Taus, and \MET | CDS | |
| 28 | CMS Collaboration | Commissioning of the Particle-flow Event Reconstruction with the first LHC collisions recorded in the CMS detector | CDS | |
| 29 | H. Voss, A. H\"ocker, J. Stelzer, and F. Tegenfeldt | TMVA, the Toolkit for Multivariate Data Analysis with ROOT | link | physics/0703039 |
| 30 | I. Antcheva et al. | ROOT --- A C++ framework for petabyte data storage, statistical analysis and visualization | Comp. Phys. Commun. 180 (2009) 2499 | |
| 31 | LHCb Collaboration | Determination of the Sign of the Decay Width Difference in the $ \mathrm{{B}_{s}^{0}} $ System | PRL 108 (2012) 241801 | 1202.4717 |
| 32 | Particle Data Group, J. Beringer et al. | Review of Particle Physics | PRD 86 (2012) 010001 | |
| 33 | CMS Collaboration | Measurement of the $ \Lambda^0_\mathrm{b} $ lifetime in pp collisions at $ \sqrt{s} = $ 7 TeV | JHEP 07 (2013) 163 | CMS-BPH-11-001 1302.3968 |
| 34 | LHCb Collaboration | Precision Measurement of CP Violation in $ \mathrm{{B}_{s}^{0}} {\rightarrow}\mathrm{J}/\psi\mathrm{\mathrm{K}^{+}\mathrm{K}^{-}} $ Decays | PRL 114 (2015) 041801 | 1411.3104 |
|
|
Compact Muon Solenoid LHC, CERN |
|

|

|

|

|

|