

Compact Muon Solenoid
LHC, CERN
| CMS-EWK-11-021 ; CERN-PH-EP-2013-001 | ||
| Event shapes and azimuthal correlations in Z + jets events in pp collisions at $\sqrt{s}$ =7 TeV | ||
| CMS Collaboration | ||
| 9 January 2013 | ||
| Phys. Lett. B 722 (2013) 238 | ||
| Abstract: Measurements of event shapes and azimuthal correlations are presented for events where a Z boson is produced in association with jets in proton-proton collisions. The data collected with the CMS detector at the CERN LHC at $\sqrt{s}$ = 7 TeV correspond to an integrated luminosity of 5.0 inverse femtobarns. The analysis provides a test of predictions from perturbative QCD for a process that represents a substantial background to many physics channels. Results are presented as a function of jet multiplicity, for inclusive Z boson production and for Z bosons with transverse momenta greater than 150 GeV, and compared to predictions from Monte Carlo event generators that include leading-order multiparton matrix-element (with up to four hard partons in the final state) and next-to-leading-order simulations of Z + 1-jet events. The experimental results are corrected for detector effects, and can be compared directly with other QCD models. | ||
| Links: e-print arXiv:1301.1646 [hep-ex] (PDF) ; CDS record ; inSPIRE record ; Public twiki page ; Rivet record ; HepData record ; CADI line (restricted) ; | ||
| Figures | |
png pdf |
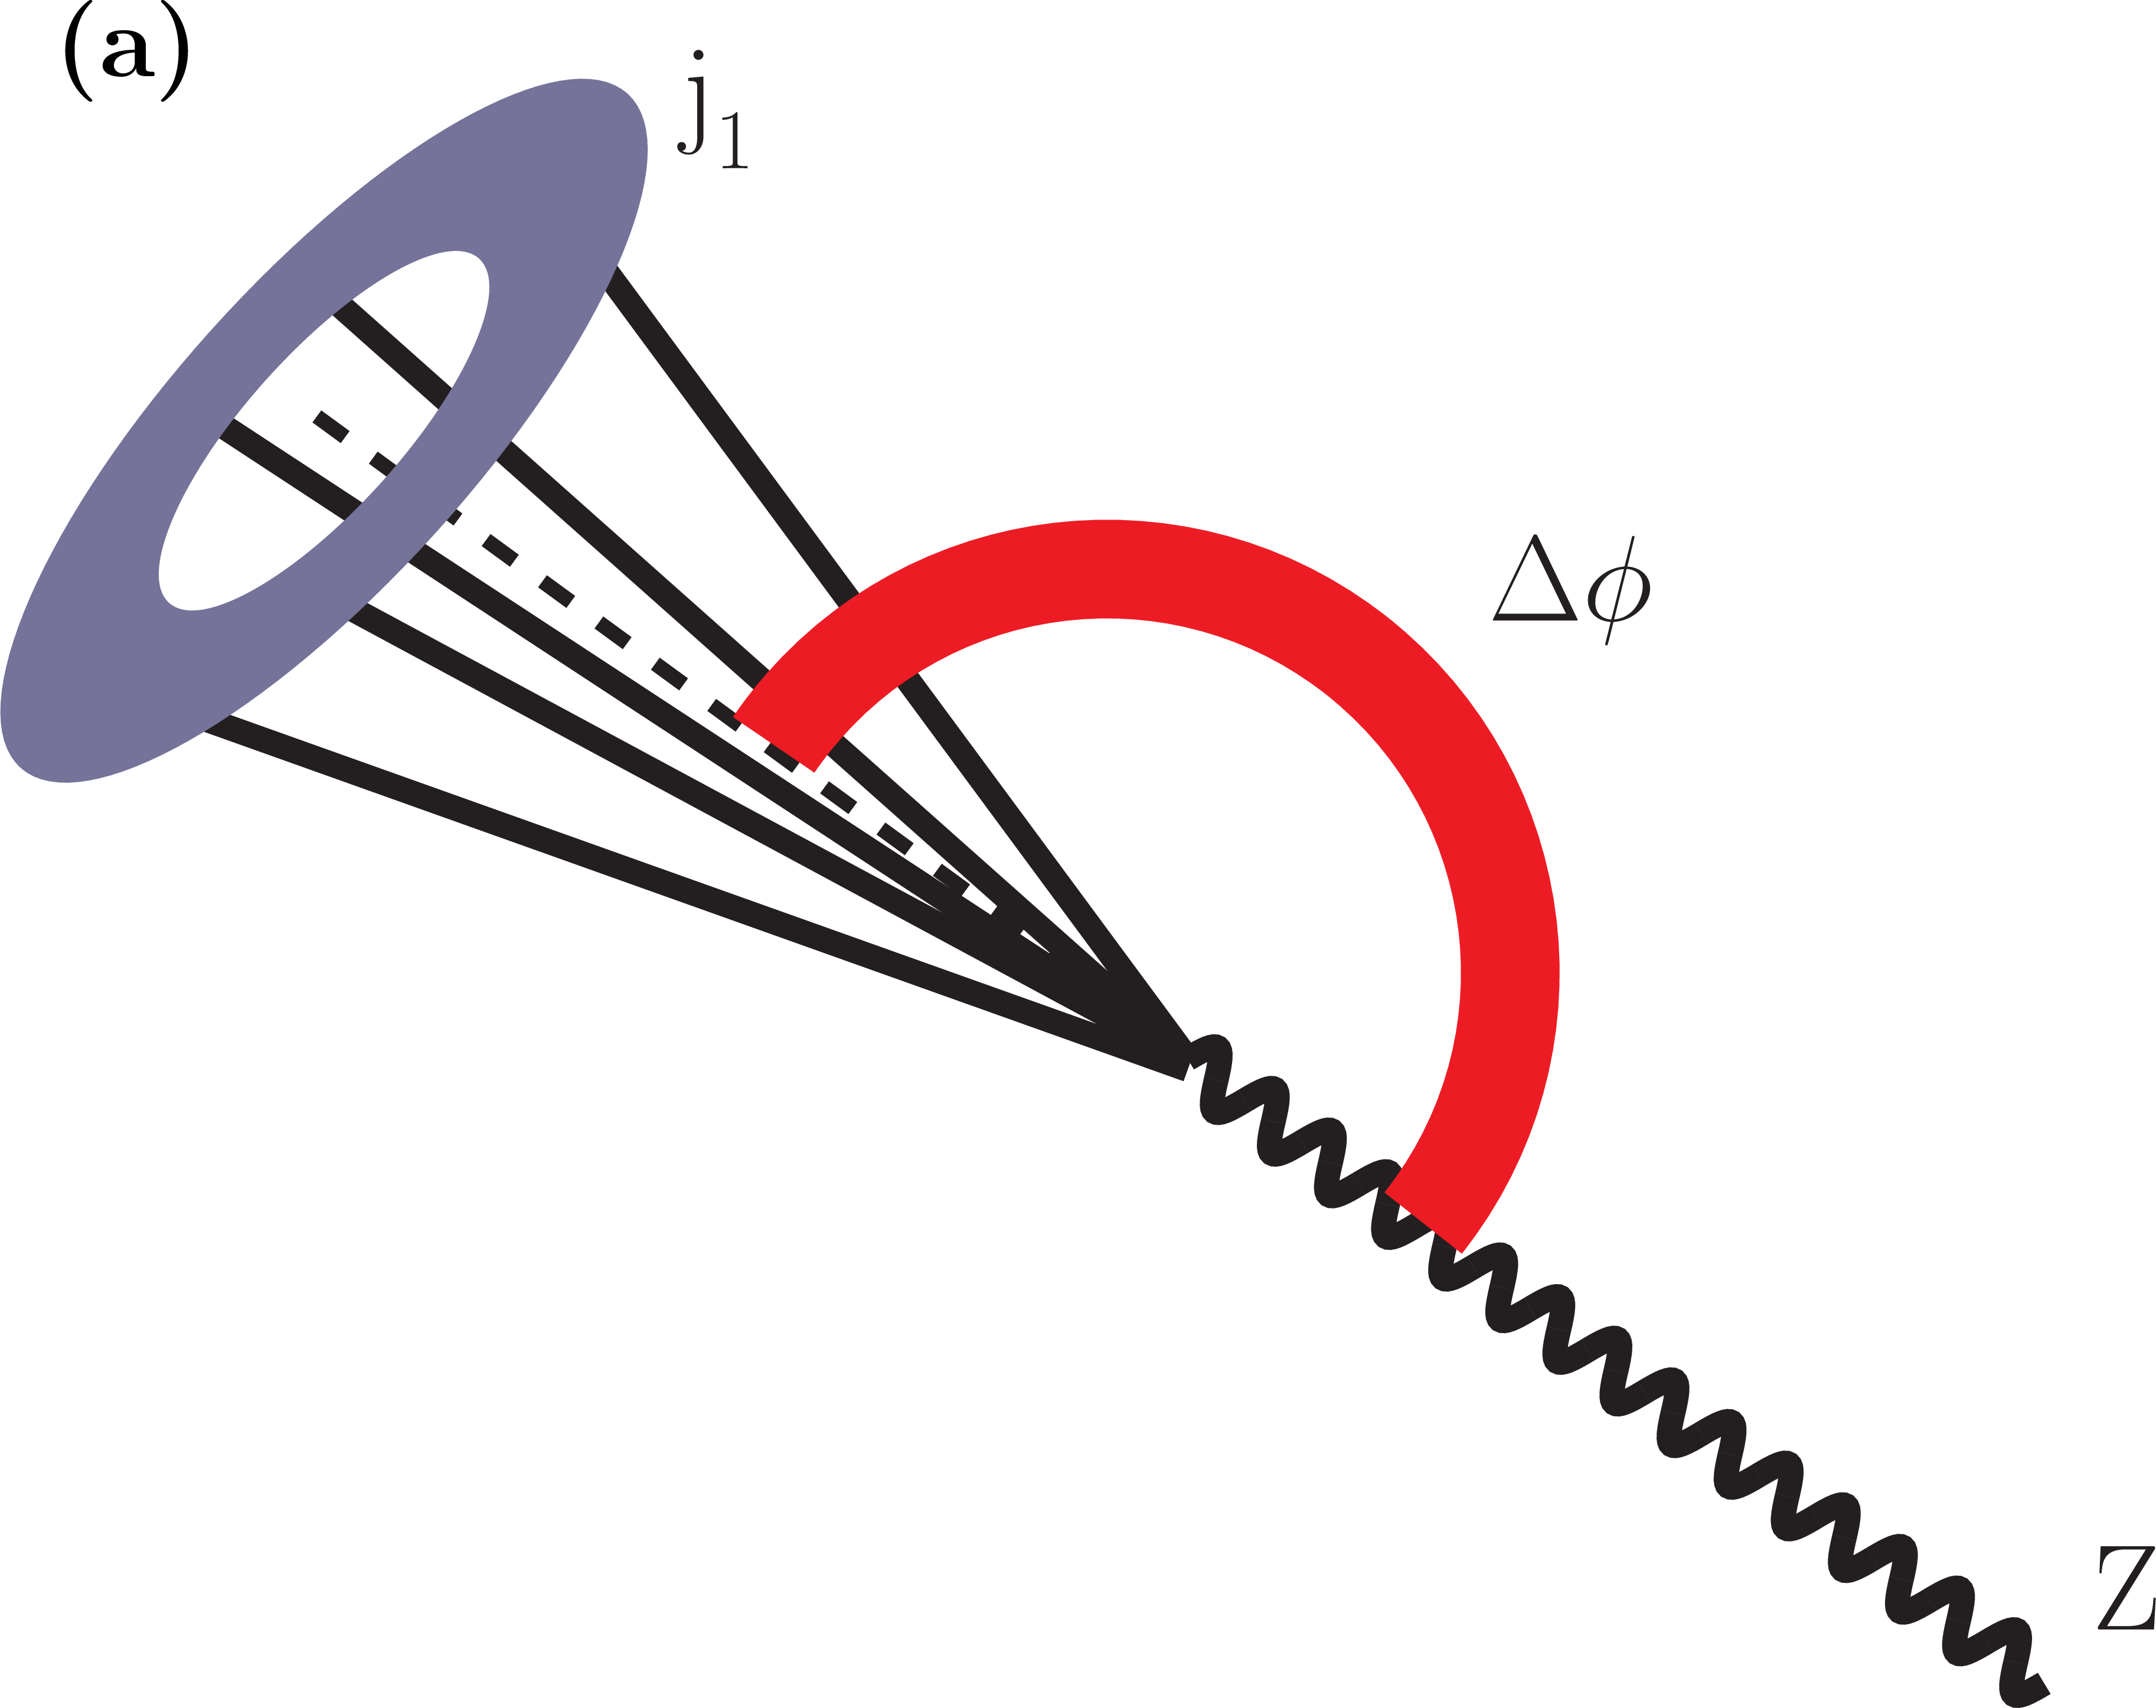
Figure 1-a:
Topology of Z+jets events: (a) for $\ln\tau _\mathrm {T}\rightarrow -\infty $ and $\Delta \phi (\mathrm{ Z } ,j_1)\rightarrow \pi $; (b) for $\ln\tau _\mathrm {T}\rightarrow -1$ and $\Delta \phi (\mathrm{ Z } ,j_1) \ll \pi $. |
png pdf |
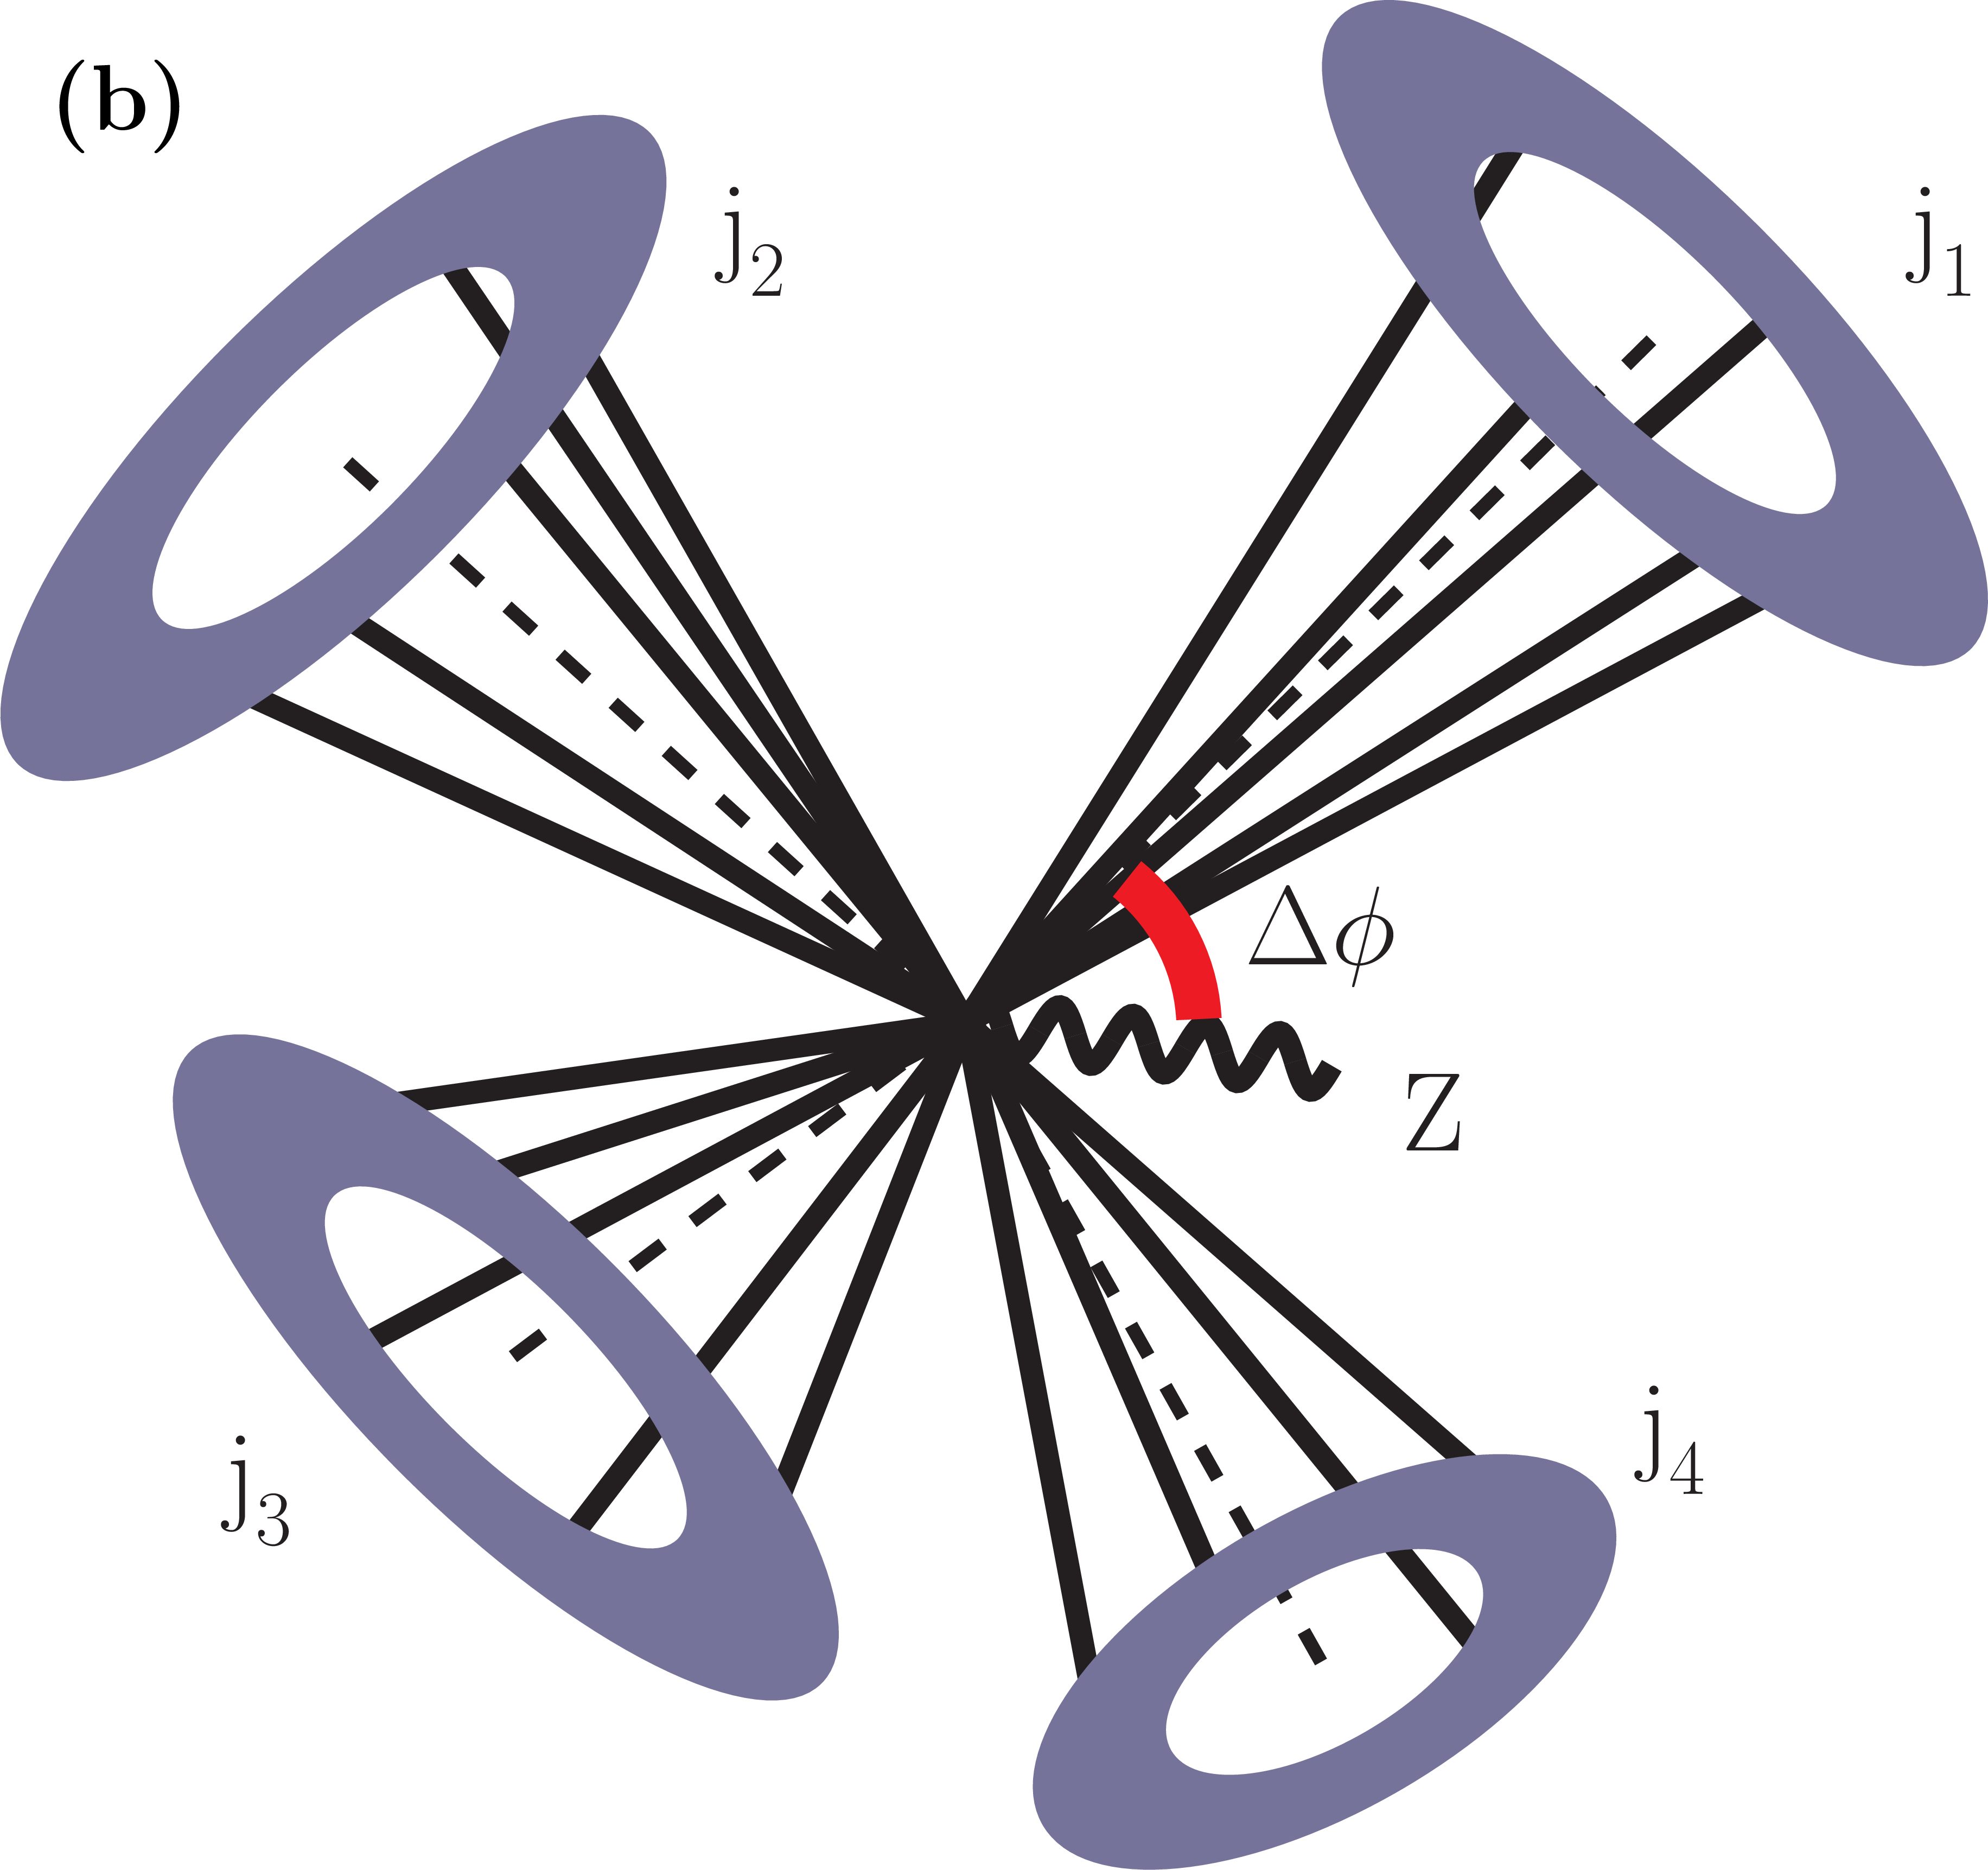
Figure 1-b:
Topology of Z+jets events: (a) for $\ln\tau _\mathrm {T}\rightarrow -\infty $ and $\Delta \phi (\mathrm{ Z } ,j_1)\rightarrow \pi $; (b) for $\ln\tau _\mathrm {T}\rightarrow -1$ and $\Delta \phi (\mathrm{ Z } ,j_1) \ll \pi $. |
png pdf |
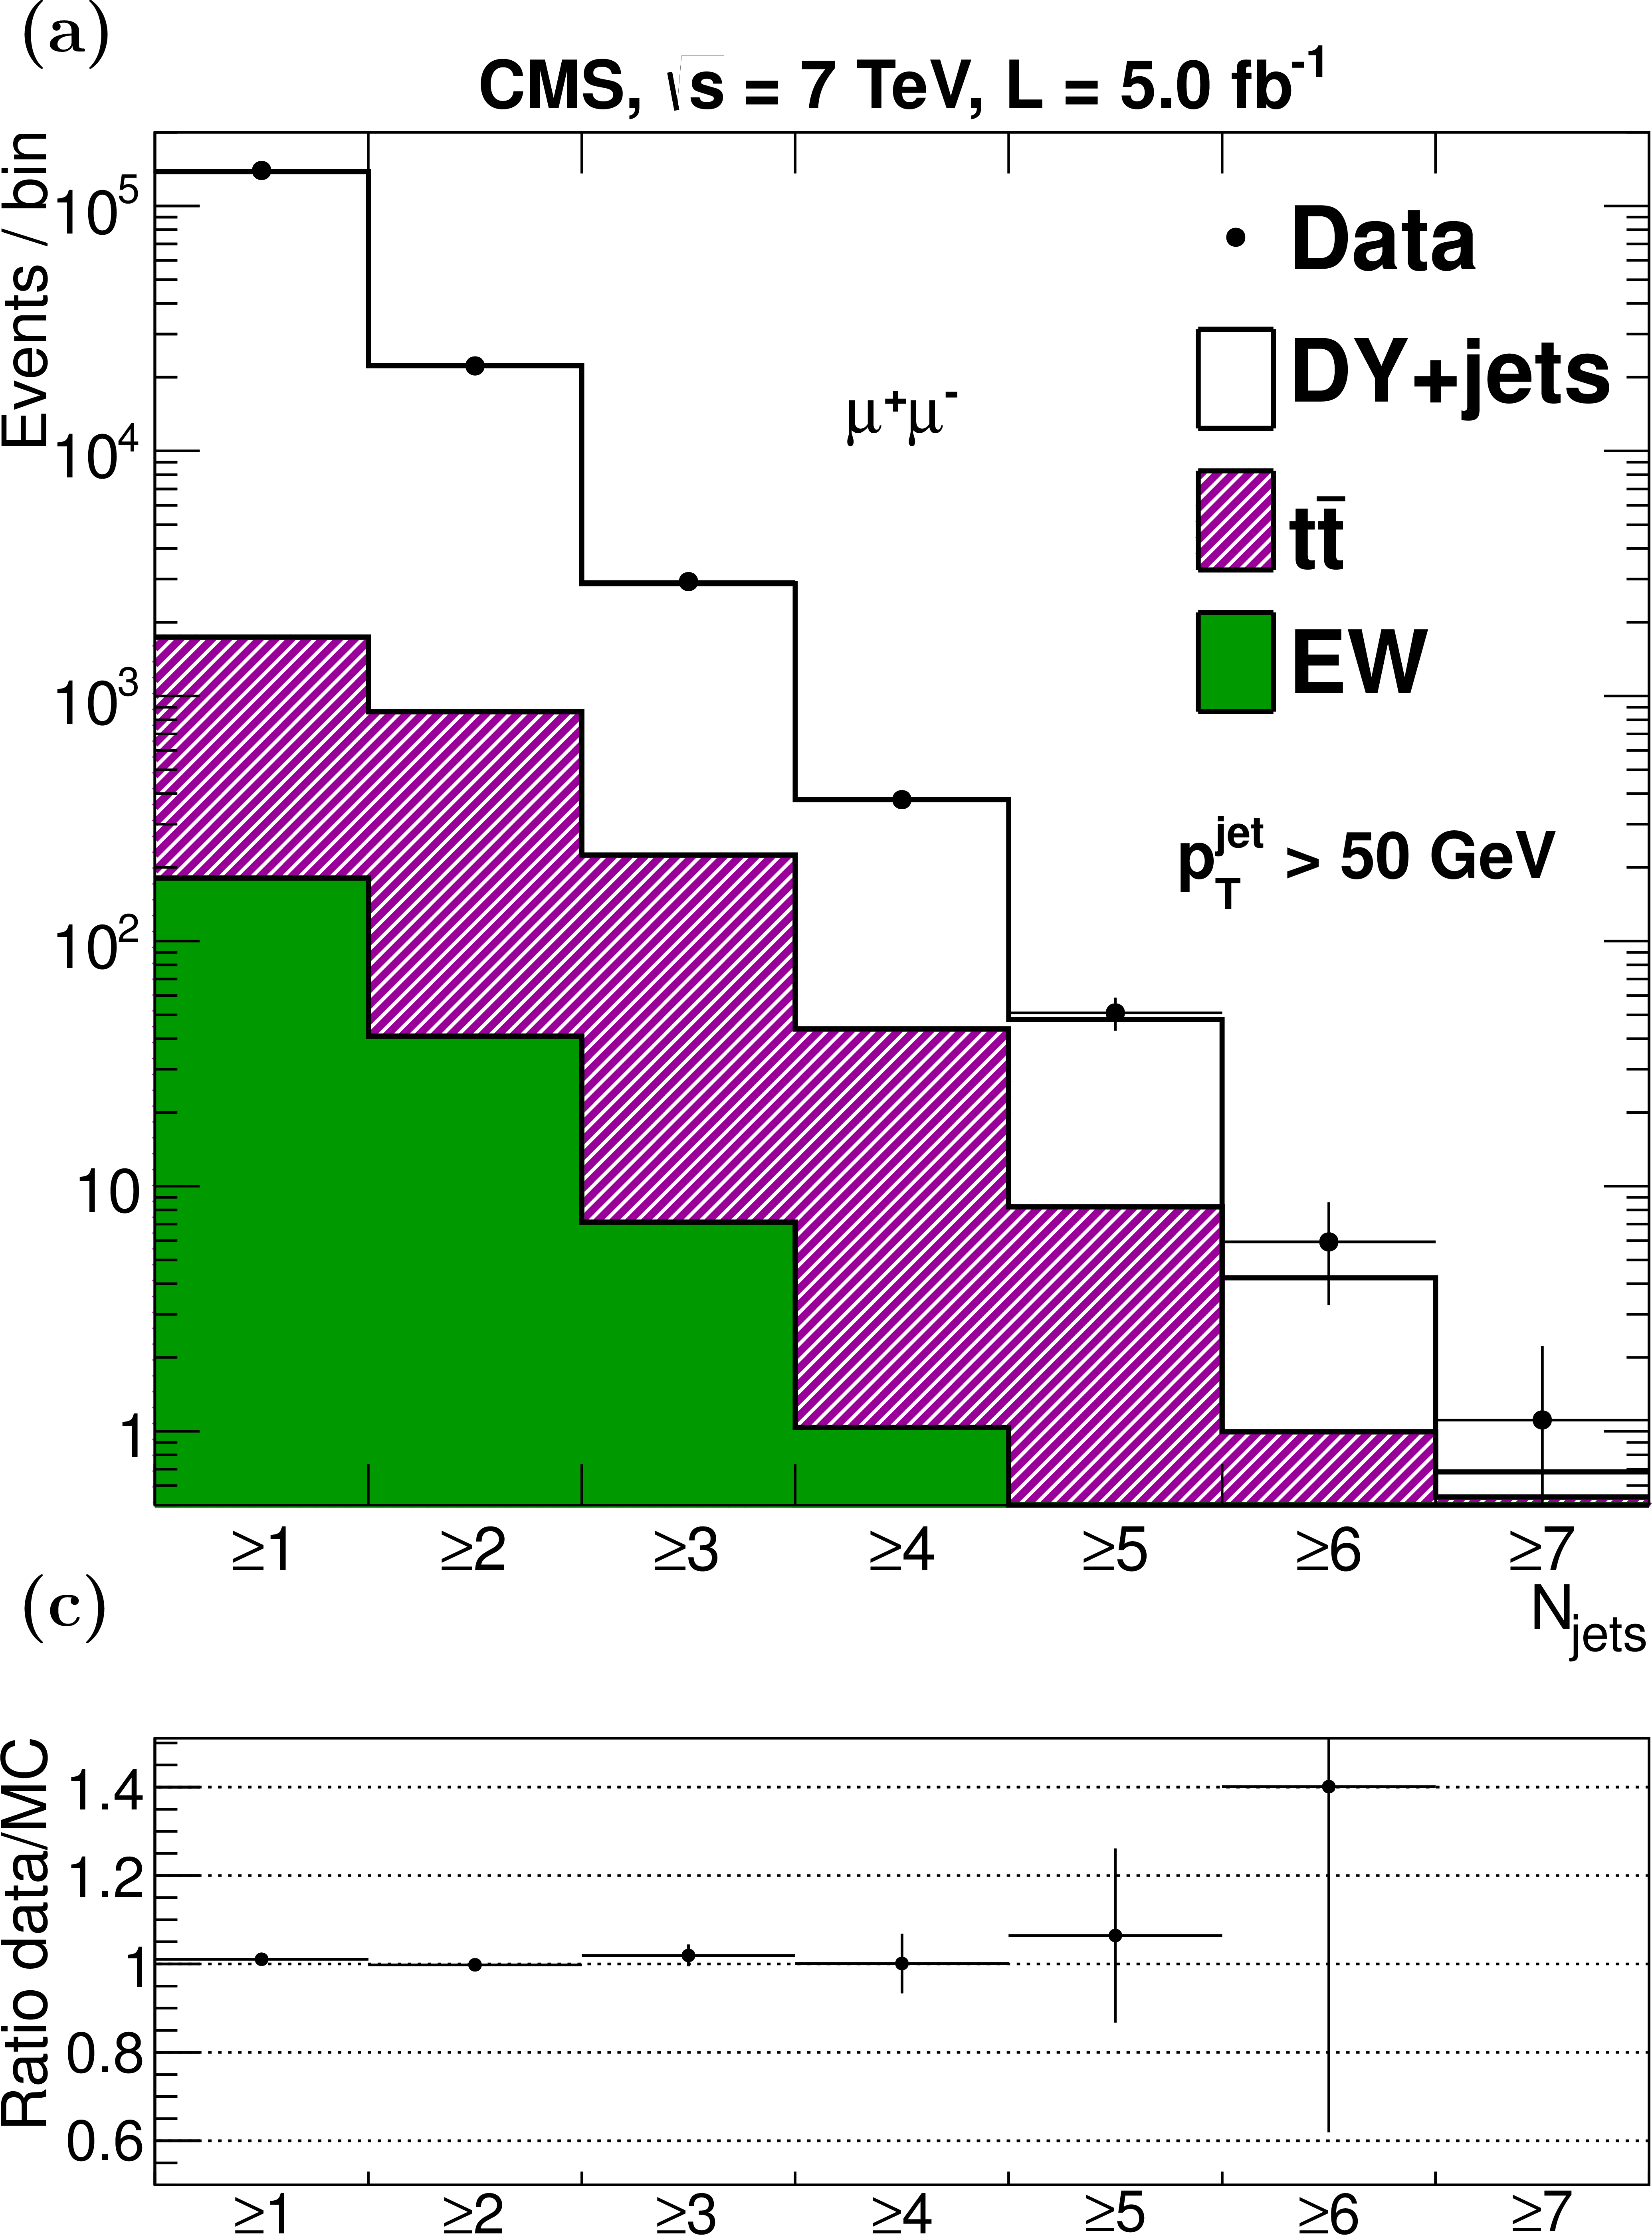
Figure 2-a:
Distributions for $ \mathrm{ Z } {\rightarrow \mu \mu } $ candidate events in data, compared with expectations from simulated signal and background contributions using MadGraph simulations normalized to the integrated luminosity of the data: (a) as a function of associated jet multiplicity $N_ {\text {jets}} $, and (b) as a function of $ {p_{\mathrm {T}}} $ of the dimuon pair ${ {( {p_{\mathrm {T}}} ^{\mu \mu })} }$ for ${N_ {\text {jets}} \geq 1}$. The dibosons WW, WZ, ZZ and W+jets backgrounds are collectively denoted as EW in the legends. The plots in (c) and (d) show the ratios of the data to predictions from MC. The error bars on the data points represent only their statistical uncertainties and do not include systematic effects. |

png pdf |
Figure 2-b:
Distributions for $ \mathrm{ Z } {\rightarrow \mu \mu } $ candidate events in data, compared with expectations from simulated signal and background contributions using MadGraph simulations normalized to the integrated luminosity of the data: (a) as a function of associated jet multiplicity $N_ {\text {jets}} $, and (b) as a function of $ {p_{\mathrm {T}}} $ of the dimuon pair ${ {( {p_{\mathrm {T}}} ^{\mu \mu })} }$ for ${N_ {\text {jets}} \geq 1}$. The dibosons WW, WZ, ZZ and W+jets backgrounds are collectively denoted as EW in the legends. The plots in (c) and (d) show the ratios of the data to predictions from MC. The error bars on the data points represent only their statistical uncertainties and do not include systematic effects. |
png pdf |
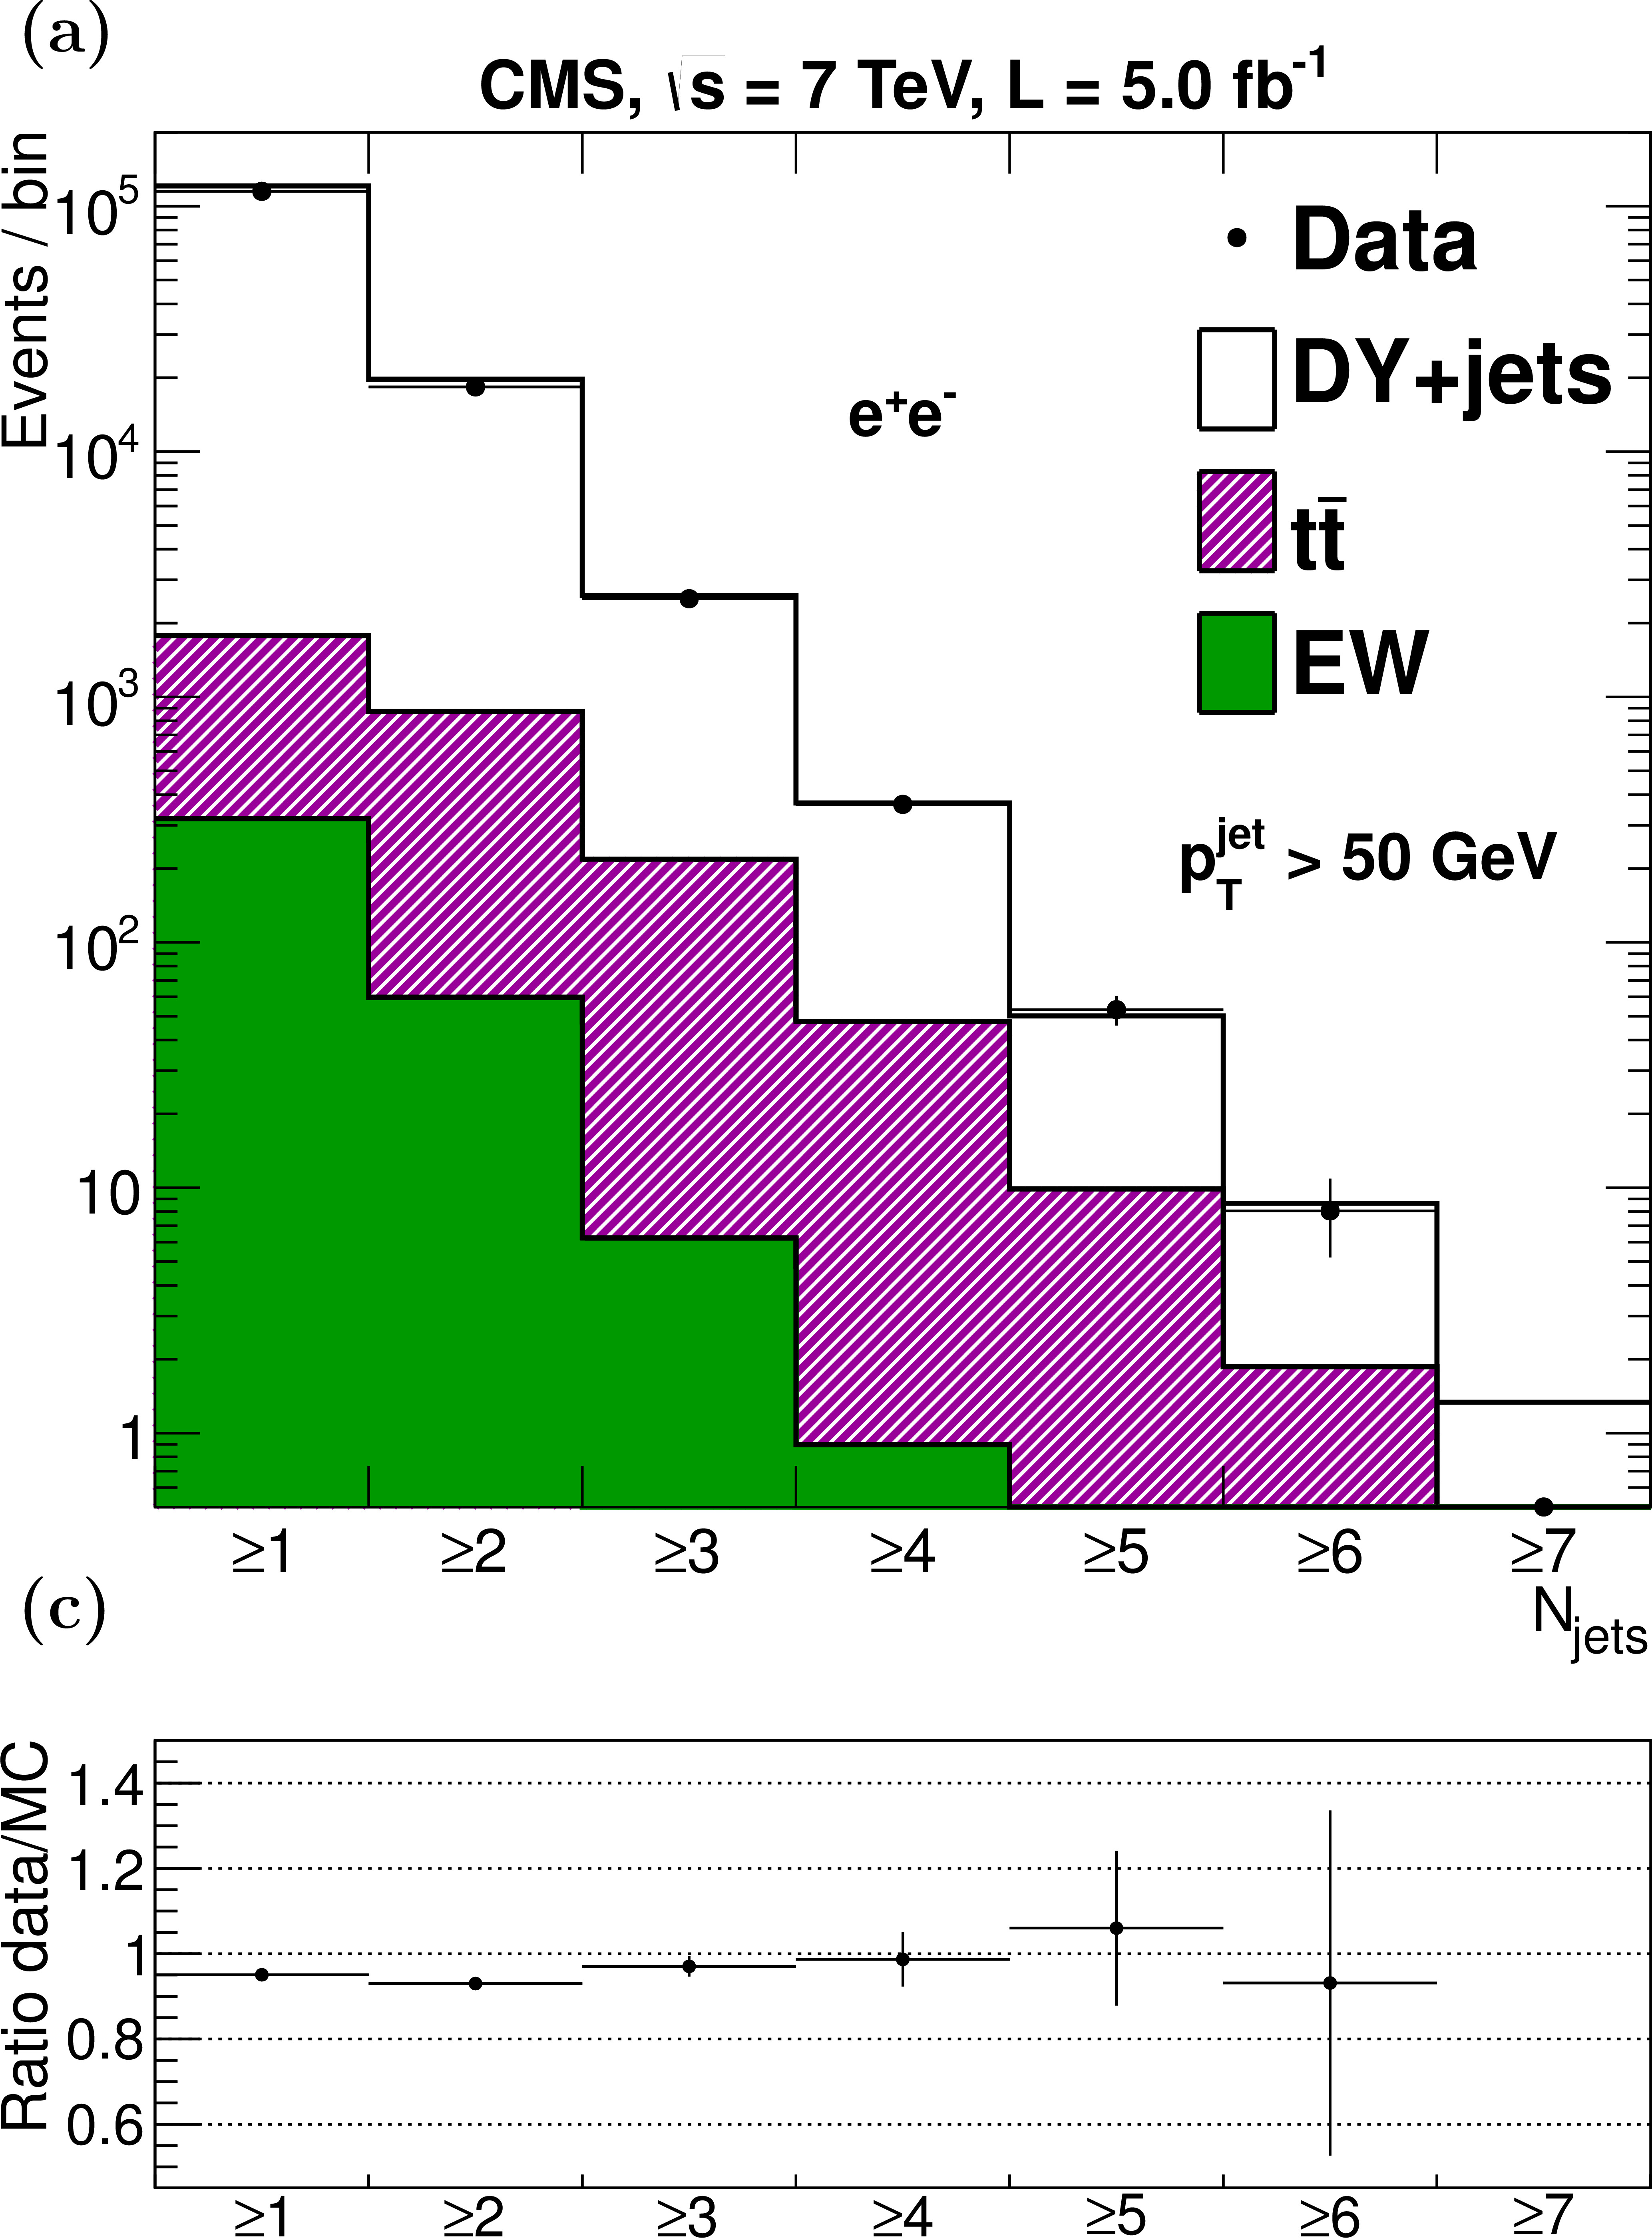
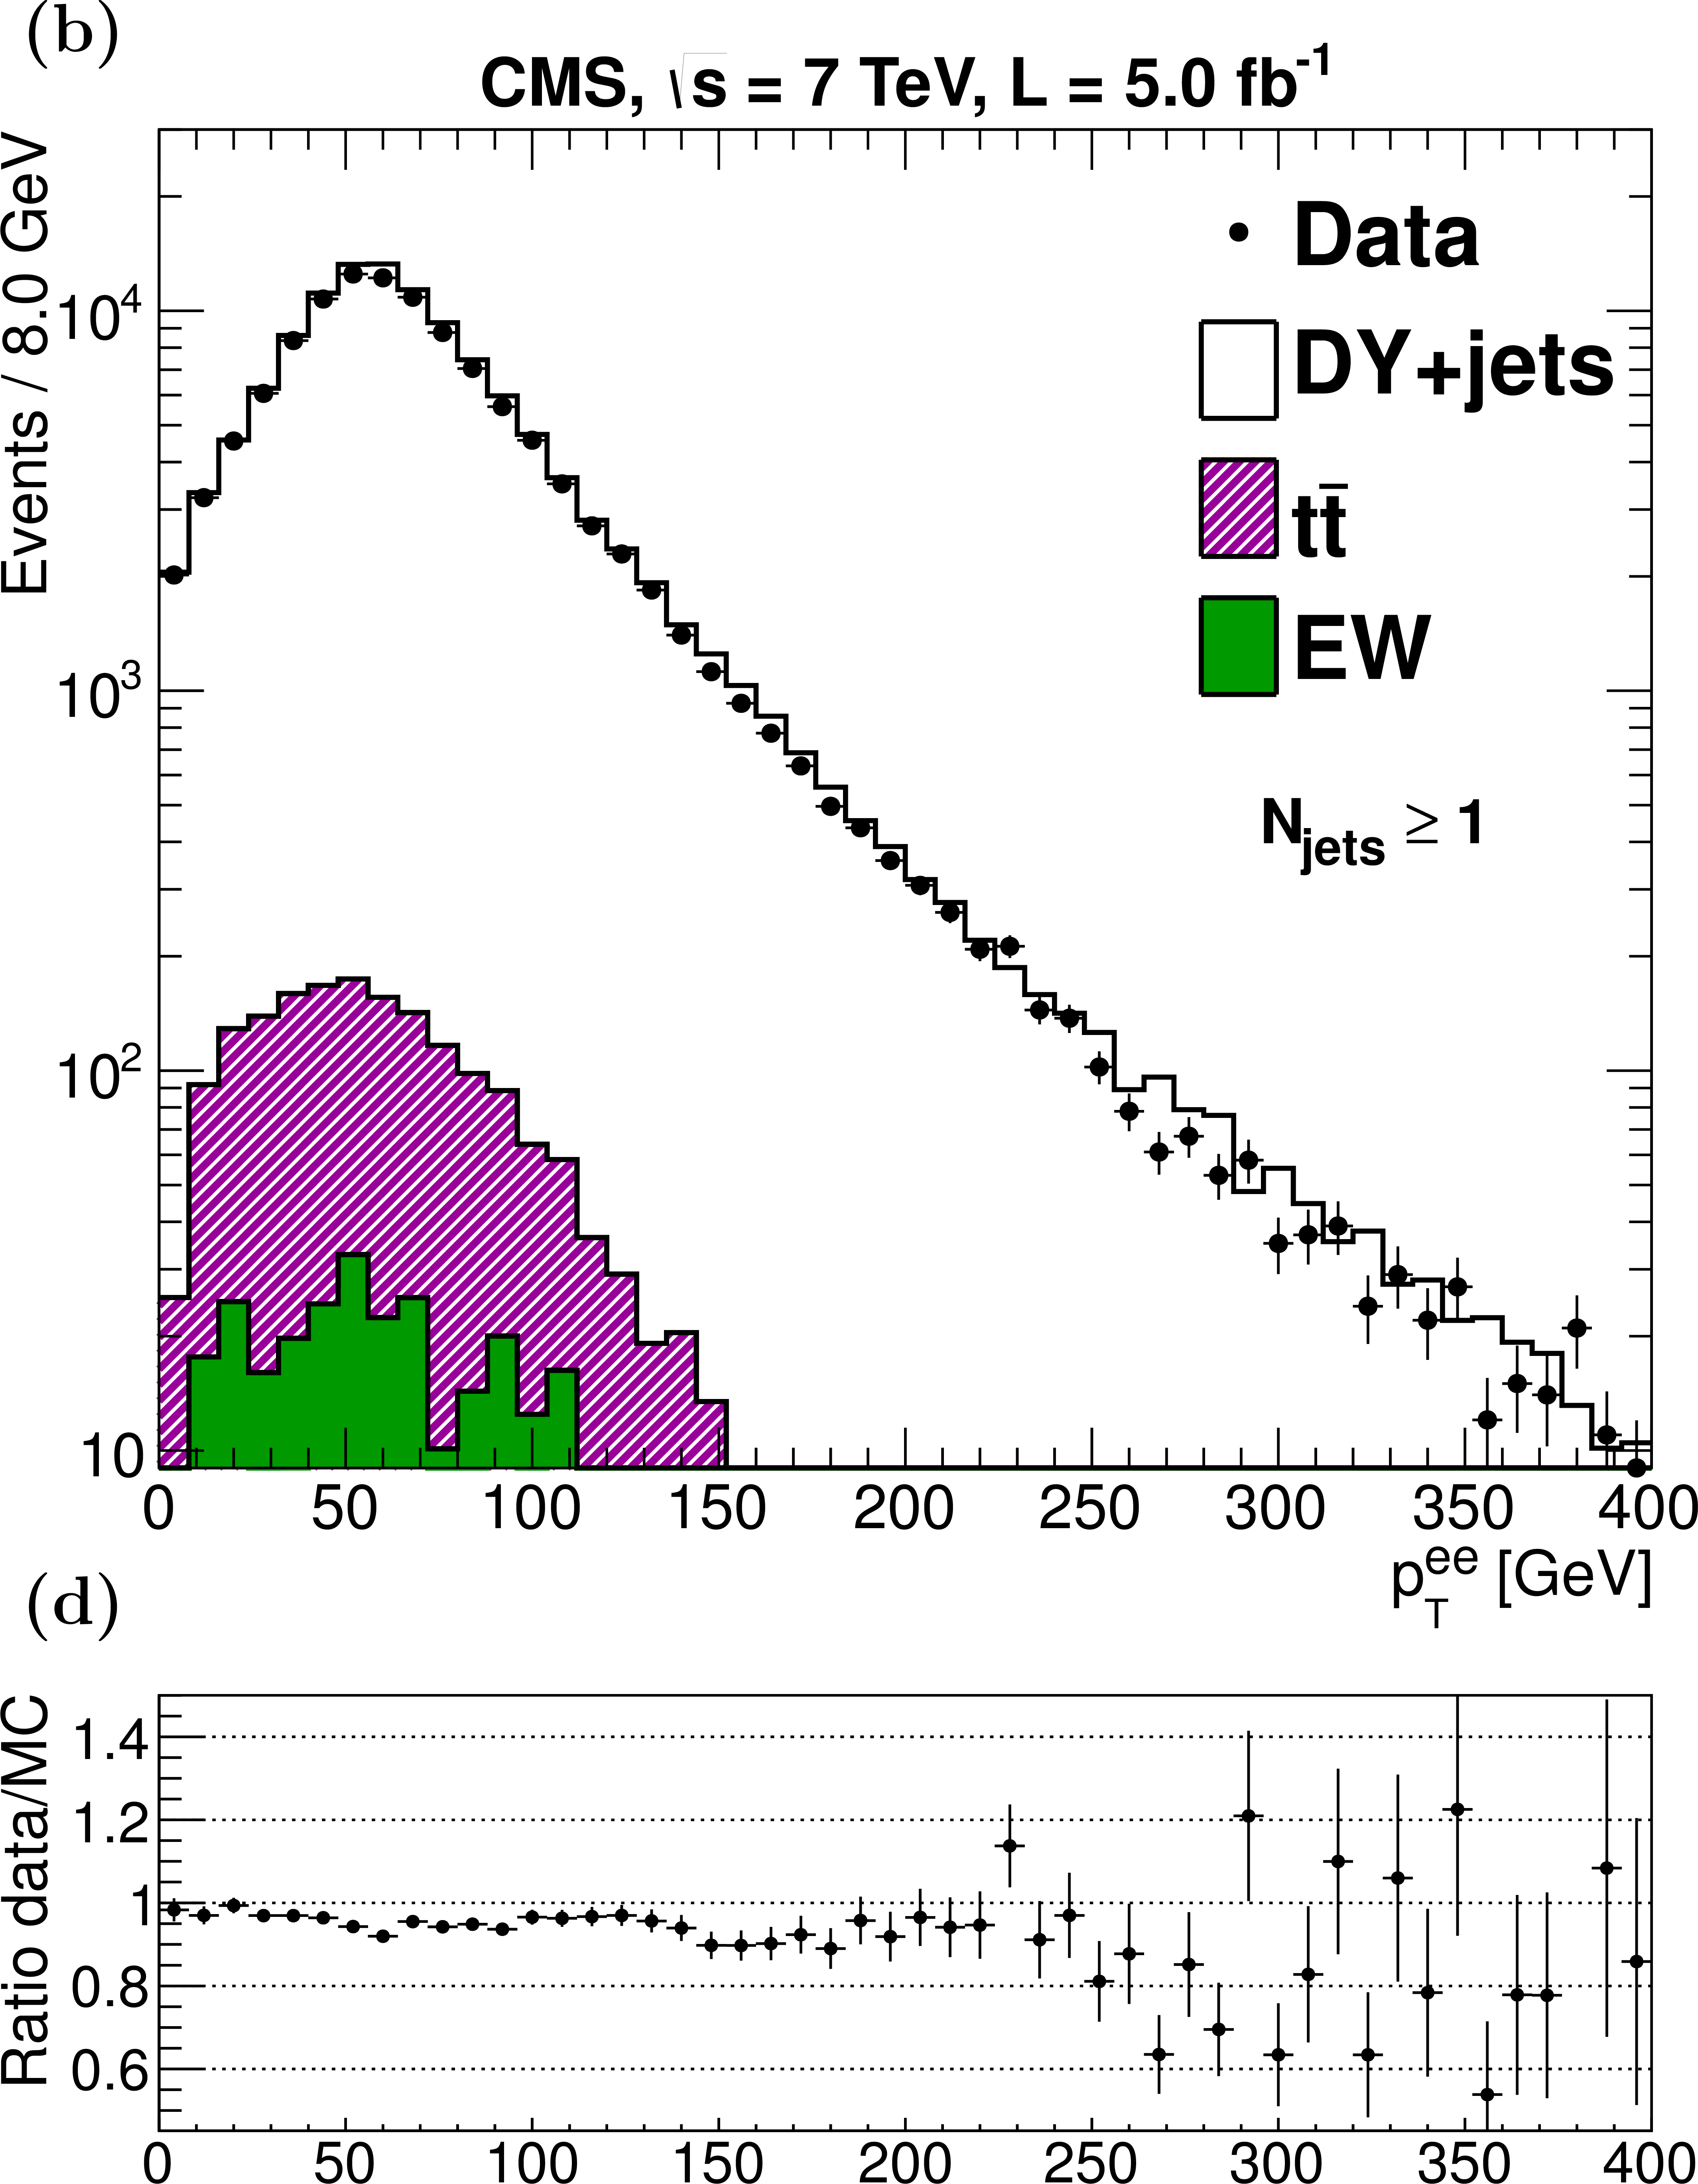
Figure 3-a:
Distributions for $ {\mathrm{ Z } \rightarrow \mathrm{ e } \mathrm{ e } } $ candidate events in data, compared with expectations from simulated signal and background contributions using MadGraph simulations normalized to the integrated luminosity of the data: (a) as a function of associated jet multiplicity $N_ {\text {jets}} $, and (b) as a function of $ {p_{\mathrm {T}}} $ of the dielectron pair ${ {( {p_{\mathrm {T}}} ^{ee})} } $ for ${N_ {\text {jets}} \geq 1}$. The dibosons WW, WZ, ZZ and W+jets backgrounds are collectively denoted as EW in the legends. The plots in (c) and (d) show the ratios of the data to predictions from MC. The error bars on the data points represent only their statistical uncertainties and do not include systematic effects. |
png pdf |
Figure 3-b:
Distributions for $ {\mathrm{ Z } \rightarrow \mathrm{ e } \mathrm{ e } } $ candidate events in data, compared with expectations from simulated signal and background contributions using MadGraph simulations normalized to the integrated luminosity of the data: (a) as a function of associated jet multiplicity $N_ {\text {jets}} $, and (b) as a function of $ {p_{\mathrm {T}}} $ of the dielectron pair ${ {( {p_{\mathrm {T}}} ^{ee})} } $ for ${N_ {\text {jets}} \geq 1}$. The dibosons WW, WZ, ZZ and W+jets backgrounds are collectively denoted as EW in the legends. The plots in (c) and (d) show the ratios of the data to predictions from MC. The error bars on the data points represent only their statistical uncertainties and do not include systematic effects. |
png pdf |
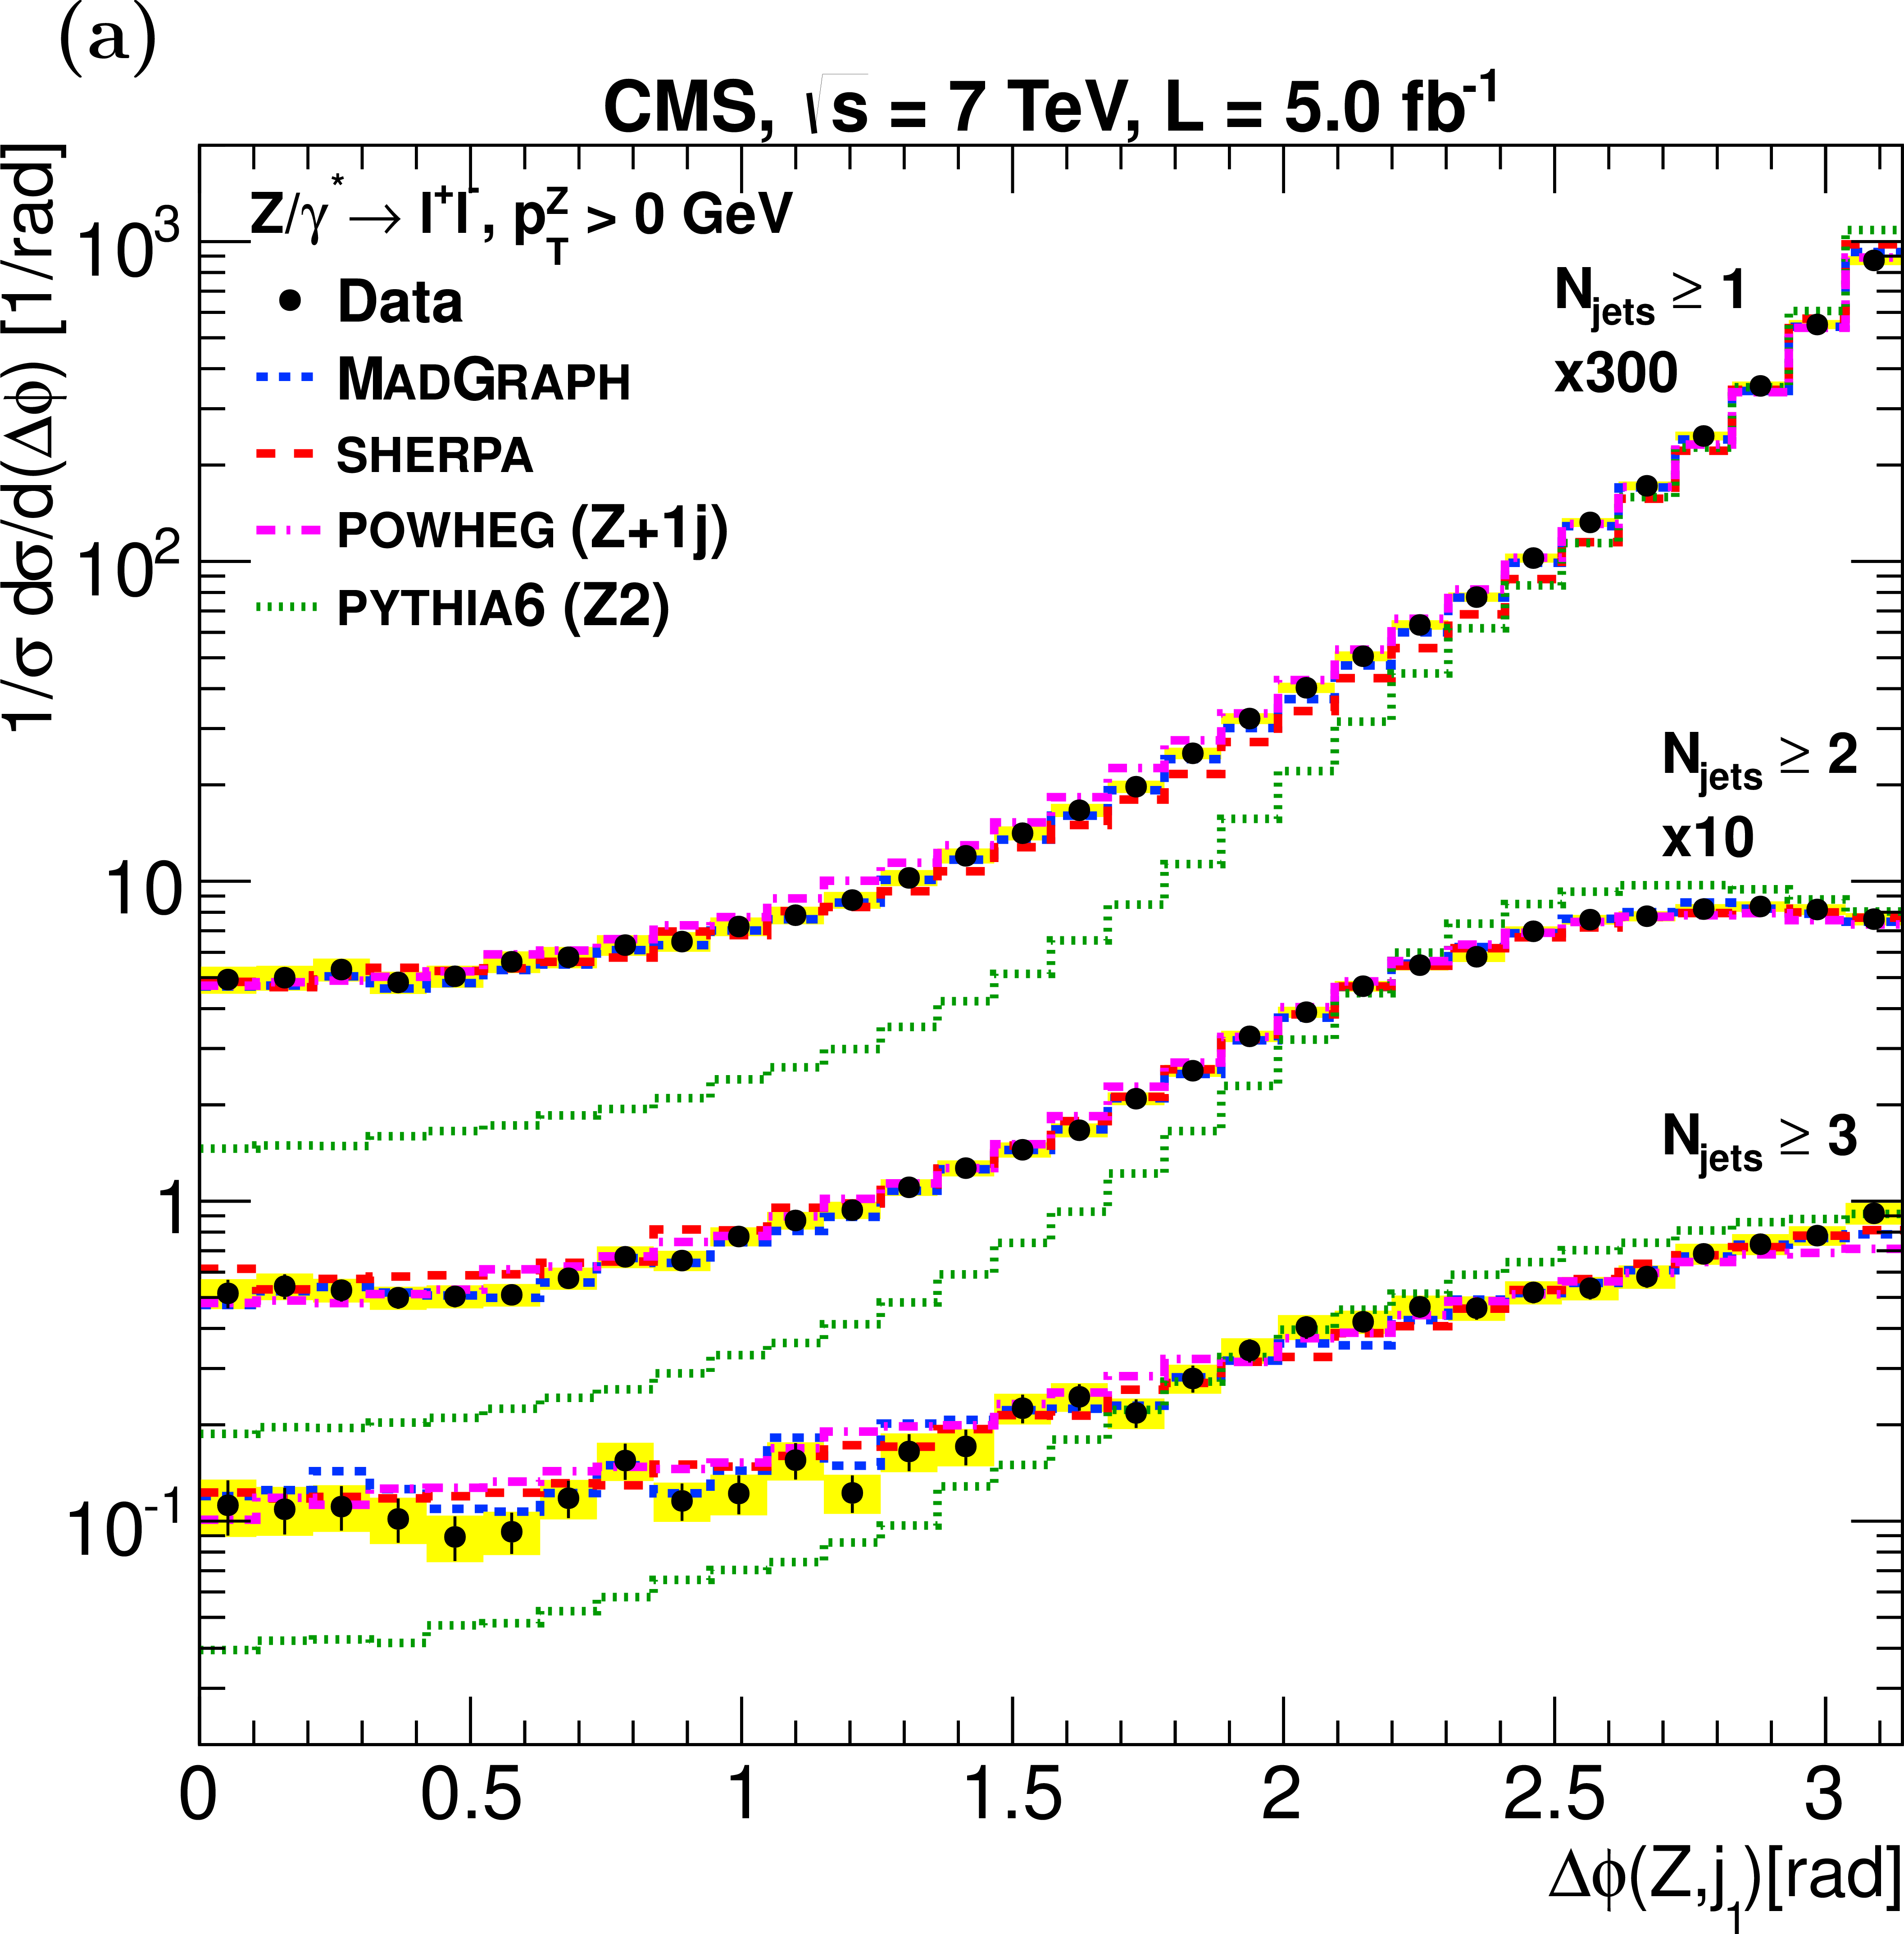
Figure 4-a:
Normalized $\Delta \phi (\mathrm{ Z } ,j_1)$ distributions for the leading jet in the inclusive jet-multiplicity bins $N_ {\text {jets}} \geq 1, \geq 2,$ and $\geq 3$: (a) all ${p_\mathrm {T}^\mathrm{ Z } }$ and (b) $ {p_\mathrm {T}^\mathrm{ Z } } > $ 150 GeV. Plots in (c) and (d) show the corresponding ratios of the data (solid points), and of other MC predictions, relative to MadGraph . The ratio for PYTHIA MC is not included in these plots. The error bars on the data points represent their statistical uncertainties, the solid yellow shaded band around the points represents the sum of statistical and systematic uncertainties taken in quadrature, while the cross-hatched (cyan) bands reflect the statistical uncertainties on the MadGraph calculations. |

png pdf |
Figure 4-b:
Normalized $\Delta \phi (\mathrm{ Z } ,j_1)$ distributions for the leading jet in the inclusive jet-multiplicity bins $N_ {\text {jets}} \geq 1, \geq 2,$ and $\geq 3$: (a) all ${p_\mathrm {T}^\mathrm{ Z } }$ and (b) $ {p_\mathrm {T}^\mathrm{ Z } } > $ 150 GeV. Plots in (c) and (d) show the corresponding ratios of the data (solid points), and of other MC predictions, relative to MadGraph . The ratio for PYTHIA MC is not included in these plots. The error bars on the data points represent their statistical uncertainties, the solid yellow shaded band around the points represents the sum of statistical and systematic uncertainties taken in quadrature, while the cross-hatched (cyan) bands reflect the statistical uncertainties on the MadGraph calculations. |
png pdf |
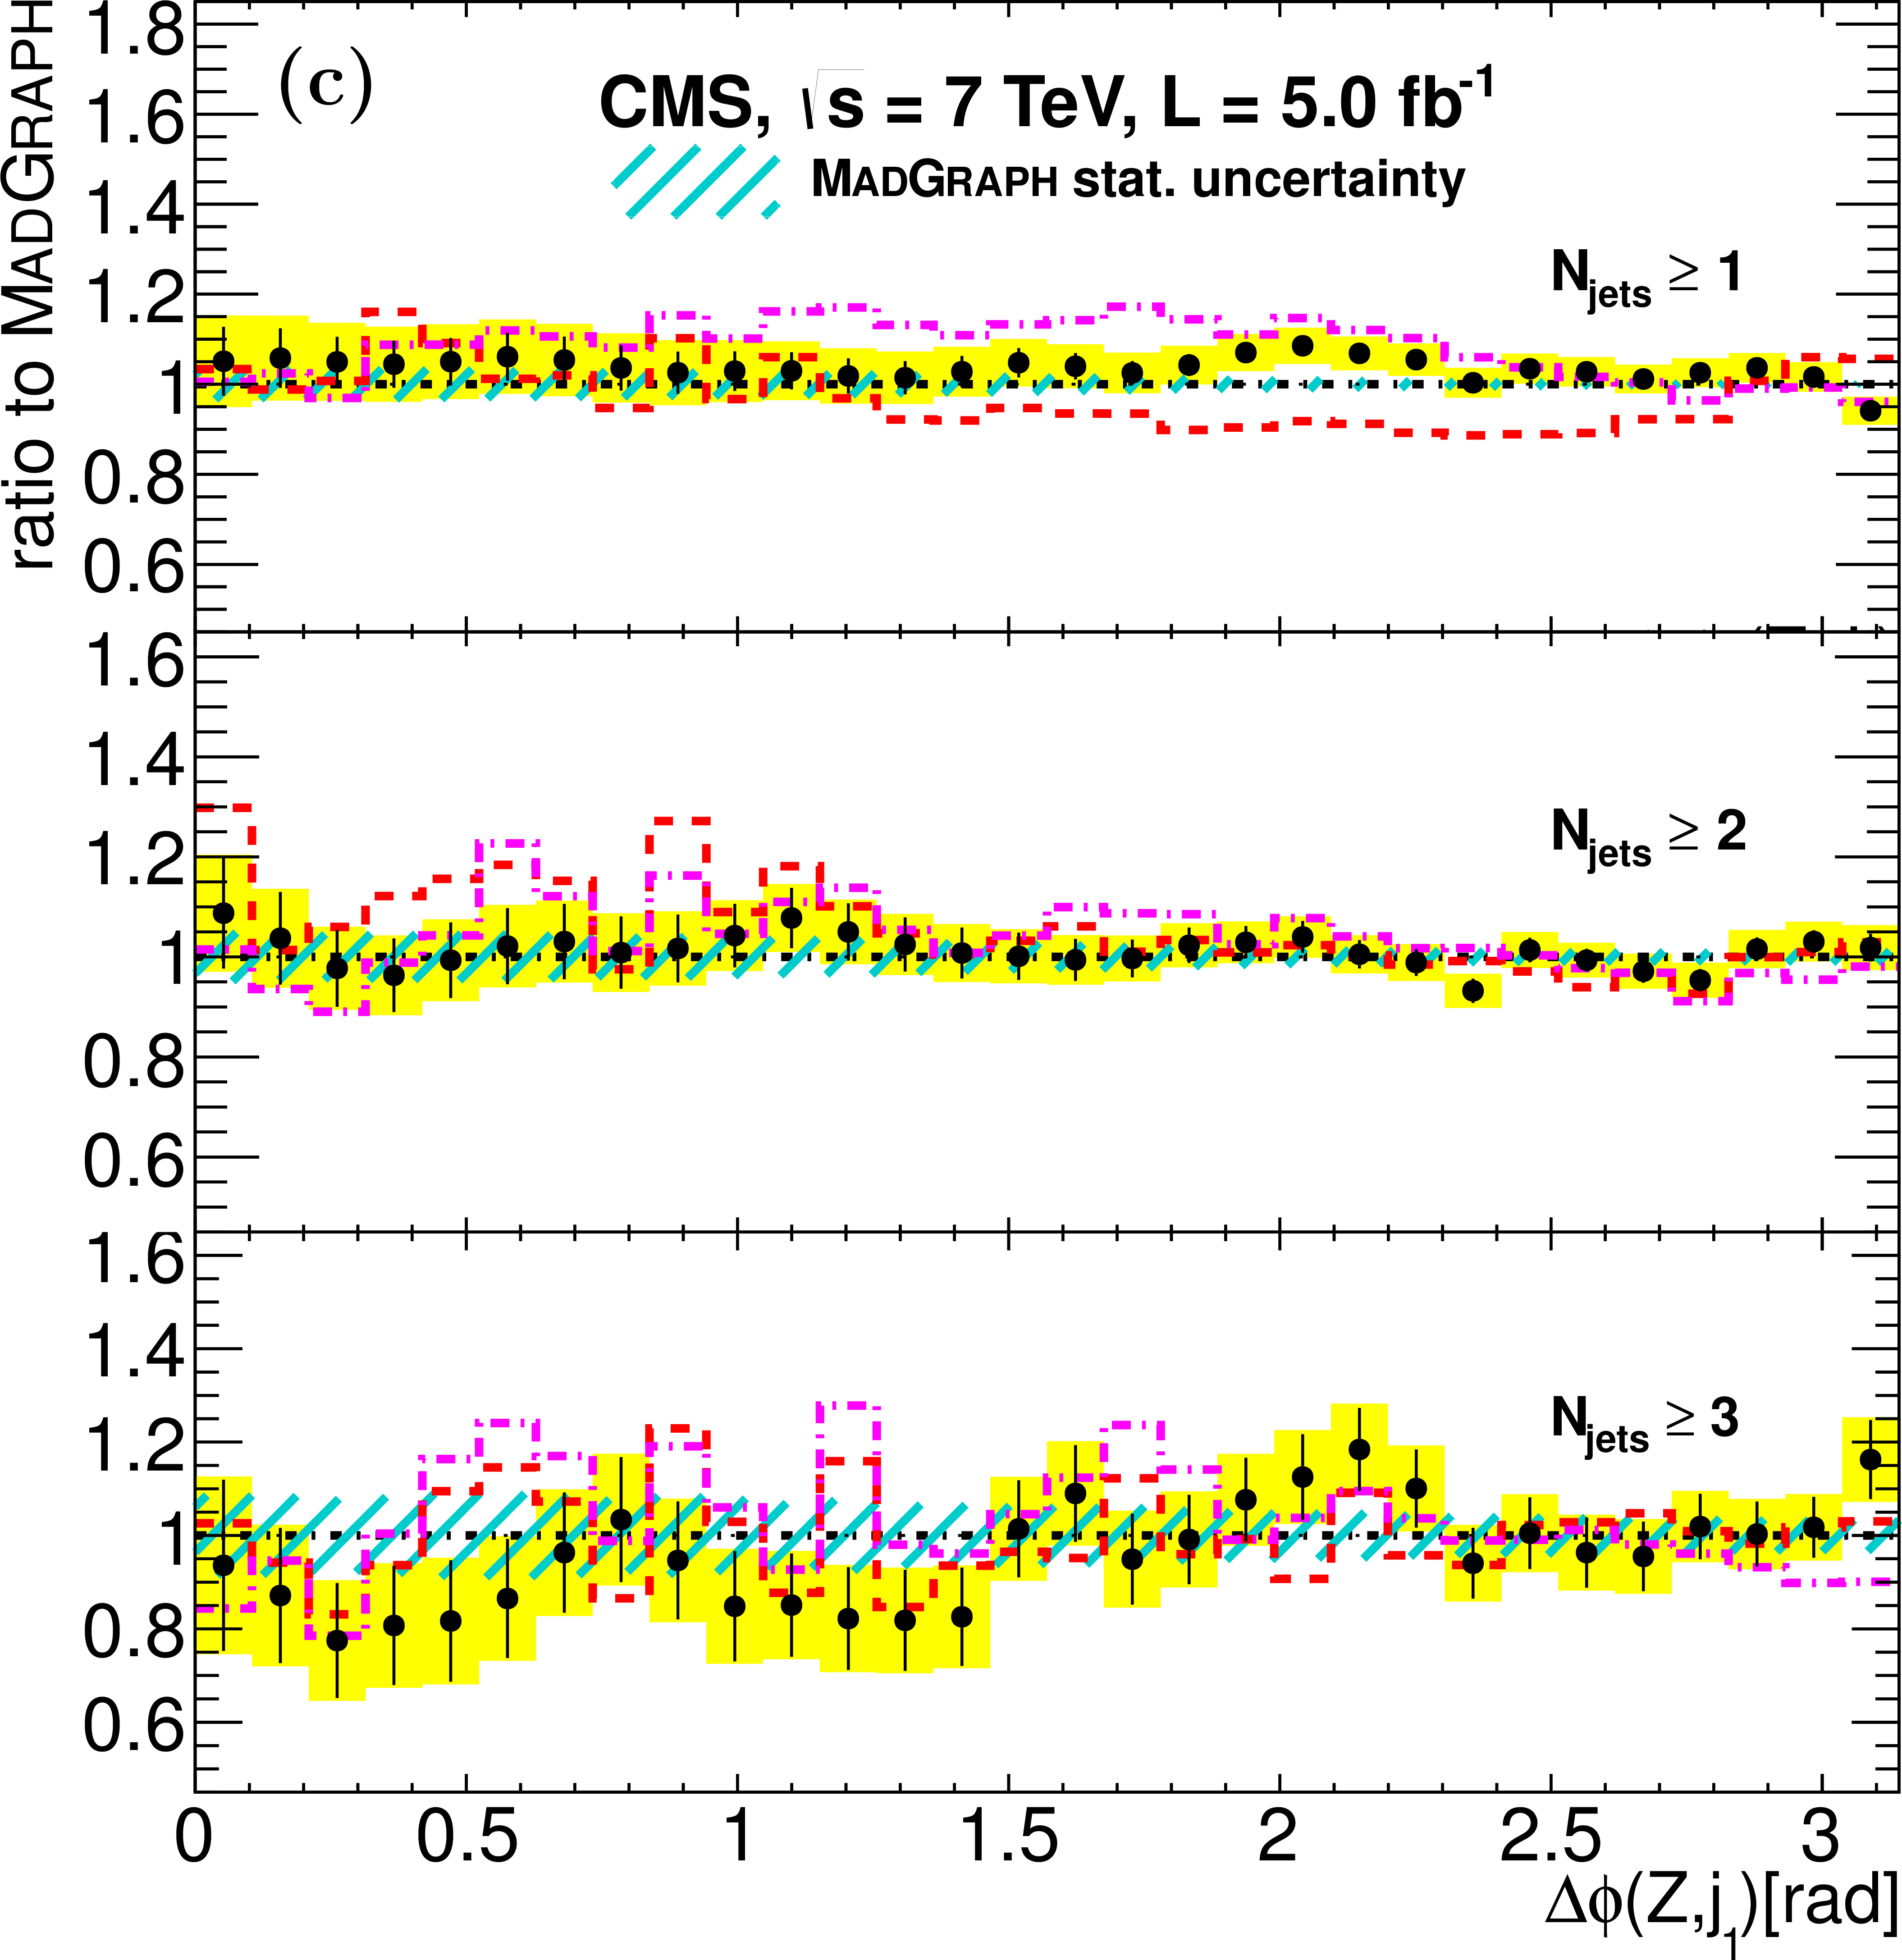
Figure 4-c:
Normalized $\Delta \phi (\mathrm{ Z } ,j_1)$ distributions for the leading jet in the inclusive jet-multiplicity bins $N_ {\text {jets}} \geq 1, \geq 2,$ and $\geq 3$: (a) all ${p_\mathrm {T}^\mathrm{ Z } }$ and (b) $ {p_\mathrm {T}^\mathrm{ Z } } > $ 150 GeV. Plots in (c) and (d) show the corresponding ratios of the data (solid points), and of other MC predictions, relative to MadGraph . The ratio for PYTHIA MC is not included in these plots. The error bars on the data points represent their statistical uncertainties, the solid yellow shaded band around the points represents the sum of statistical and systematic uncertainties taken in quadrature, while the cross-hatched (cyan) bands reflect the statistical uncertainties on the MadGraph calculations. |

png pdf |
Figure 4-d:
Normalized $\Delta \phi (\mathrm{ Z } ,j_1)$ distributions for the leading jet in the inclusive jet-multiplicity bins $N_ {\text {jets}} \geq 1, \geq 2,$ and $\geq 3$: (a) all ${p_\mathrm {T}^\mathrm{ Z } }$ and (b) $ {p_\mathrm {T}^\mathrm{ Z } } > $ 150 GeV. Plots in (c) and (d) show the corresponding ratios of the data (solid points), and of other MC predictions, relative to MadGraph . The ratio for PYTHIA MC is not included in these plots. The error bars on the data points represent their statistical uncertainties, the solid yellow shaded band around the points represents the sum of statistical and systematic uncertainties taken in quadrature, while the cross-hatched (cyan) bands reflect the statistical uncertainties on the MadGraph calculations. |

png pdf |
Figure 5-a:
Normalized $\Delta \phi (\mathrm{ Z } ,j_{i})$ distributions for the inclusive $N_ {\text {jets}} \geq 3$ jet-multiplicity bin: (a)all ${p_\mathrm {T}^\mathrm{ Z } }$ and (b) $ {p_\mathrm {T}^\mathrm{ Z } } > $ 150 GeV. Plots in (c) and (d) show the ratios of the data and other MC predictions, relative to MadGraph. |
png pdf |
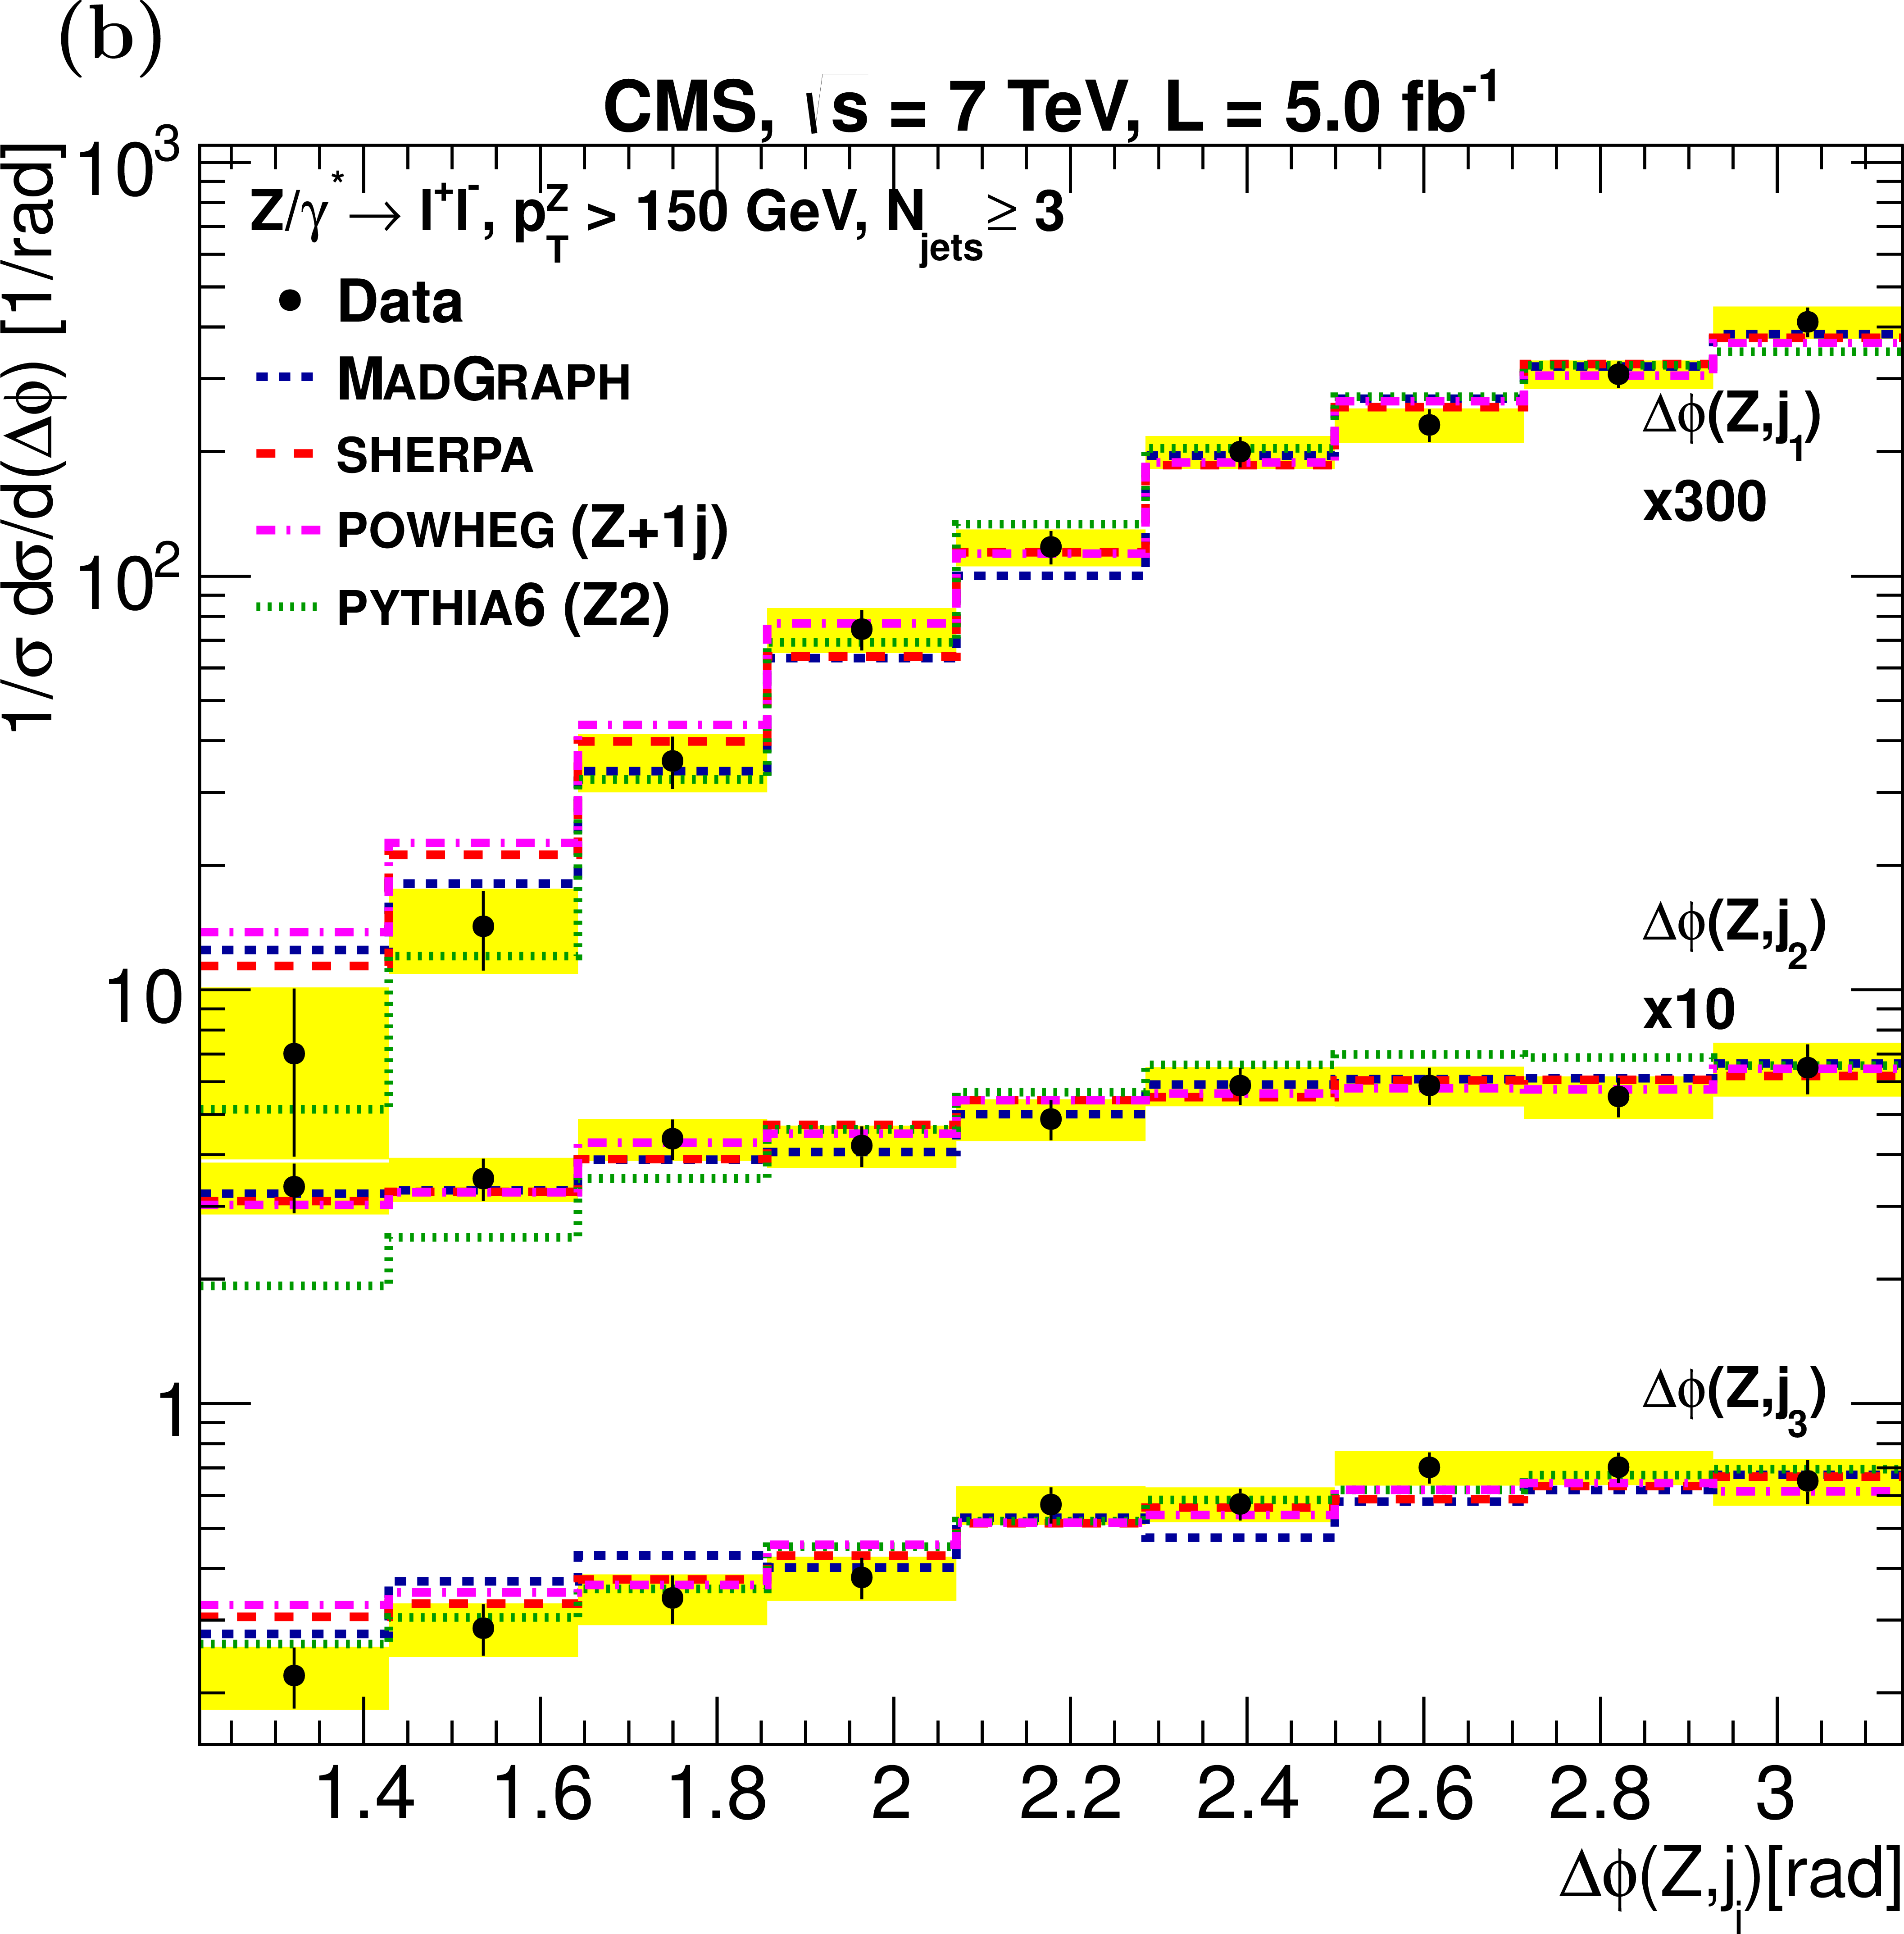
Figure 5-b:
Normalized $\Delta \phi (\mathrm{ Z } ,j_{i})$ distributions for the inclusive $N_ {\text {jets}} \geq 3$ jet-multiplicity bin: (a)all ${p_\mathrm {T}^\mathrm{ Z } }$ and (b) $ {p_\mathrm {T}^\mathrm{ Z } } > $ 150 GeV. Plots in (c) and (d) show the ratios of the data and other MC predictions, relative to MadGraph. |
png pdf |
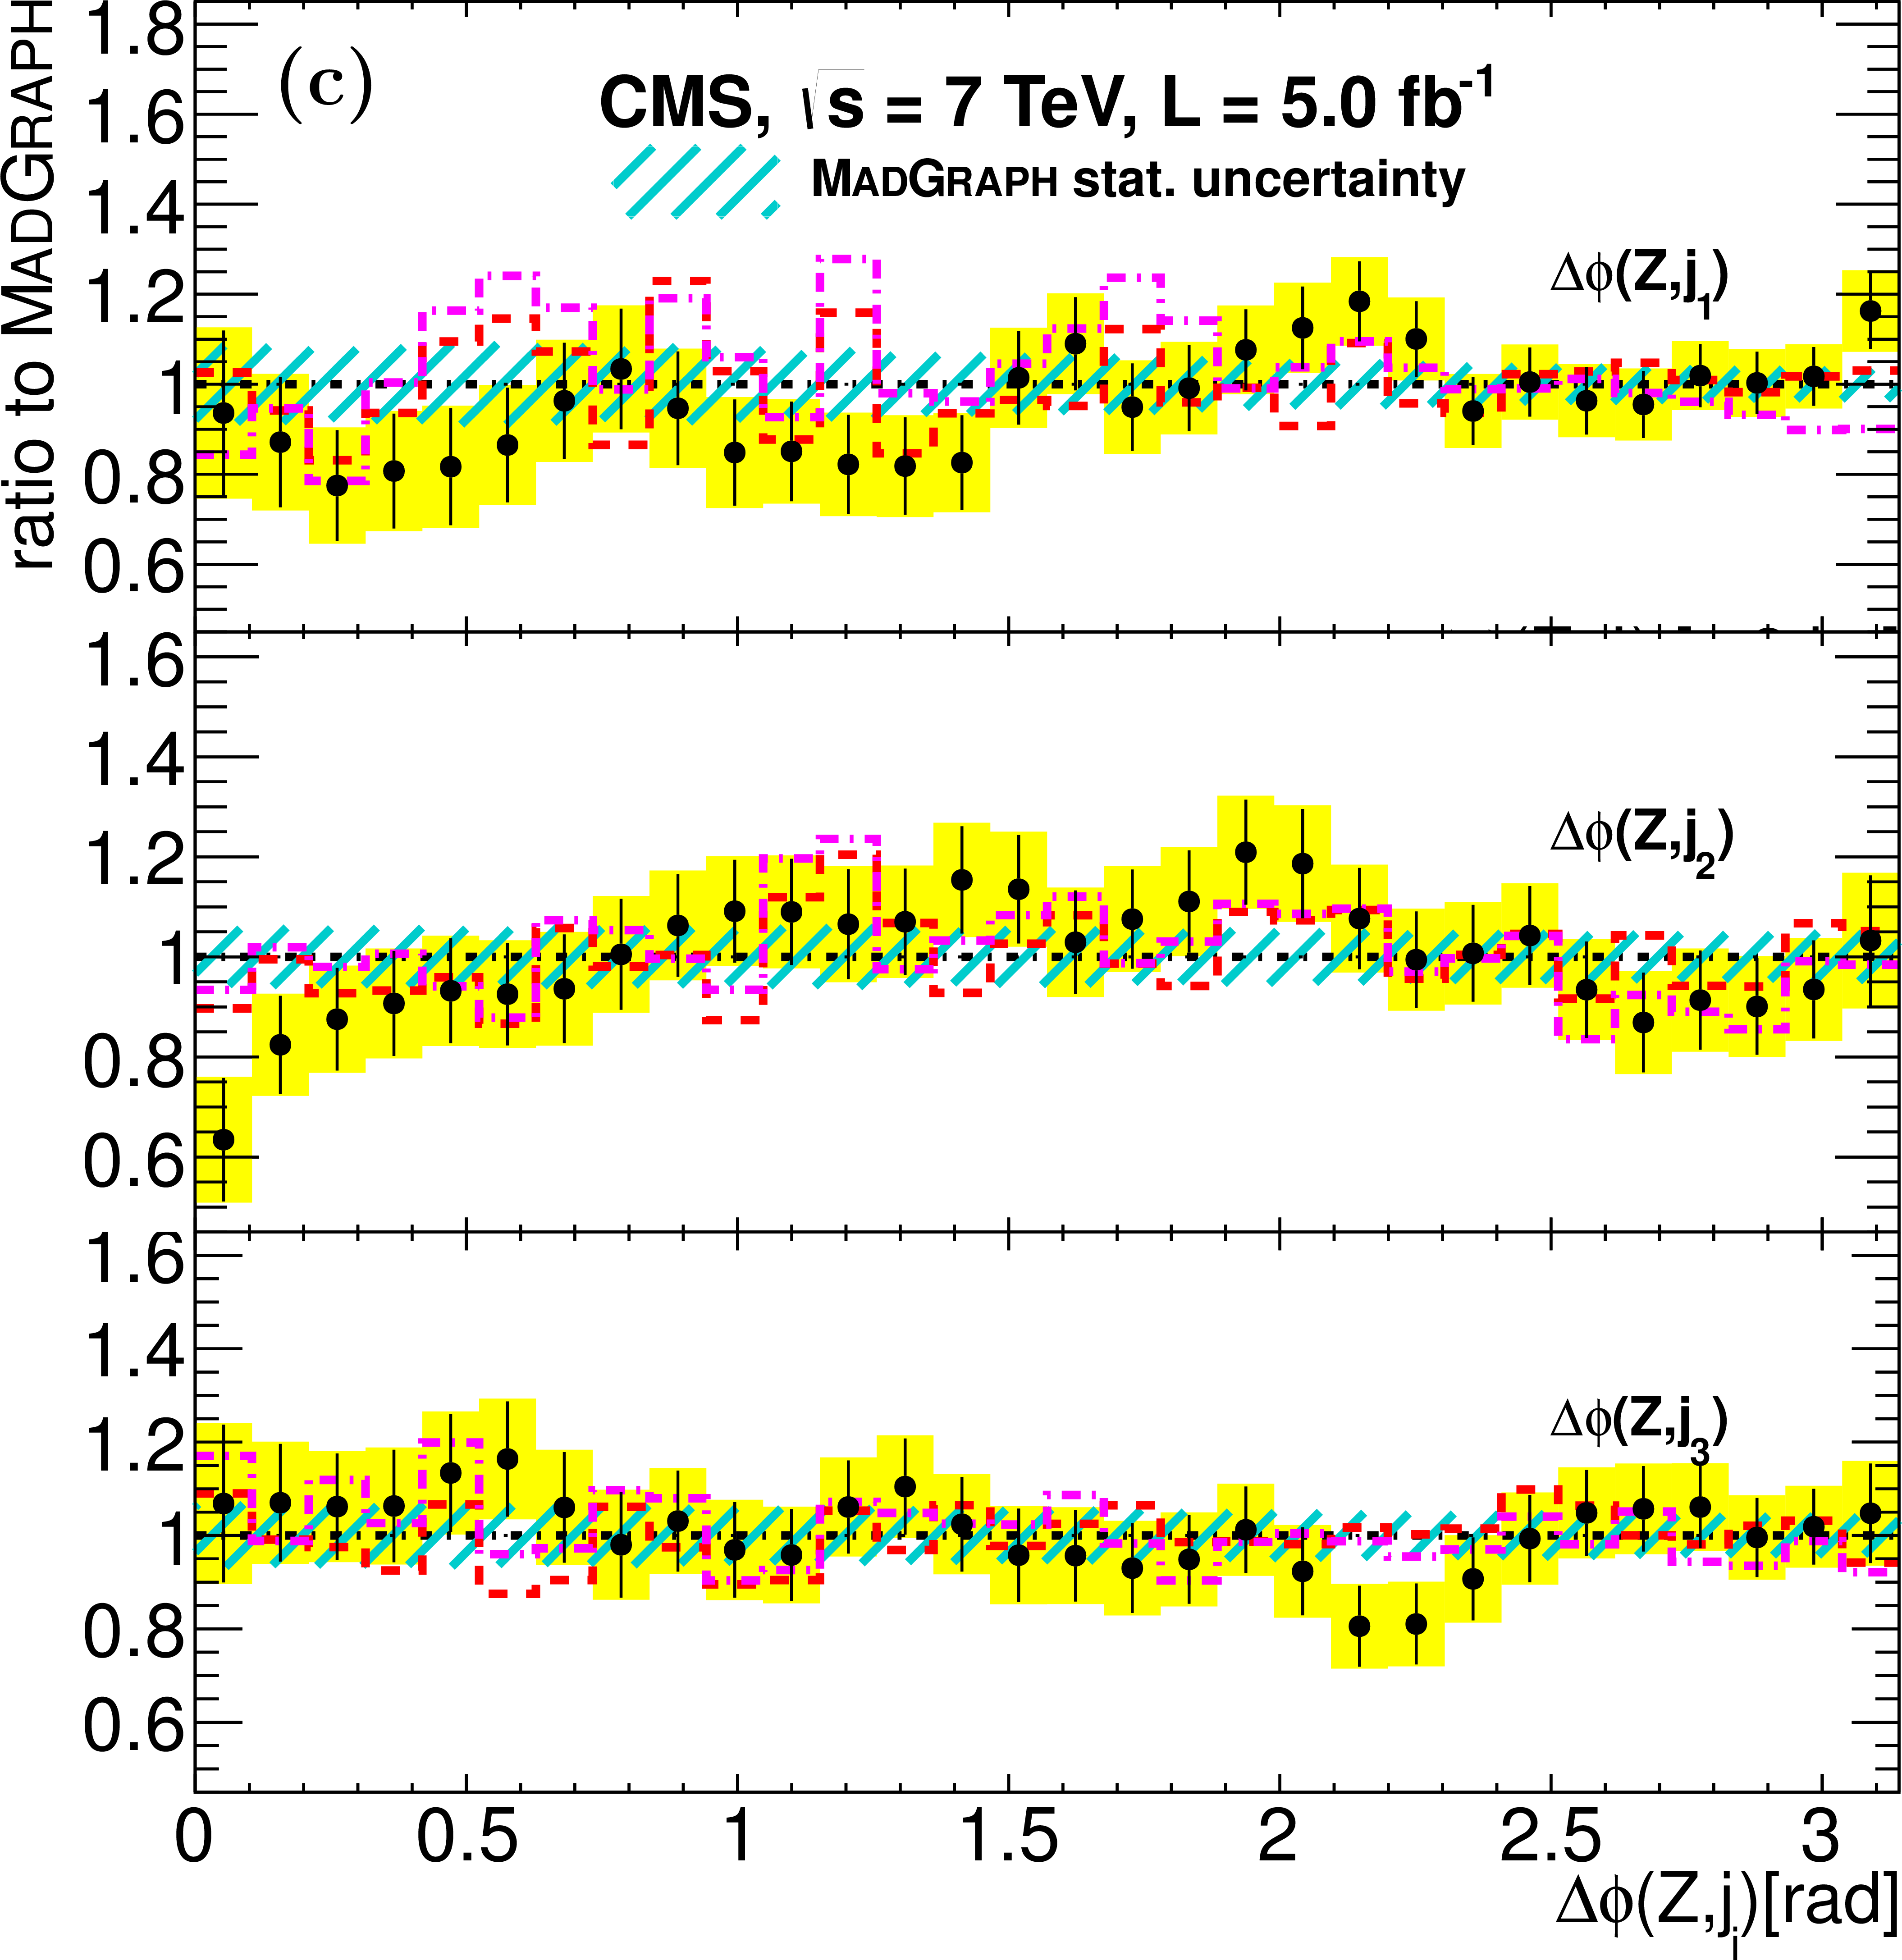
Figure 5-c:
Normalized $\Delta \phi (\mathrm{ Z } ,j_{i})$ distributions for the inclusive $N_ {\text {jets}} \geq 3$ jet-multiplicity bin: (a)all ${p_\mathrm {T}^\mathrm{ Z } }$ and (b) $ {p_\mathrm {T}^\mathrm{ Z } } > $ 150 GeV. Plots in (c) and (d) show the ratios of the data and other MC predictions, relative to MadGraph. |
png pdf |
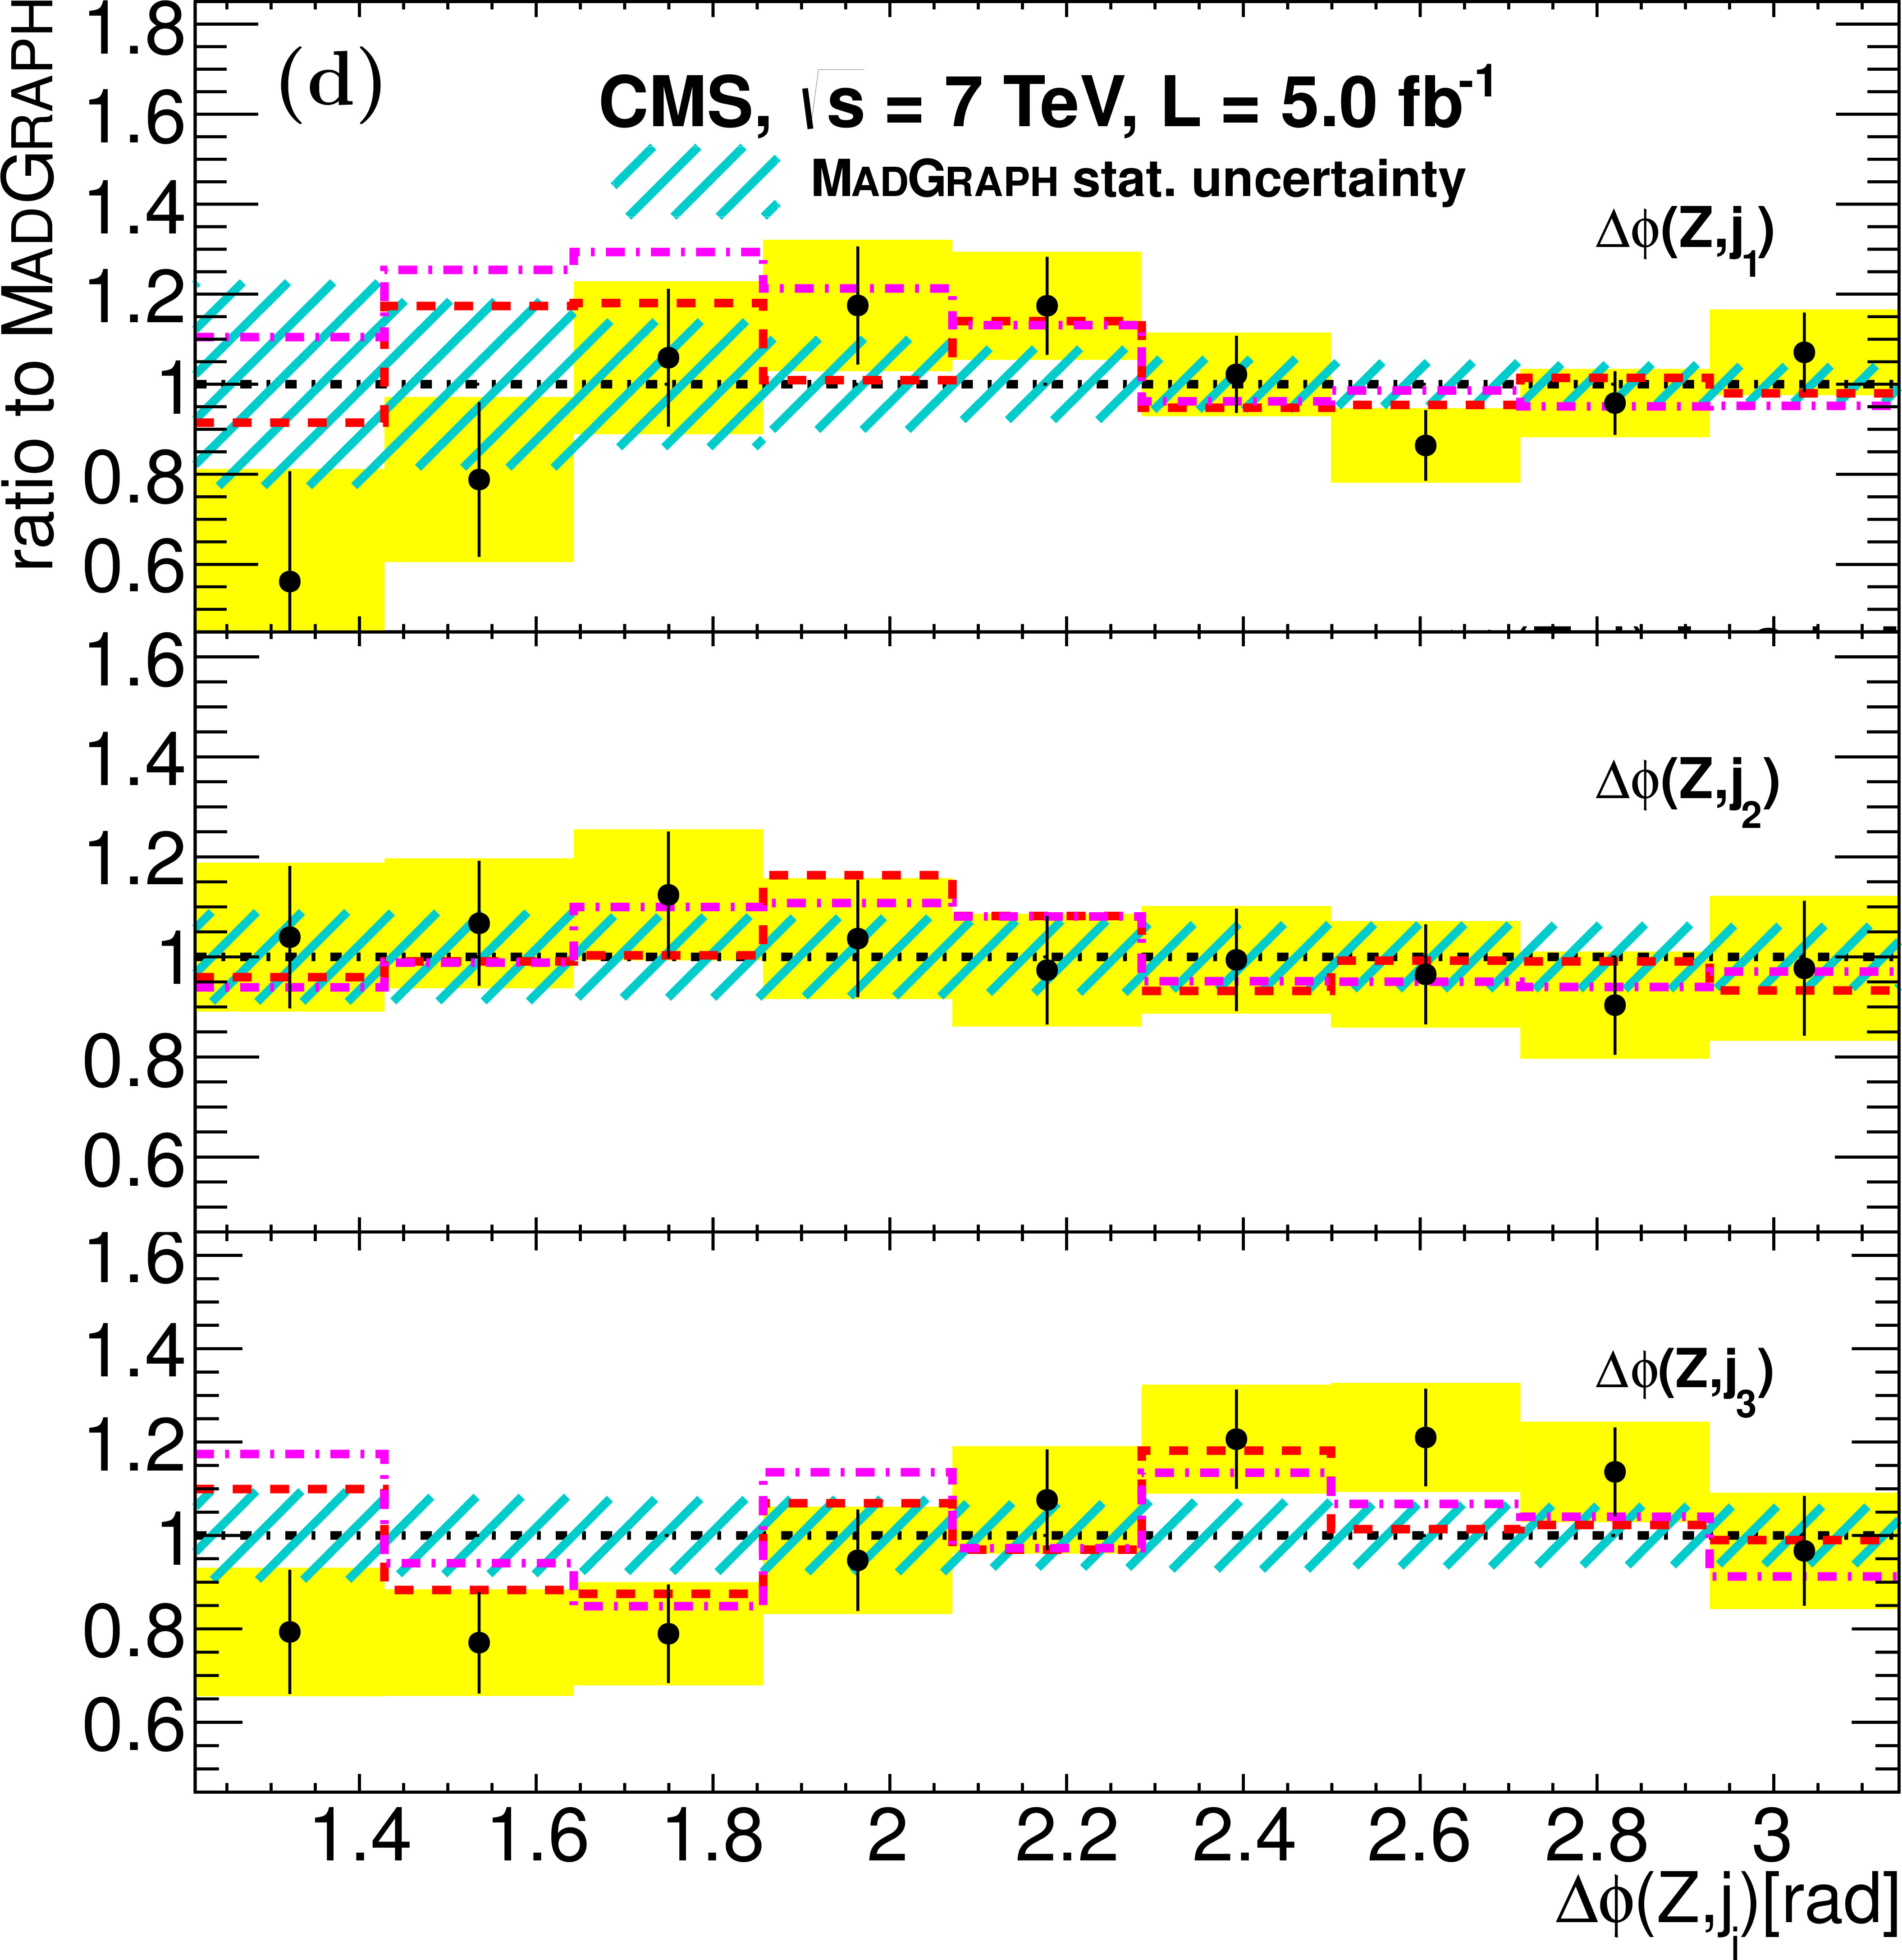
Figure 5-d:
Normalized $\Delta \phi (\mathrm{ Z } ,j_{i})$ distributions for the inclusive $N_ {\text {jets}} \geq 3$ jet-multiplicity bin: (a)all ${p_\mathrm {T}^\mathrm{ Z } }$ and (b) $ {p_\mathrm {T}^\mathrm{ Z } } > $ 150 GeV. Plots in (c) and (d) show the ratios of the data and other MC predictions, relative to MadGraph. |

png pdf |
Figure 6-a:
Normalized $\Delta \phi (j_{i},j_{j})$ distributions for the inclusive $N_ {\text {jets}} \geq 3$ jet-multiplicity bin: (a)all ${p_\mathrm {T}^\mathrm{ Z } }$ and (b) $ {p_\mathrm {T}^\mathrm{ Z } } > $ 150 GeV. Plots in (c) and (d) show the ratios of the data and other MC predictions, relative to MadGraph. |
png pdf |
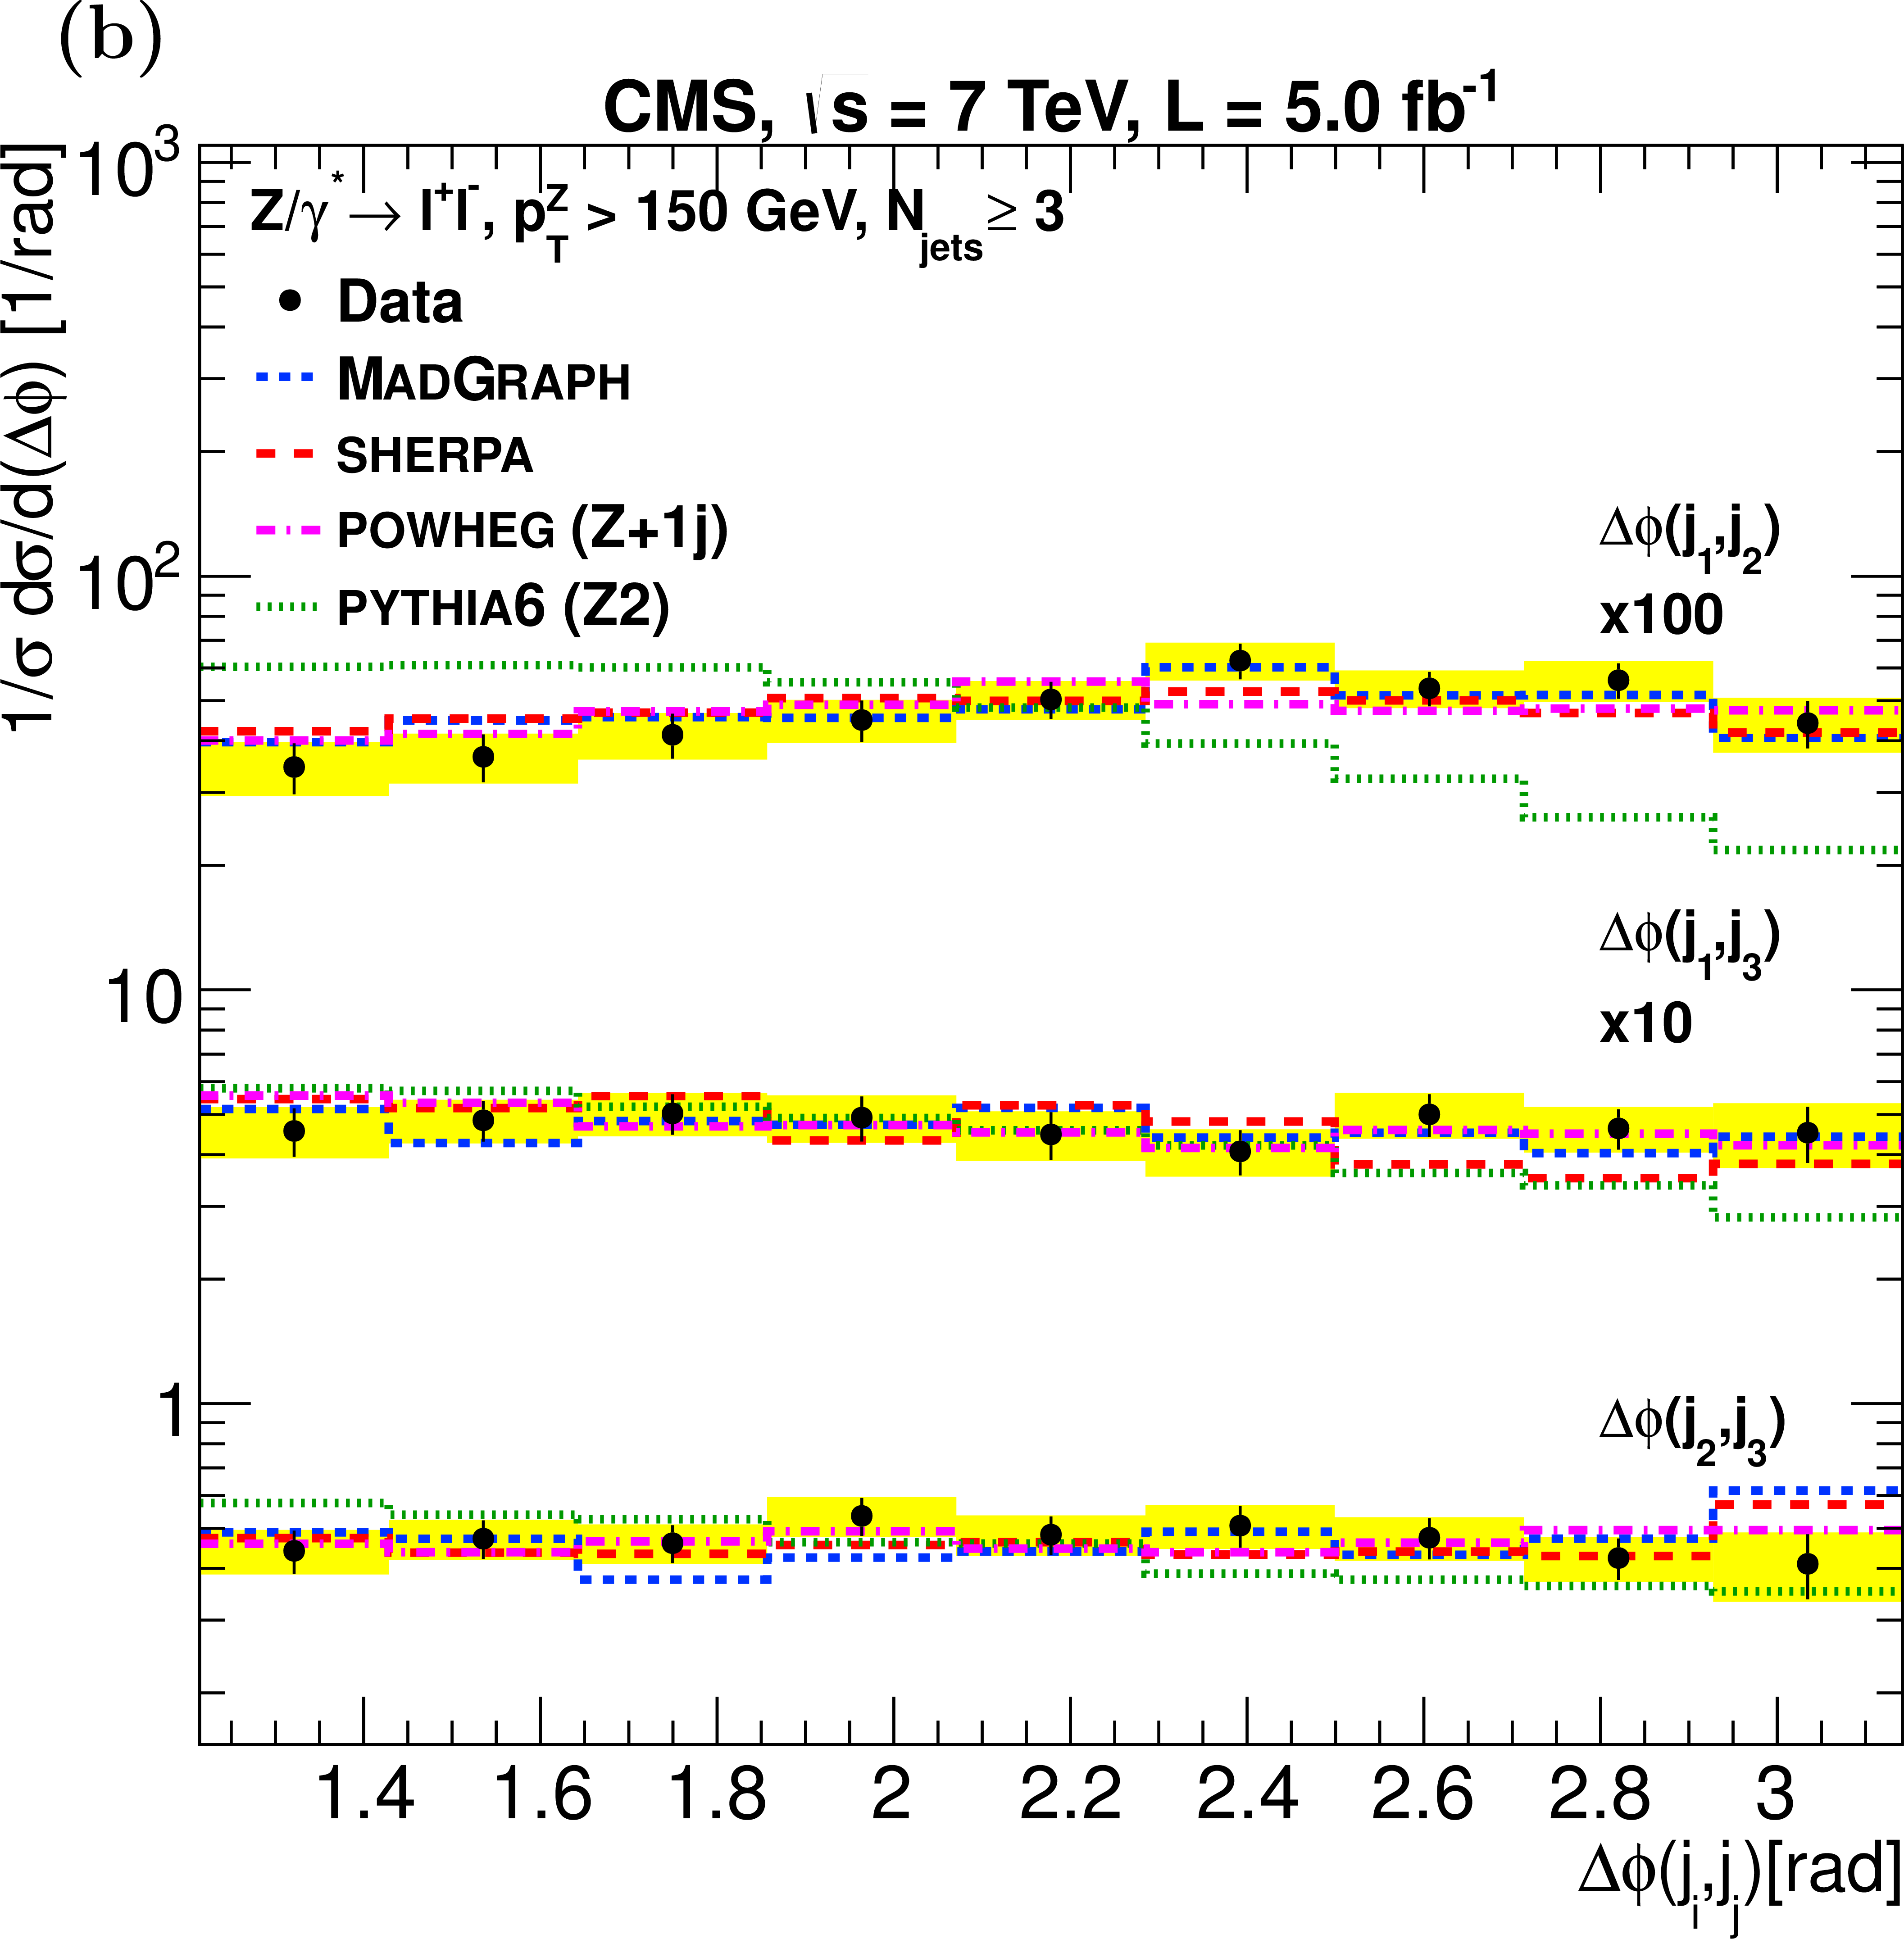
Figure 6-b:
Normalized $\Delta \phi (j_{i},j_{j})$ distributions for the inclusive $N_ {\text {jets}} \geq 3$ jet-multiplicity bin: (a)all ${p_\mathrm {T}^\mathrm{ Z } }$ and (b) $ {p_\mathrm {T}^\mathrm{ Z } } > $ 150 GeV. Plots in (c) and (d) show the ratios of the data and other MC predictions, relative to MadGraph. |

png pdf |
Figure 6-c:
Normalized $\Delta \phi (j_{i},j_{j})$ distributions for the inclusive $N_ {\text {jets}} \geq 3$ jet-multiplicity bin: (a)all ${p_\mathrm {T}^\mathrm{ Z } }$ and (b) $ {p_\mathrm {T}^\mathrm{ Z } } > $ 150 GeV. Plots in (c) and (d) show the ratios of the data and other MC predictions, relative to MadGraph. |
png pdf |
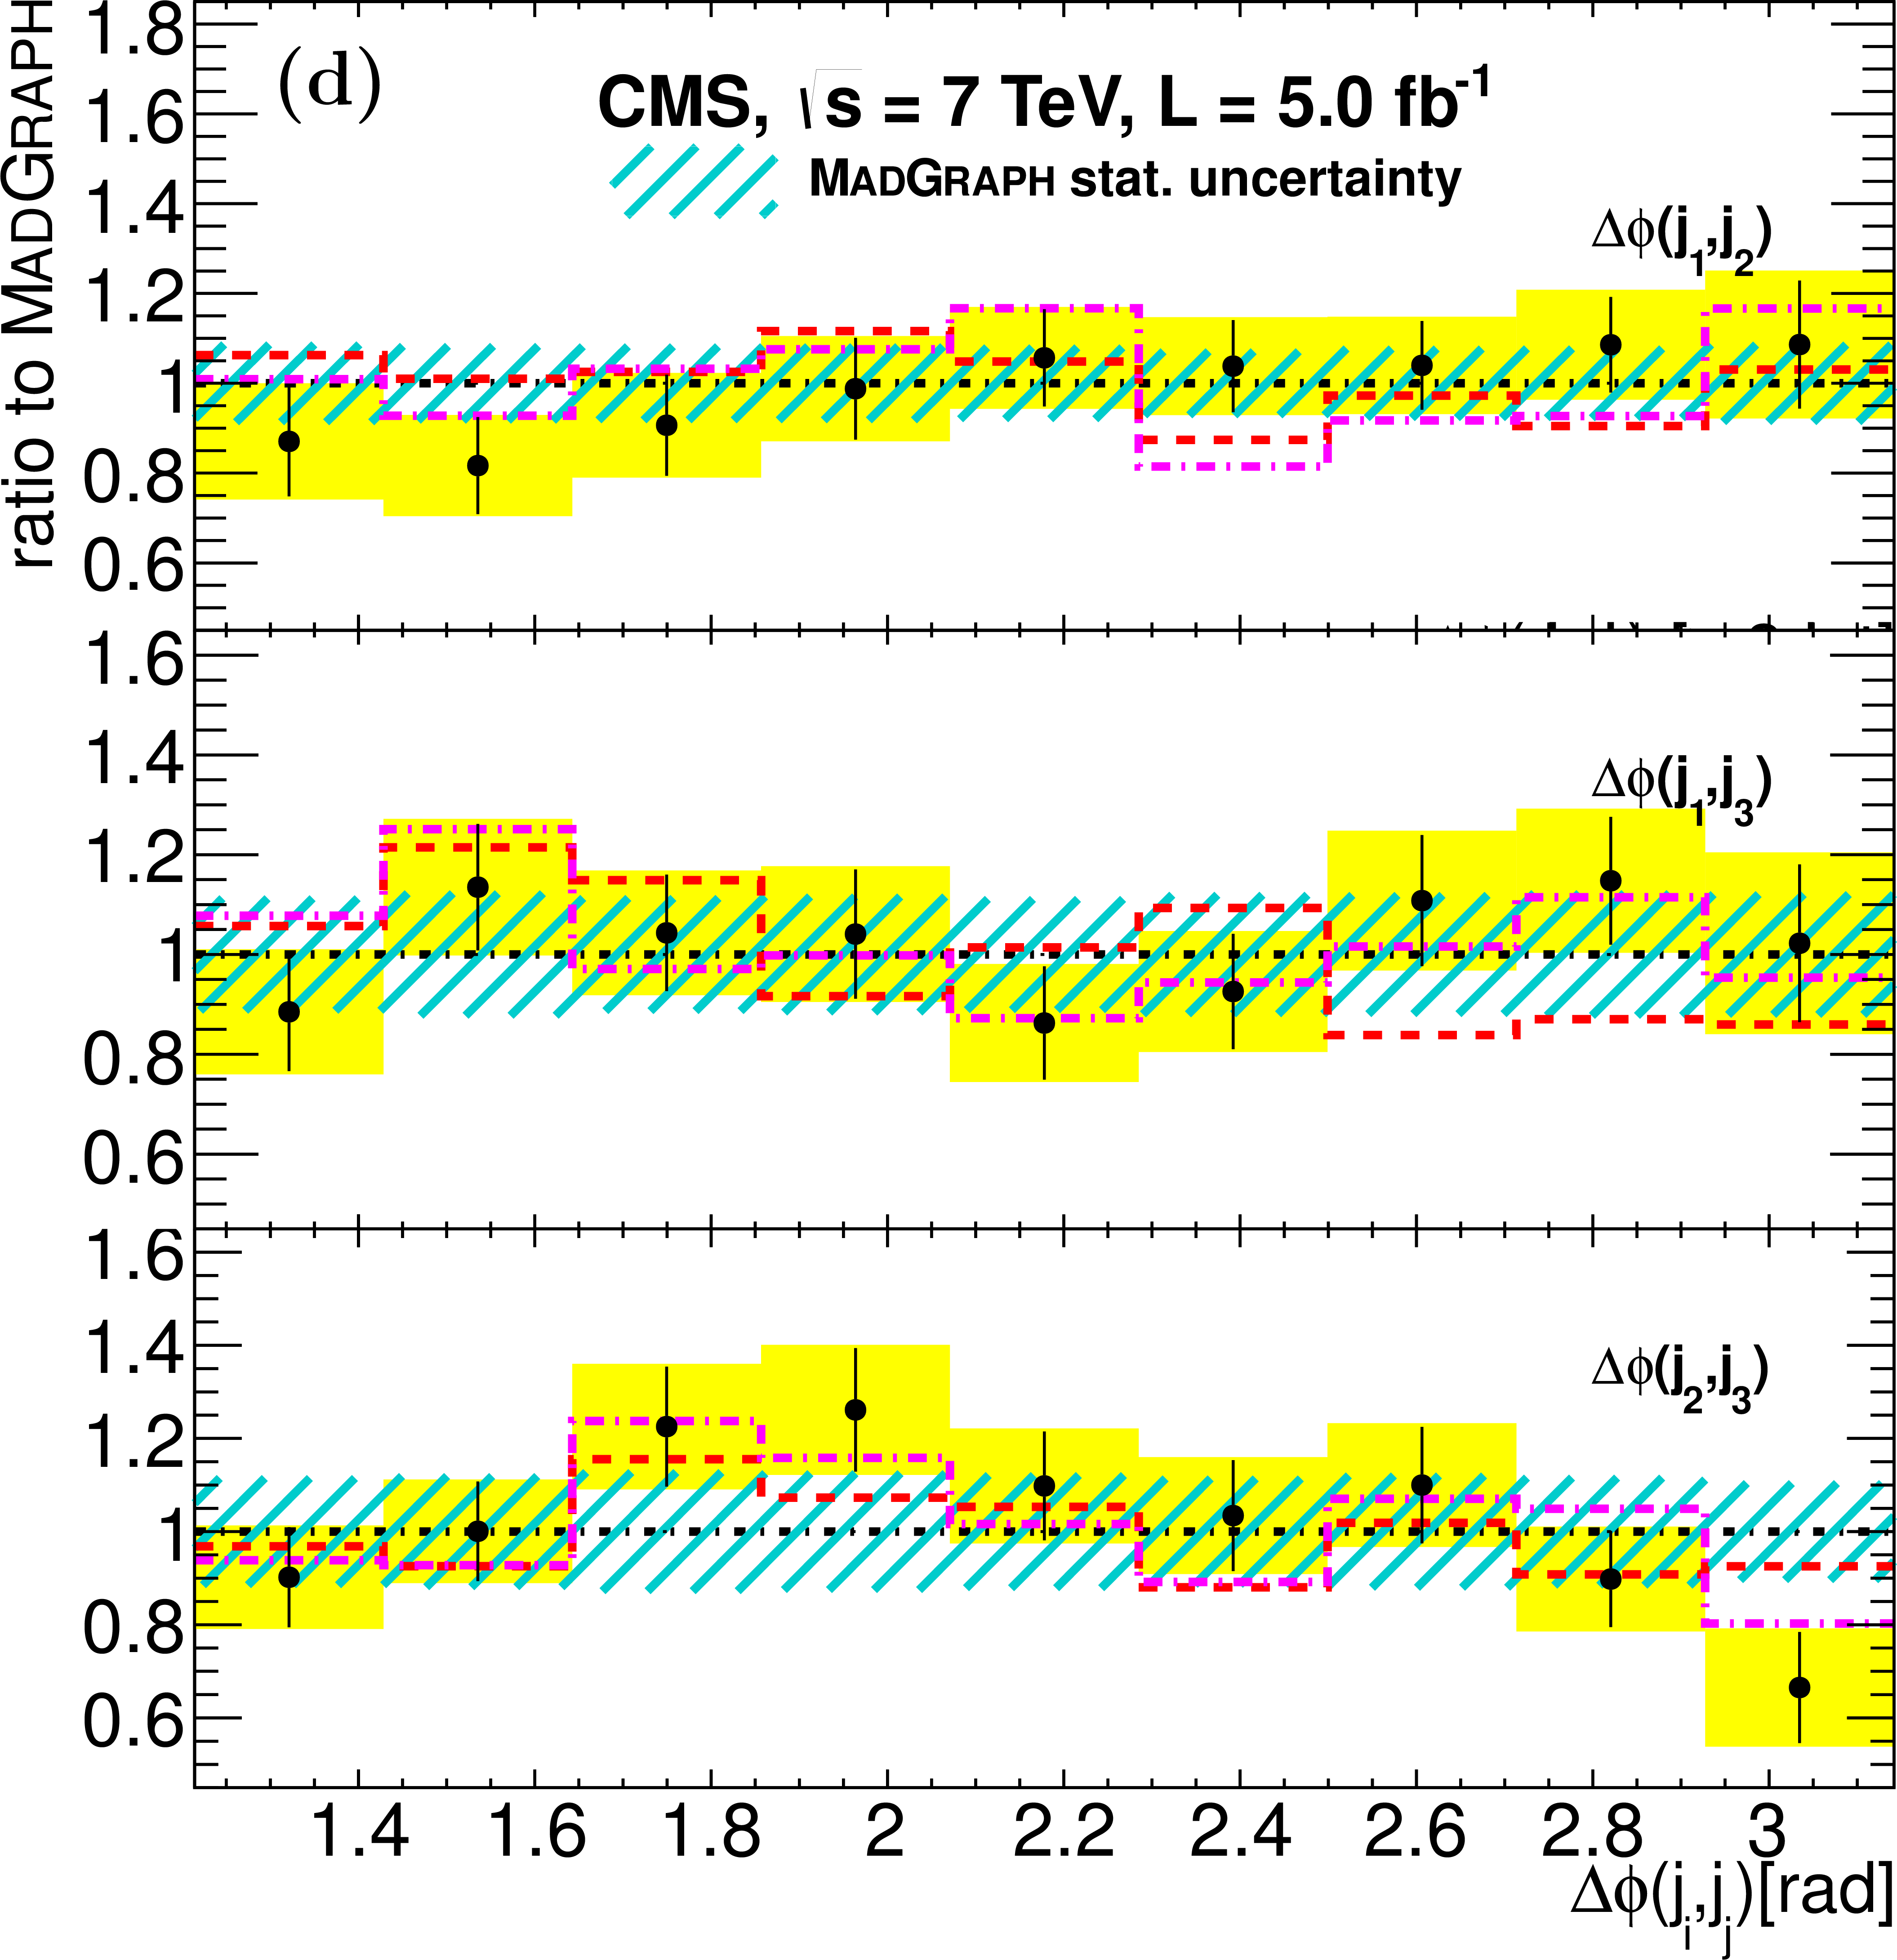
Figure 6-d:
Normalized $\Delta \phi (j_{i},j_{j})$ distributions for the inclusive $N_ {\text {jets}} \geq 3$ jet-multiplicity bin: (a)all ${p_\mathrm {T}^\mathrm{ Z } }$ and (b) $ {p_\mathrm {T}^\mathrm{ Z } } > $ 150 GeV. Plots in (c) and (d) show the ratios of the data and other MC predictions, relative to MadGraph. |

png pdf |
Figure 7-a:
Normalized distributions in $\ln\tau _\mathrm {T}$ for (a) all $ {p_\mathrm {T}^\mathrm{ Z } } $ and $N_ {\text {jets}} \geq 1$ data, and (b) for $ {p_\mathrm {T}^\mathrm{ Z } } >$ 150 GeV and $N_ {\text {jets}} \geq 1$. Plots in (c) and (d) show the ratios of the data and other MC predictions, relative to MadGraph. |
png pdf |
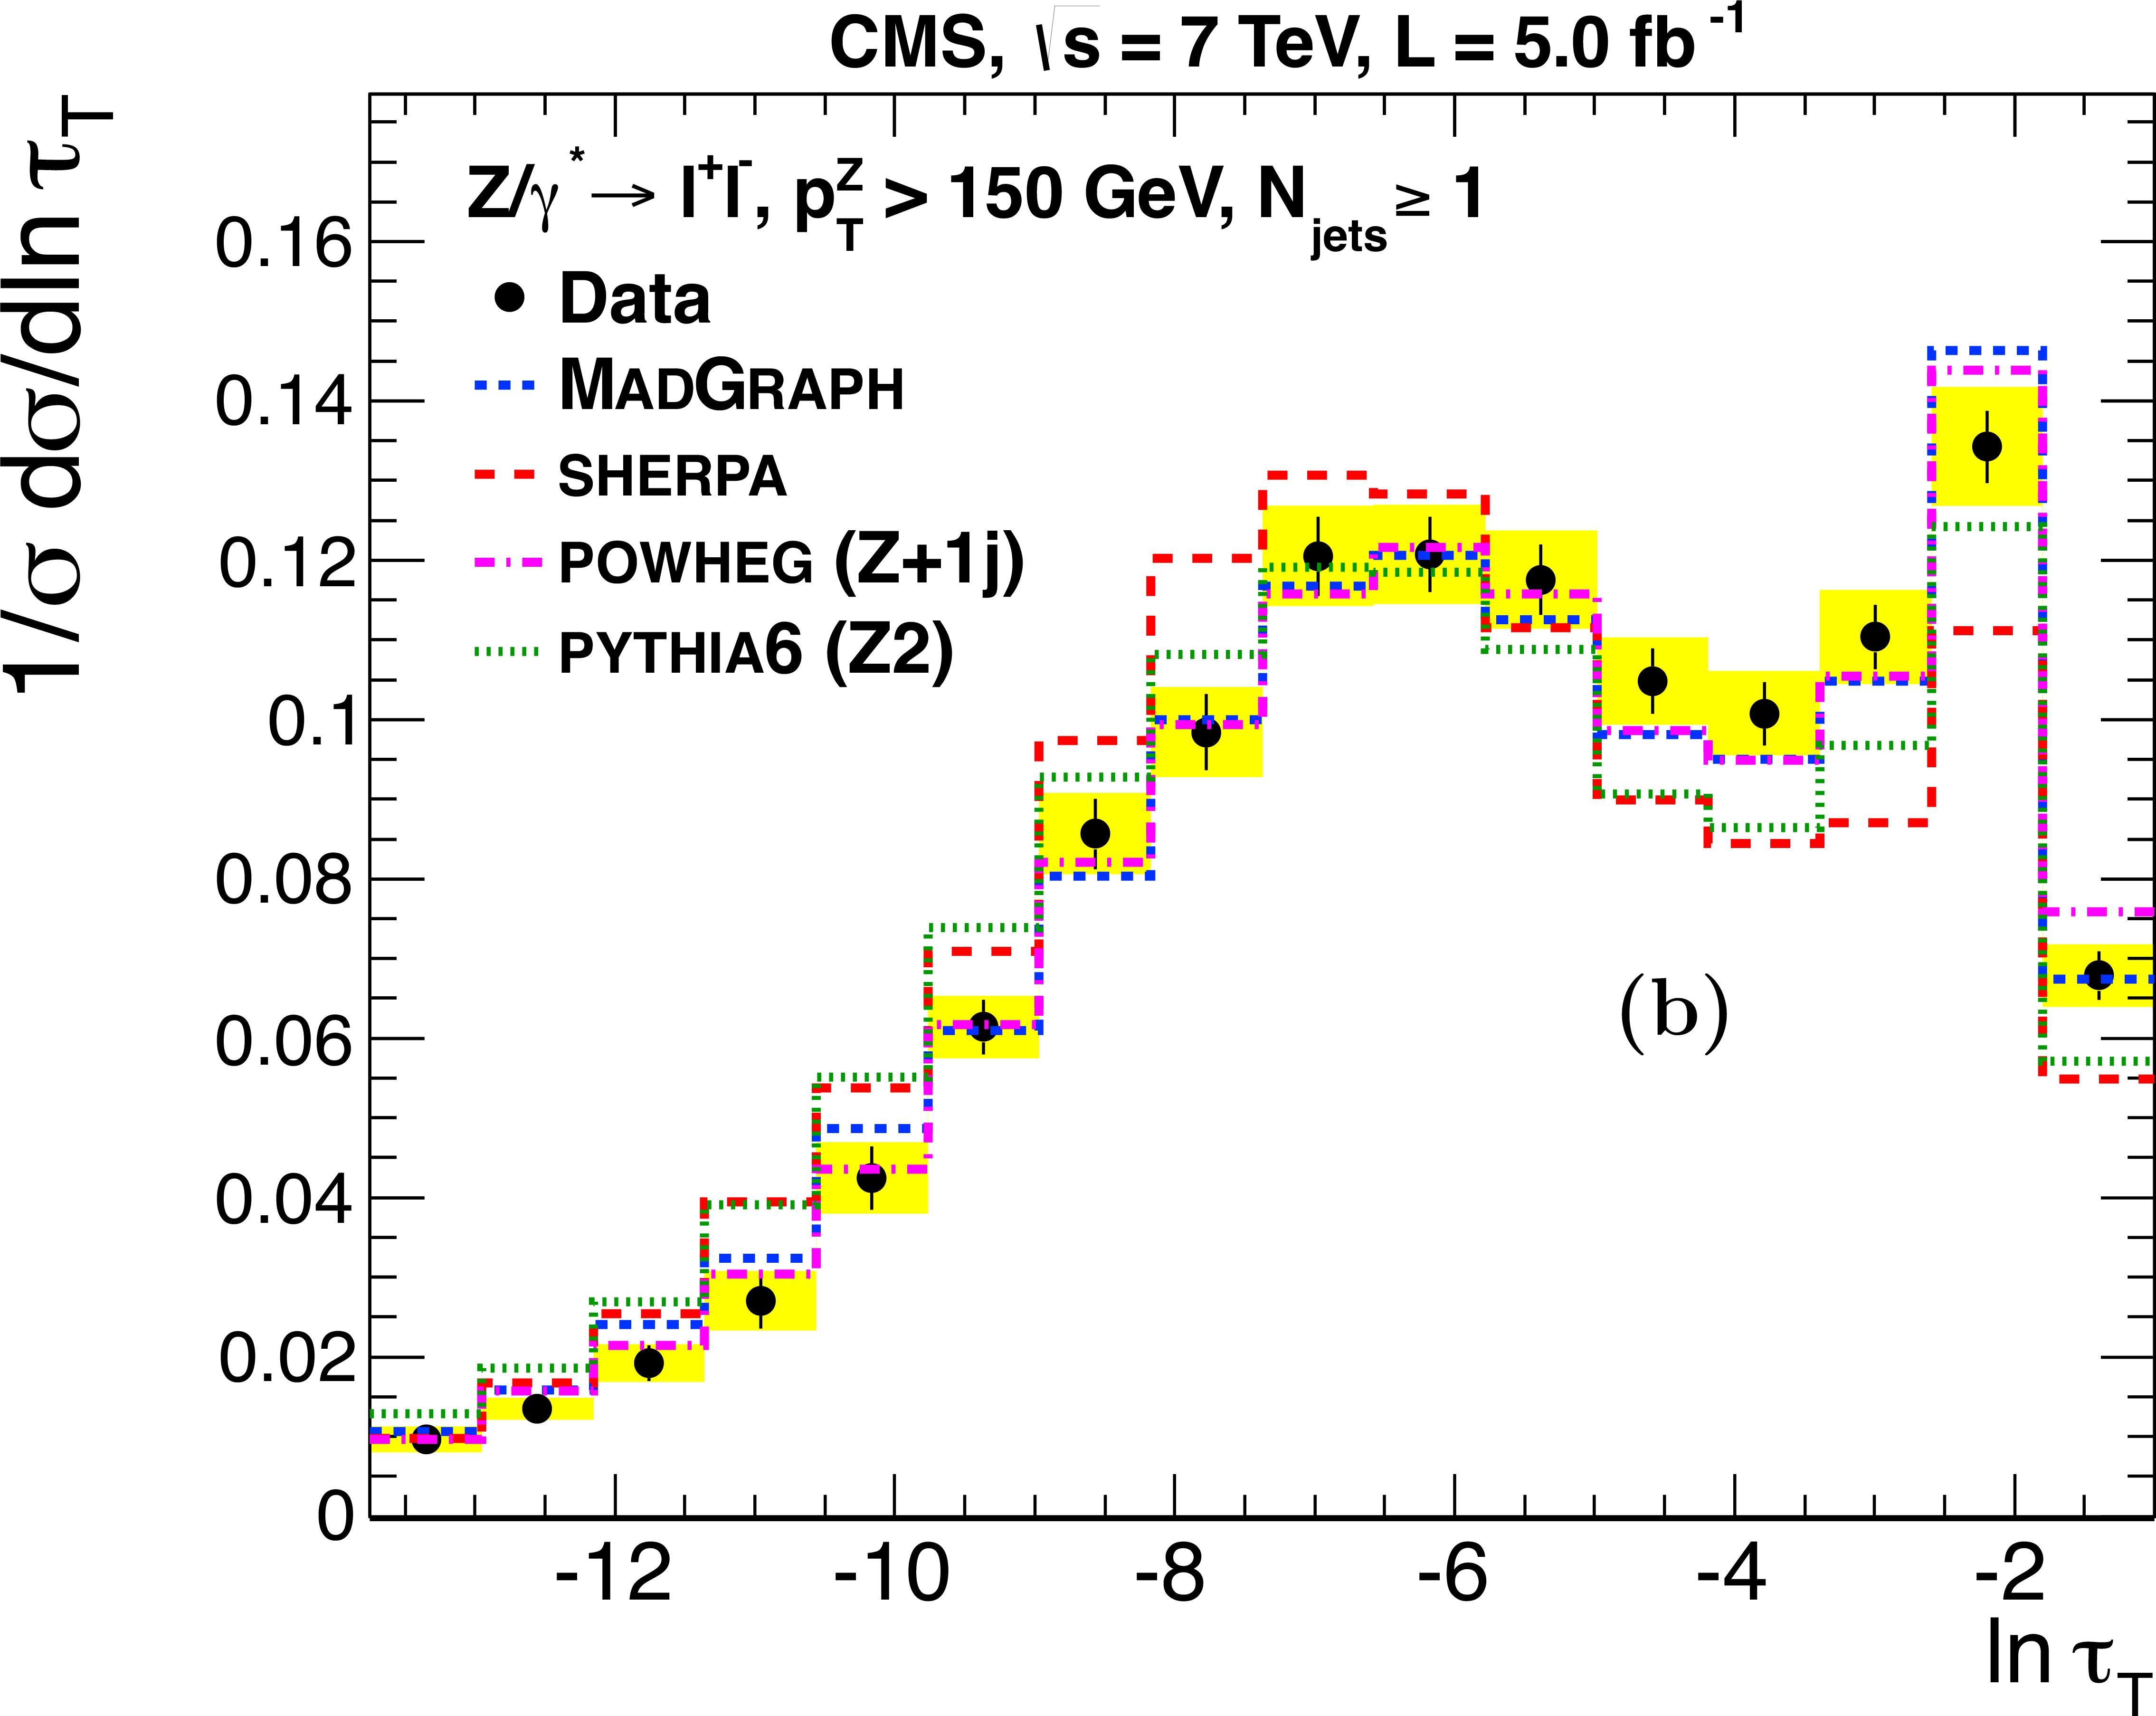
Figure 7-b:
Normalized distributions in $\ln\tau _\mathrm {T}$ for (a) all $ {p_\mathrm {T}^\mathrm{ Z } } $ and $N_ {\text {jets}} \geq 1$ data, and (b) for $ {p_\mathrm {T}^\mathrm{ Z } } >$ 150 GeV and $N_ {\text {jets}} \geq 1$. Plots in (c) and (d) show the ratios of the data and other MC predictions, relative to MadGraph. |

png pdf |
Figure 7-c:
Normalized distributions in $\ln\tau _\mathrm {T}$ for (a) all $ {p_\mathrm {T}^\mathrm{ Z } } $ and $N_ {\text {jets}} \geq 1$ data, and (b) for $ {p_\mathrm {T}^\mathrm{ Z } } >$ 150 GeV and $N_ {\text {jets}} \geq 1$. Plots in (c) and (d) show the ratios of the data and other MC predictions, relative to MadGraph. |

png pdf |
Figure 7-d:
Normalized distributions in $\ln\tau _\mathrm {T}$ for (a) all $ {p_\mathrm {T}^\mathrm{ Z } } $ and $N_ {\text {jets}} \geq 1$ data, and (b) for $ {p_\mathrm {T}^\mathrm{ Z } } >$ 150 GeV and $N_ {\text {jets}} \geq 1$. Plots in (c) and (d) show the ratios of the data and other MC predictions, relative to MadGraph. |
|
|
Compact Muon Solenoid LHC, CERN |
|

|

|

|

|

|