

Compact Muon Solenoid
LHC, CERN
| CMS-EXO-12-024 ; CERN-PH-EP-2014-071 | ||
| Search for massive resonances in dijet systems containing jets tagged as W or Z boson decays in pp collisions at $\sqrt{s}$ = 8 TeV | ||
| CMS Collaboration | ||
| 8 May 2014 | ||
| J. High Energy Phys. 08 (2014) 173 | ||
| Abstract: A search is reported for massive resonances decaying into a quark and a vector boson (W or Z), or two vector bosons (WW, WZ, or ZZ). The analysis is performed on an inclusive sample of multijet events corresponding to an integrated luminosity of 19.7 inverse femtobarns, collected in proton-proton collisions at a centre-of-mass energy of 8 TeV with the CMS detector at the LHC. The search uses novel jet-substructure identification techniques that provide sensitivity to the presence of highly boosted vector bosons decaying into a pair of quarks. Exclusion limits are set at a confidence level of 95% on the production of: (i) excited quark resonances q* decaying to qW and qZ for masses less than 3.2 TeV and 2.9 TeV, respectively, (ii) a Randall-Sundrum graviton G[RS] decaying into WW for masses below 1.2 TeV, and (iii) a heavy partner of the W boson W' decaying into WZ for masses less than 1.7 TeV. For the first time mass limits are set on W' $\to$ WZ and $G_{RS} \to WW$ in the all-jets final state. The mass limits on q* $\to$ qW, q* $\to$ qZ, W' $\to$ WZ, $G_{RS} \to WW$ are the most stringent to date. A model with a "bulk" graviton $G_{Bulk}$ that decays into WW or ZZ bosons is also studied. | ||
| Links: e-print arXiv:1405.1994 [hep-ex] (PDF) ; CDS record ; inSPIRE record ; Public twiki page ; HepData record ; CADI line (restricted) ; | ||
| Figures | |

png pdf |
Figure 1:
The fraction of simulated signal events expected for vector bosons decaying into two quarks, reconstructed as two jets, that pass the geometrical acceptance criteria ($ {| \eta | } < $ 2.5, $ {| \Delta \eta | }<$ 1.3), shown as a function of the dijet invariant mass. |

png pdf |
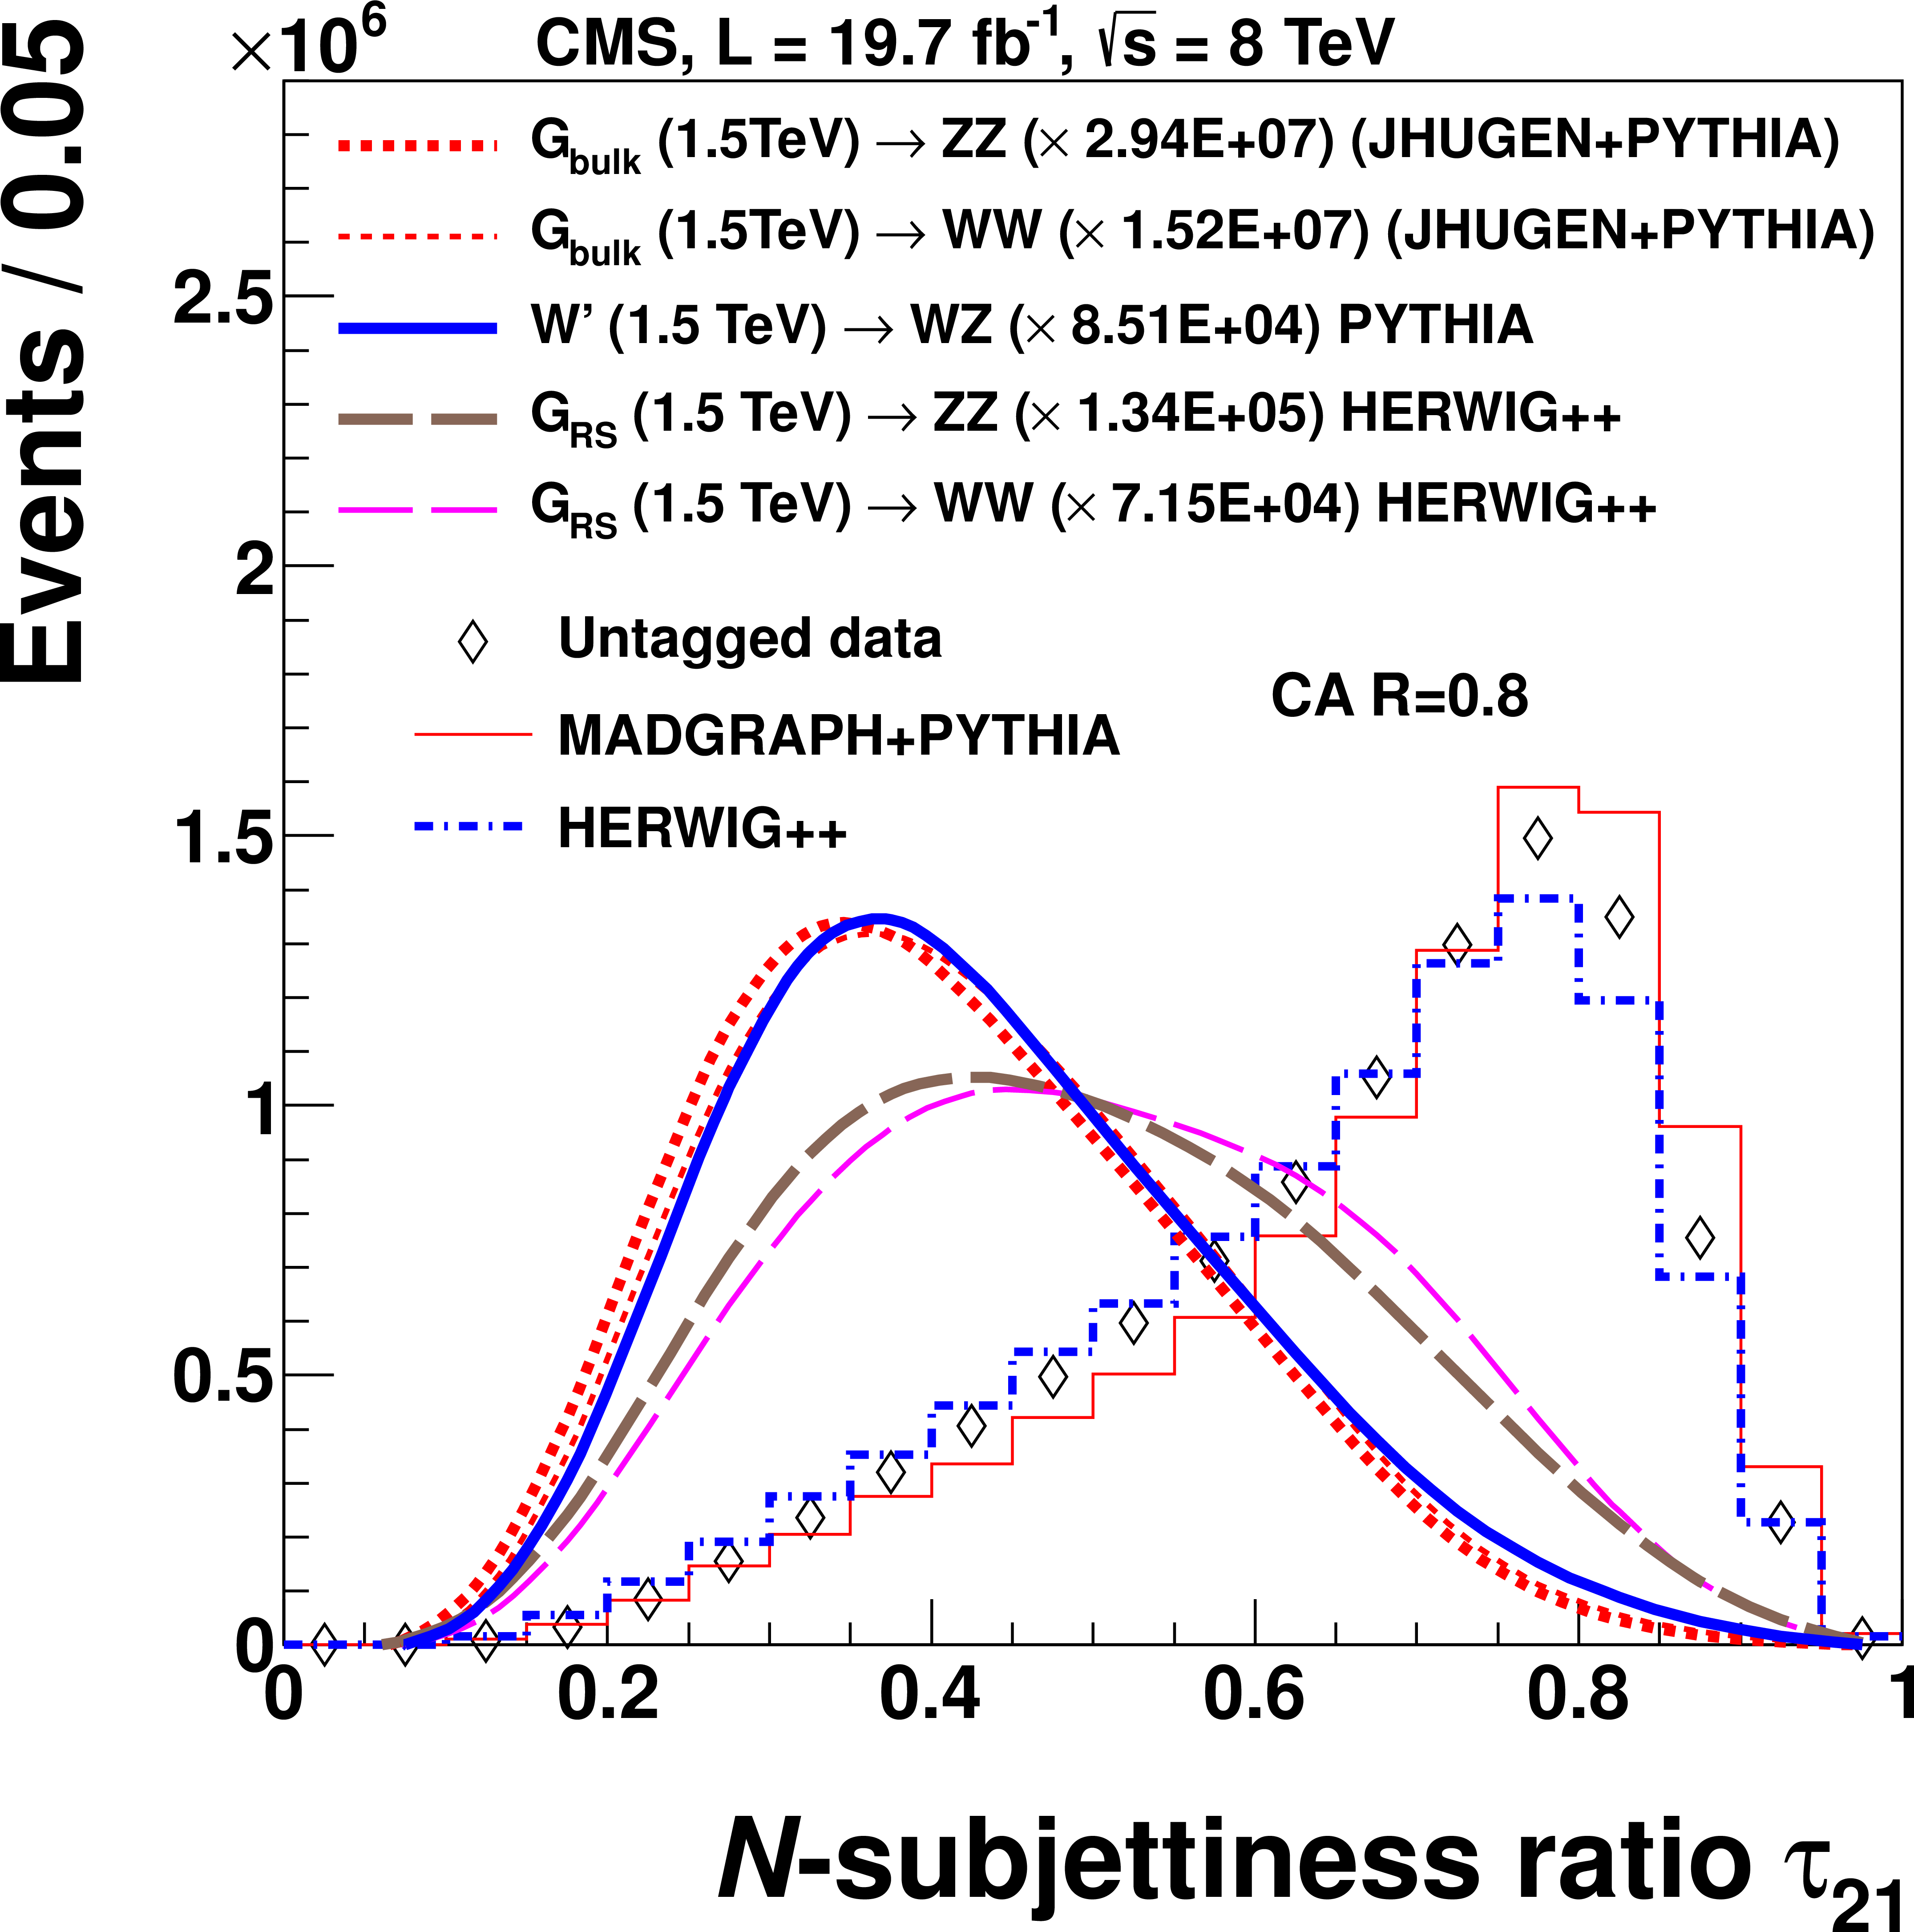
Figure 2-a:
Distribution for (a) pruned-jet mass $m_\mathrm {j}$ and (b) jet $N$-subjettiness ratio $\tau _{21}$ in data, and in simulations of signal and background events. All simulated distributions are scaled to match the number of events in data. MadGraph/PYTHIA and HERWIG++ refer to QCD multijet event simulations. |
png pdf |
Figure 2-b:
Distribution for (a) pruned-jet mass $m_\mathrm {j}$ and (b) jet $N$-subjettiness ratio $\tau _{21}$ in data, and in simulations of signal and background events. All simulated distributions are scaled to match the number of events in data. MadGraph/PYTHIA and HERWIG++ refer to QCD multijet event simulations. |
png pdf |
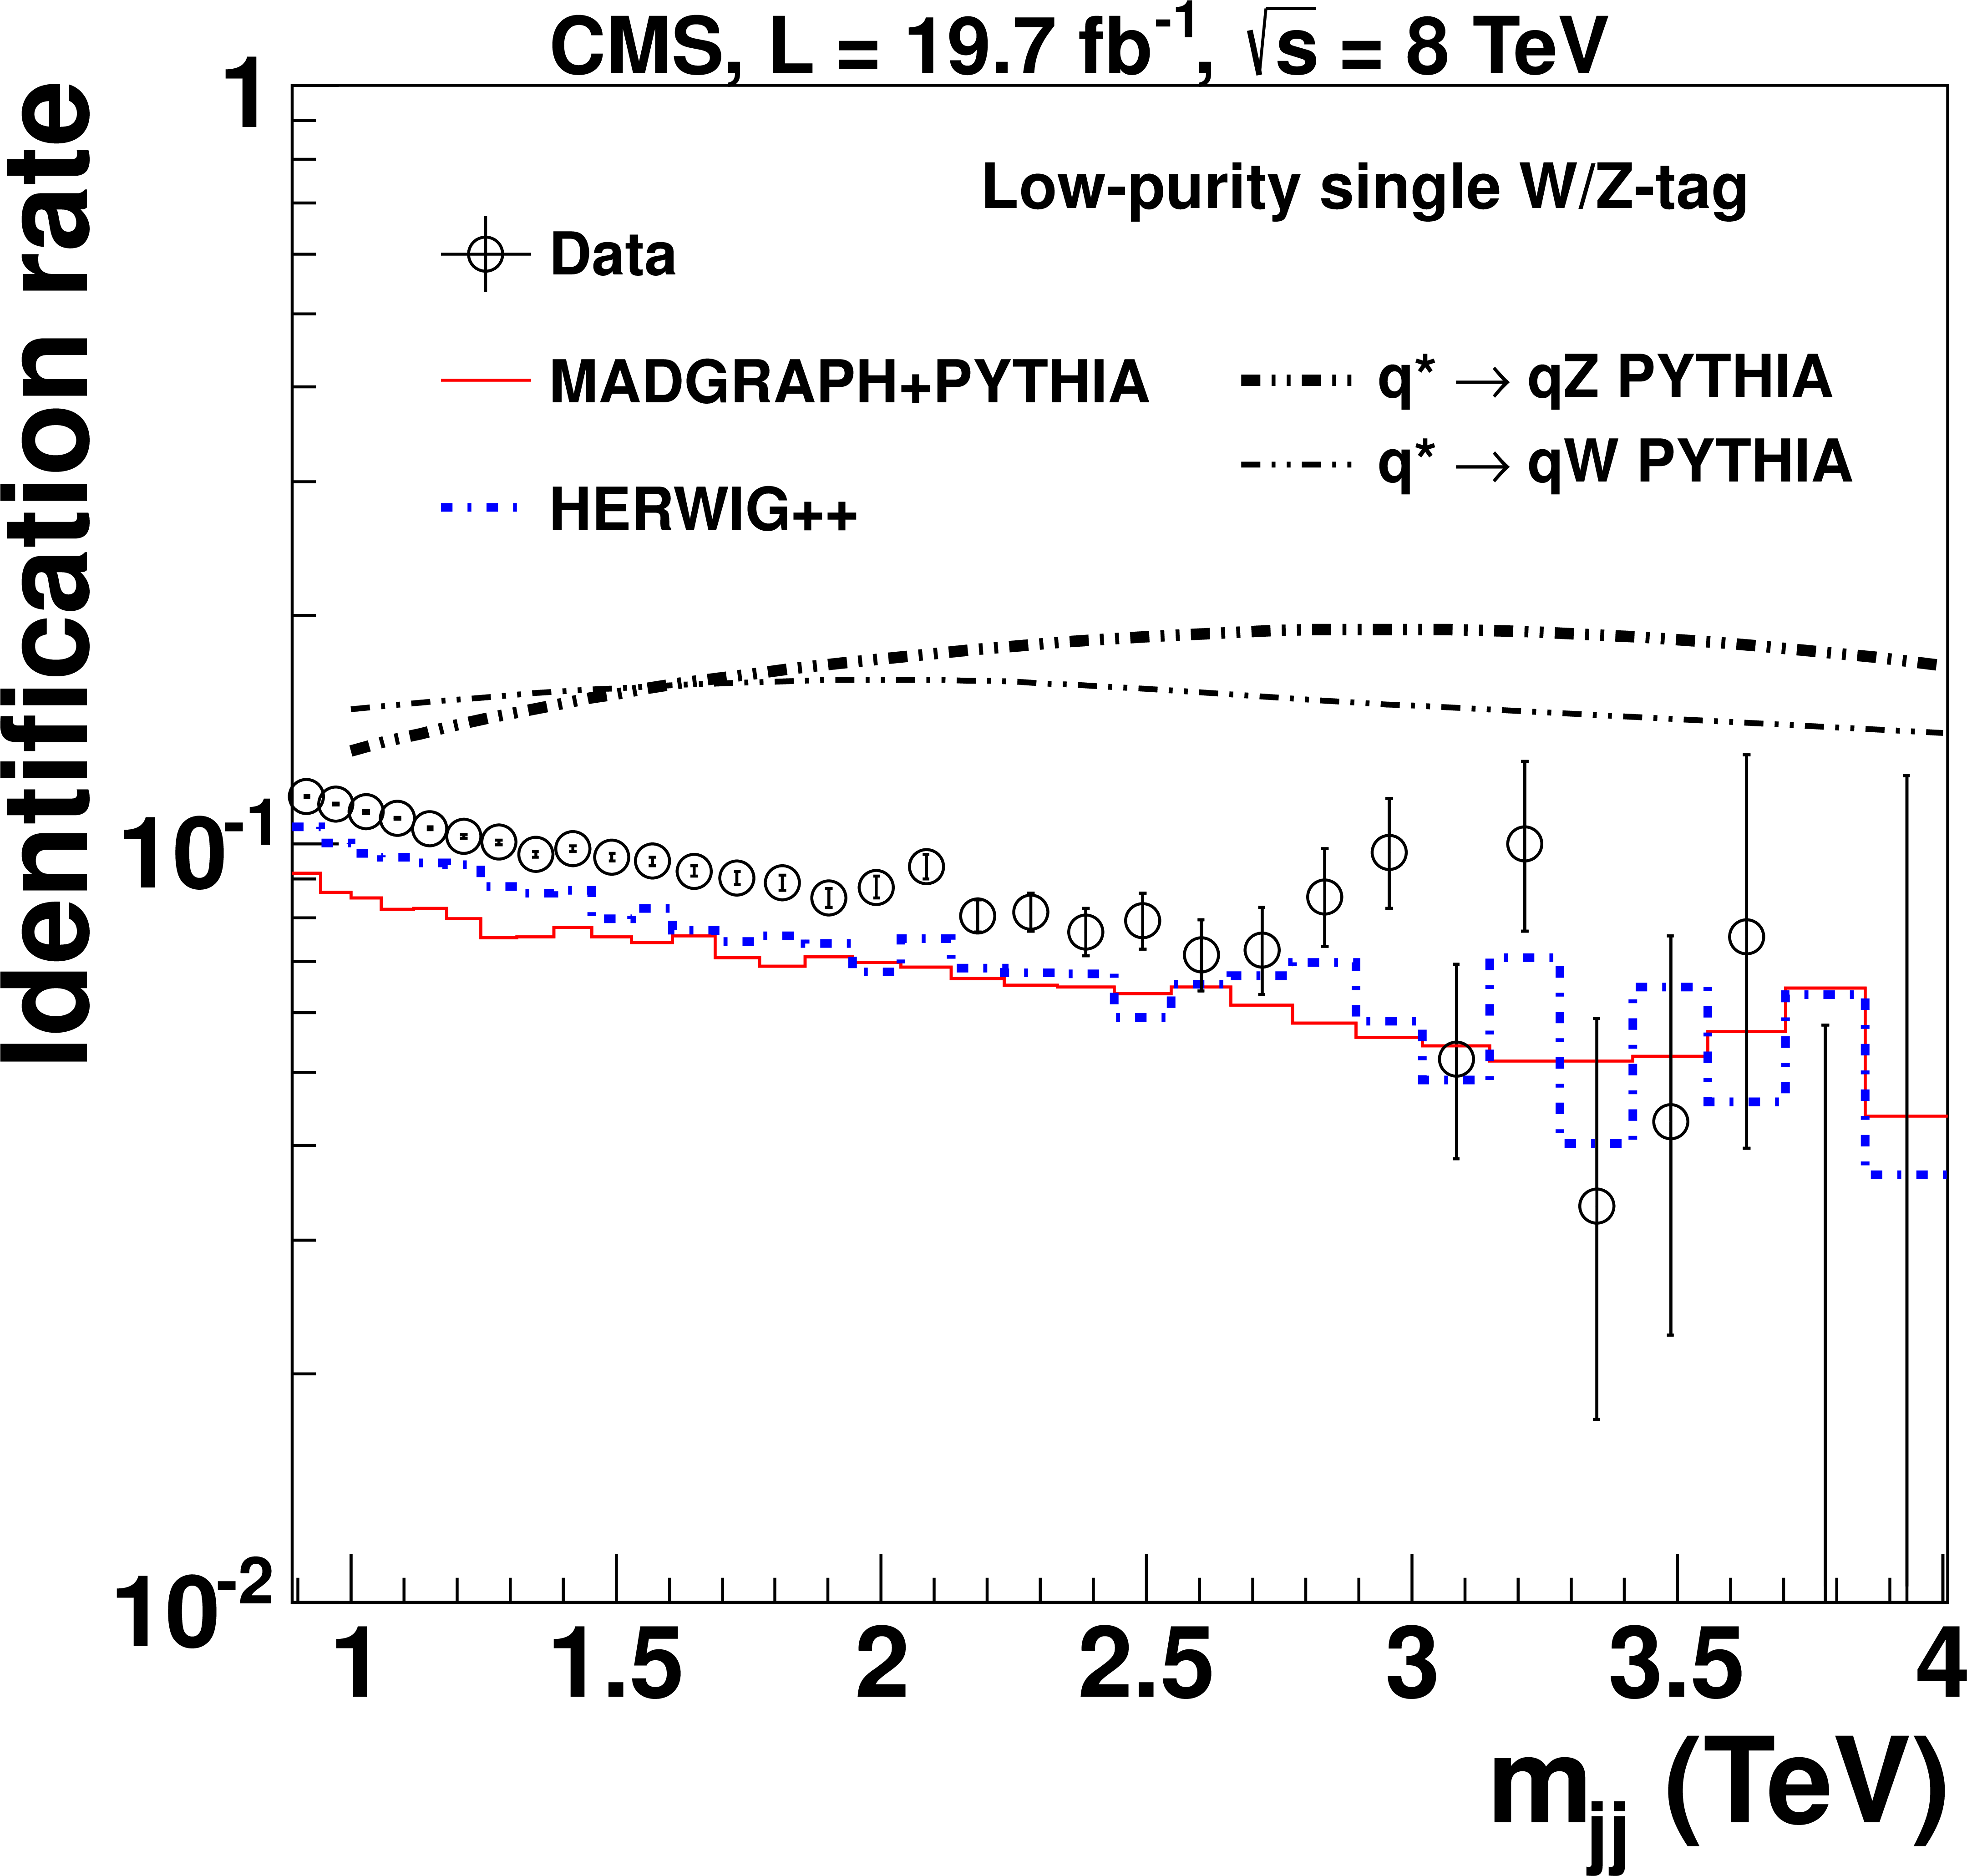
Figure 3-a:
Identification rate for W and Z boson selections as a function of $m_\mathrm {jj}$ for quark and gluon jets in data and in simulation of background events, and for jets from W and Z bosons in simulation of signal events, with (a) one LP or (b) HP W/Z-tag, and the fraction of (c) doubly-tagged events in the LP and (d) HP category. The identification rate is computed for $ {\mathrm {W}}/ {\mathrm {Z}}\to {\overline {\mathrm {q}}} {\mathrm {q}}' \to \text {jets}$ events, where the jets have $ {| \eta | } < $ 2.5 and $ {| \Delta \eta | }<$ 1.3. MadGraph/PYTHIA and HERWIG++ refer to QCD multijet event simulations. |
png pdf |
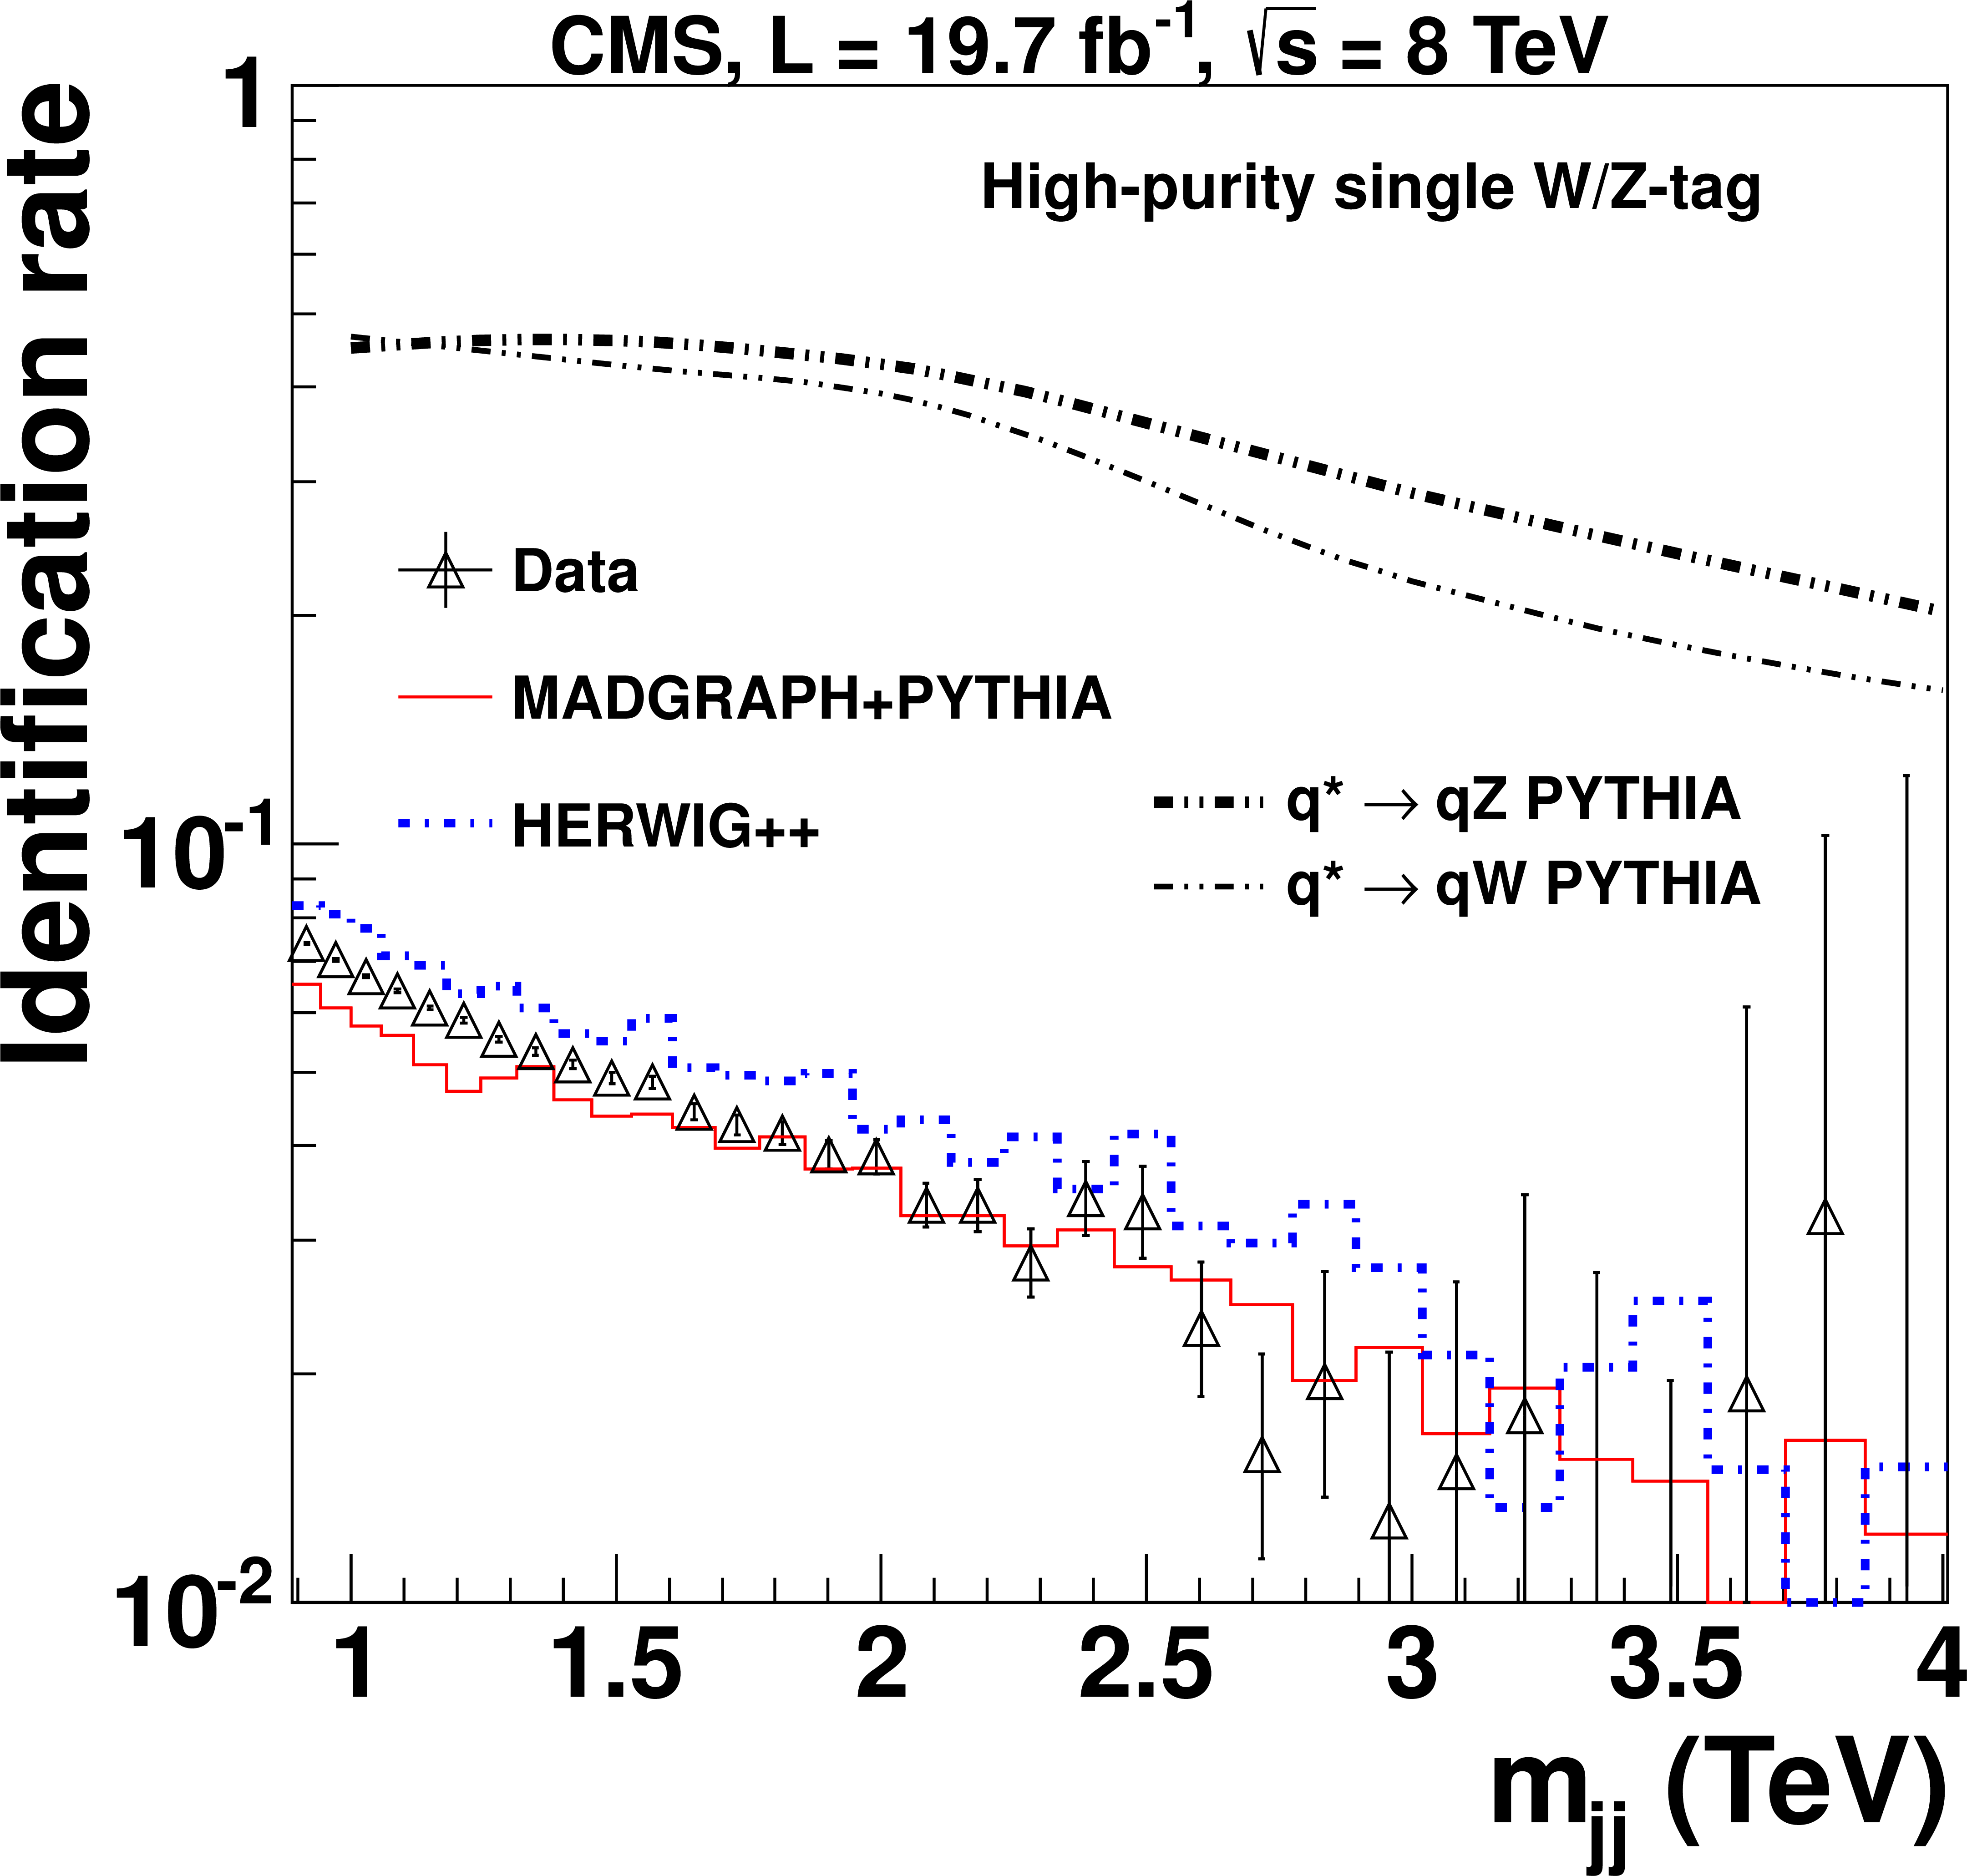
Figure 3-b:
Identification rate for W and Z boson selections as a function of $m_\mathrm {jj}$ for quark and gluon jets in data and in simulation of background events, and for jets from W and Z bosons in simulation of signal events, with (a) one LP or (b) HP W/Z-tag, and the fraction of (c) doubly-tagged events in the LP and (d) HP category. The identification rate is computed for $ {\mathrm {W}}/ {\mathrm {Z}}\to {\overline {\mathrm {q}}} {\mathrm {q}}' \to \text {jets}$ events, where the jets have $ {| \eta | } < $ 2.5 and $ {| \Delta \eta | }<$ 1.3. MadGraph/PYTHIA and HERWIG++ refer to QCD multijet event simulations. |
png pdf |
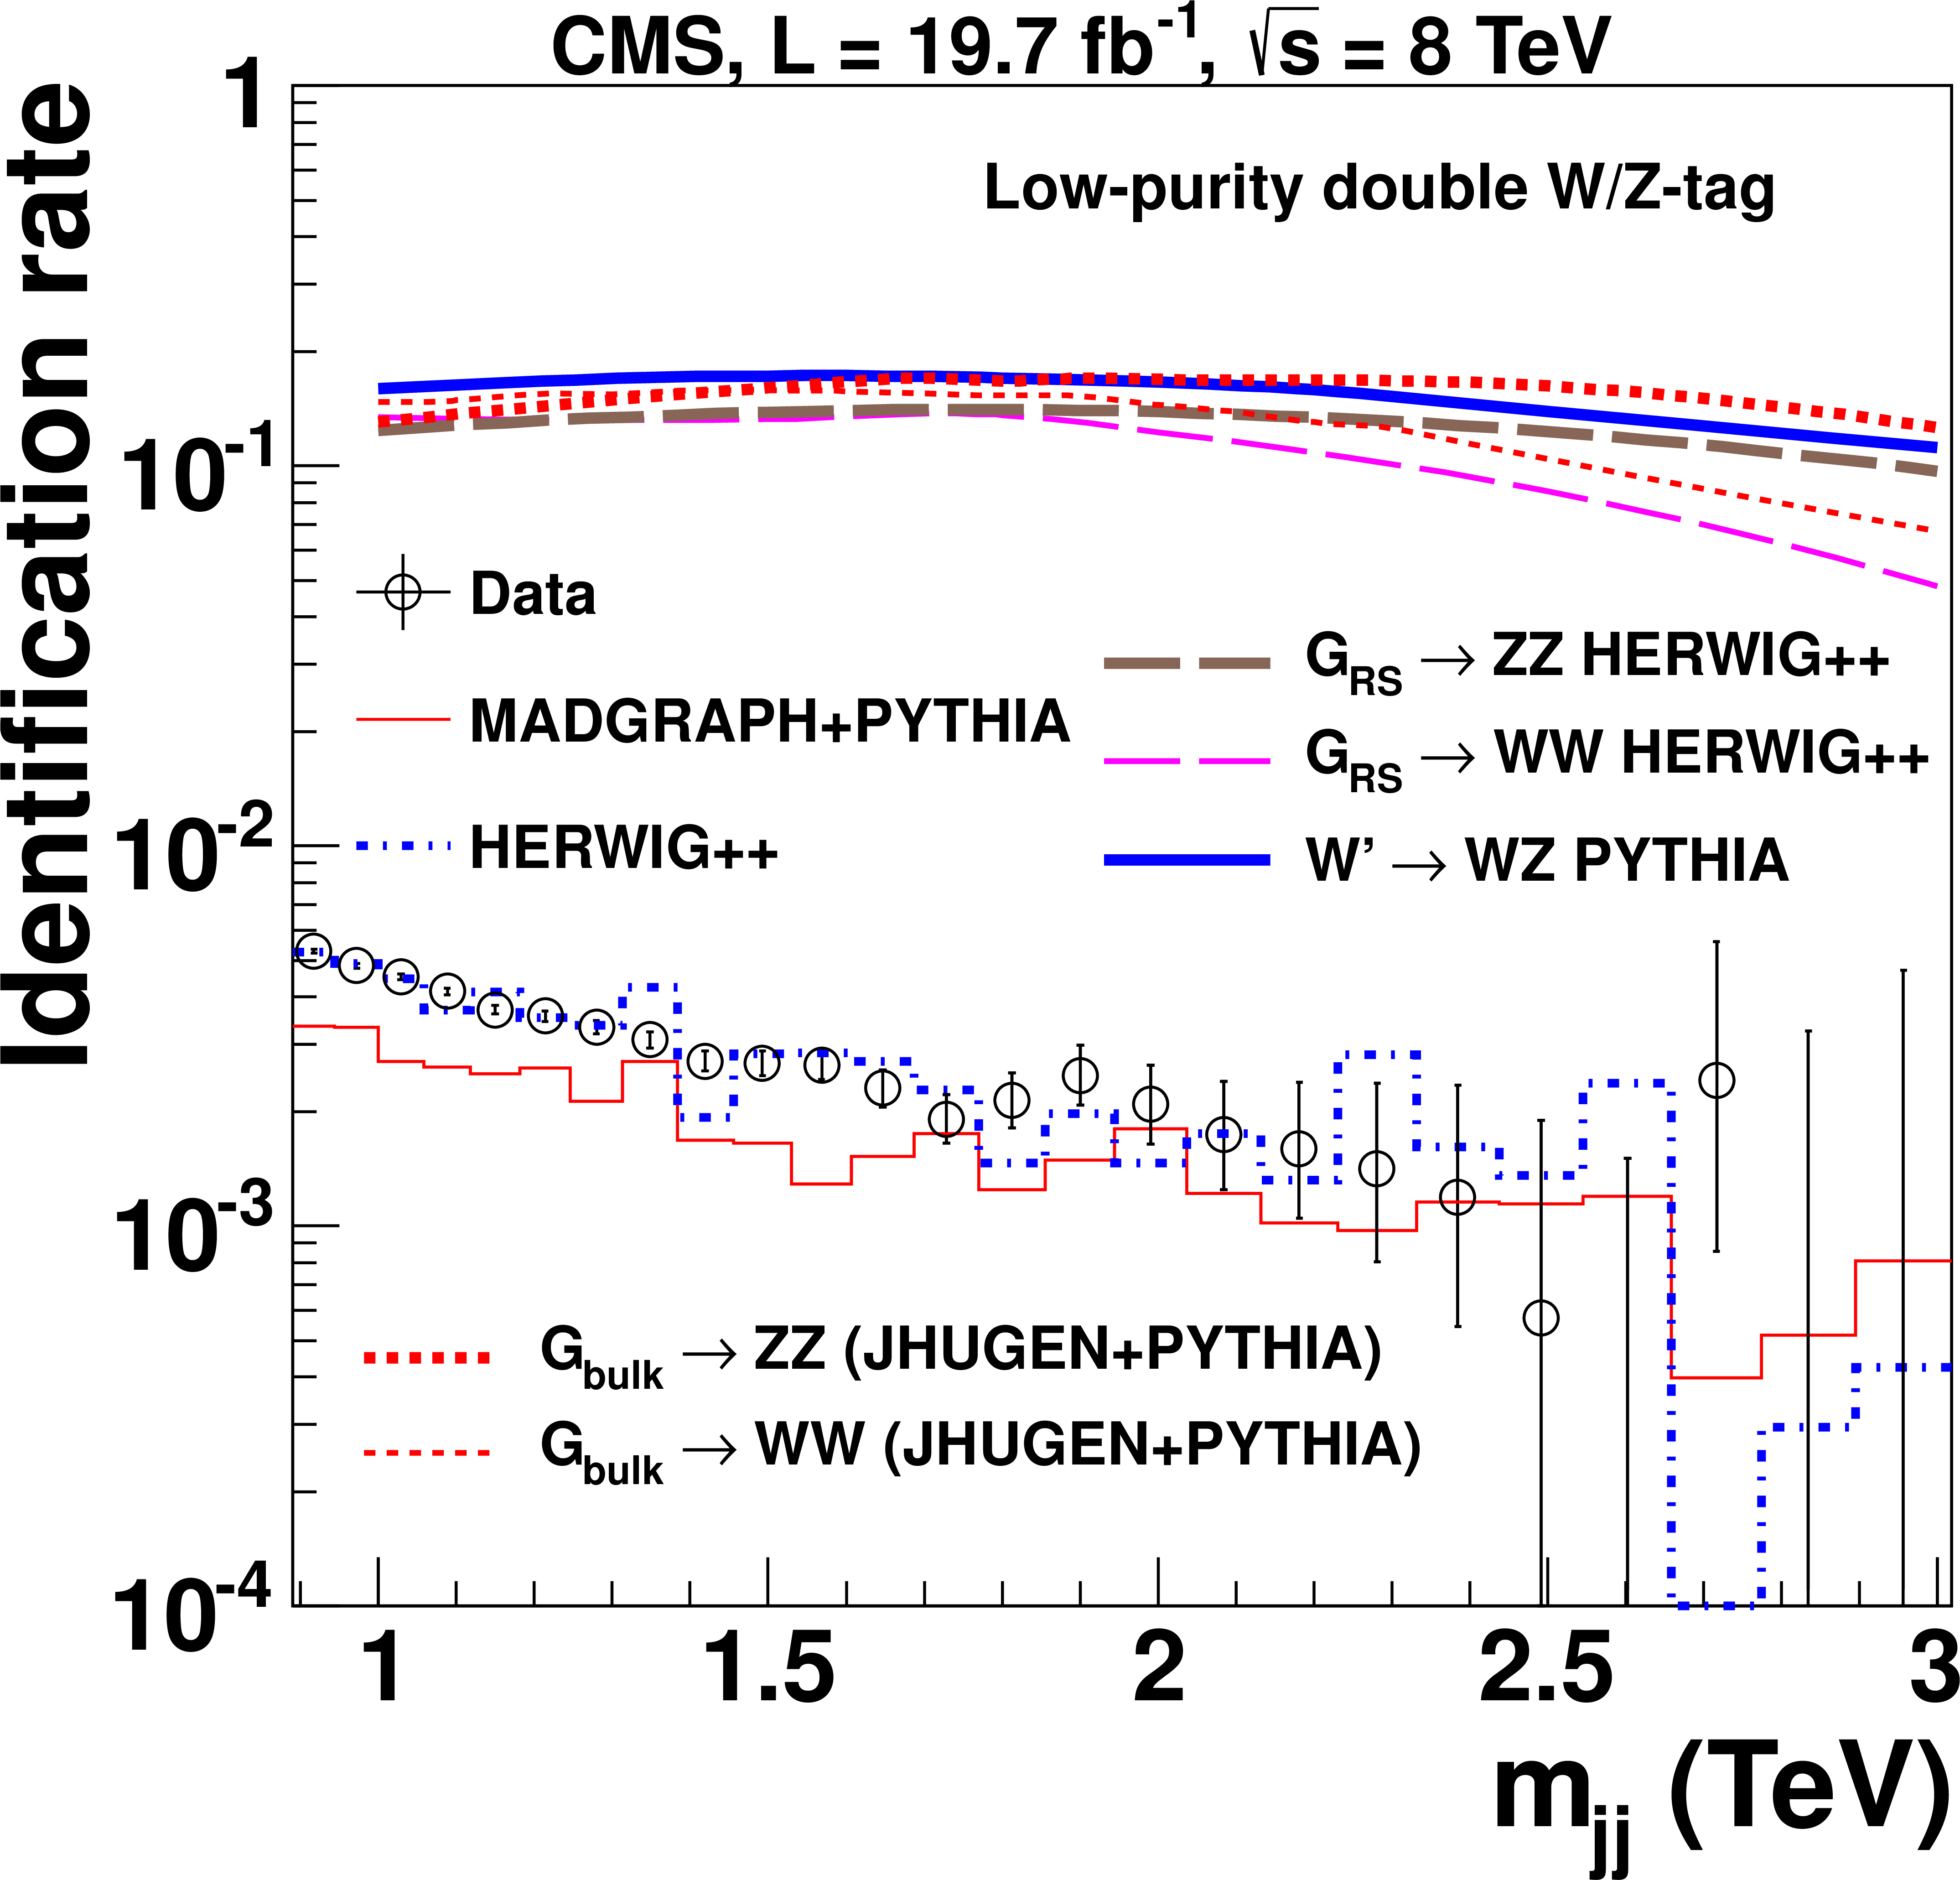
Figure 3-c:
Identification rate for W and Z boson selections as a function of $m_\mathrm {jj}$ for quark and gluon jets in data and in simulation of background events, and for jets from W and Z bosons in simulation of signal events, with (a) one LP or (b) HP W/Z-tag, and the fraction of (c) doubly-tagged events in the LP and (d) HP category. The identification rate is computed for $ {\mathrm {W}}/ {\mathrm {Z}}\to {\overline {\mathrm {q}}} {\mathrm {q}}' \to \text {jets}$ events, where the jets have $ {| \eta | } < $ 2.5 and $ {| \Delta \eta | }<$ 1.3. MadGraph/PYTHIA and HERWIG++ refer to QCD multijet event simulations. |
png pdf |
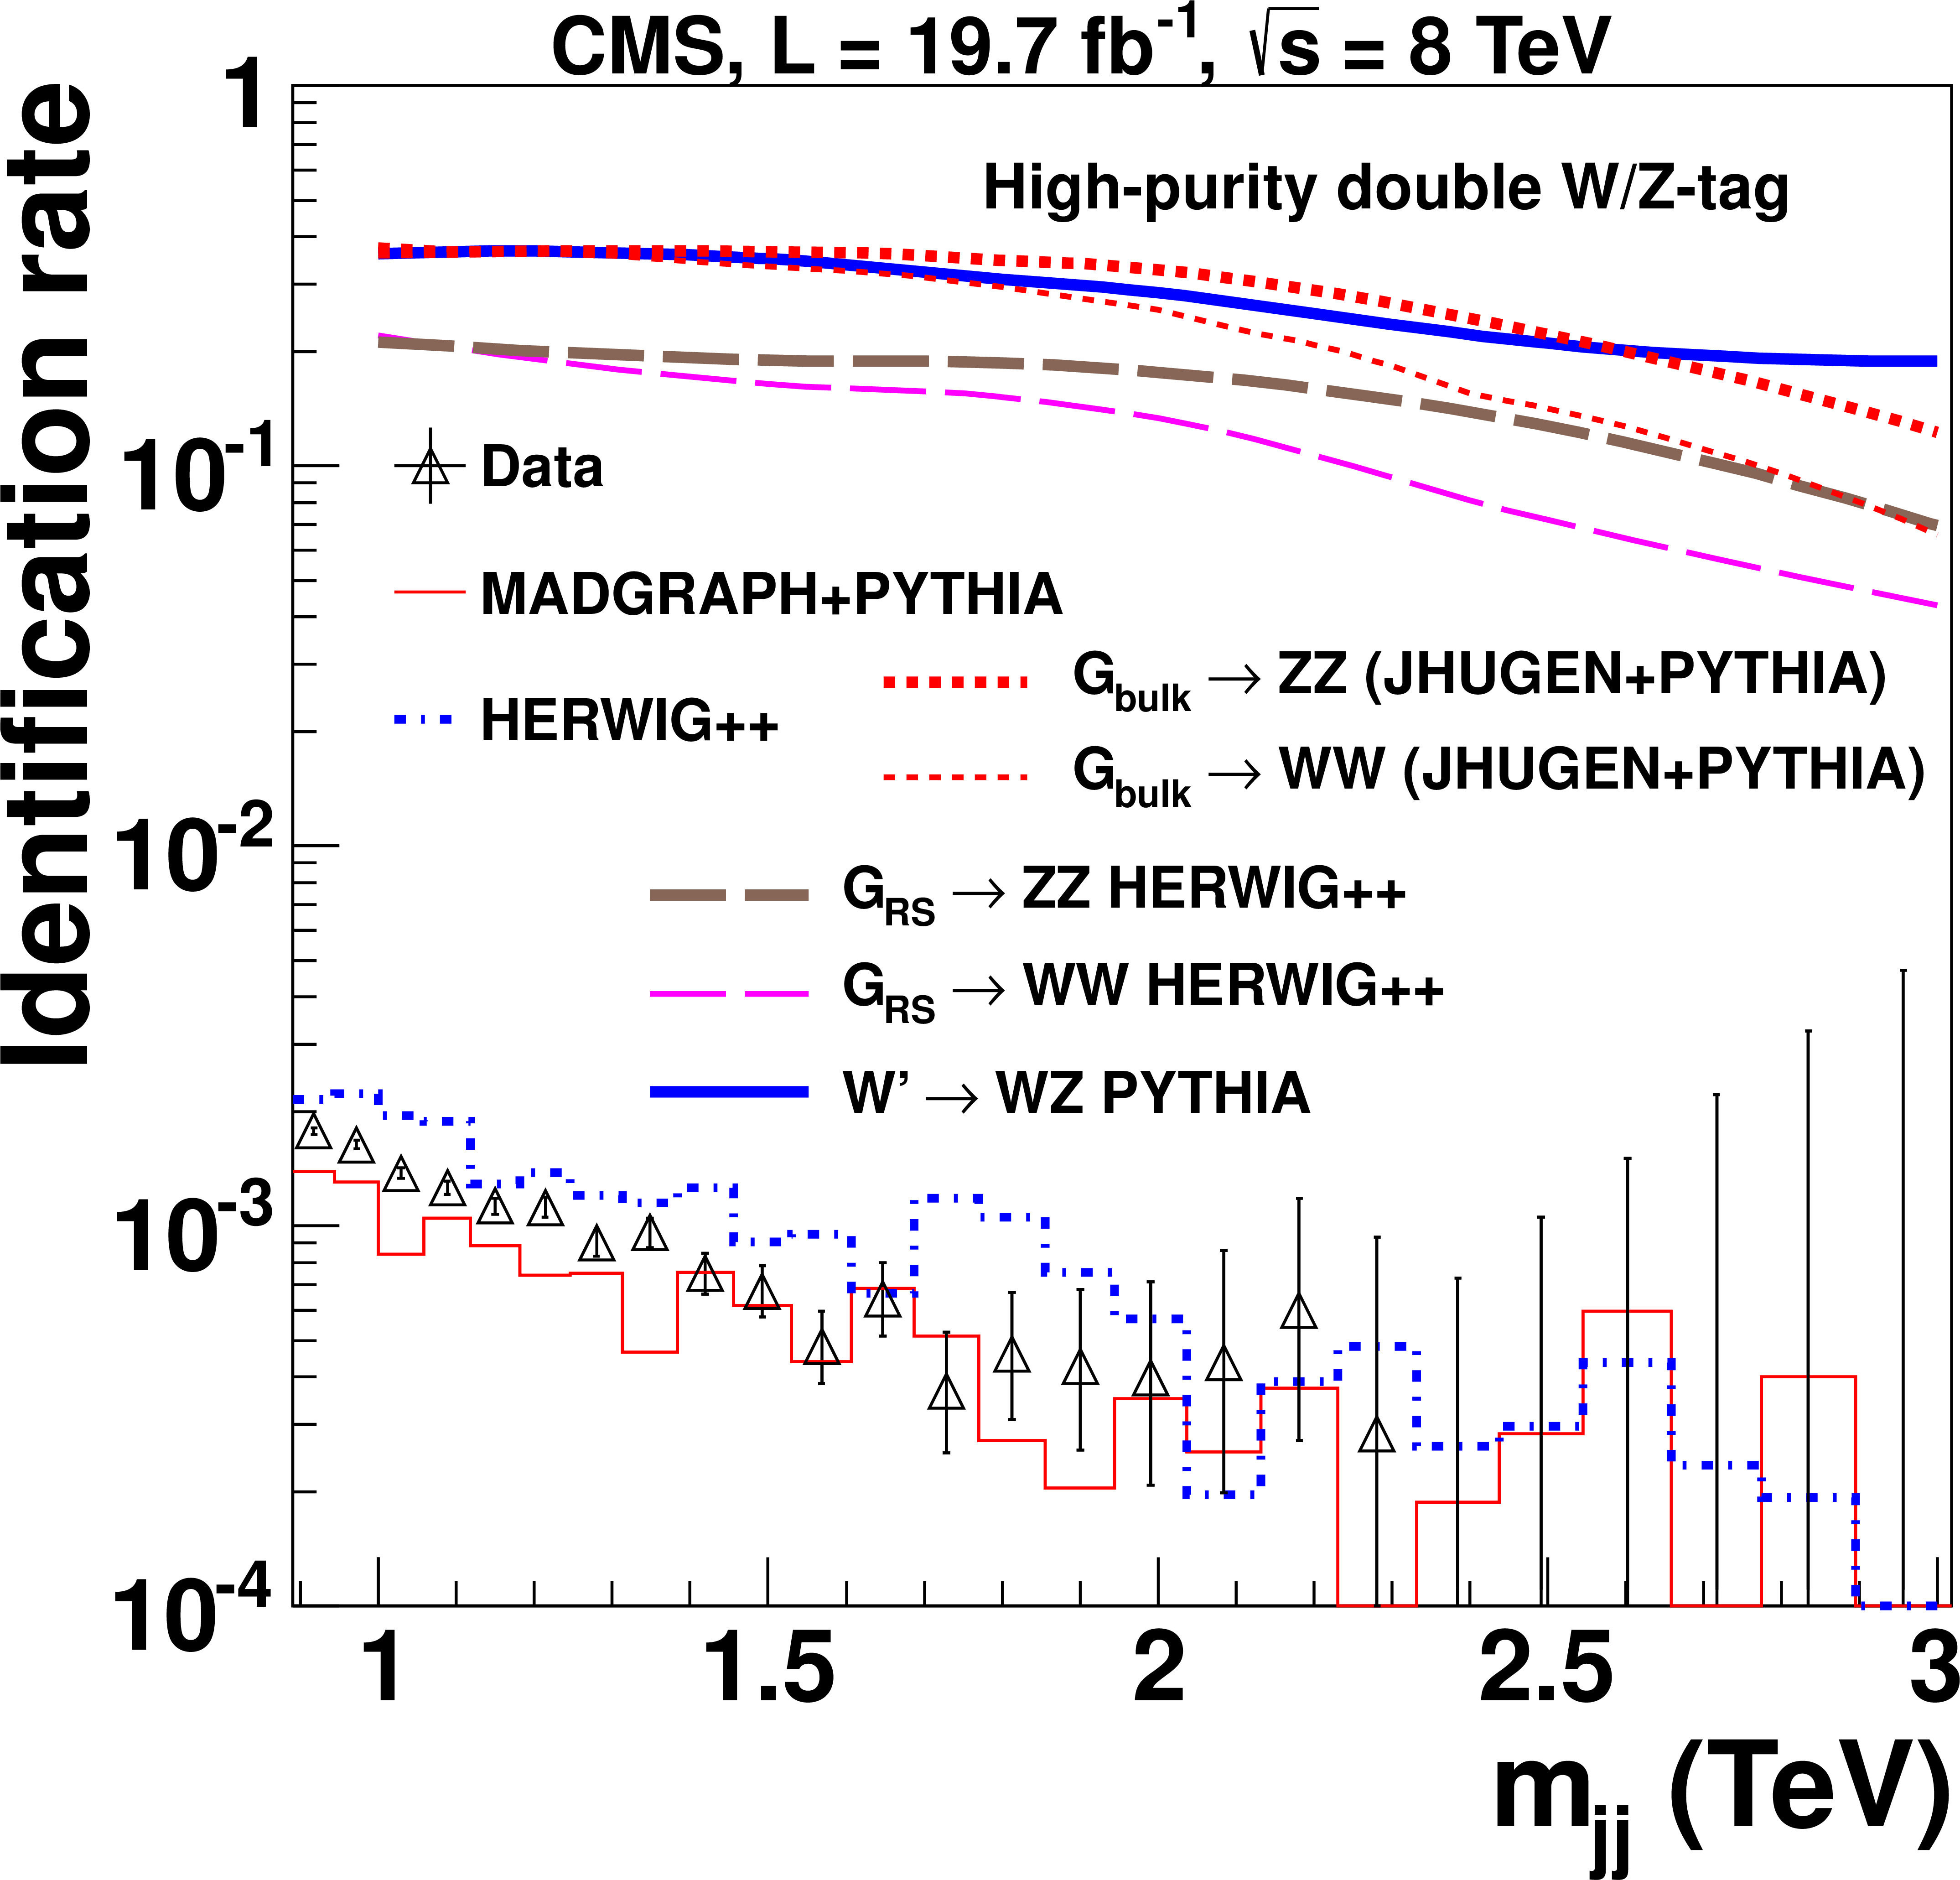
Figure 3-d:
Identification rate for W and Z boson selections as a function of $m_\mathrm {jj}$ for quark and gluon jets in data and in simulation of background events, and for jets from W and Z bosons in simulation of signal events, with (a) one LP or (b) HP W/Z-tag, and the fraction of (c) doubly-tagged events in the LP and (d) HP category. The identification rate is computed for $ {\mathrm {W}}/ {\mathrm {Z}}\to {\overline {\mathrm {q}}} {\mathrm {q}}' \to \text {jets}$ events, where the jets have $ {| \eta | } < $ 2.5 and $ {| \Delta \eta | }<$ 1.3. MadGraph/PYTHIA and HERWIG++ refer to QCD multijet event simulations. |
png pdf |
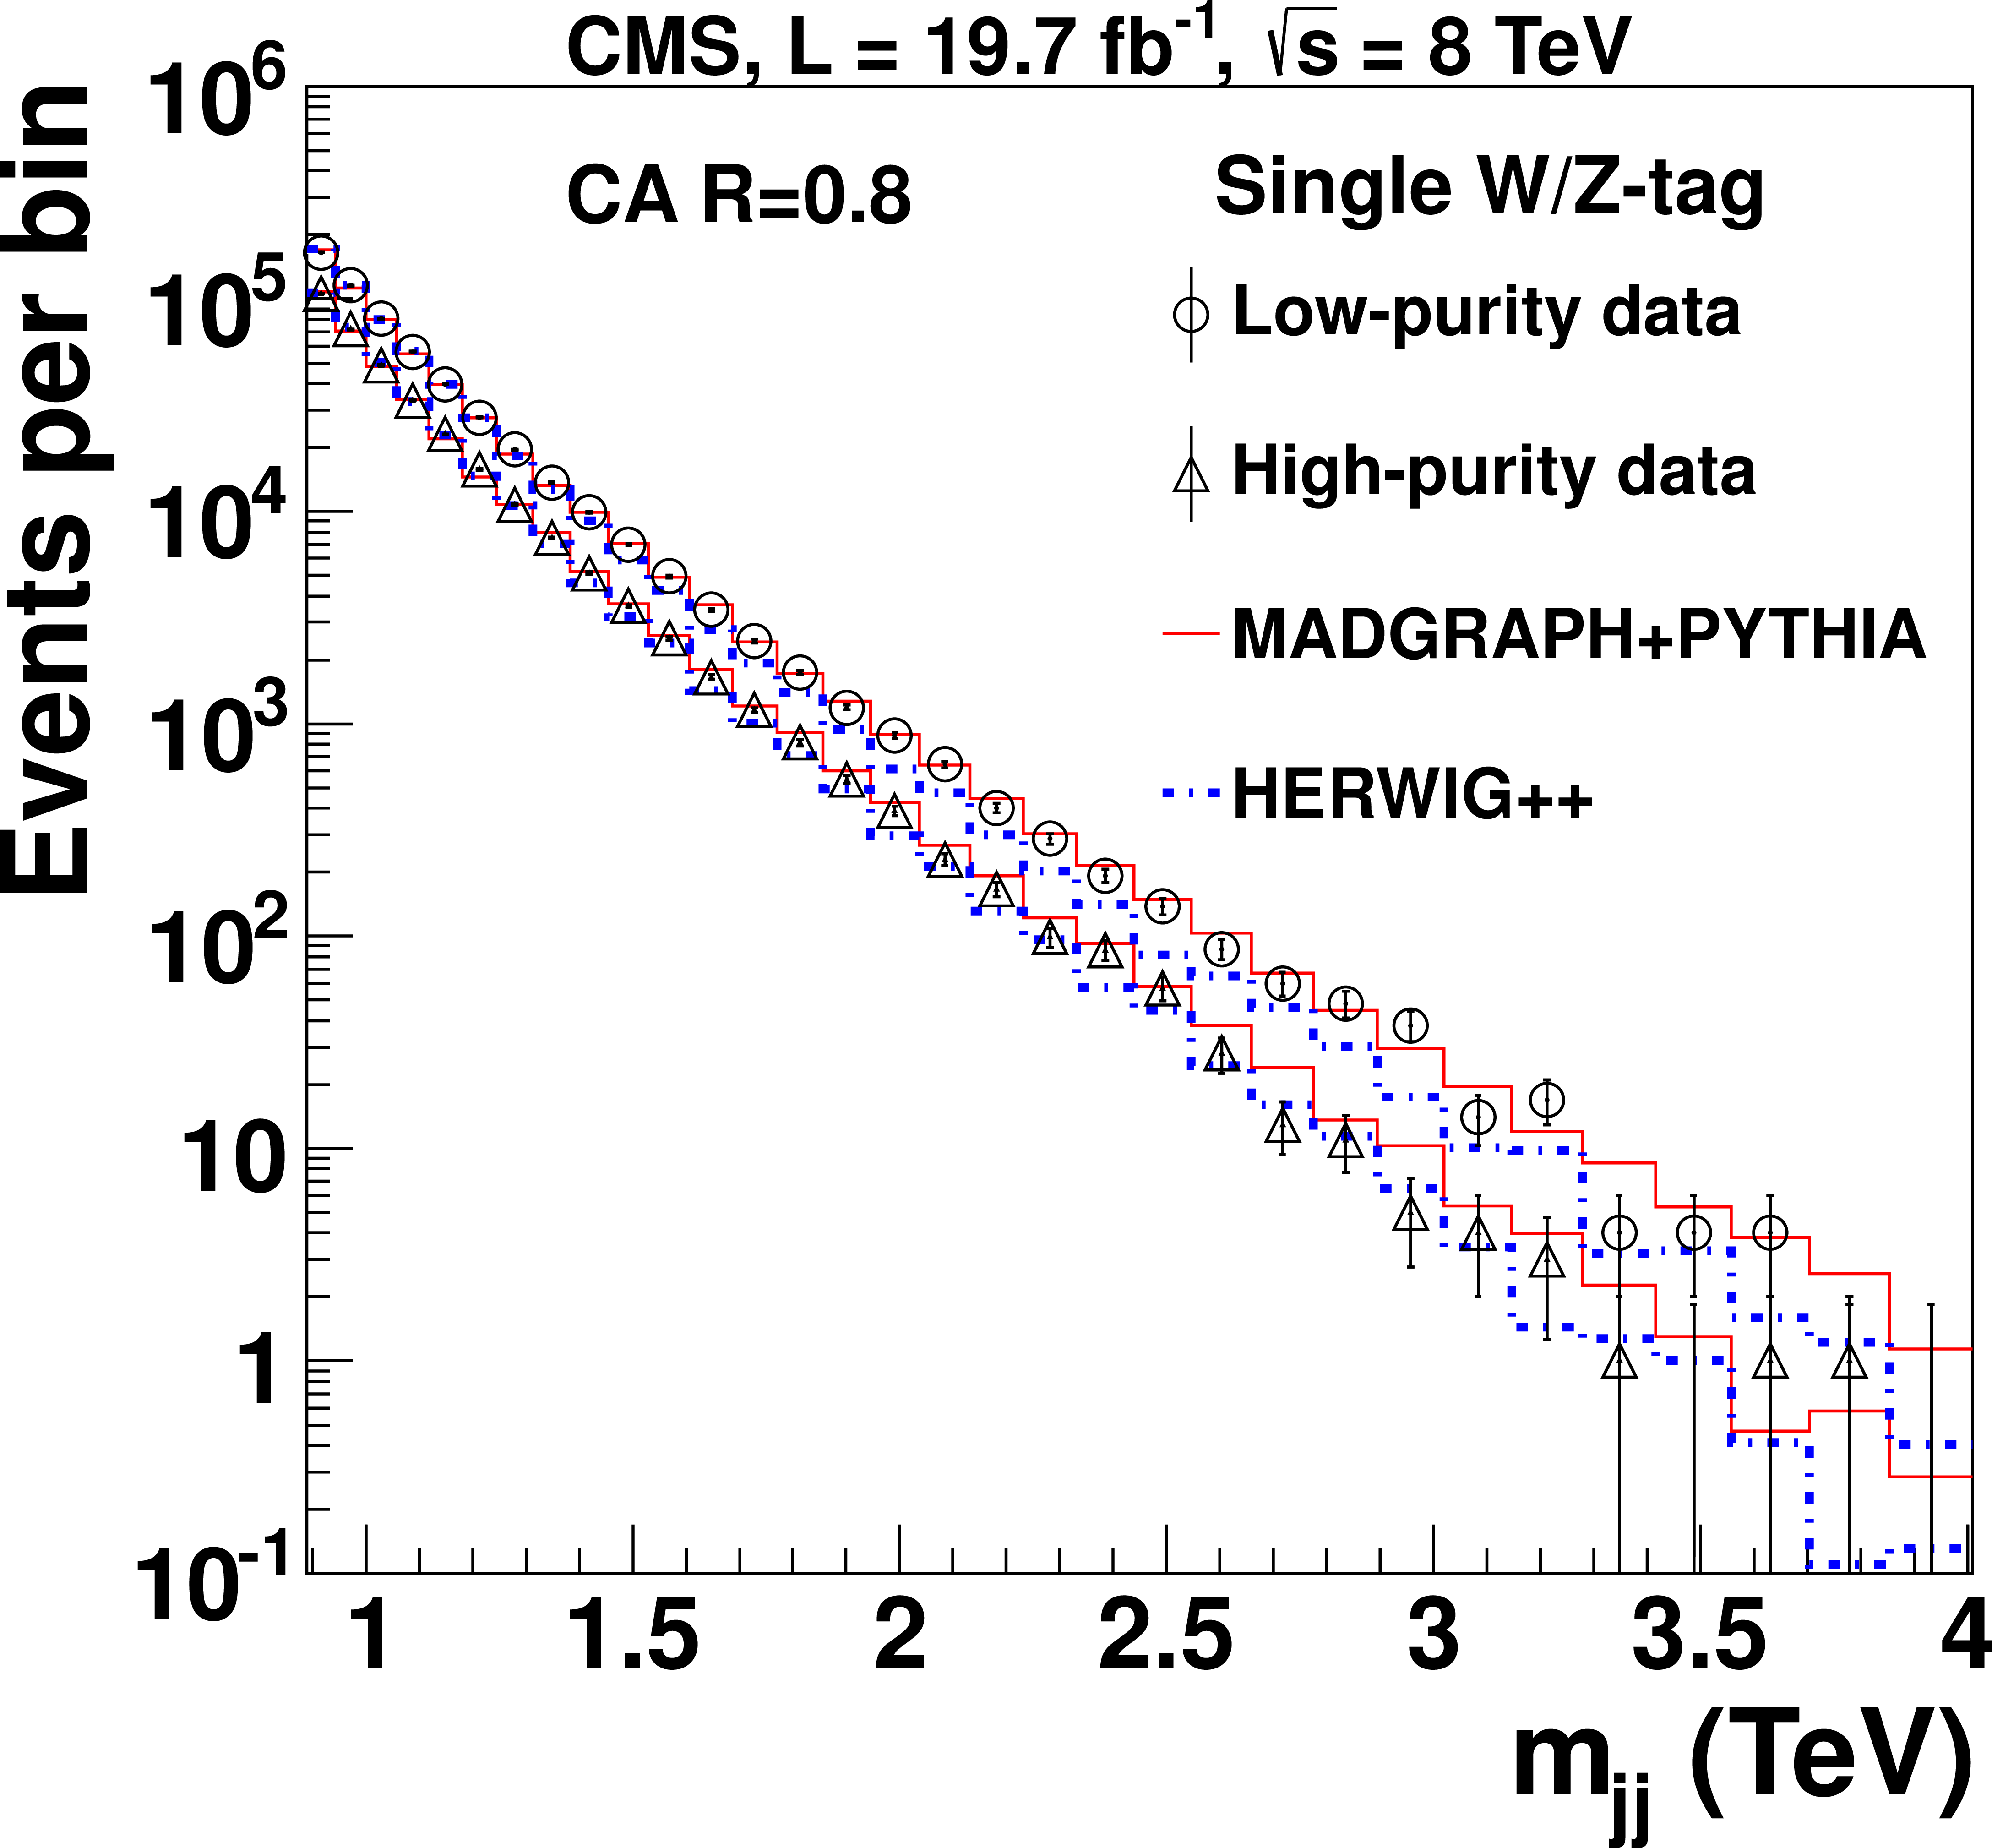
Figure 4-a:
The $m_\mathrm {jj}$ distributions for (left) singly and (right) doubly tagged events in data, and for QCD multijet (MadGraph/PYTHIA and HERWIG++) simulations, normalized to data. |
png pdf |
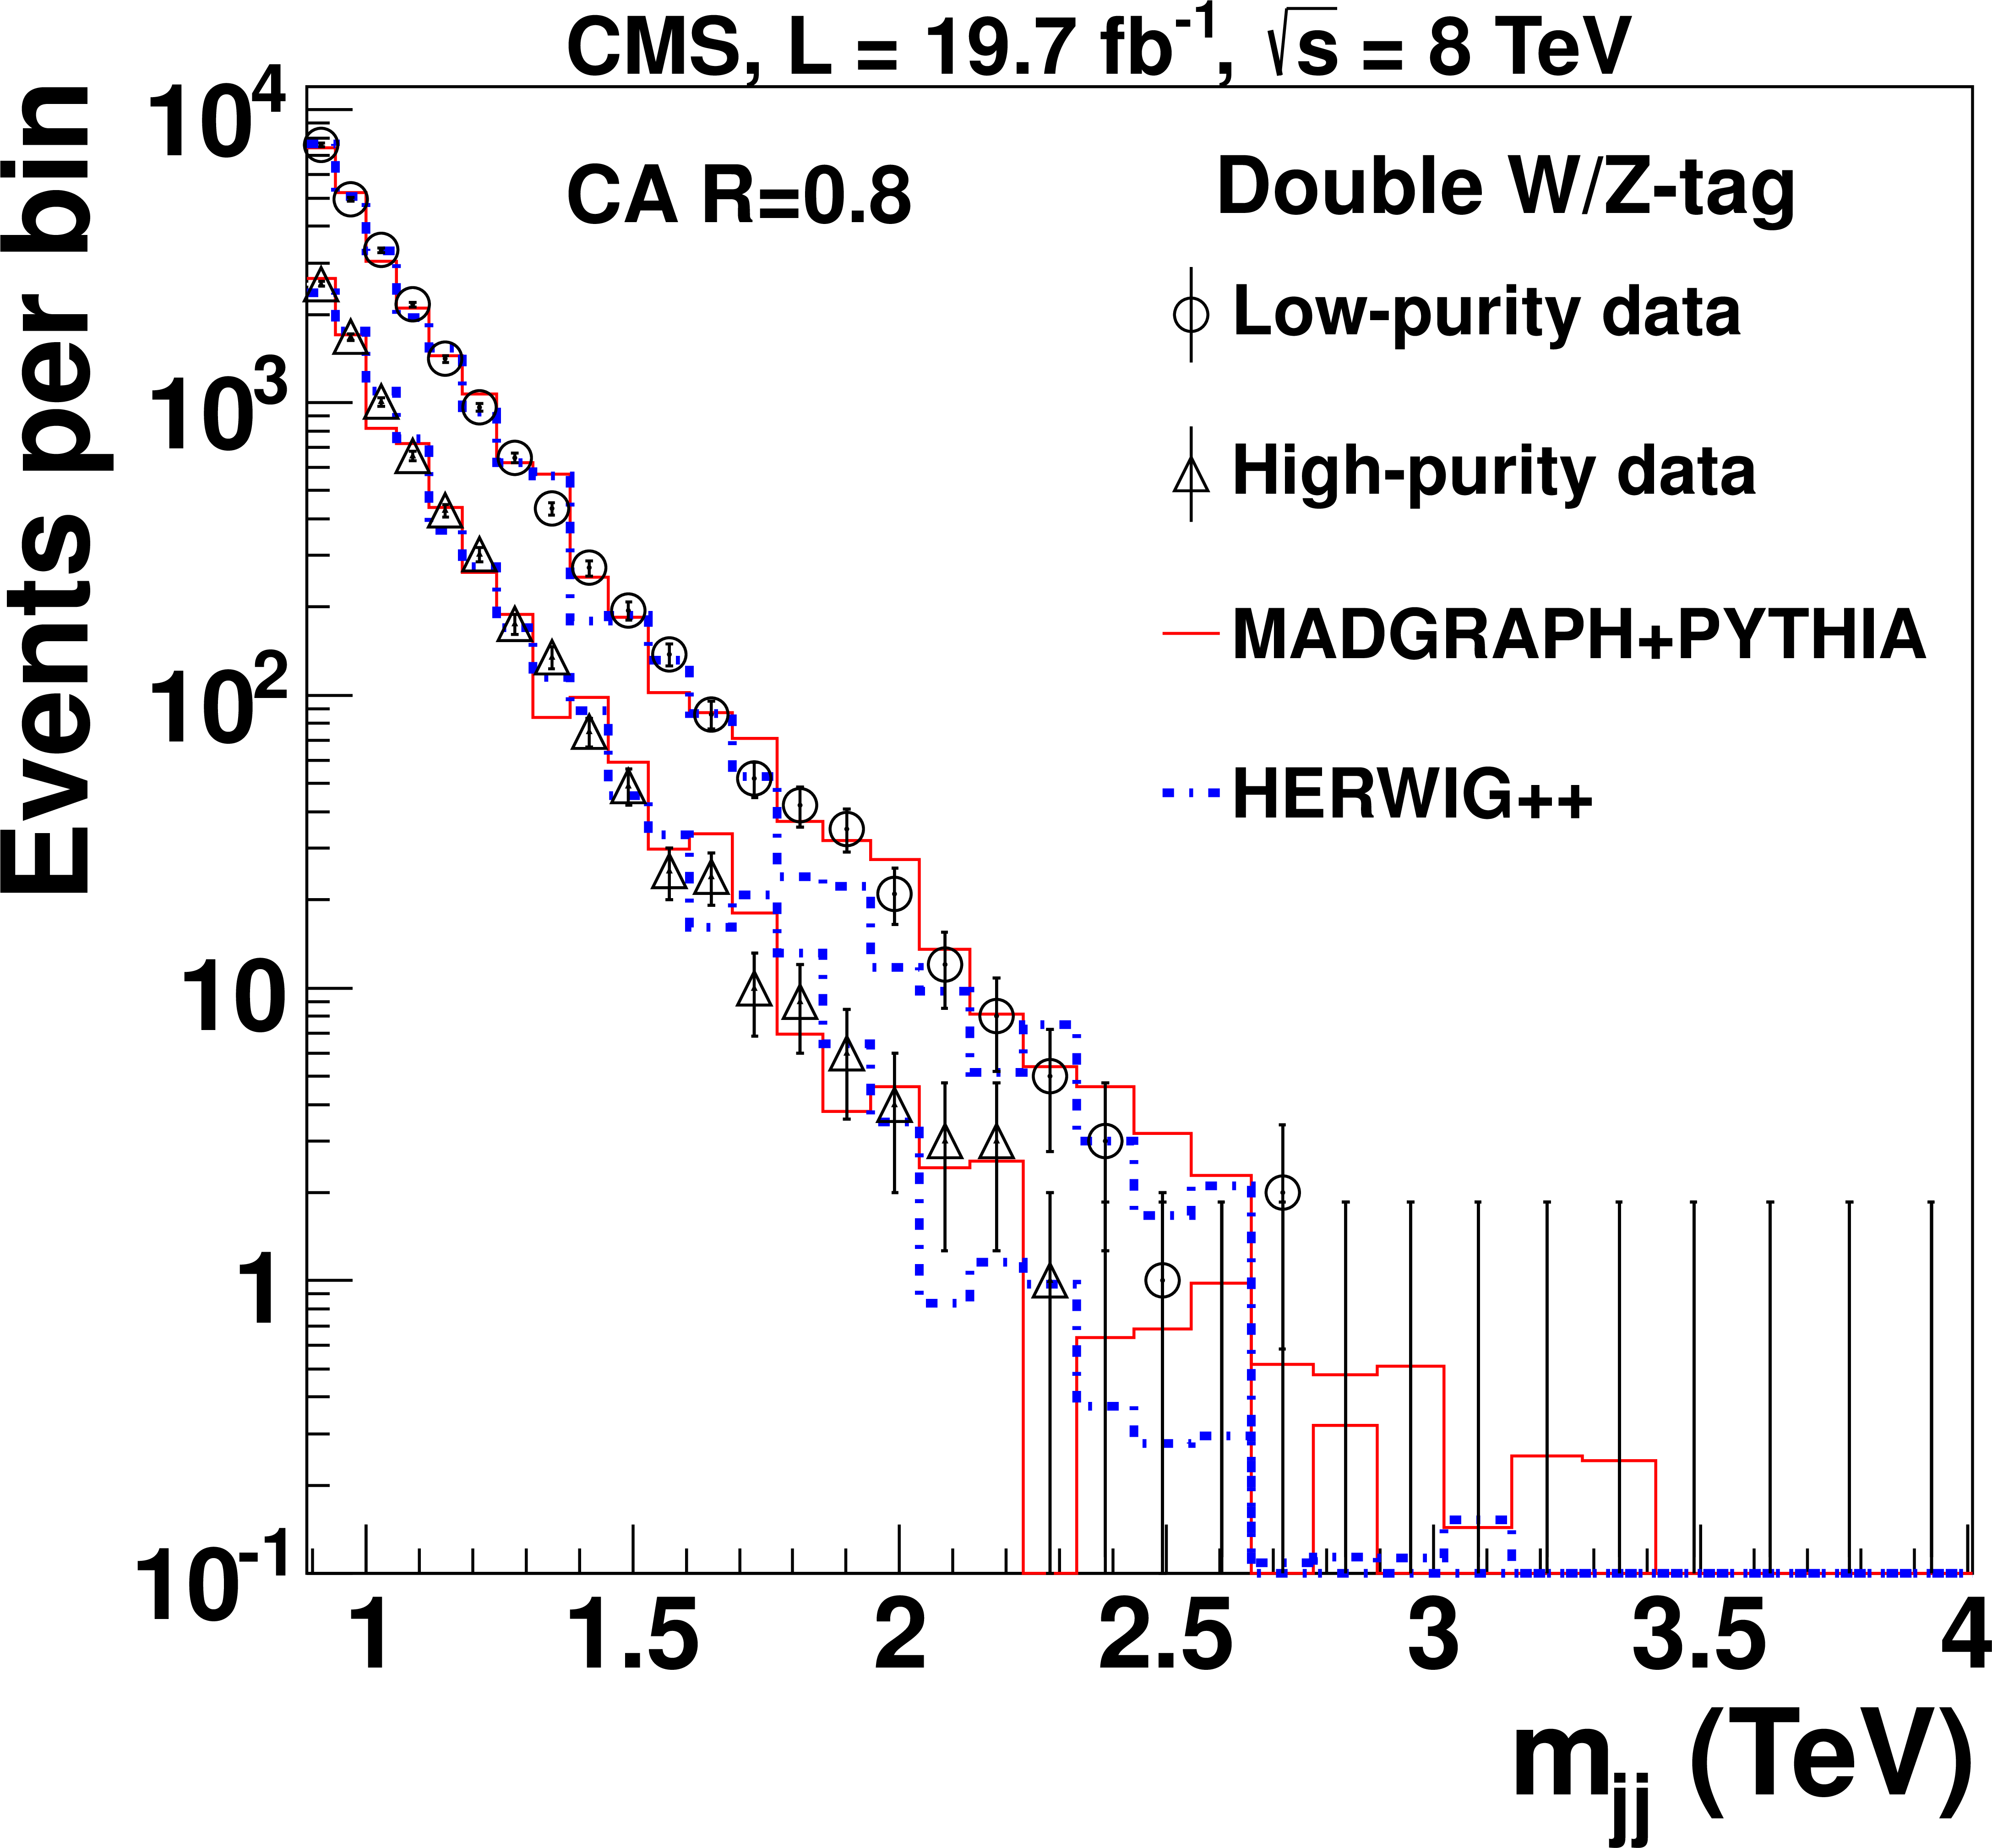
Figure 4-b:
The $m_\mathrm {jj}$ distributions for (left) singly and (right) doubly tagged events in data, and for QCD multijet (MadGraph/PYTHIA and HERWIG++) simulations, normalized to data. |
png pdf |
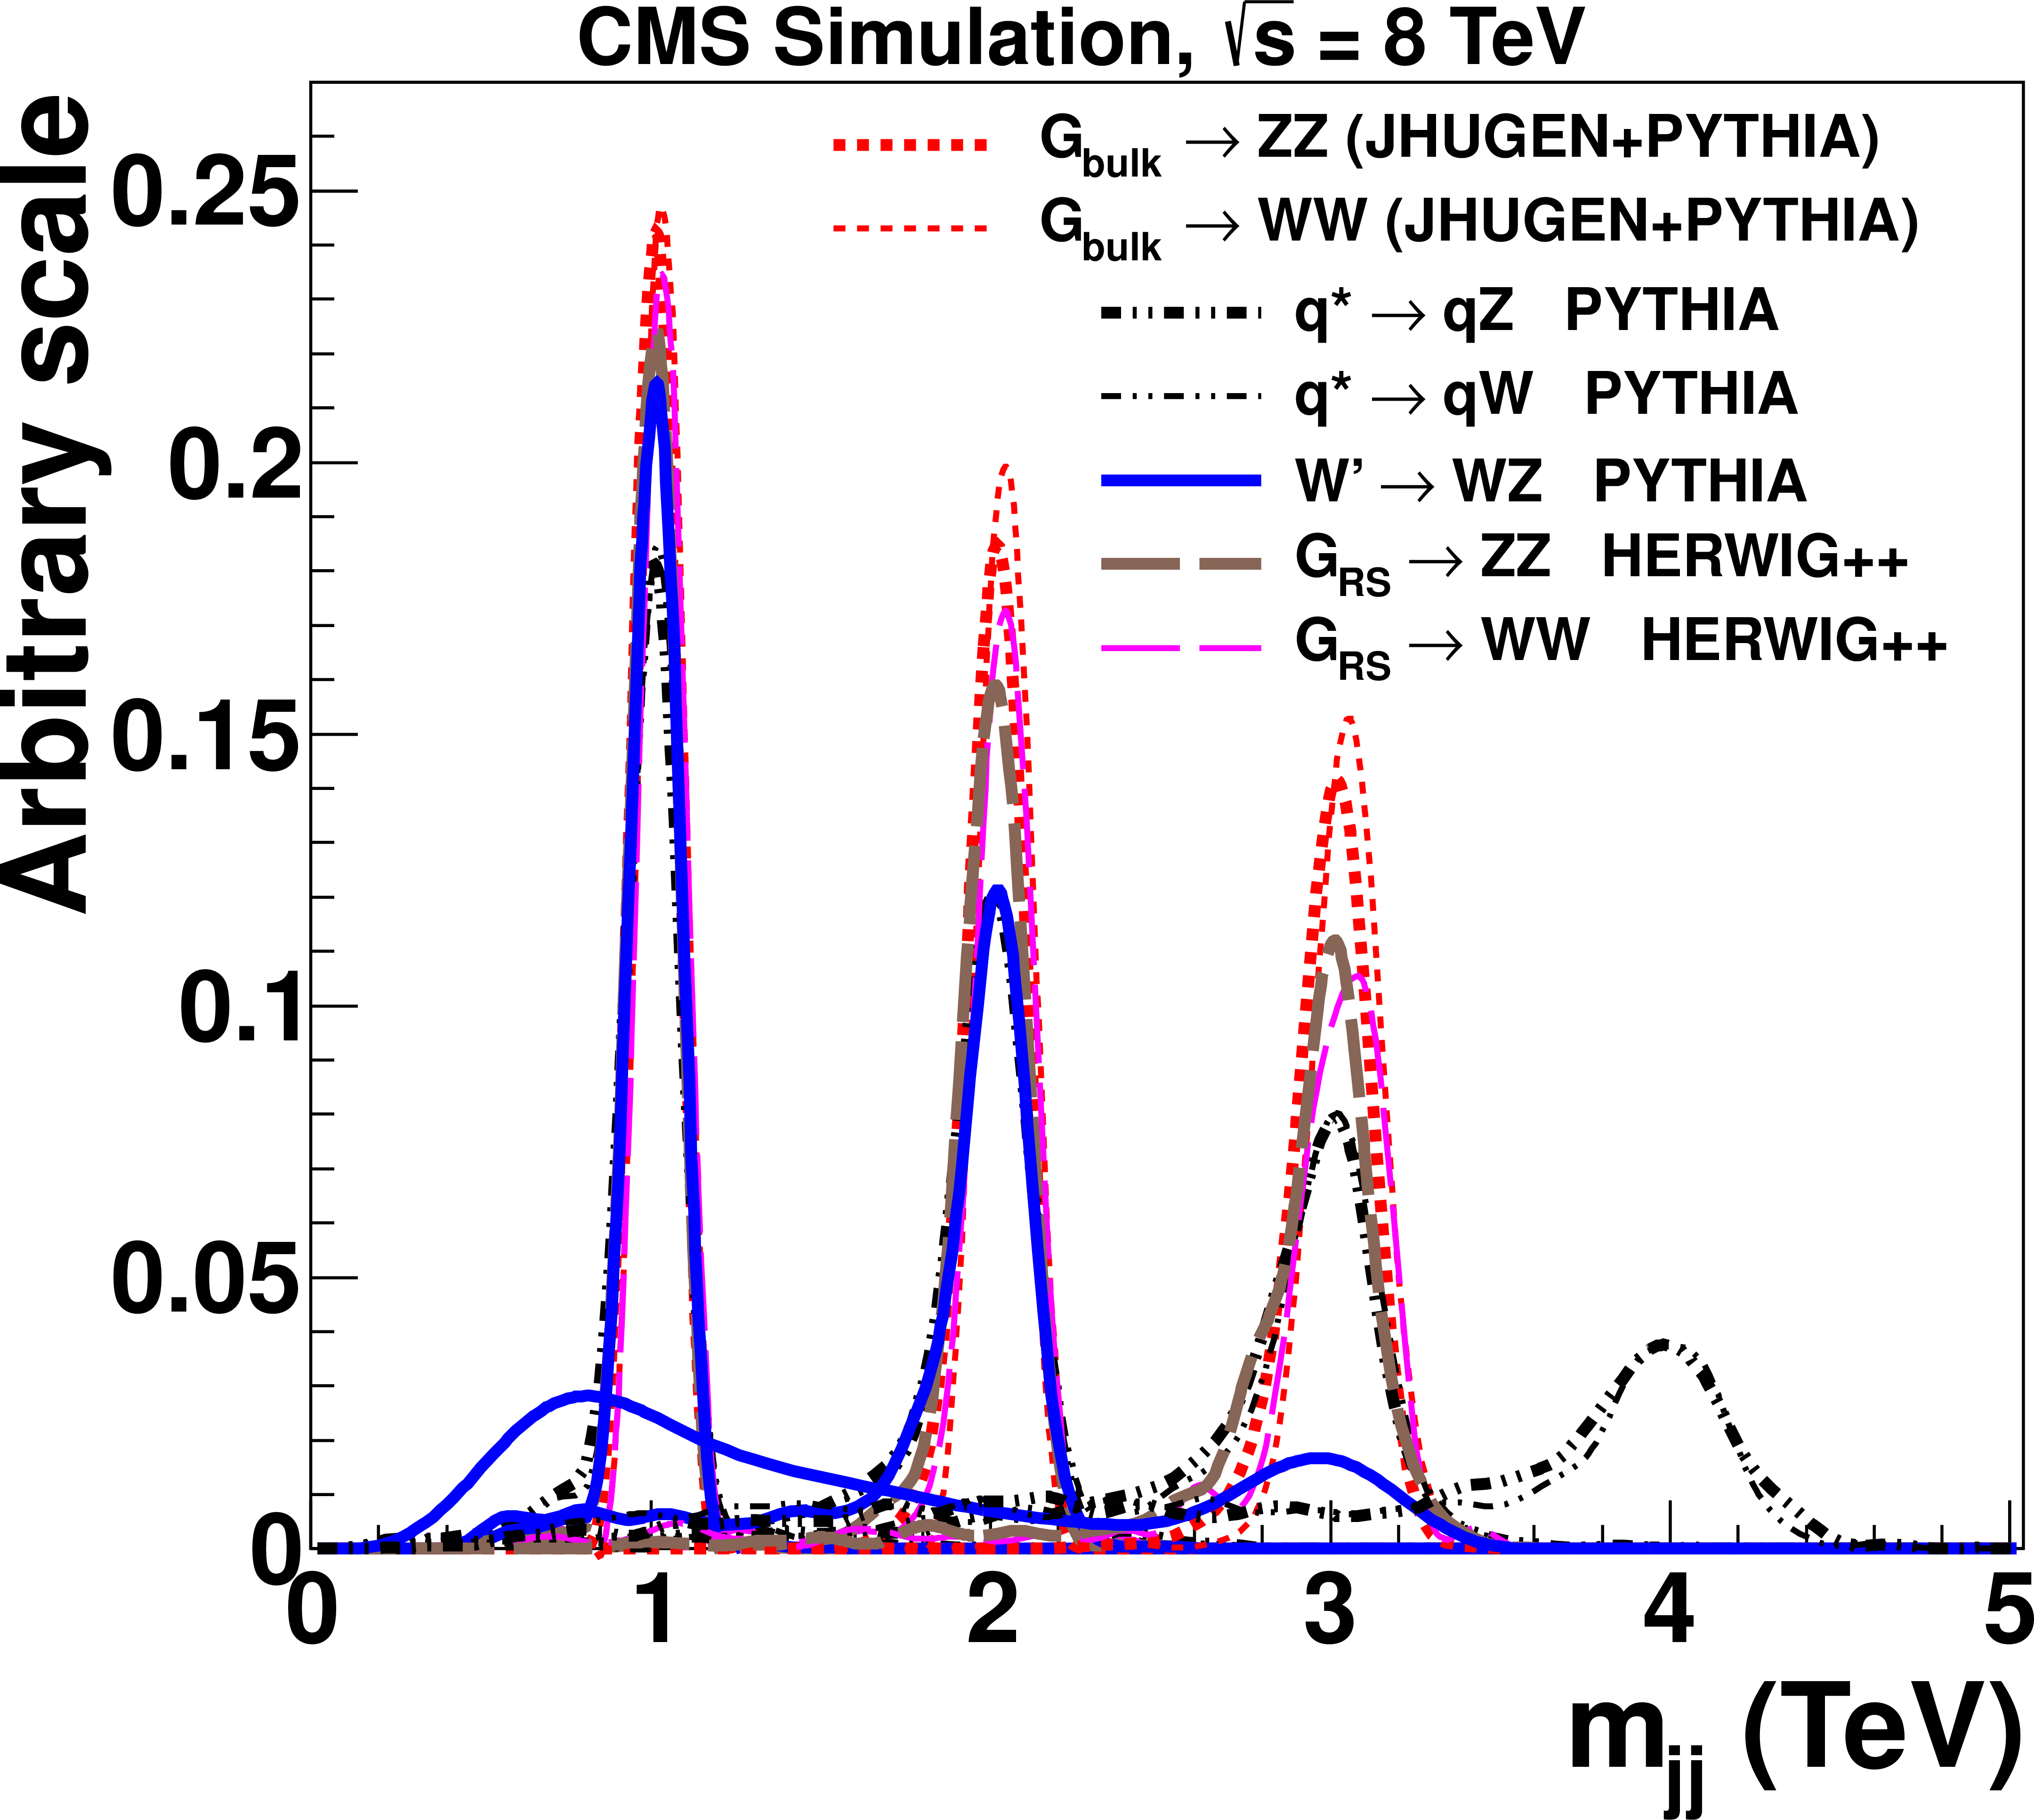
Figure 5:
Distribution in $m_\mathrm {jj}$ expected in the HP categories corresponding to resonance masses of 1, 2, 3 TeV, for all models, and 4 TeV, for $ {\mathrm {q}}^*$ models. All distributions are normalized to the same area. |
png pdf |
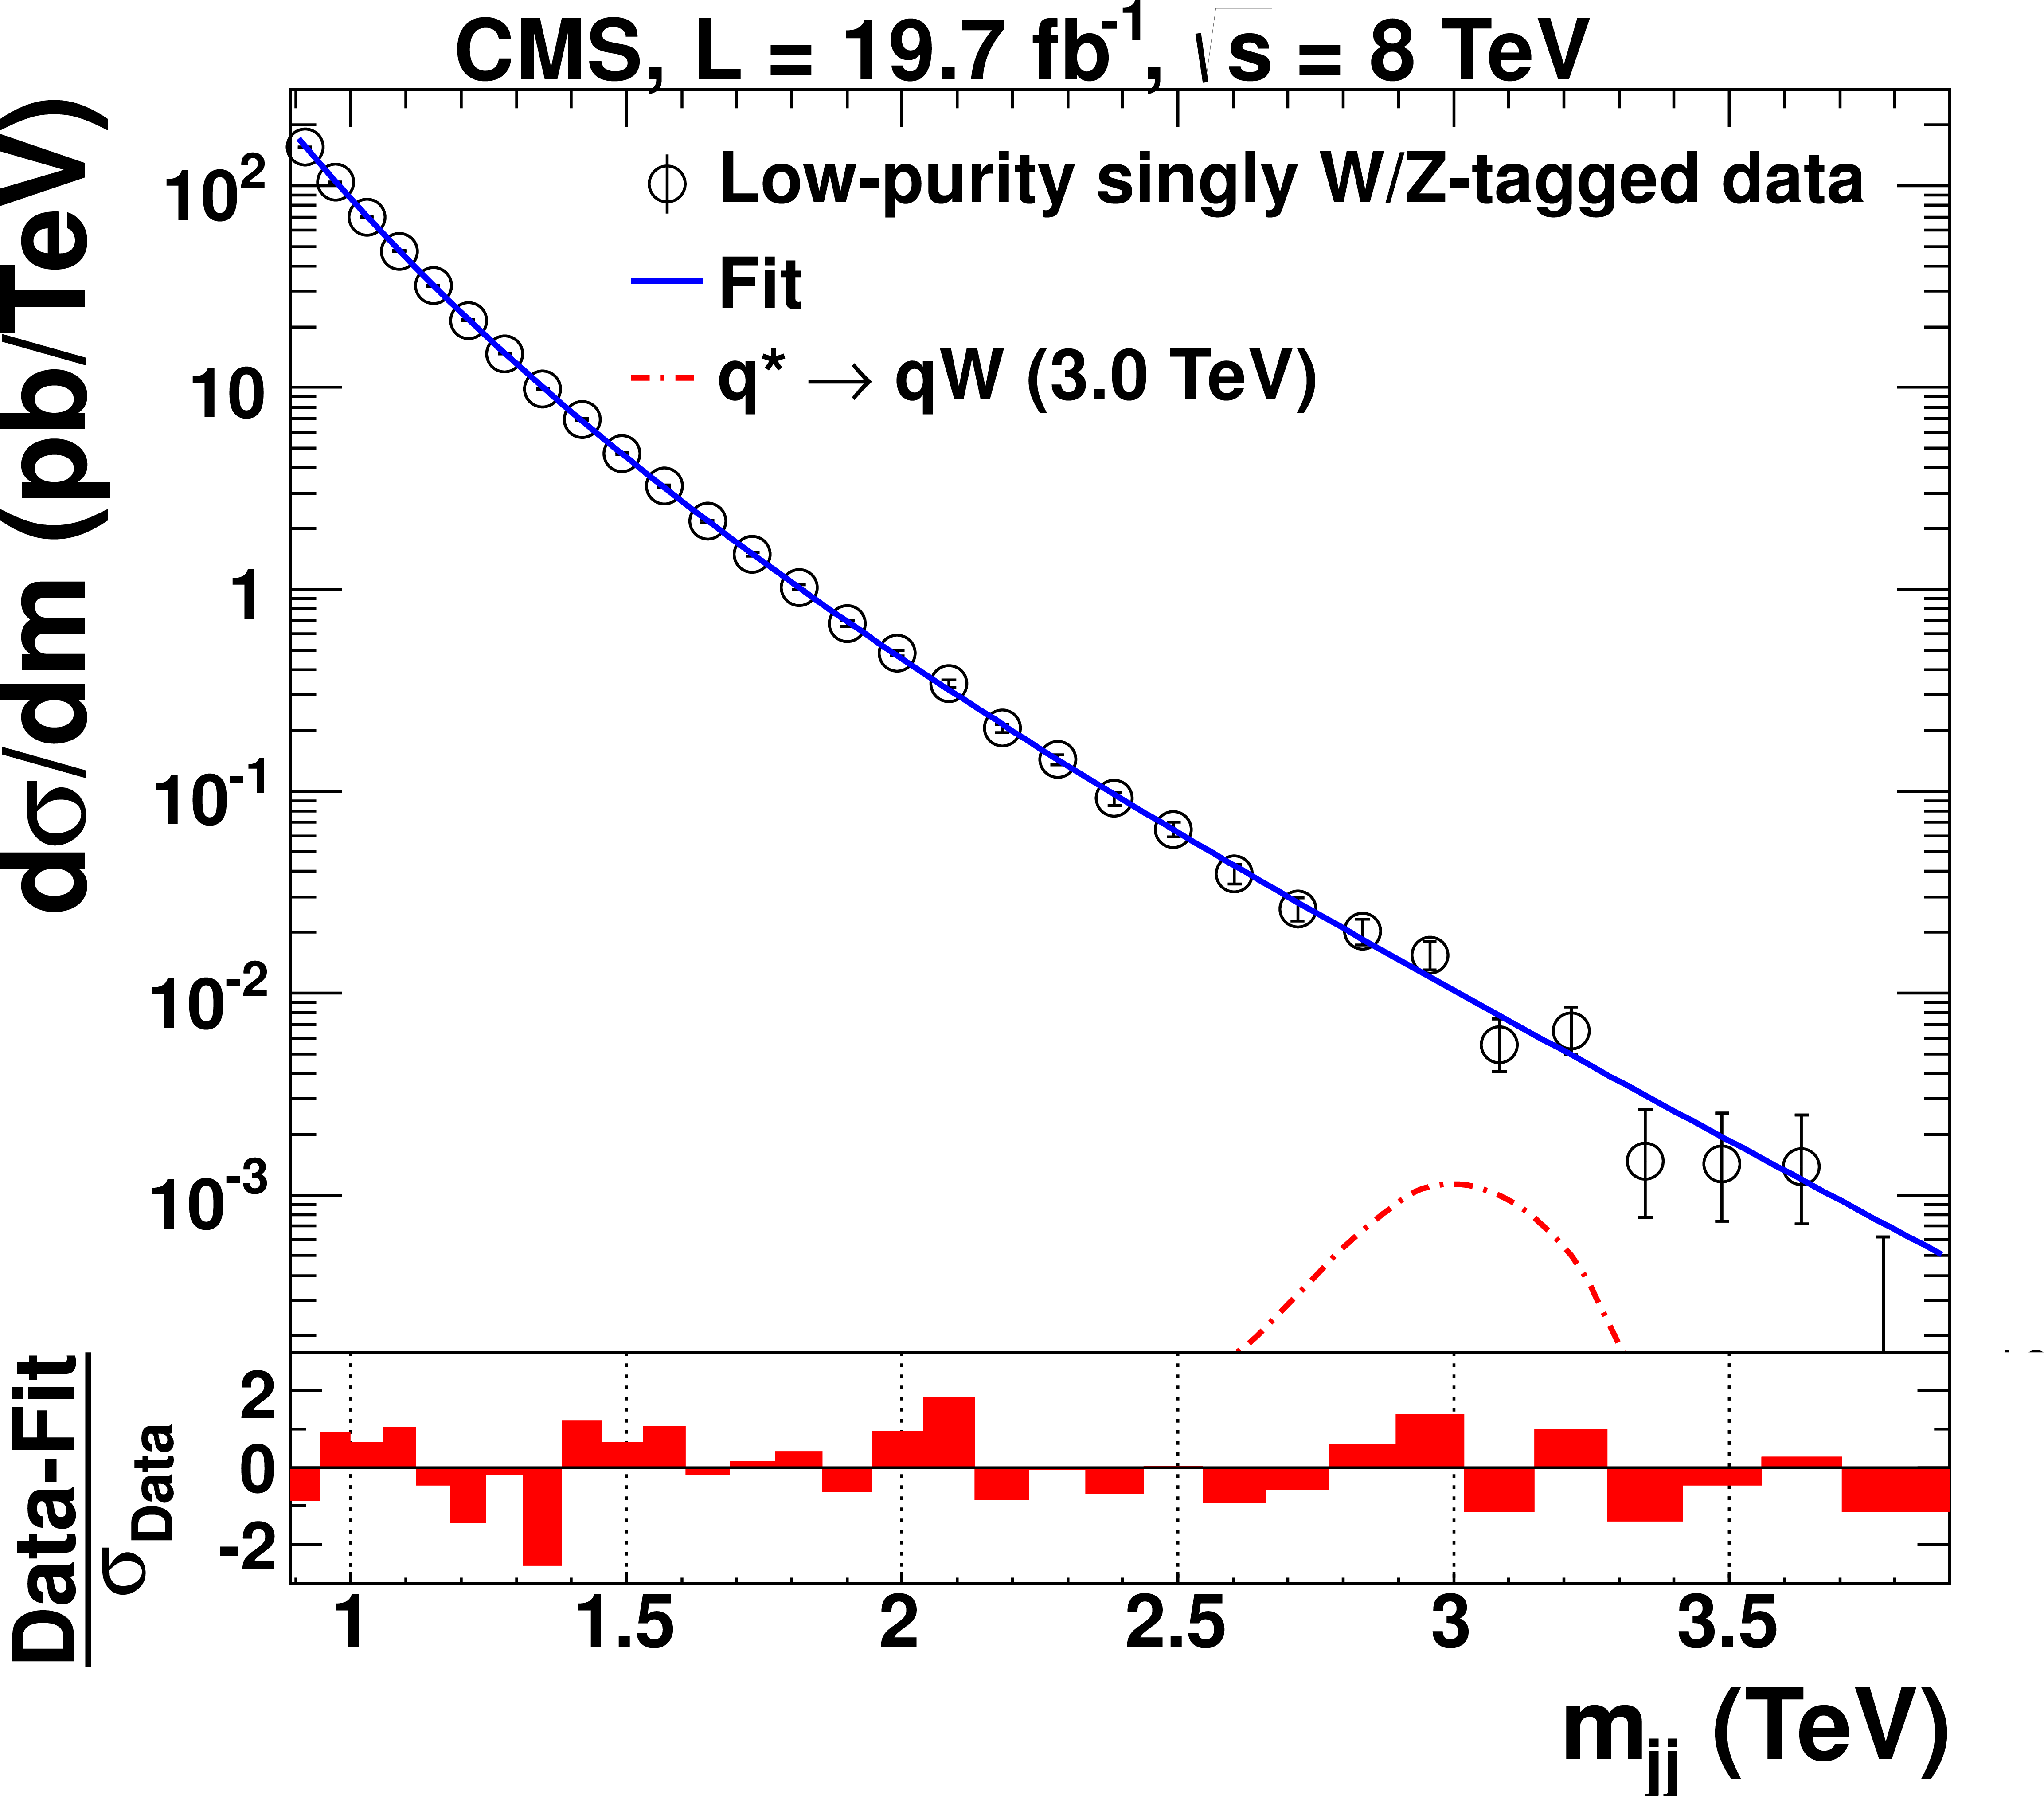
Figure 6-a:
Distribution in $m_\mathrm {jj}$, respectively, for (a) singly-tagged LP events and (b) HP events, and for (c) doubly-tagged LP events and (d) HP events. The solid curves represent the results of fitting Eq.(2) to the data. The distribution for $ {\mathrm {q}}^*\to {\mathrm {q}} {\mathrm {W}}$ and $ {\mathrm {G}_\mathrm {RS}} \to {\mathrm {W}} {\mathrm {W}}$ contributions, scaled to their corresponding cross sections, are given by the dash-dotted curves. The corresponding pull distributions ($\frac {\text {Data}-\text {Fit}}{\sigma _{\text {Data}}}$, where $\sigma _{\text {Data}}$ represents the statistical uncertainty in the data in a bin in $m_\mathrm {jj}$) are shown below each $m_\mathrm {jj}$ plot. |
png pdf |
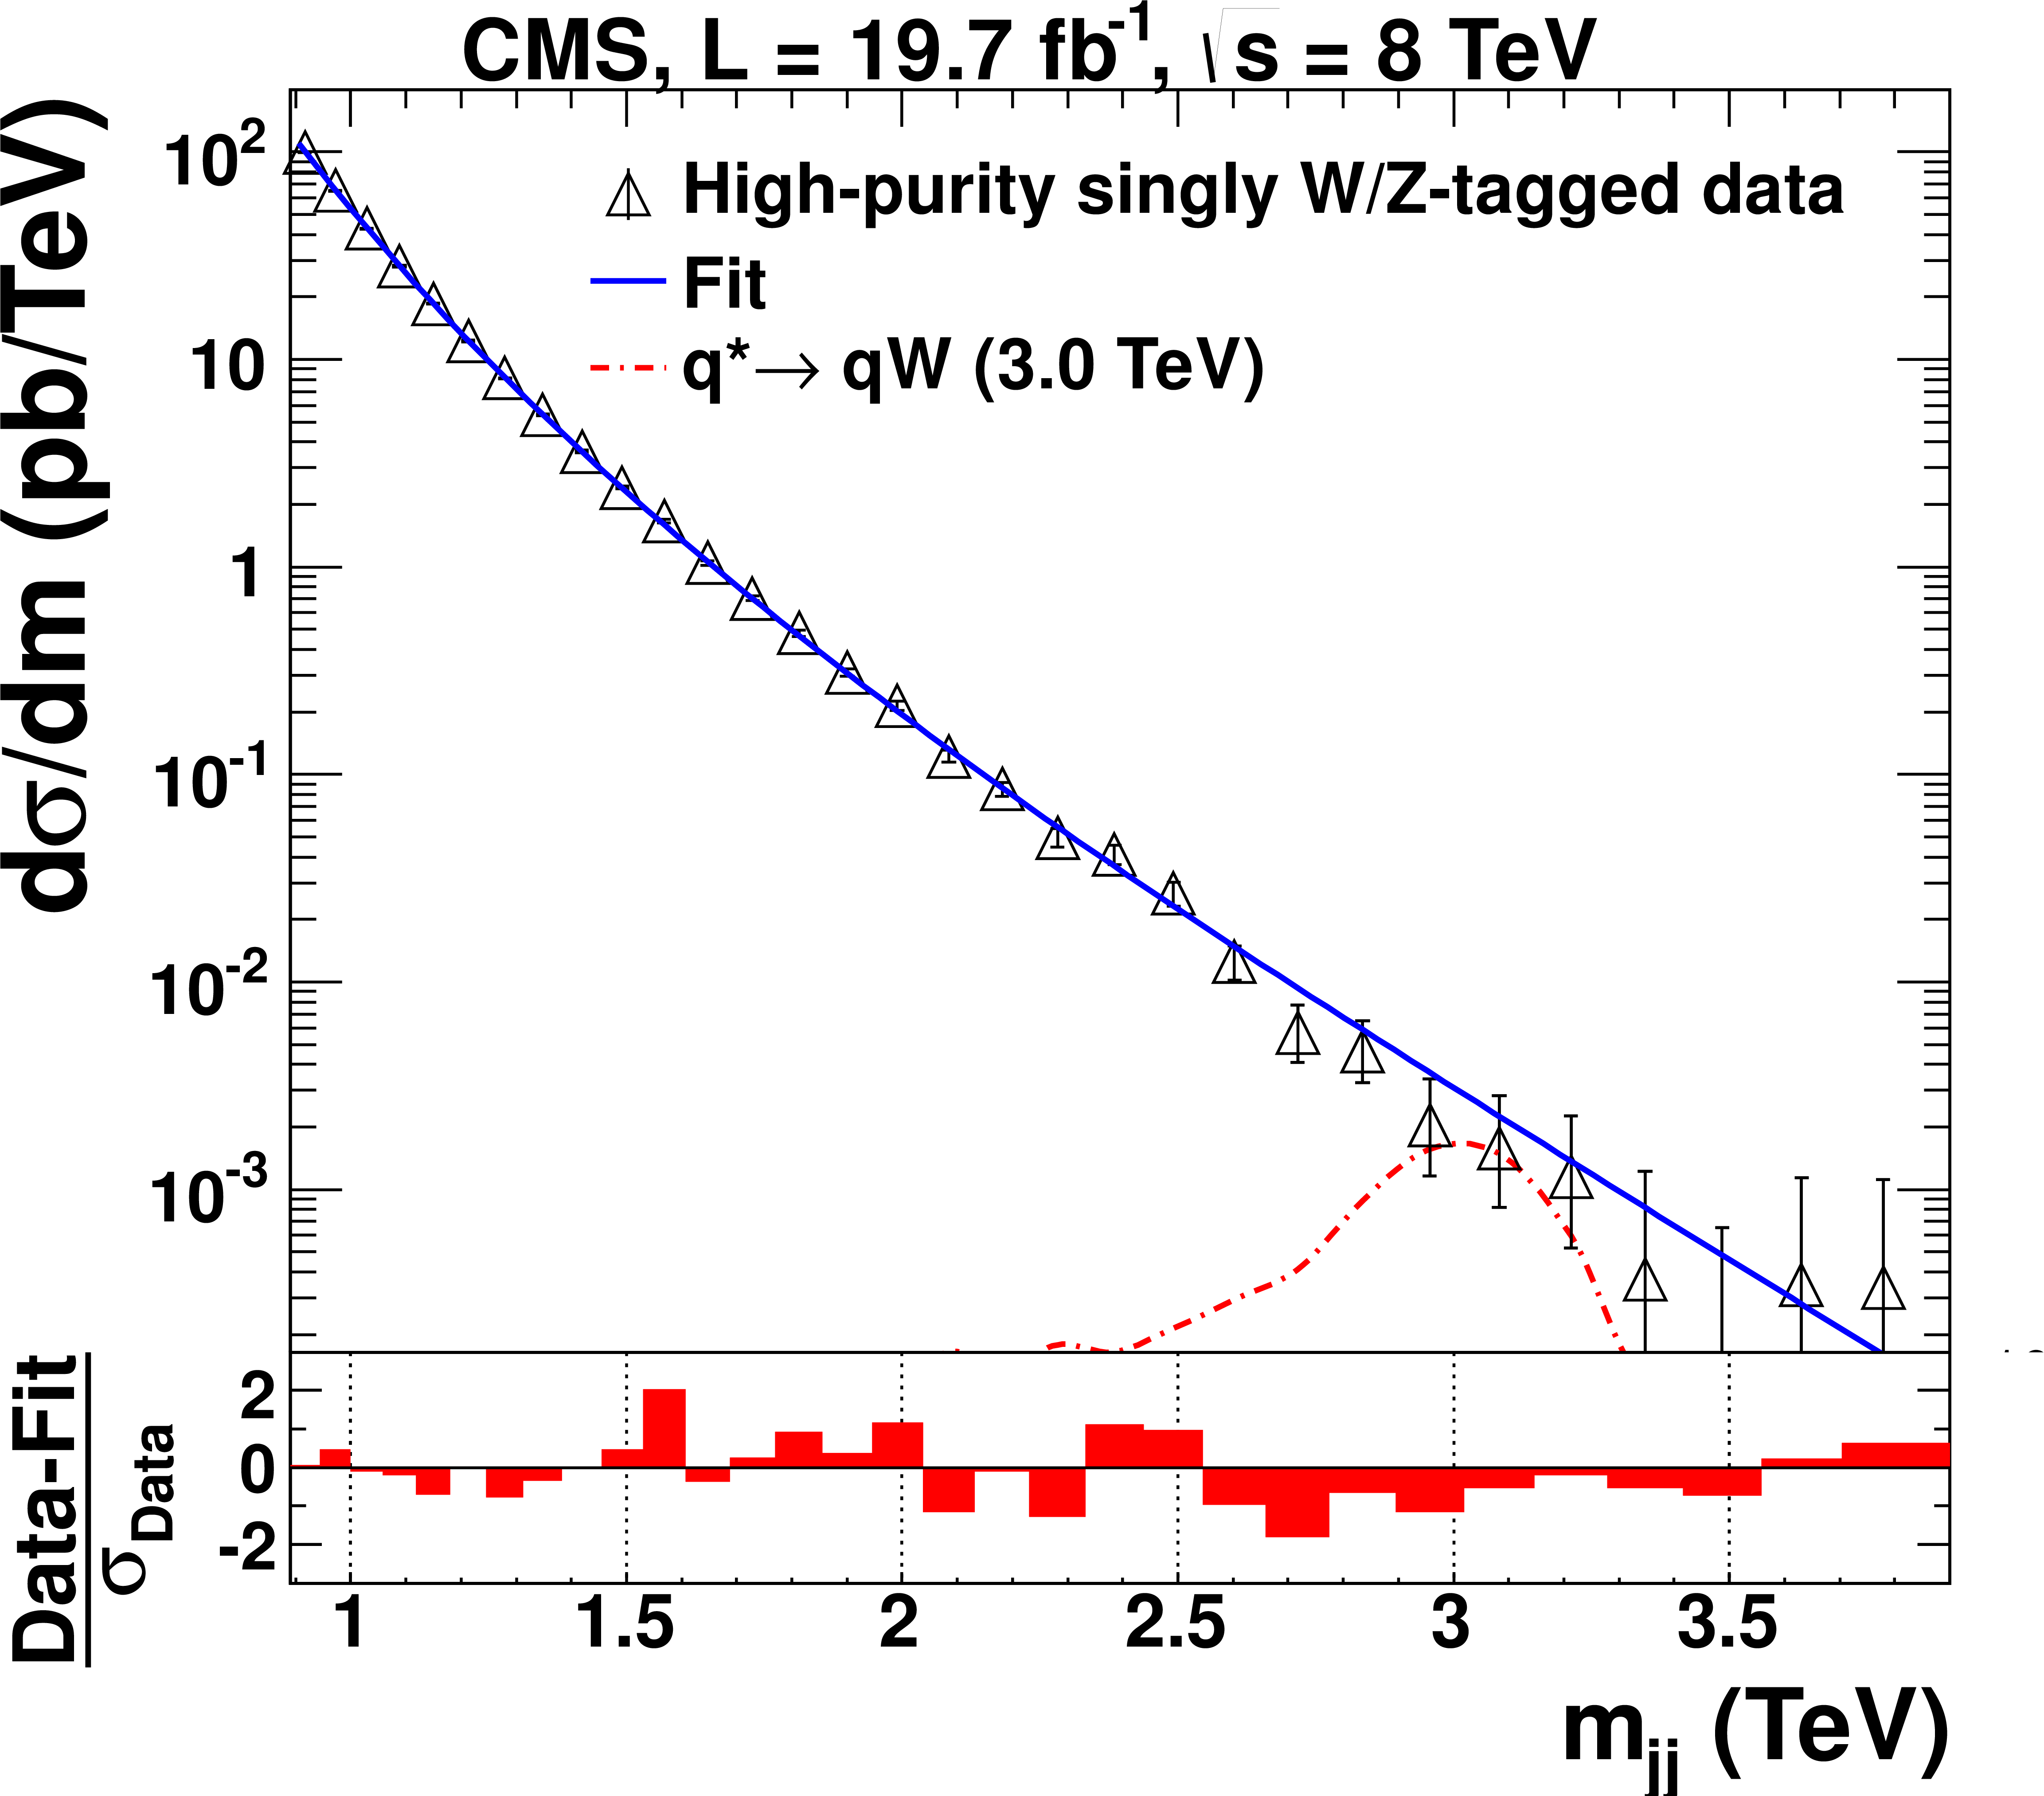
Figure 6-b:
Distribution in $m_\mathrm {jj}$, respectively, for (a) singly-tagged LP events and (b) HP events, and for (c) doubly-tagged LP events and (d) HP events. The solid curves represent the results of fitting Eq.(2) to the data. The distribution for $ {\mathrm {q}}^*\to {\mathrm {q}} {\mathrm {W}}$ and $ {\mathrm {G}_\mathrm {RS}} \to {\mathrm {W}} {\mathrm {W}}$ contributions, scaled to their corresponding cross sections, are given by the dash-dotted curves. The corresponding pull distributions ($\frac {\text {Data}-\text {Fit}}{\sigma _{\text {Data}}}$, where $\sigma _{\text {Data}}$ represents the statistical uncertainty in the data in a bin in $m_\mathrm {jj}$) are shown below each $m_\mathrm {jj}$ plot. |
png pdf |
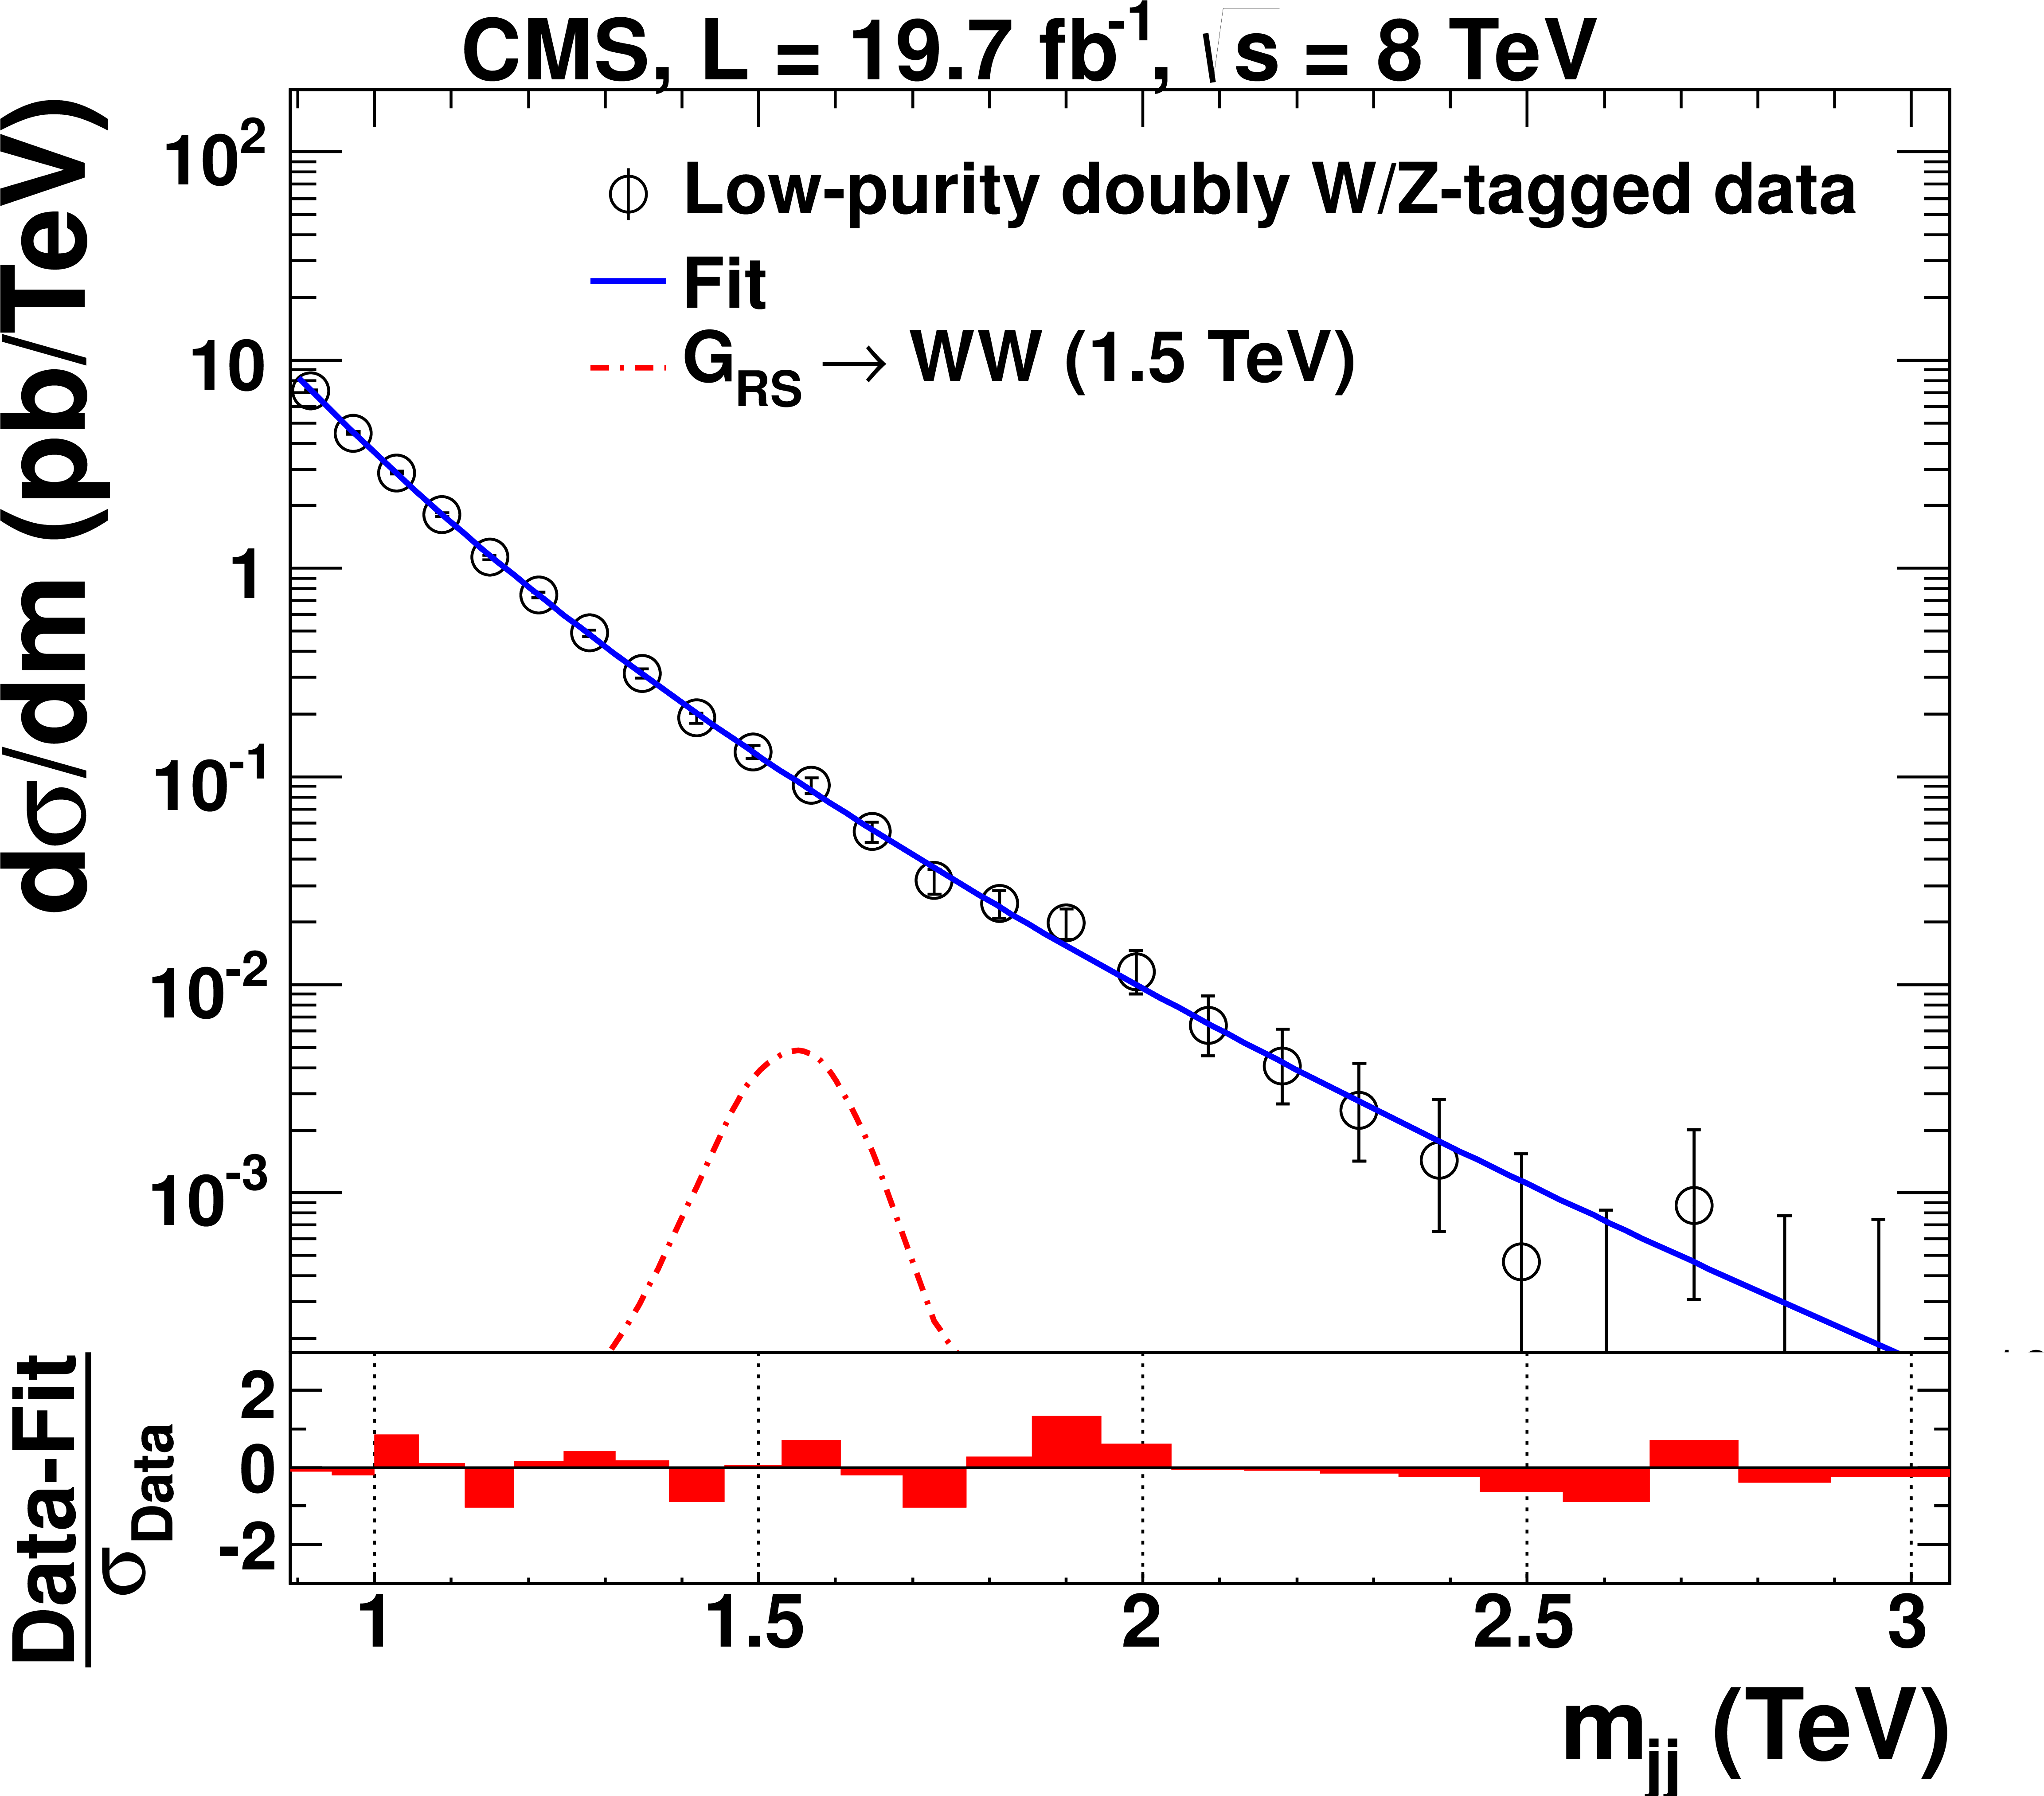
Figure 6-c:
Distribution in $m_\mathrm {jj}$, respectively, for (a) singly-tagged LP events and (b) HP events, and for (c) doubly-tagged LP events and (d) HP events. The solid curves represent the results of fitting Eq.(2) to the data. The distribution for $ {\mathrm {q}}^*\to {\mathrm {q}} {\mathrm {W}}$ and $ {\mathrm {G}_\mathrm {RS}} \to {\mathrm {W}} {\mathrm {W}}$ contributions, scaled to their corresponding cross sections, are given by the dash-dotted curves. The corresponding pull distributions ($\frac {\text {Data}-\text {Fit}}{\sigma _{\text {Data}}}$, where $\sigma _{\text {Data}}$ represents the statistical uncertainty in the data in a bin in $m_\mathrm {jj}$) are shown below each $m_\mathrm {jj}$ plot. |
png pdf |
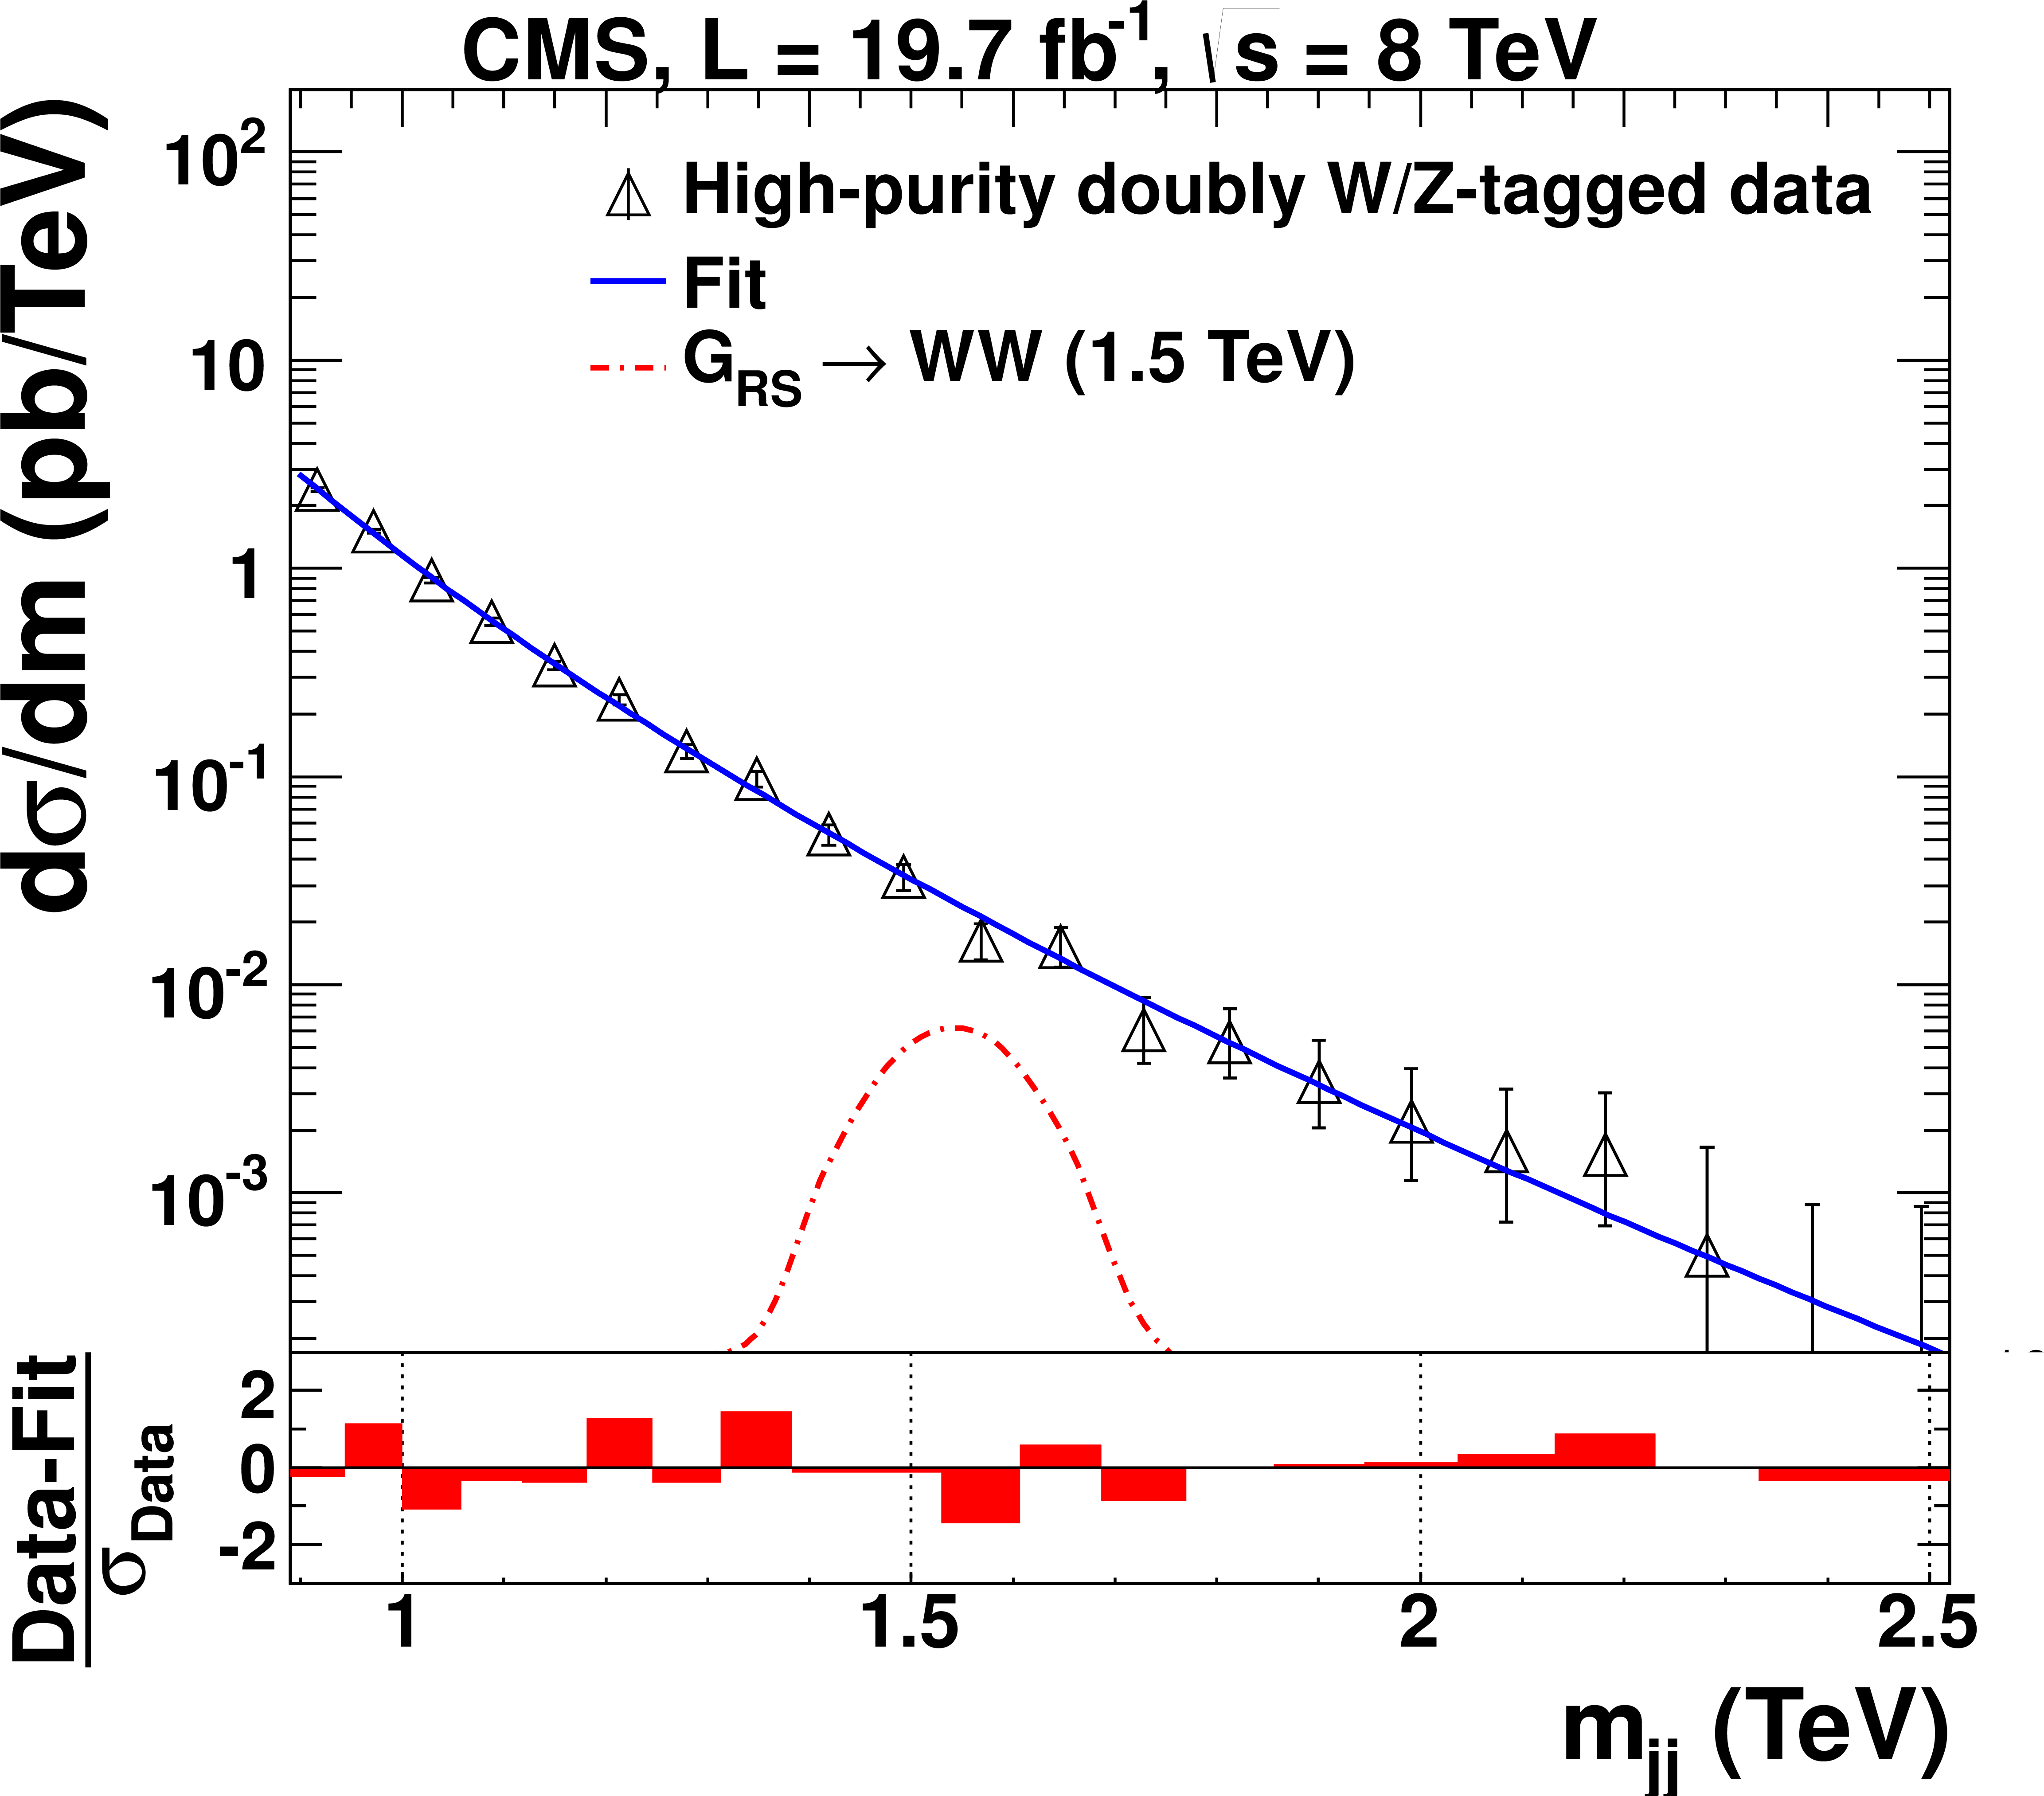
Figure 6-d:
Distribution in $m_\mathrm {jj}$, respectively, for (a) singly-tagged LP events and (b) HP events, and for (c) doubly-tagged LP events and (d) HP events. The solid curves represent the results of fitting Eq.(2) to the data. The distribution for $ {\mathrm {q}}^*\to {\mathrm {q}} {\mathrm {W}}$ and $ {\mathrm {G}_\mathrm {RS}} \to {\mathrm {W}} {\mathrm {W}}$ contributions, scaled to their corresponding cross sections, are given by the dash-dotted curves. The corresponding pull distributions ($\frac {\text {Data}-\text {Fit}}{\sigma _{\text {Data}}}$, where $\sigma _{\text {Data}}$ represents the statistical uncertainty in the data in a bin in $m_\mathrm {jj}$) are shown below each $m_\mathrm {jj}$ plot. |
png pdf |
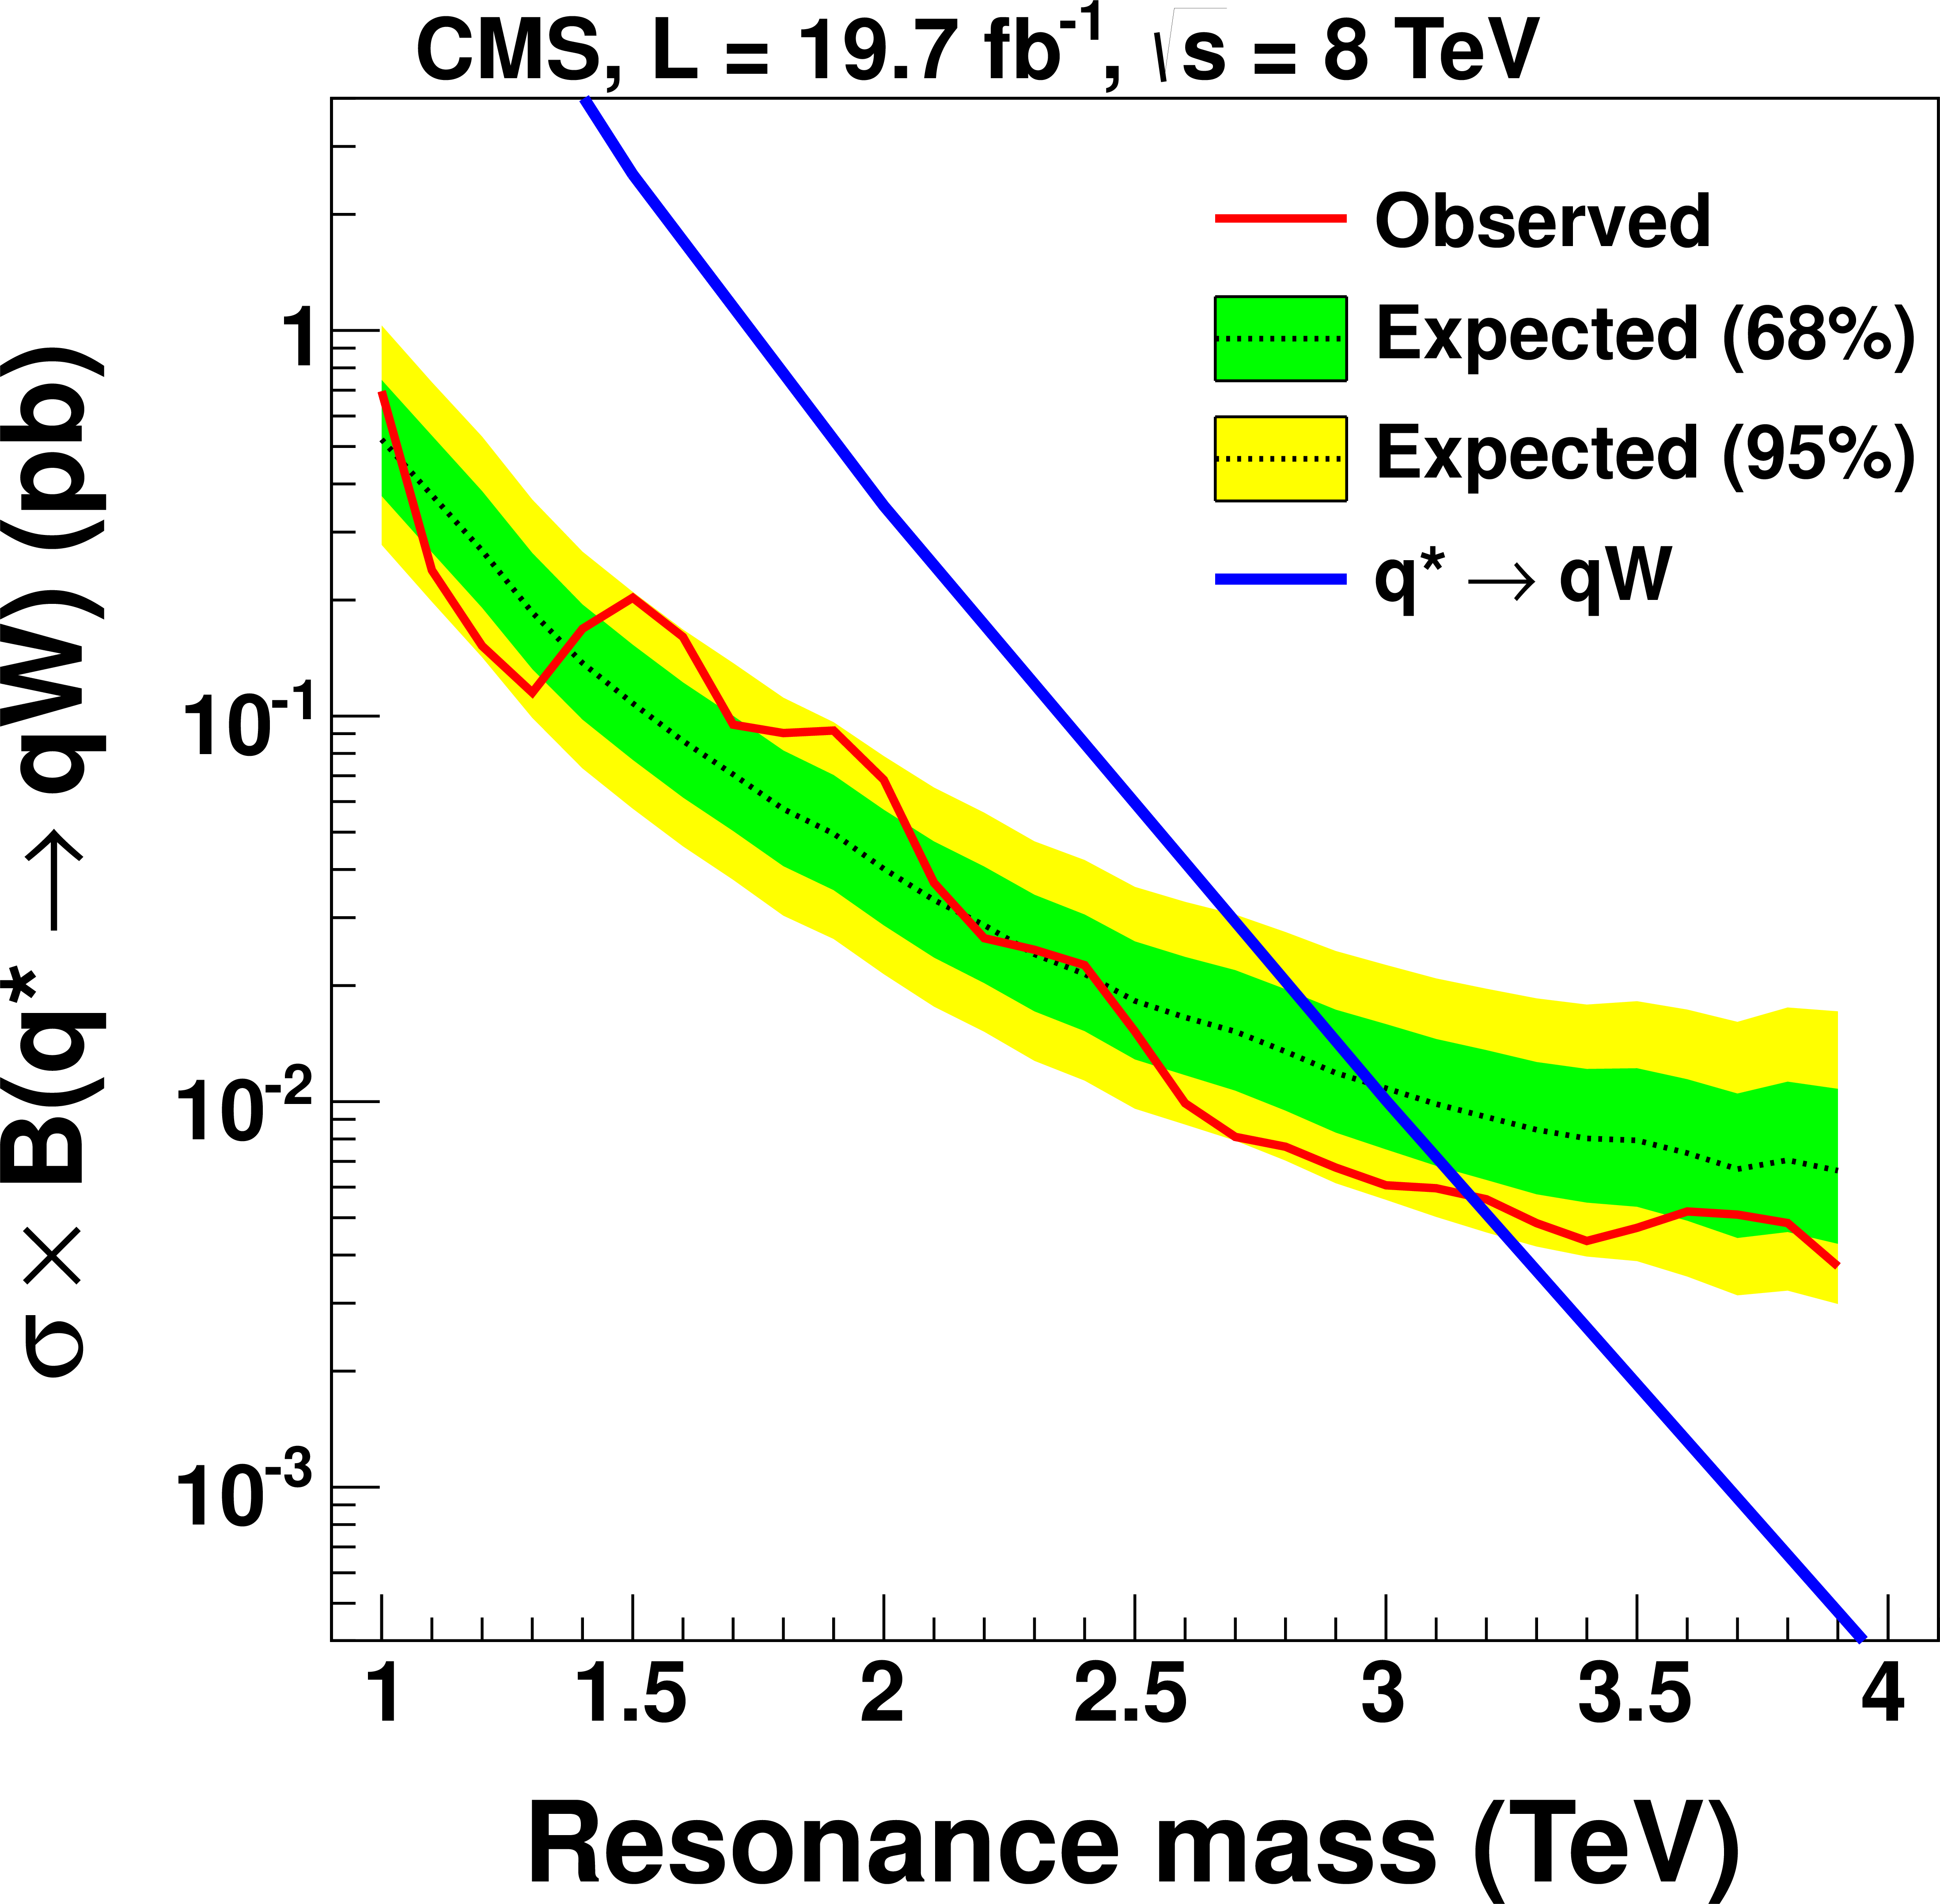
Figure 7-a:
Expected and observed 95% CL limits on the production cross section as a function of the resonance mass for (a) qW resonances, (b) qZ resonances, and (c) WZ resonances, compared to their predicted cross sections for the corresponding benchmark models. |
png pdf |
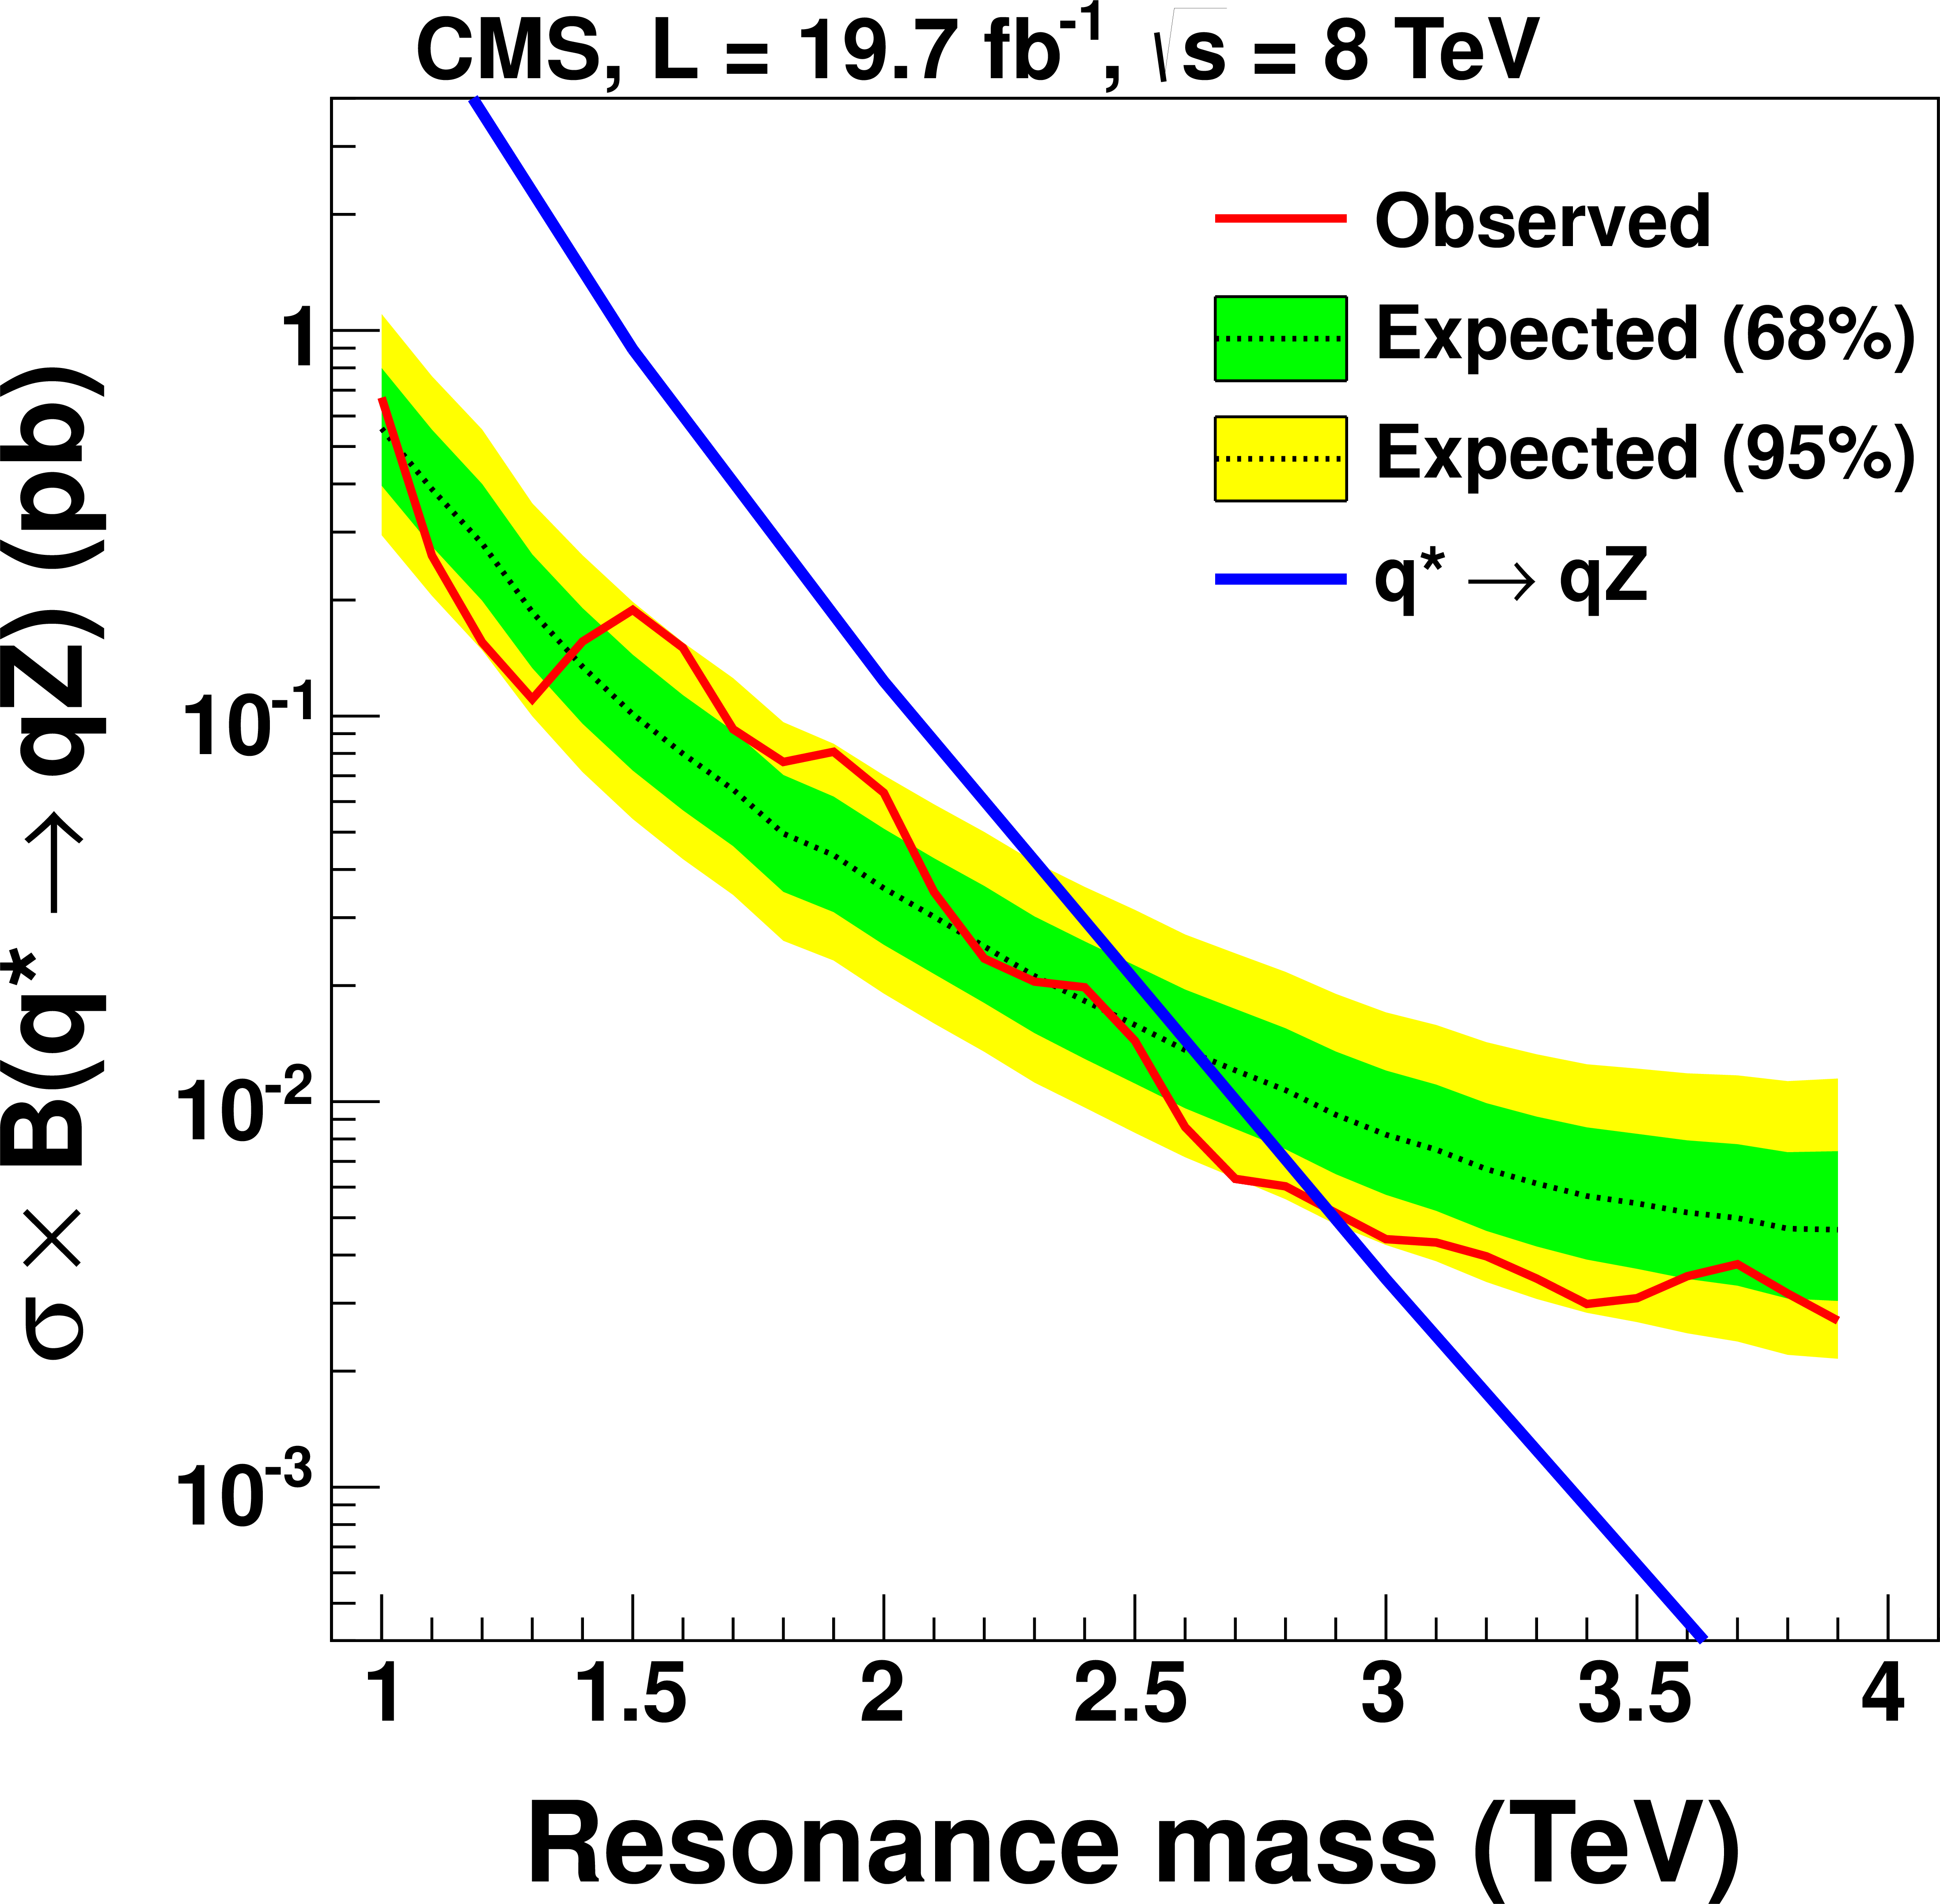
Figure 7-b:
Expected and observed 95% CL limits on the production cross section as a function of the resonance mass for (a) qW resonances, (b) qZ resonances, and (c) WZ resonances, compared to their predicted cross sections for the corresponding benchmark models. |
png pdf |
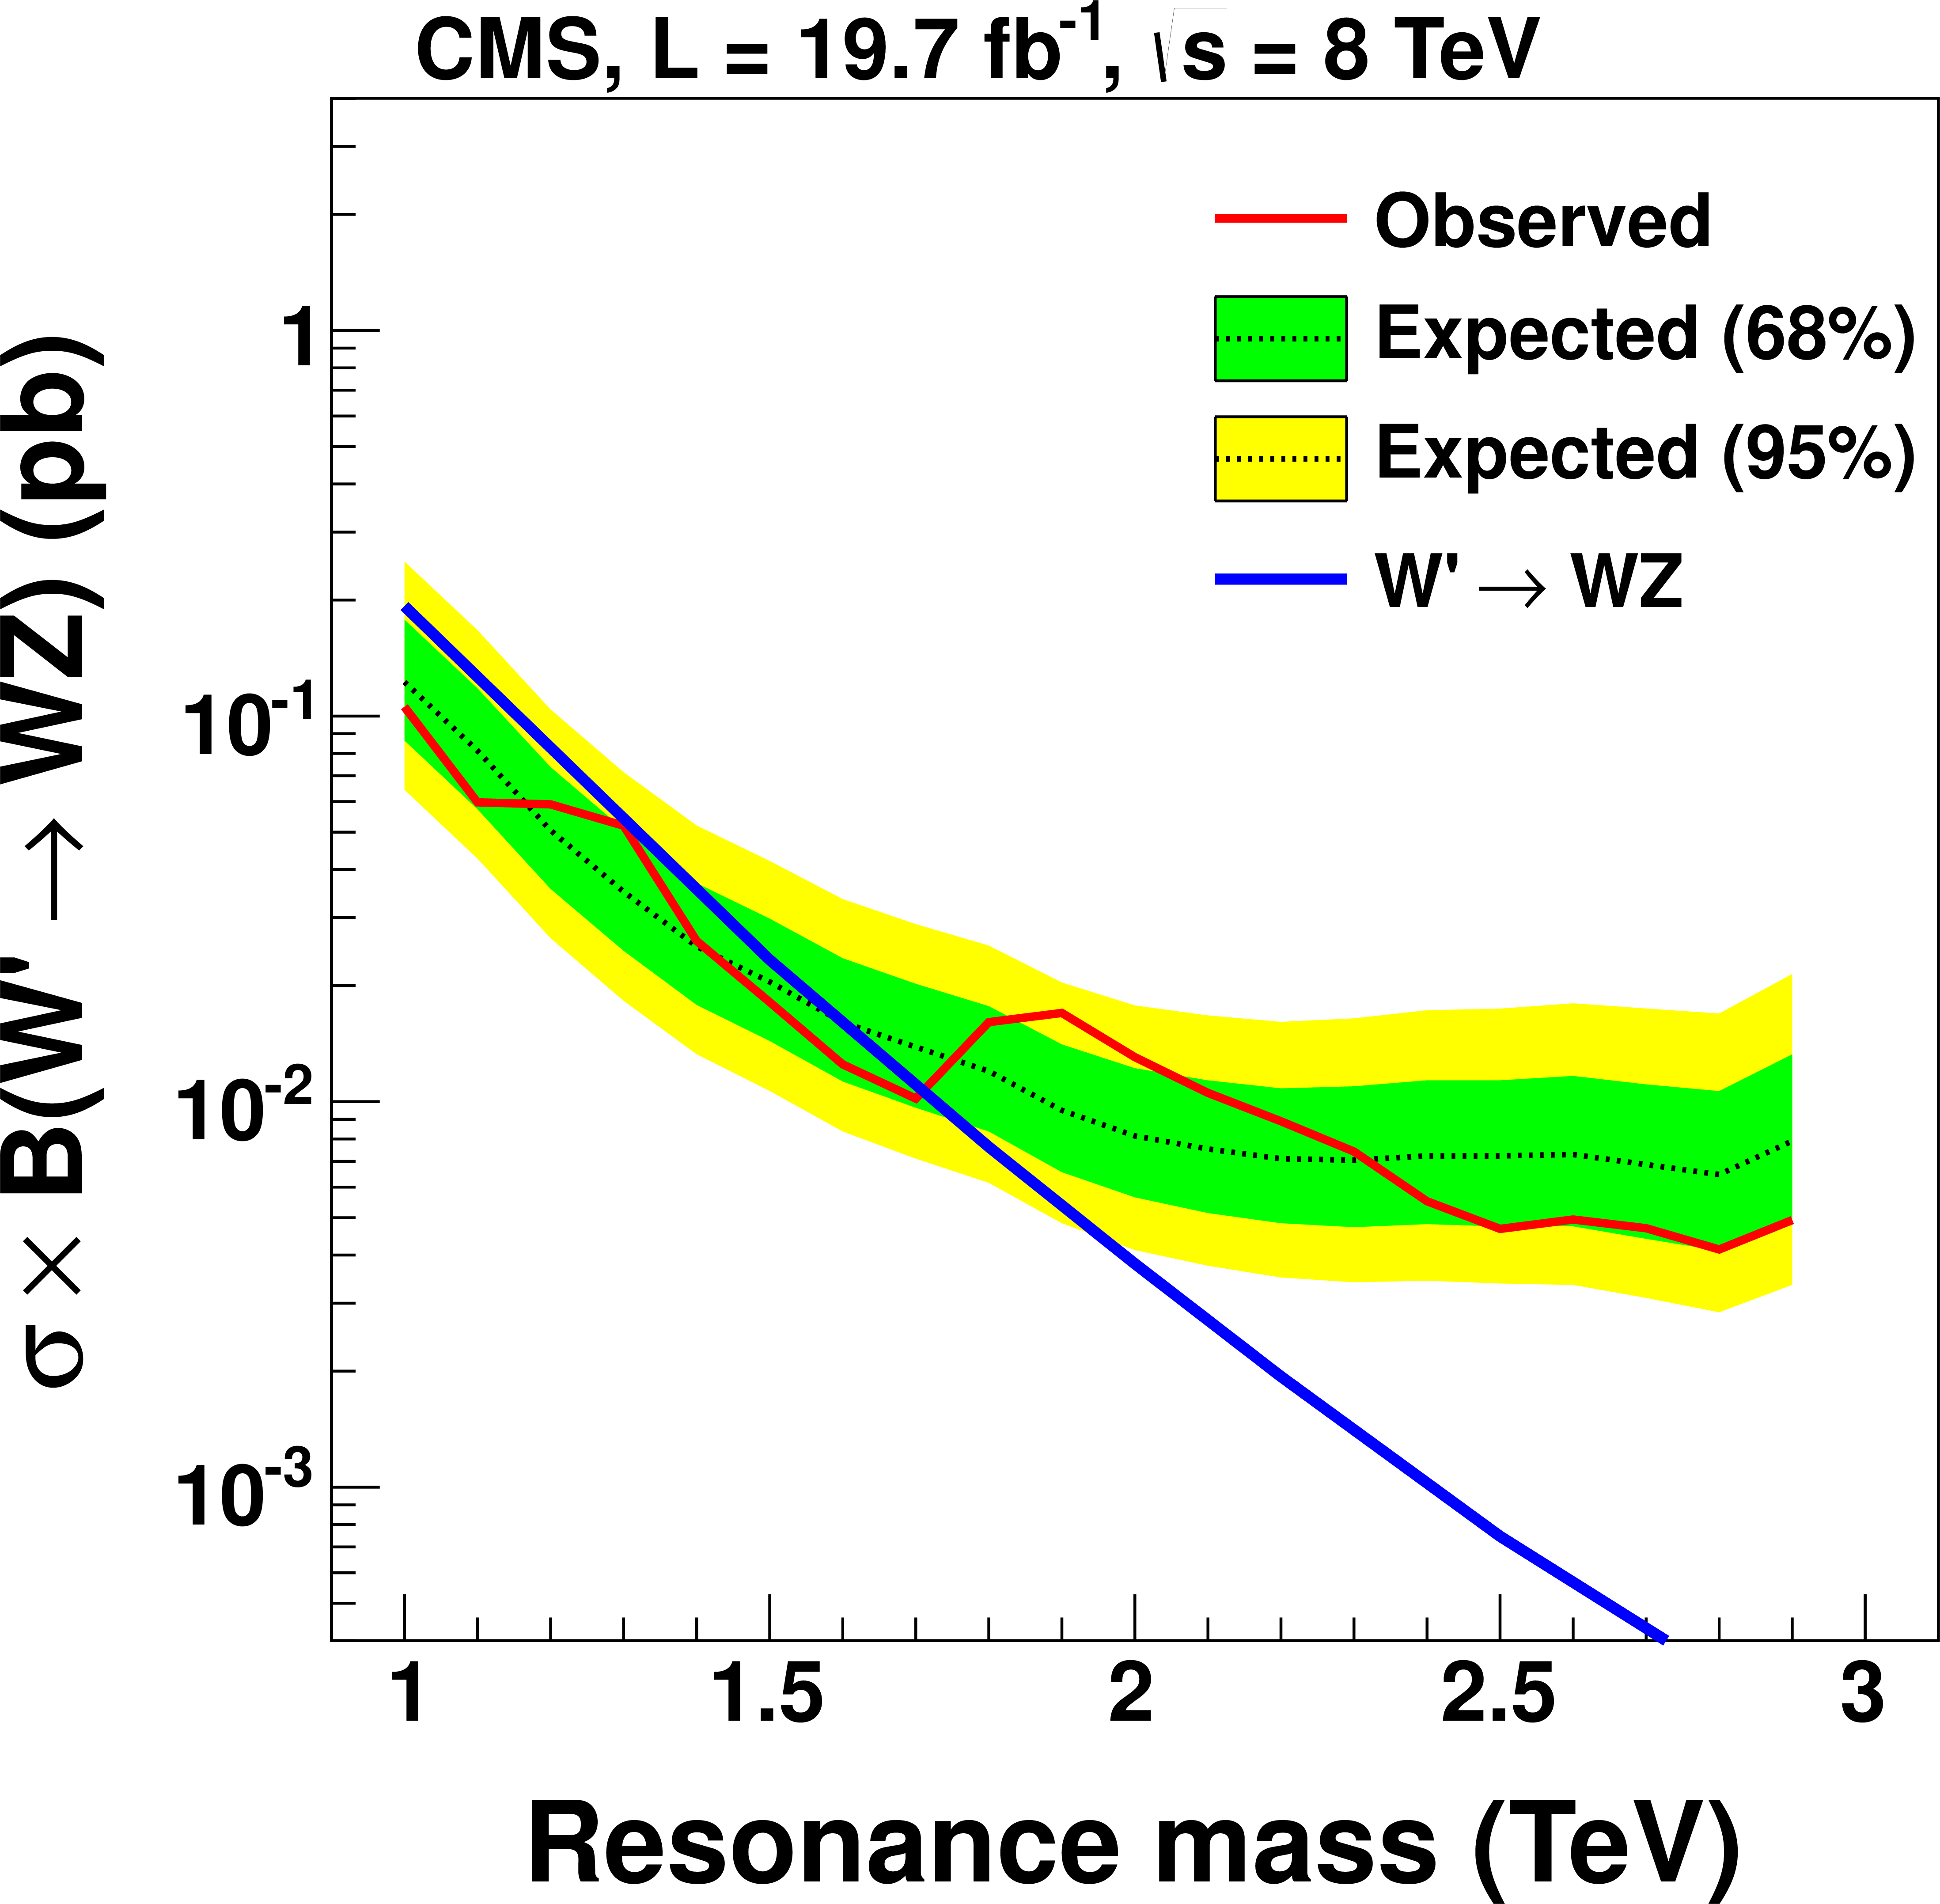
Figure 7-c:
Expected and observed 95% CL limits on the production cross section as a function of the resonance mass for (a) qW resonances, (b) qZ resonances, and (c) WZ resonances, compared to their predicted cross sections for the corresponding benchmark models. |
png pdf |
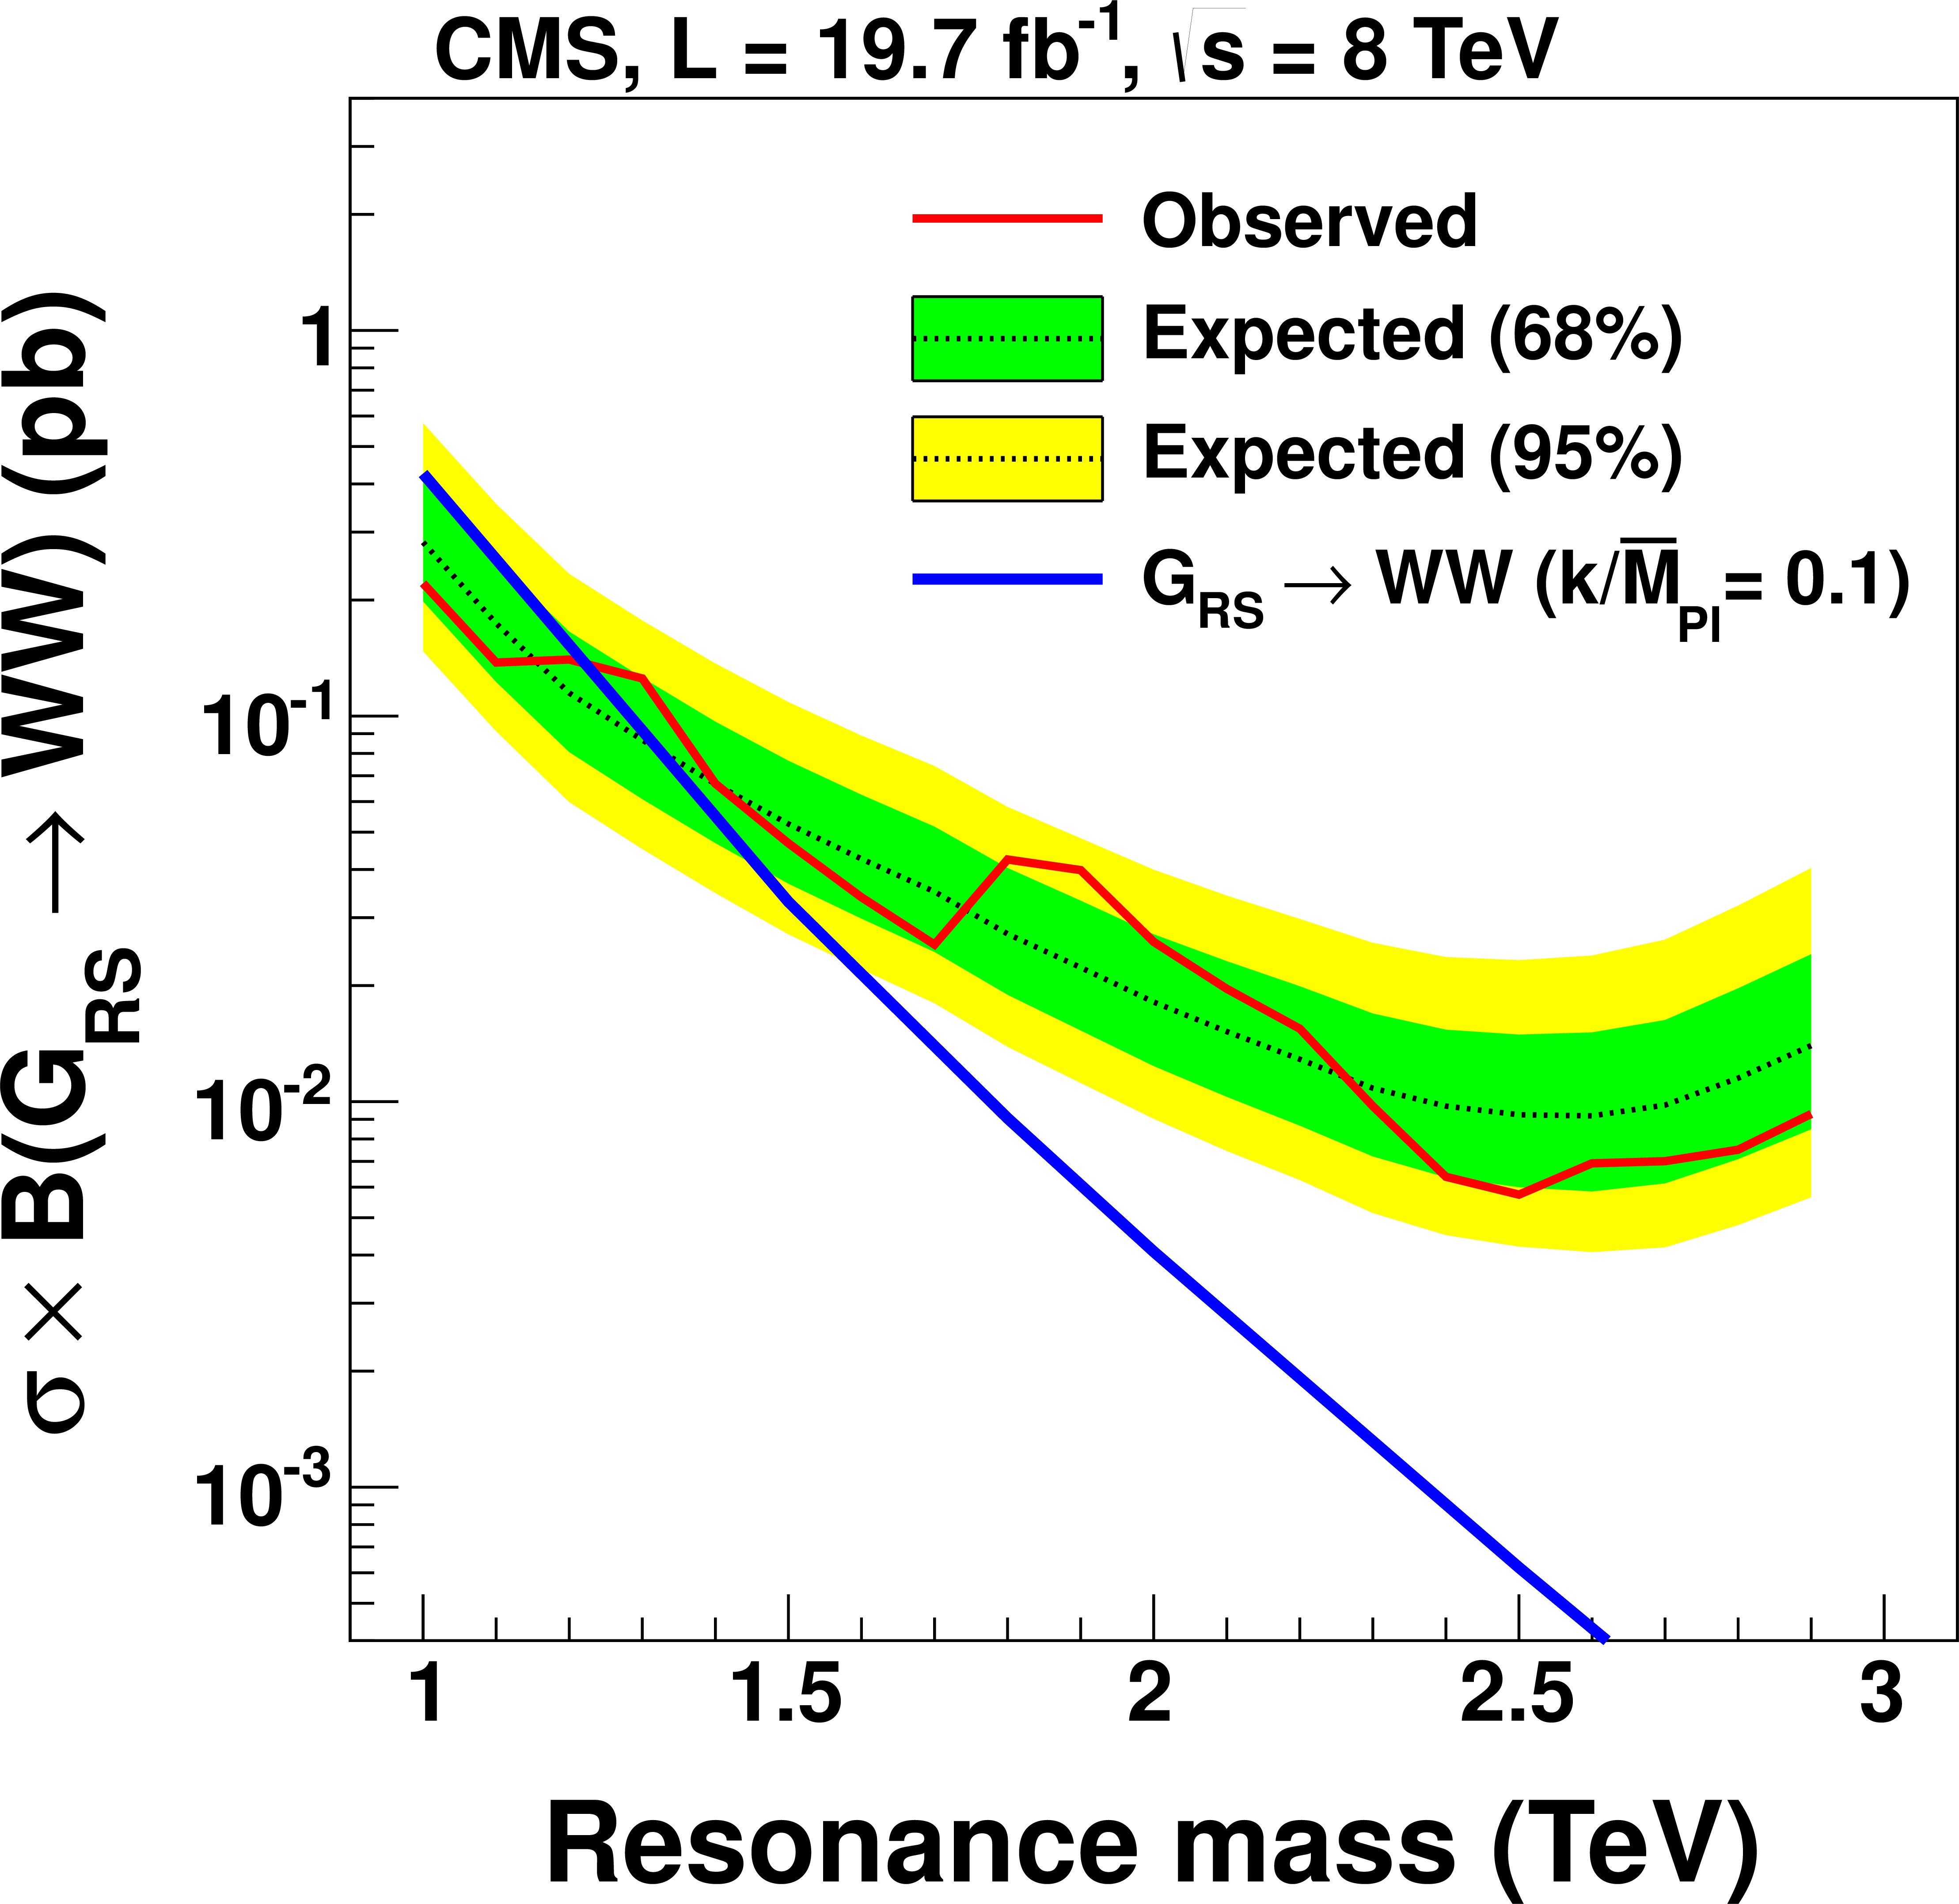
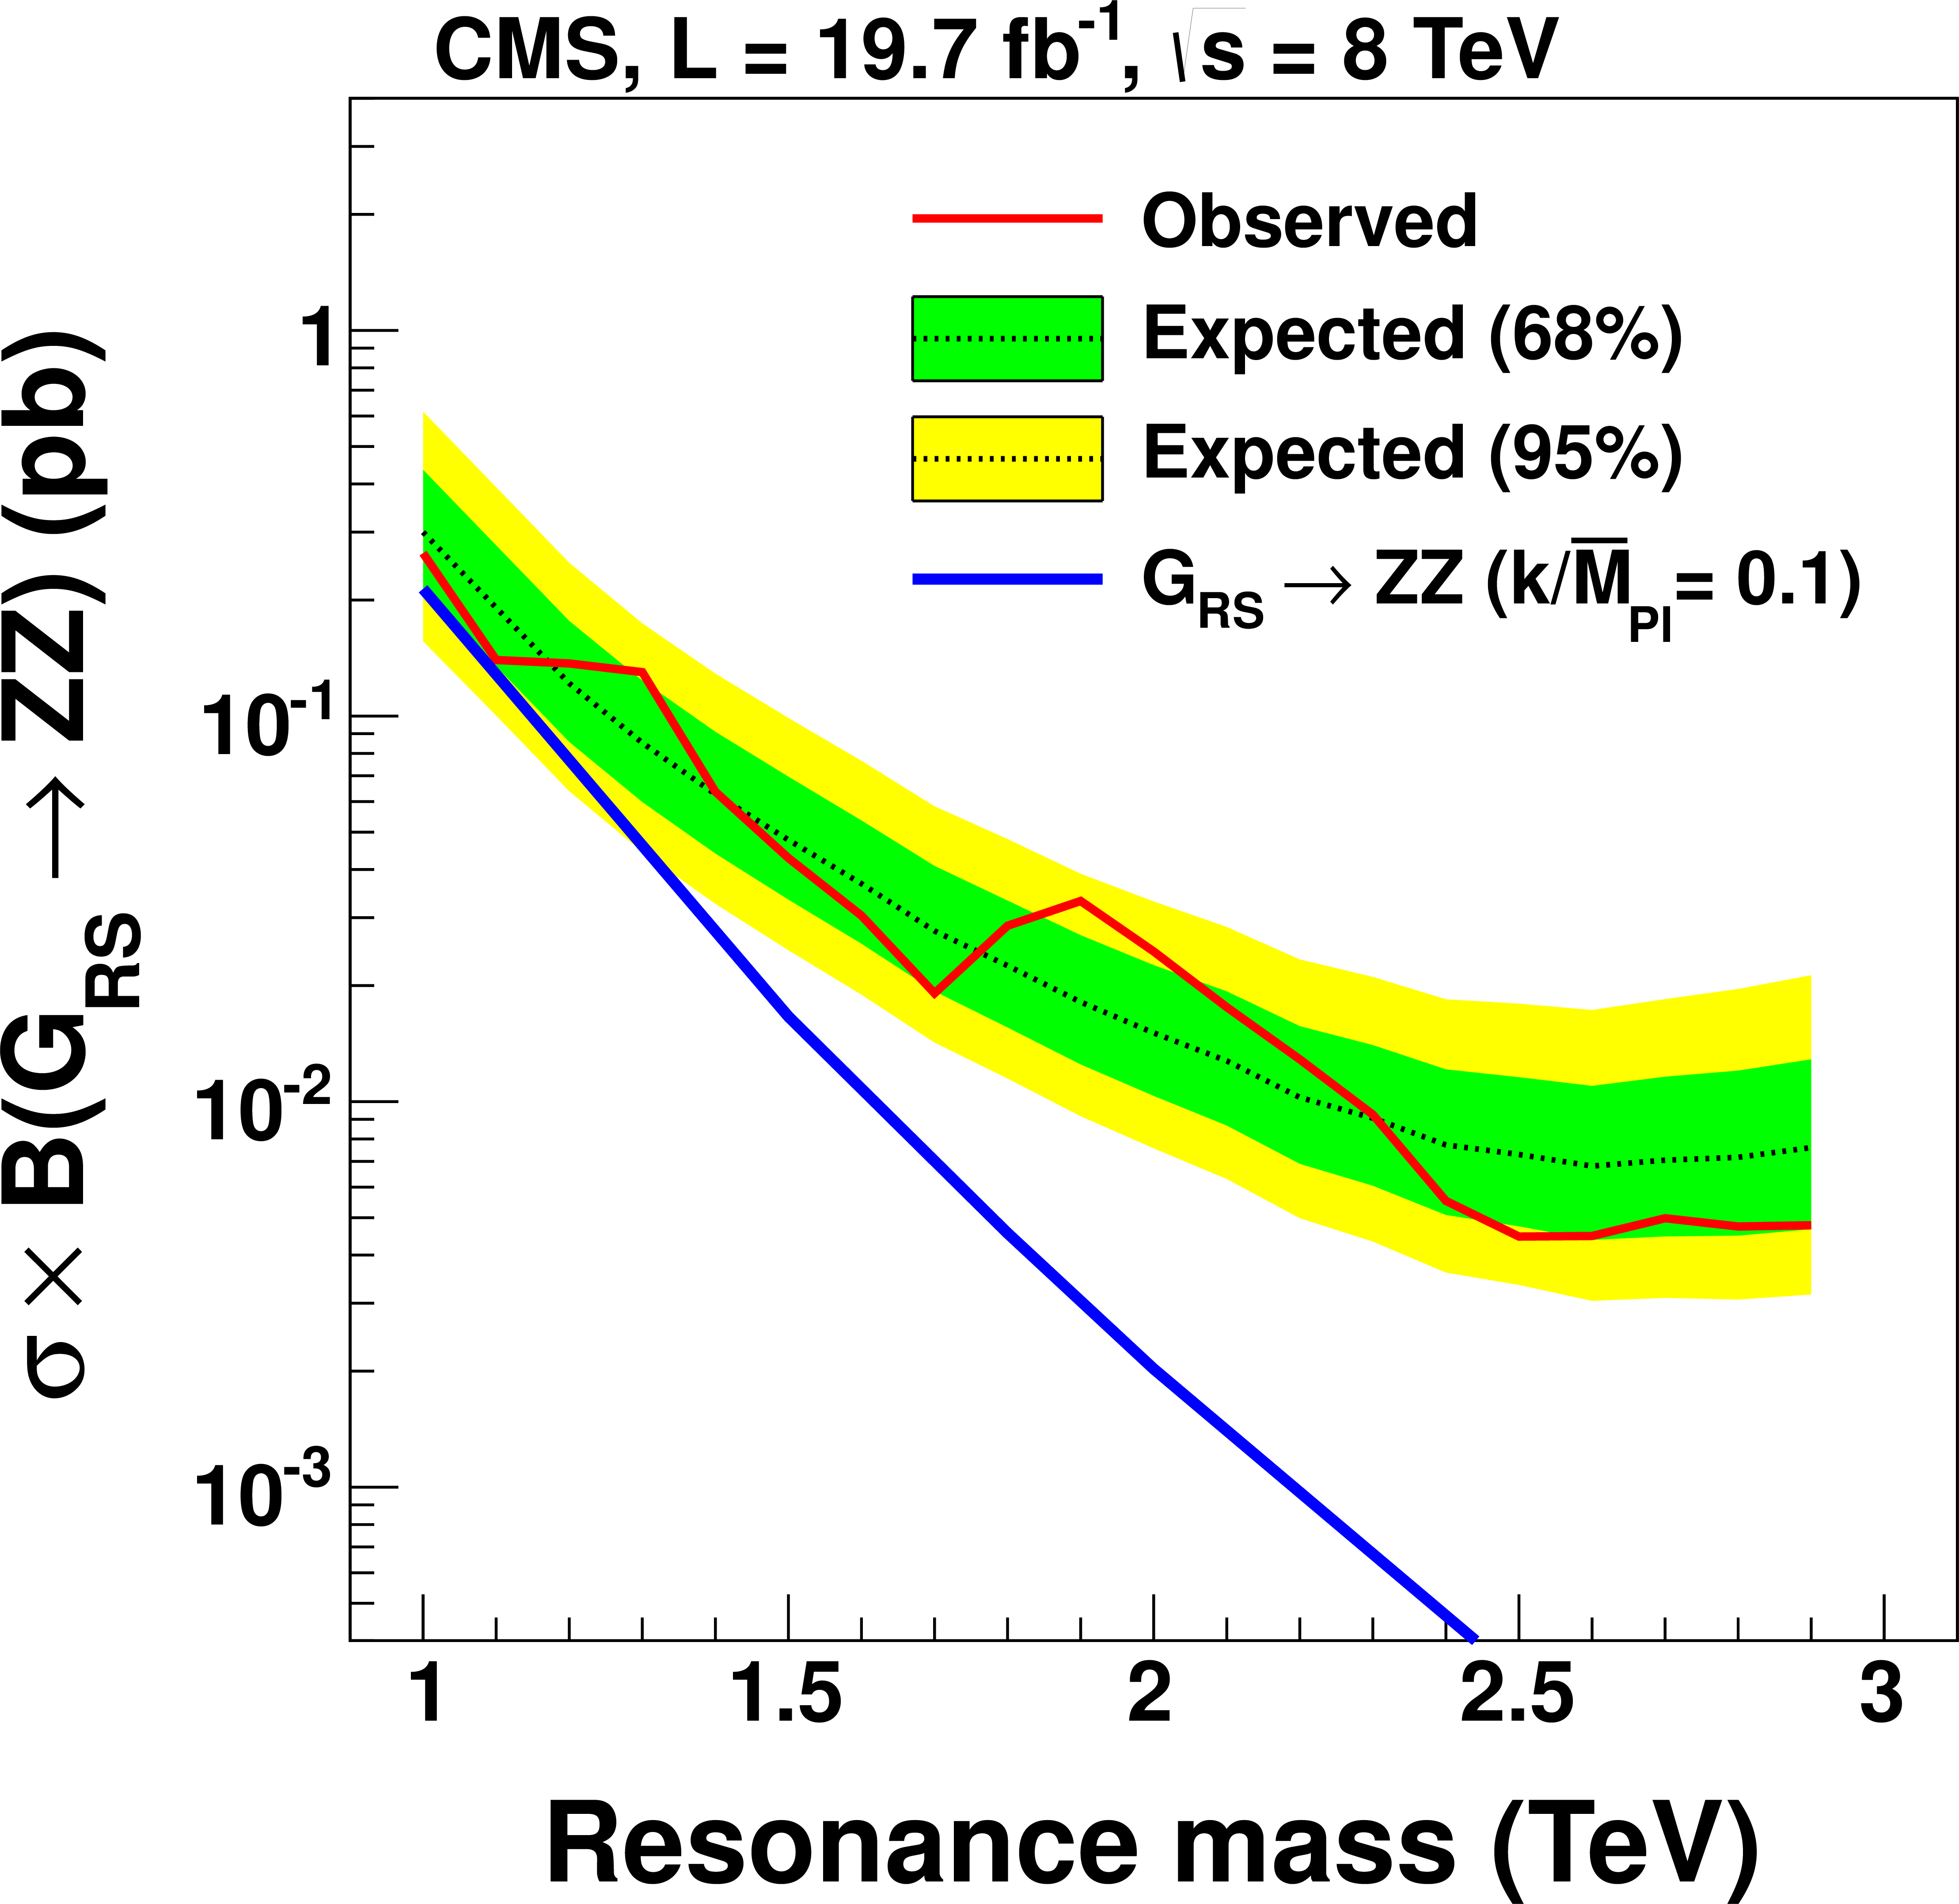
Figure 8-a:
Expected and observed 95% CL limits on the production cross section as a function of the resonance mass for (a) $ {\mathrm {G}_\mathrm {RS}} \to {\mathrm {W}} {\mathrm {W}}$ resonances, (b) $ {\mathrm {G}_\mathrm {RS}} \to {\mathrm {Z}} {\mathrm {Z}}$ resonances, (c) $ {\mathrm {G}_\mathrm {bulk}} \to {\mathrm {W}} {\mathrm {W}}$ resonances, and (d) $ {\mathrm {G}_\mathrm {bulk}} \to {\mathrm {Z}} {\mathrm {Z}}$ resonances, compared to the predicted cross sections. |
png pdf |
Figure 8-b:
Expected and observed 95% CL limits on the production cross section as a function of the resonance mass for (a) $ {\mathrm {G}_\mathrm {RS}} \to {\mathrm {W}} {\mathrm {W}}$ resonances, (b) $ {\mathrm {G}_\mathrm {RS}} \to {\mathrm {Z}} {\mathrm {Z}}$ resonances, (c) $ {\mathrm {G}_\mathrm {bulk}} \to {\mathrm {W}} {\mathrm {W}}$ resonances, and (d) $ {\mathrm {G}_\mathrm {bulk}} \to {\mathrm {Z}} {\mathrm {Z}}$ resonances, compared to the predicted cross sections. |
png pdf |
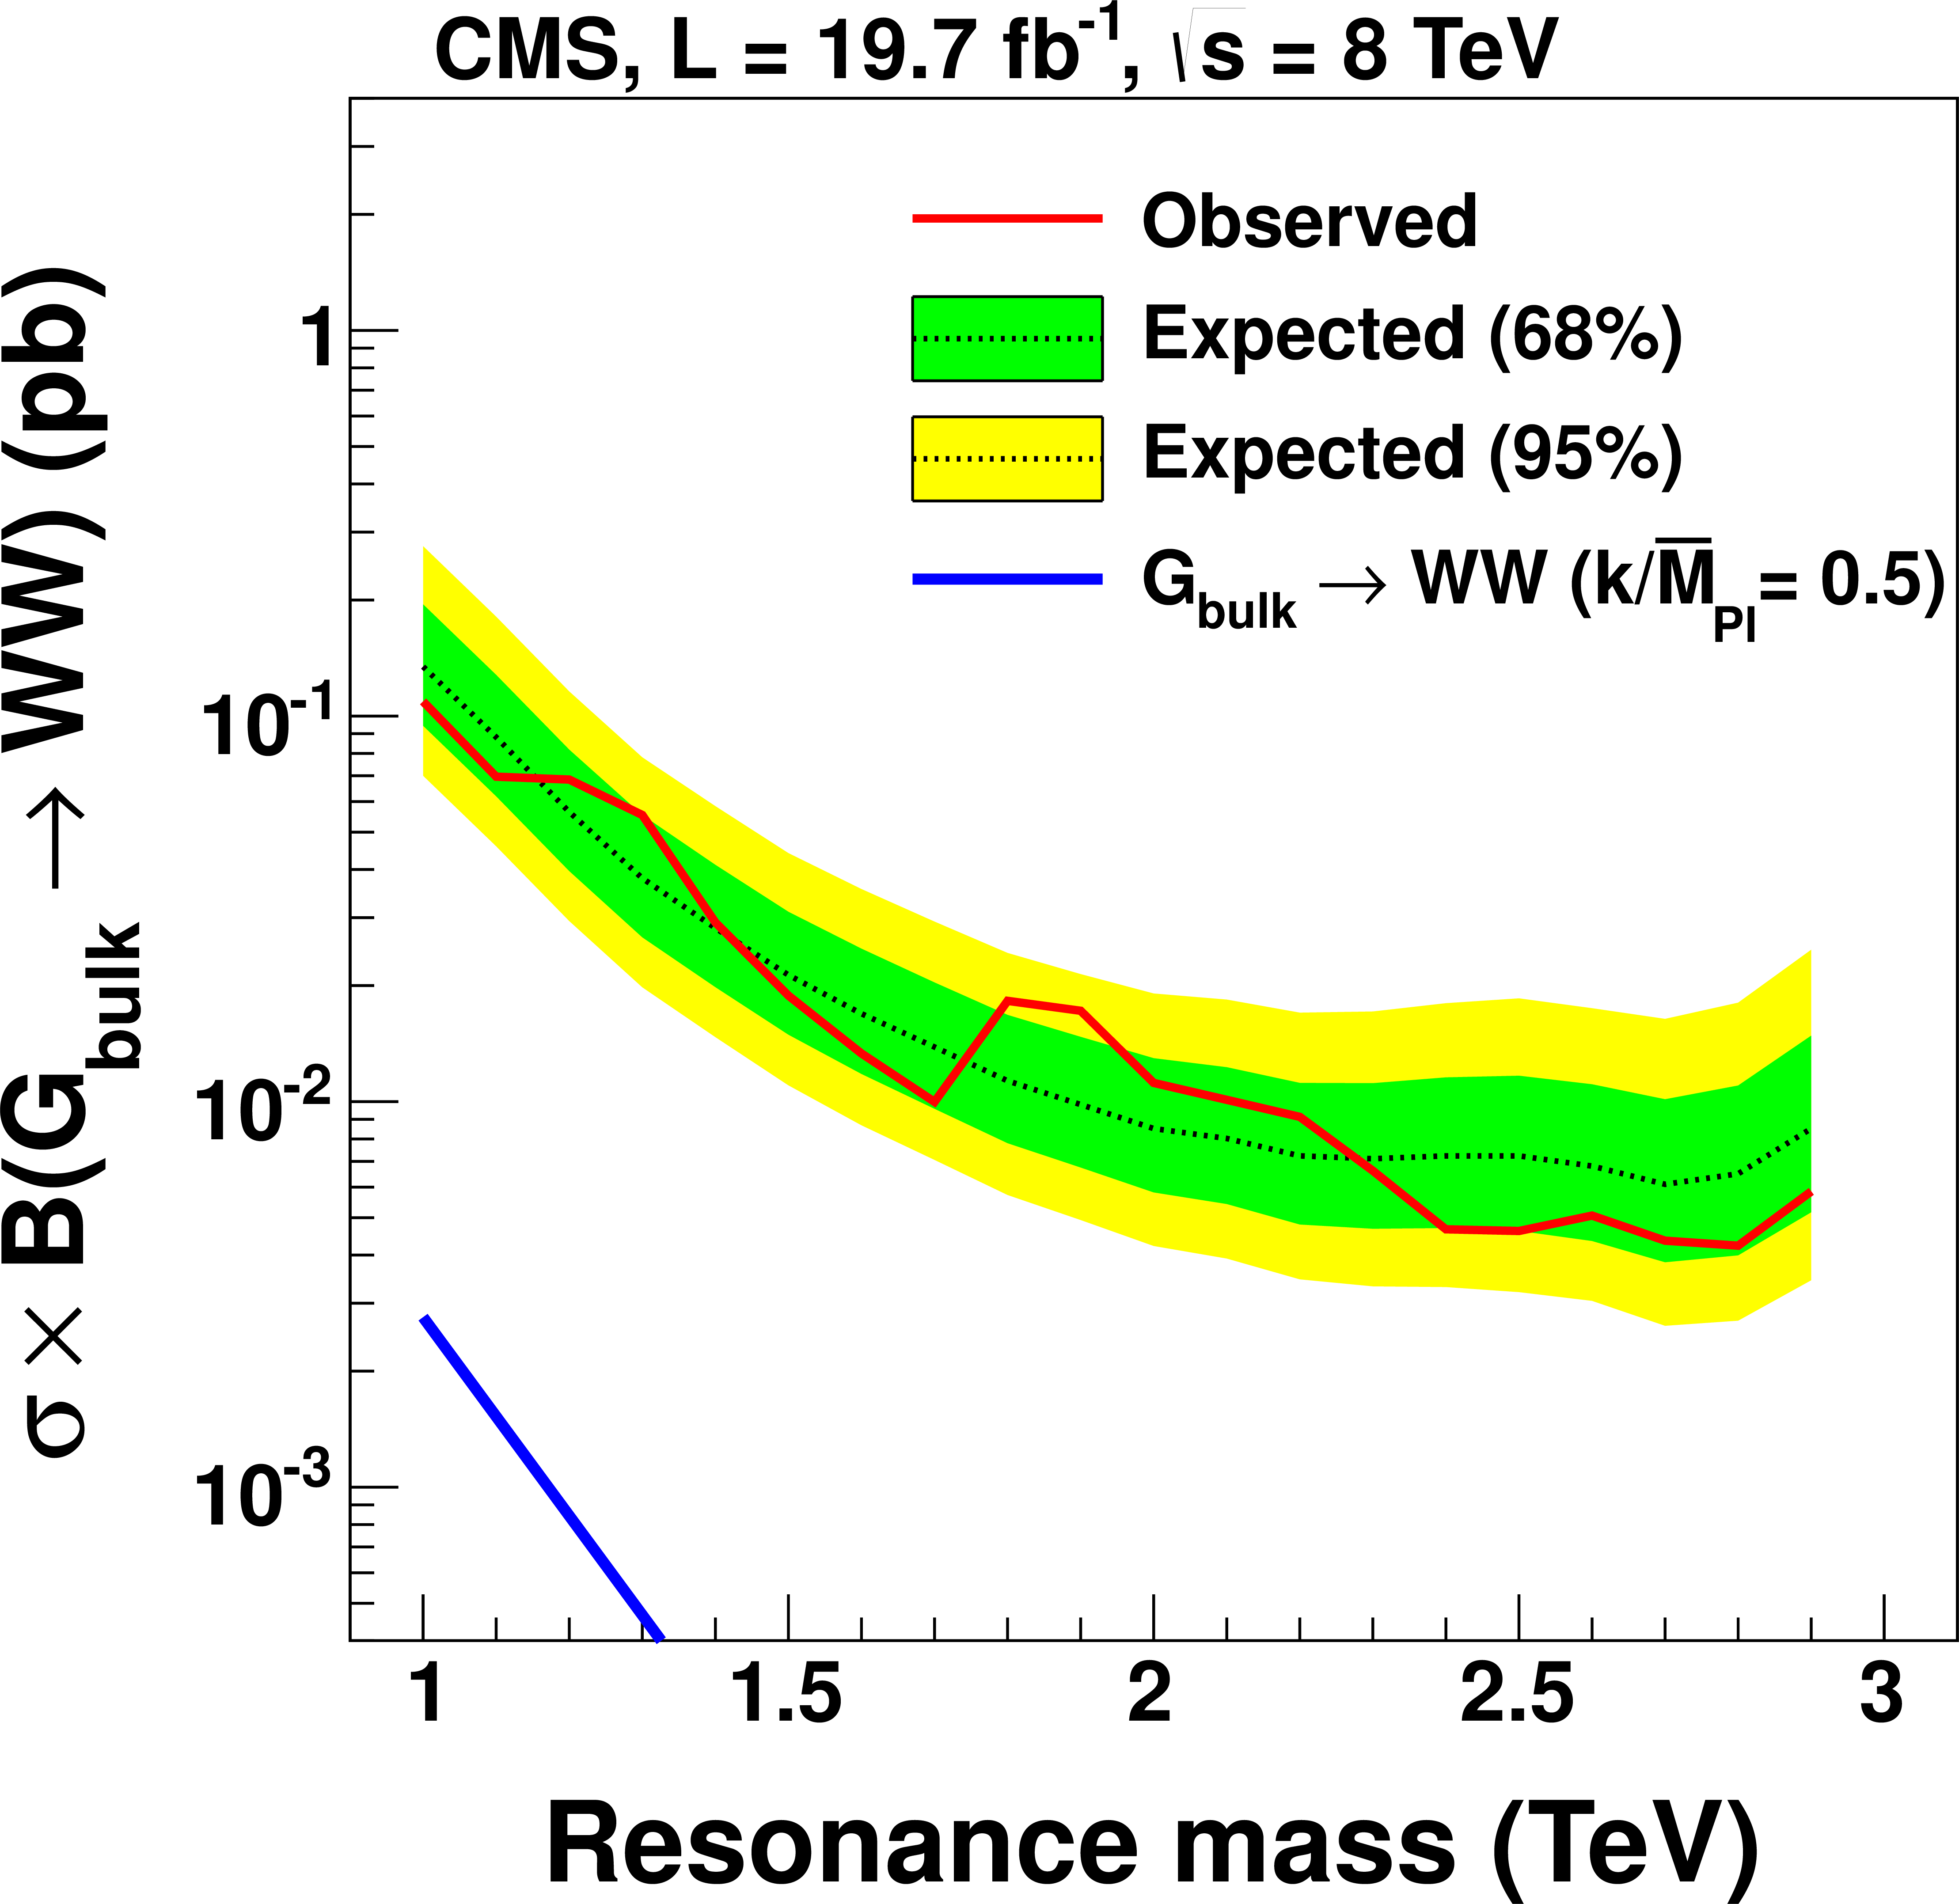
Figure 8-c:
Expected and observed 95% CL limits on the production cross section as a function of the resonance mass for (a) $ {\mathrm {G}_\mathrm {RS}} \to {\mathrm {W}} {\mathrm {W}}$ resonances, (b) $ {\mathrm {G}_\mathrm {RS}} \to {\mathrm {Z}} {\mathrm {Z}}$ resonances, (c) $ {\mathrm {G}_\mathrm {bulk}} \to {\mathrm {W}} {\mathrm {W}}$ resonances, and (d) $ {\mathrm {G}_\mathrm {bulk}} \to {\mathrm {Z}} {\mathrm {Z}}$ resonances, compared to the predicted cross sections. |
png pdf |
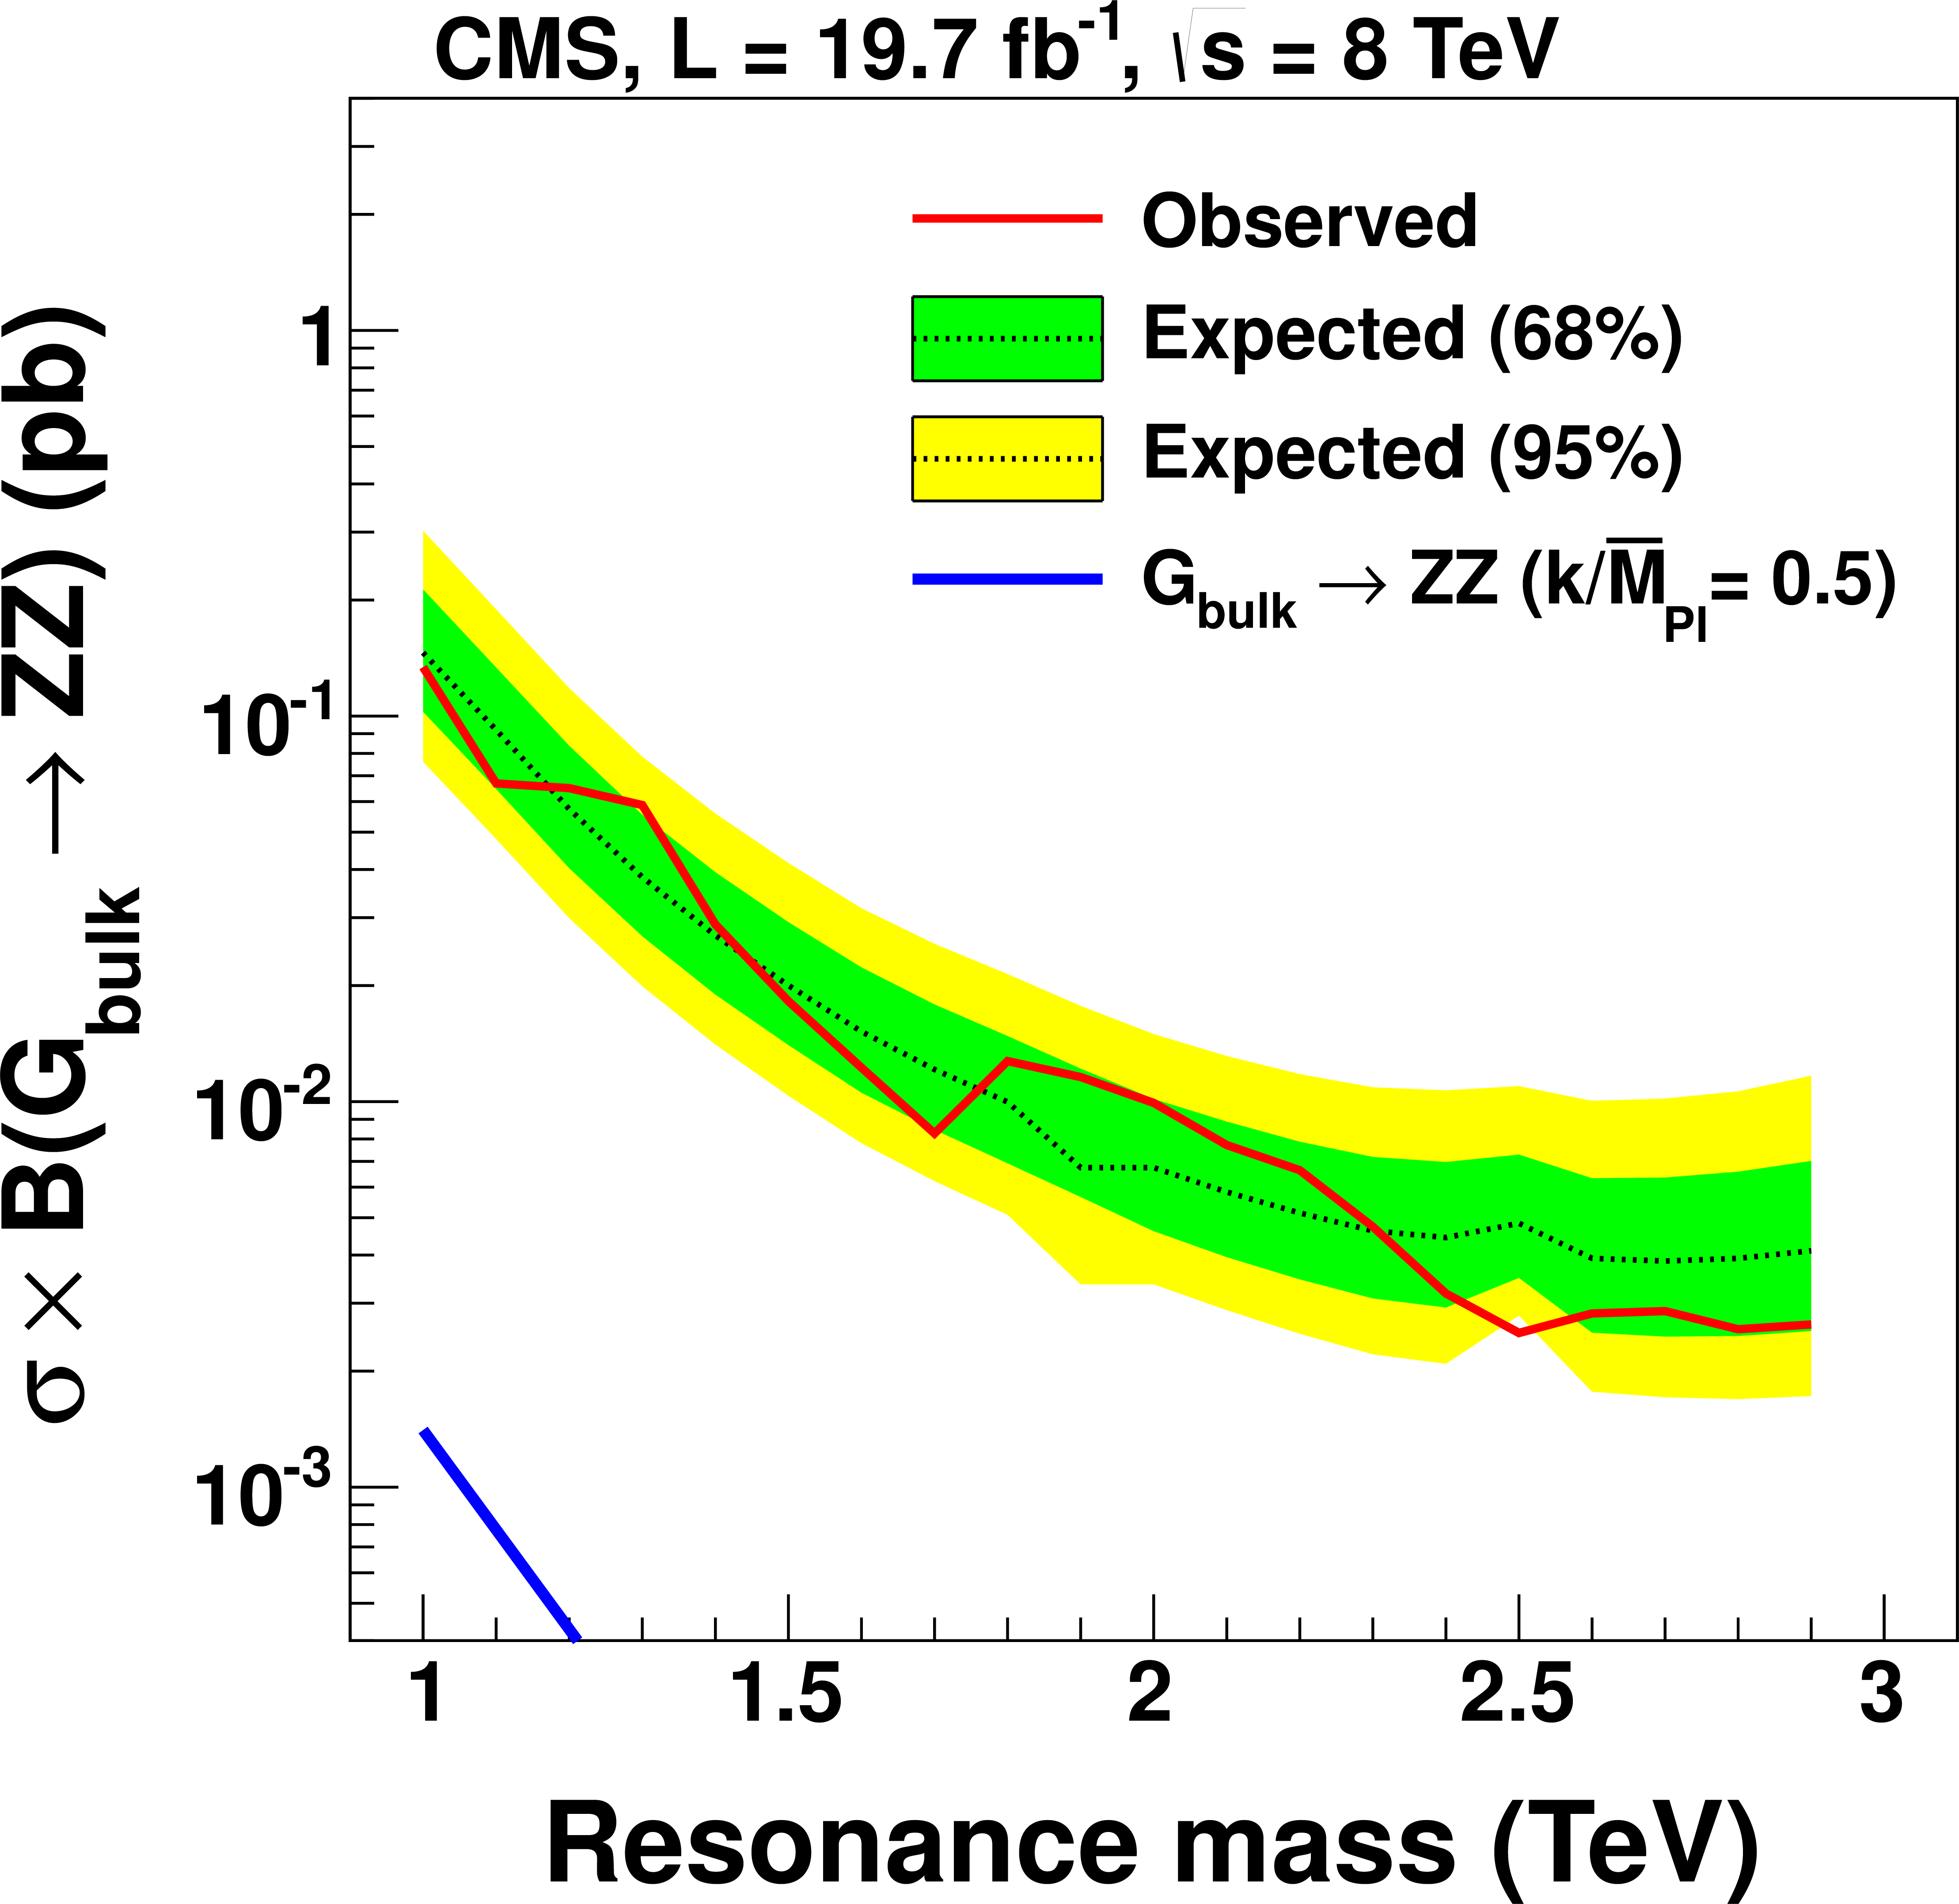
Figure 8-d:
Expected and observed 95% CL limits on the production cross section as a function of the resonance mass for (a) $ {\mathrm {G}_\mathrm {RS}} \to {\mathrm {W}} {\mathrm {W}}$ resonances, (b) $ {\mathrm {G}_\mathrm {RS}} \to {\mathrm {Z}} {\mathrm {Z}}$ resonances, (c) $ {\mathrm {G}_\mathrm {bulk}} \to {\mathrm {W}} {\mathrm {W}}$ resonances, and (d) $ {\mathrm {G}_\mathrm {bulk}} \to {\mathrm {Z}} {\mathrm {Z}}$ resonances, compared to the predicted cross sections. |
| Summary |
|
An inclusive sample of multijet events corresponding to an integrated luminosity of 19.7 fb?1, collected in pp collisions at $\sqrt{s} = $ 8 TeV with the CMS detectoris used to measure the W/Z-tagged dijet mass spectrum for the two leading jets, produced within the pseudorapidity range $| \eta | < $ 2.5 with a separation in pseudorapidity of $| \Delta \eta | < $ 1.3. The generic multijet background is suppressed using jet-substructure tagging techniques that identify vector bosons decaying into $\mathrm{ \bar{q}q^{\prime}}$ pairs merged into a single jet. In particular, the invariant mass of pruned jets and the N-subjettiness ratio $\tau_{21}$ of each jet are used to reduce the initially overwhelming multijet back- ground. The remaining background is estimated through a fit to smooth analytic functions. |
|
|
Compact Muon Solenoid LHC, CERN |
|

|

|

|

|

|