

Compact Muon Solenoid
LHC, CERN
| CMS-EXO-12-043 ; CERN-PH-EP-2015-149 | ||
| Search for single production of scalar leptoquarks in proton-proton collisions at $ \sqrt{s} =$ 8 TeV | ||
| CMS Collaboration | ||
| 12 September 2015 | ||
| Phys. Rev. D93 (2016) 032005 [Erratum] | ||
| Abstract: A search is presented for the production of both first- and second- generation scalar leptoquarks with a final state of either two electrons and one jet or two muons and one jet. A data sample of proton-proton collisions at center-of-mass energy $ \sqrt{s} =$ 8 TeV recorded with the CMS detector corresponds to an integrated luminosity of 19.6 fb$^{-1}$. Upper limits are set on both the first- and second- generation leptoquark production cross sections as functions of the leptoquark mass and the leptoquark couplings to a lepton and a quark. Results are compared with theoretical predictions to obtain lower limits on the leptoquark mass. At 95% confidence level, single production of first-generation leptoquarks with a coupling and branching fraction of 1.0 is excluded for masses below 1730 GeV, and second-generation leptoquarks with a coupling and branching fraction of 1.0 is excluded for masses below 530 GeV. These are the best overall limits on the production of first-generation leptoquarks to date. | ||
| Links: e-print arXiv:1509.03750 [hep-ex] (PDF) ; CDS record ; inSPIRE record ; CADI line (restricted) ; | ||
| Figures | |
png pdf |
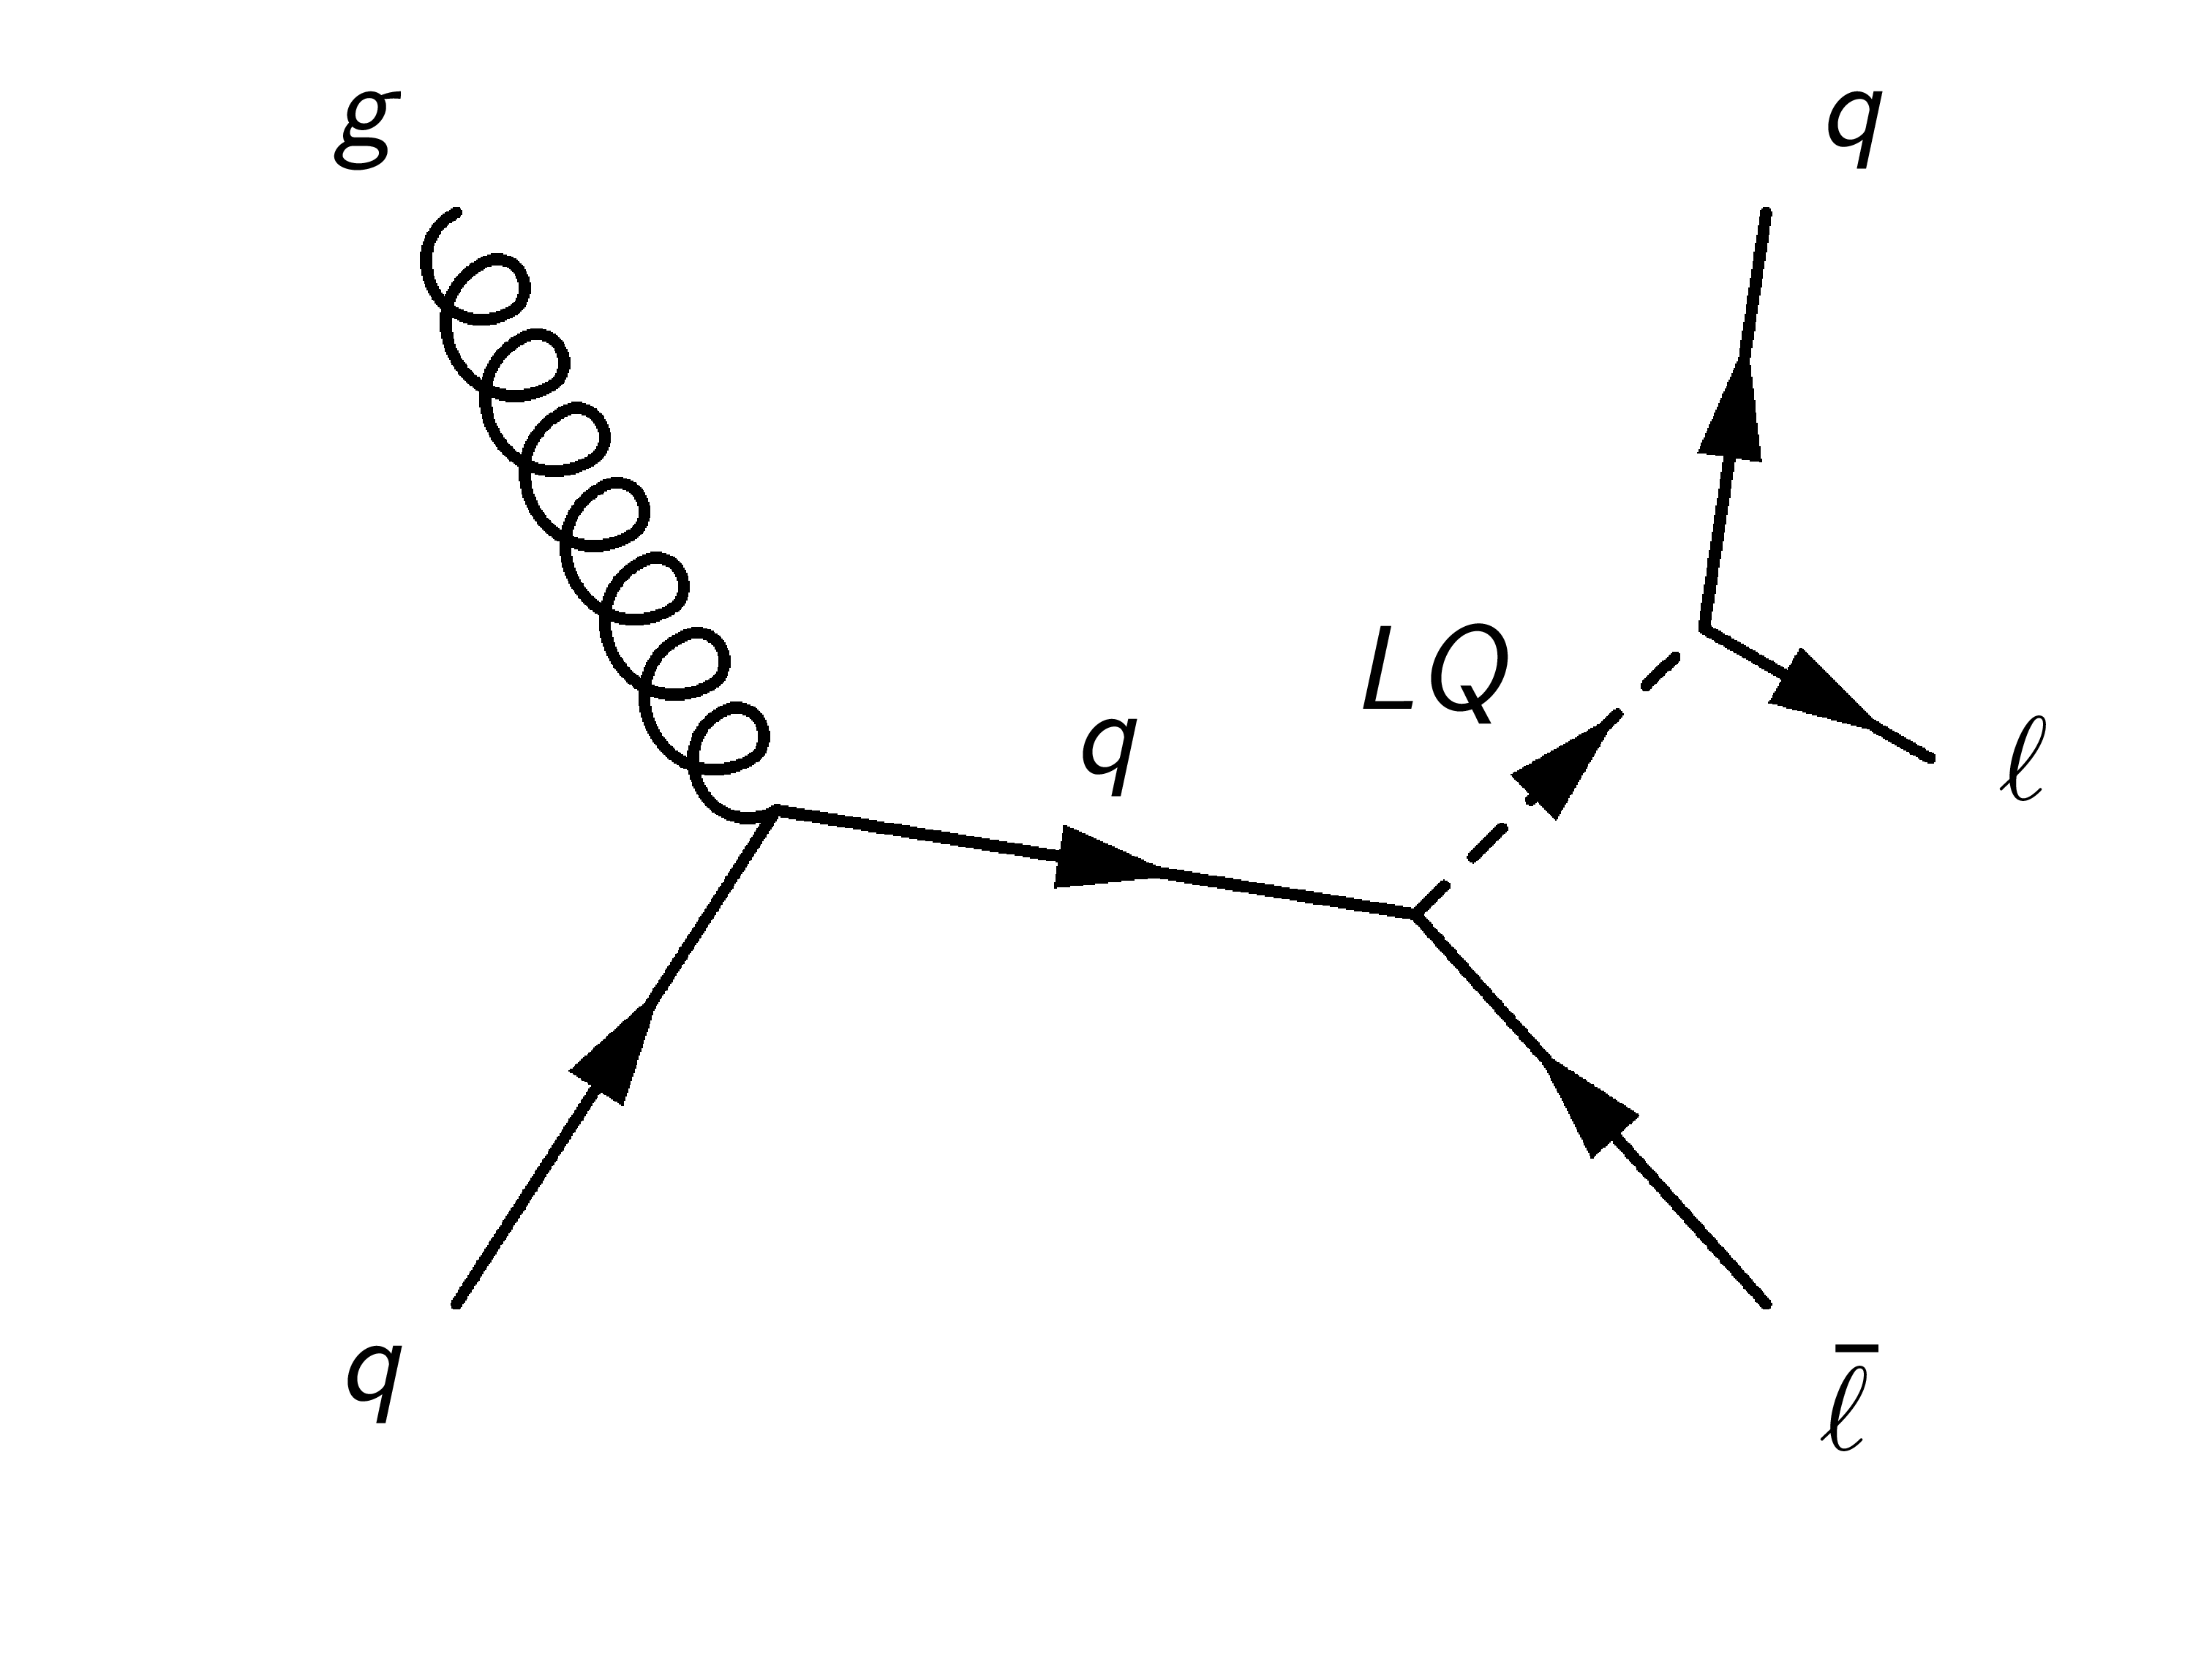
Figure 1:
The $s$-channel resonant LQ production diagram. |
png pdf |
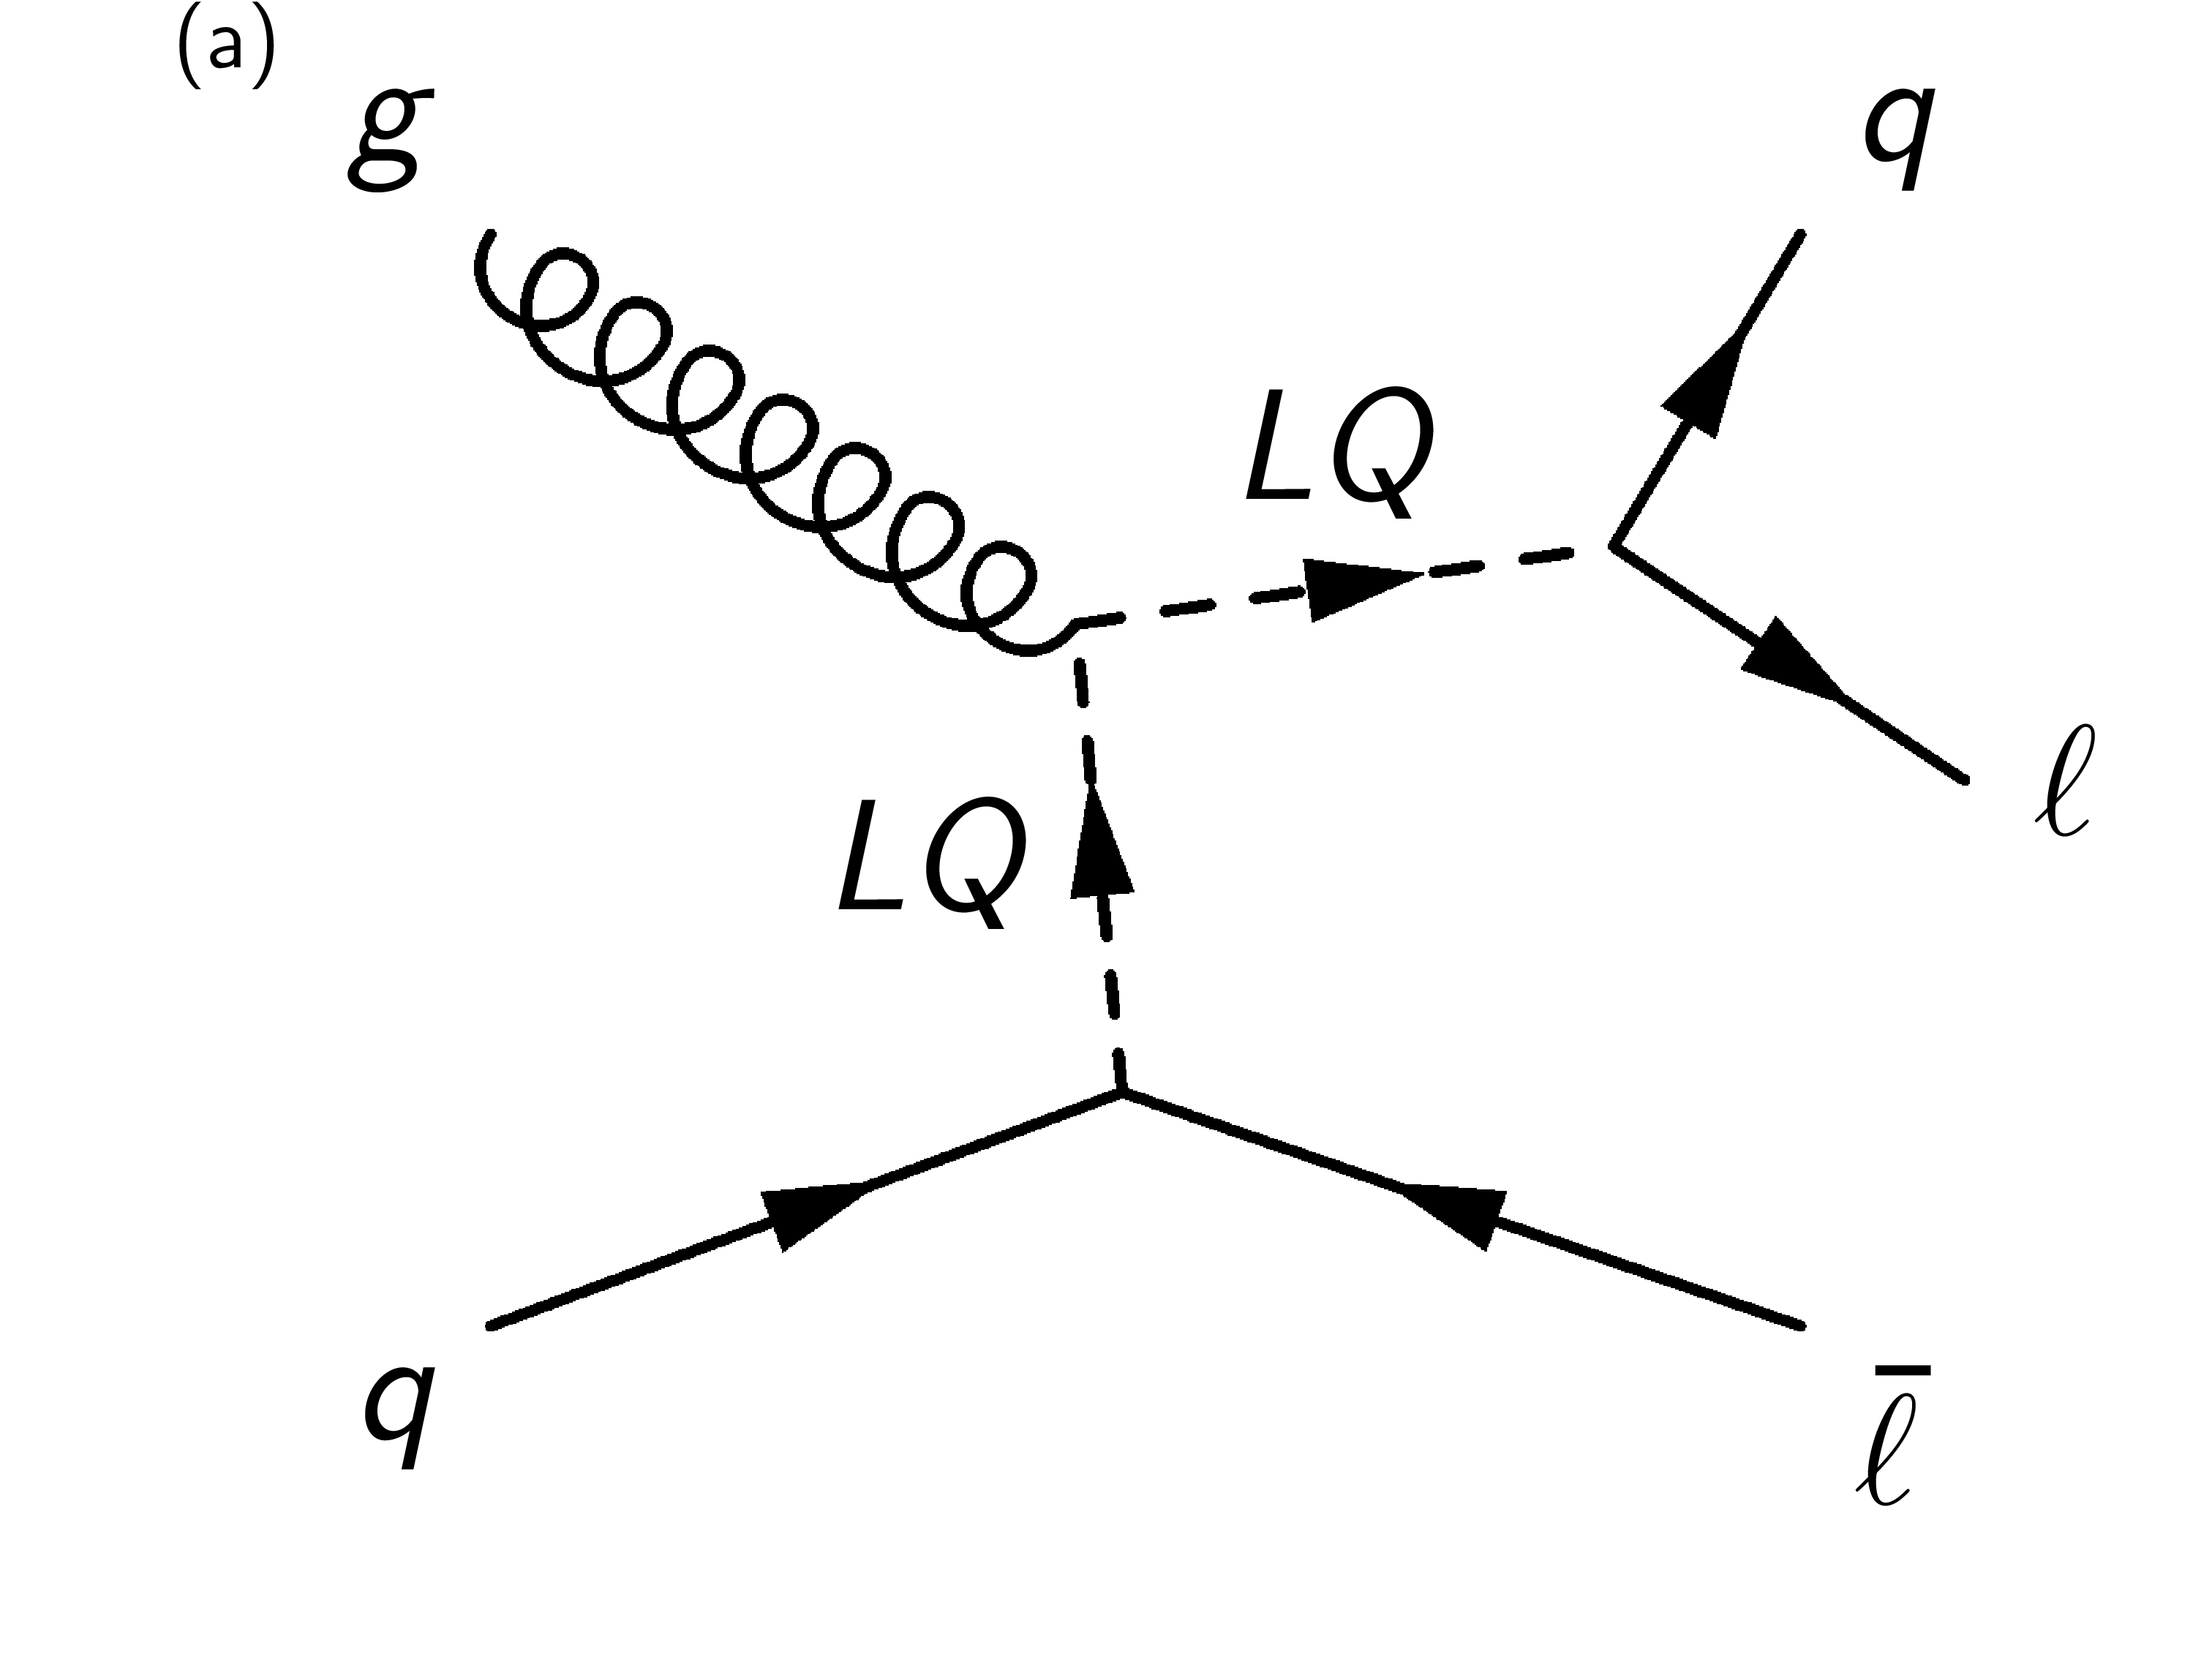
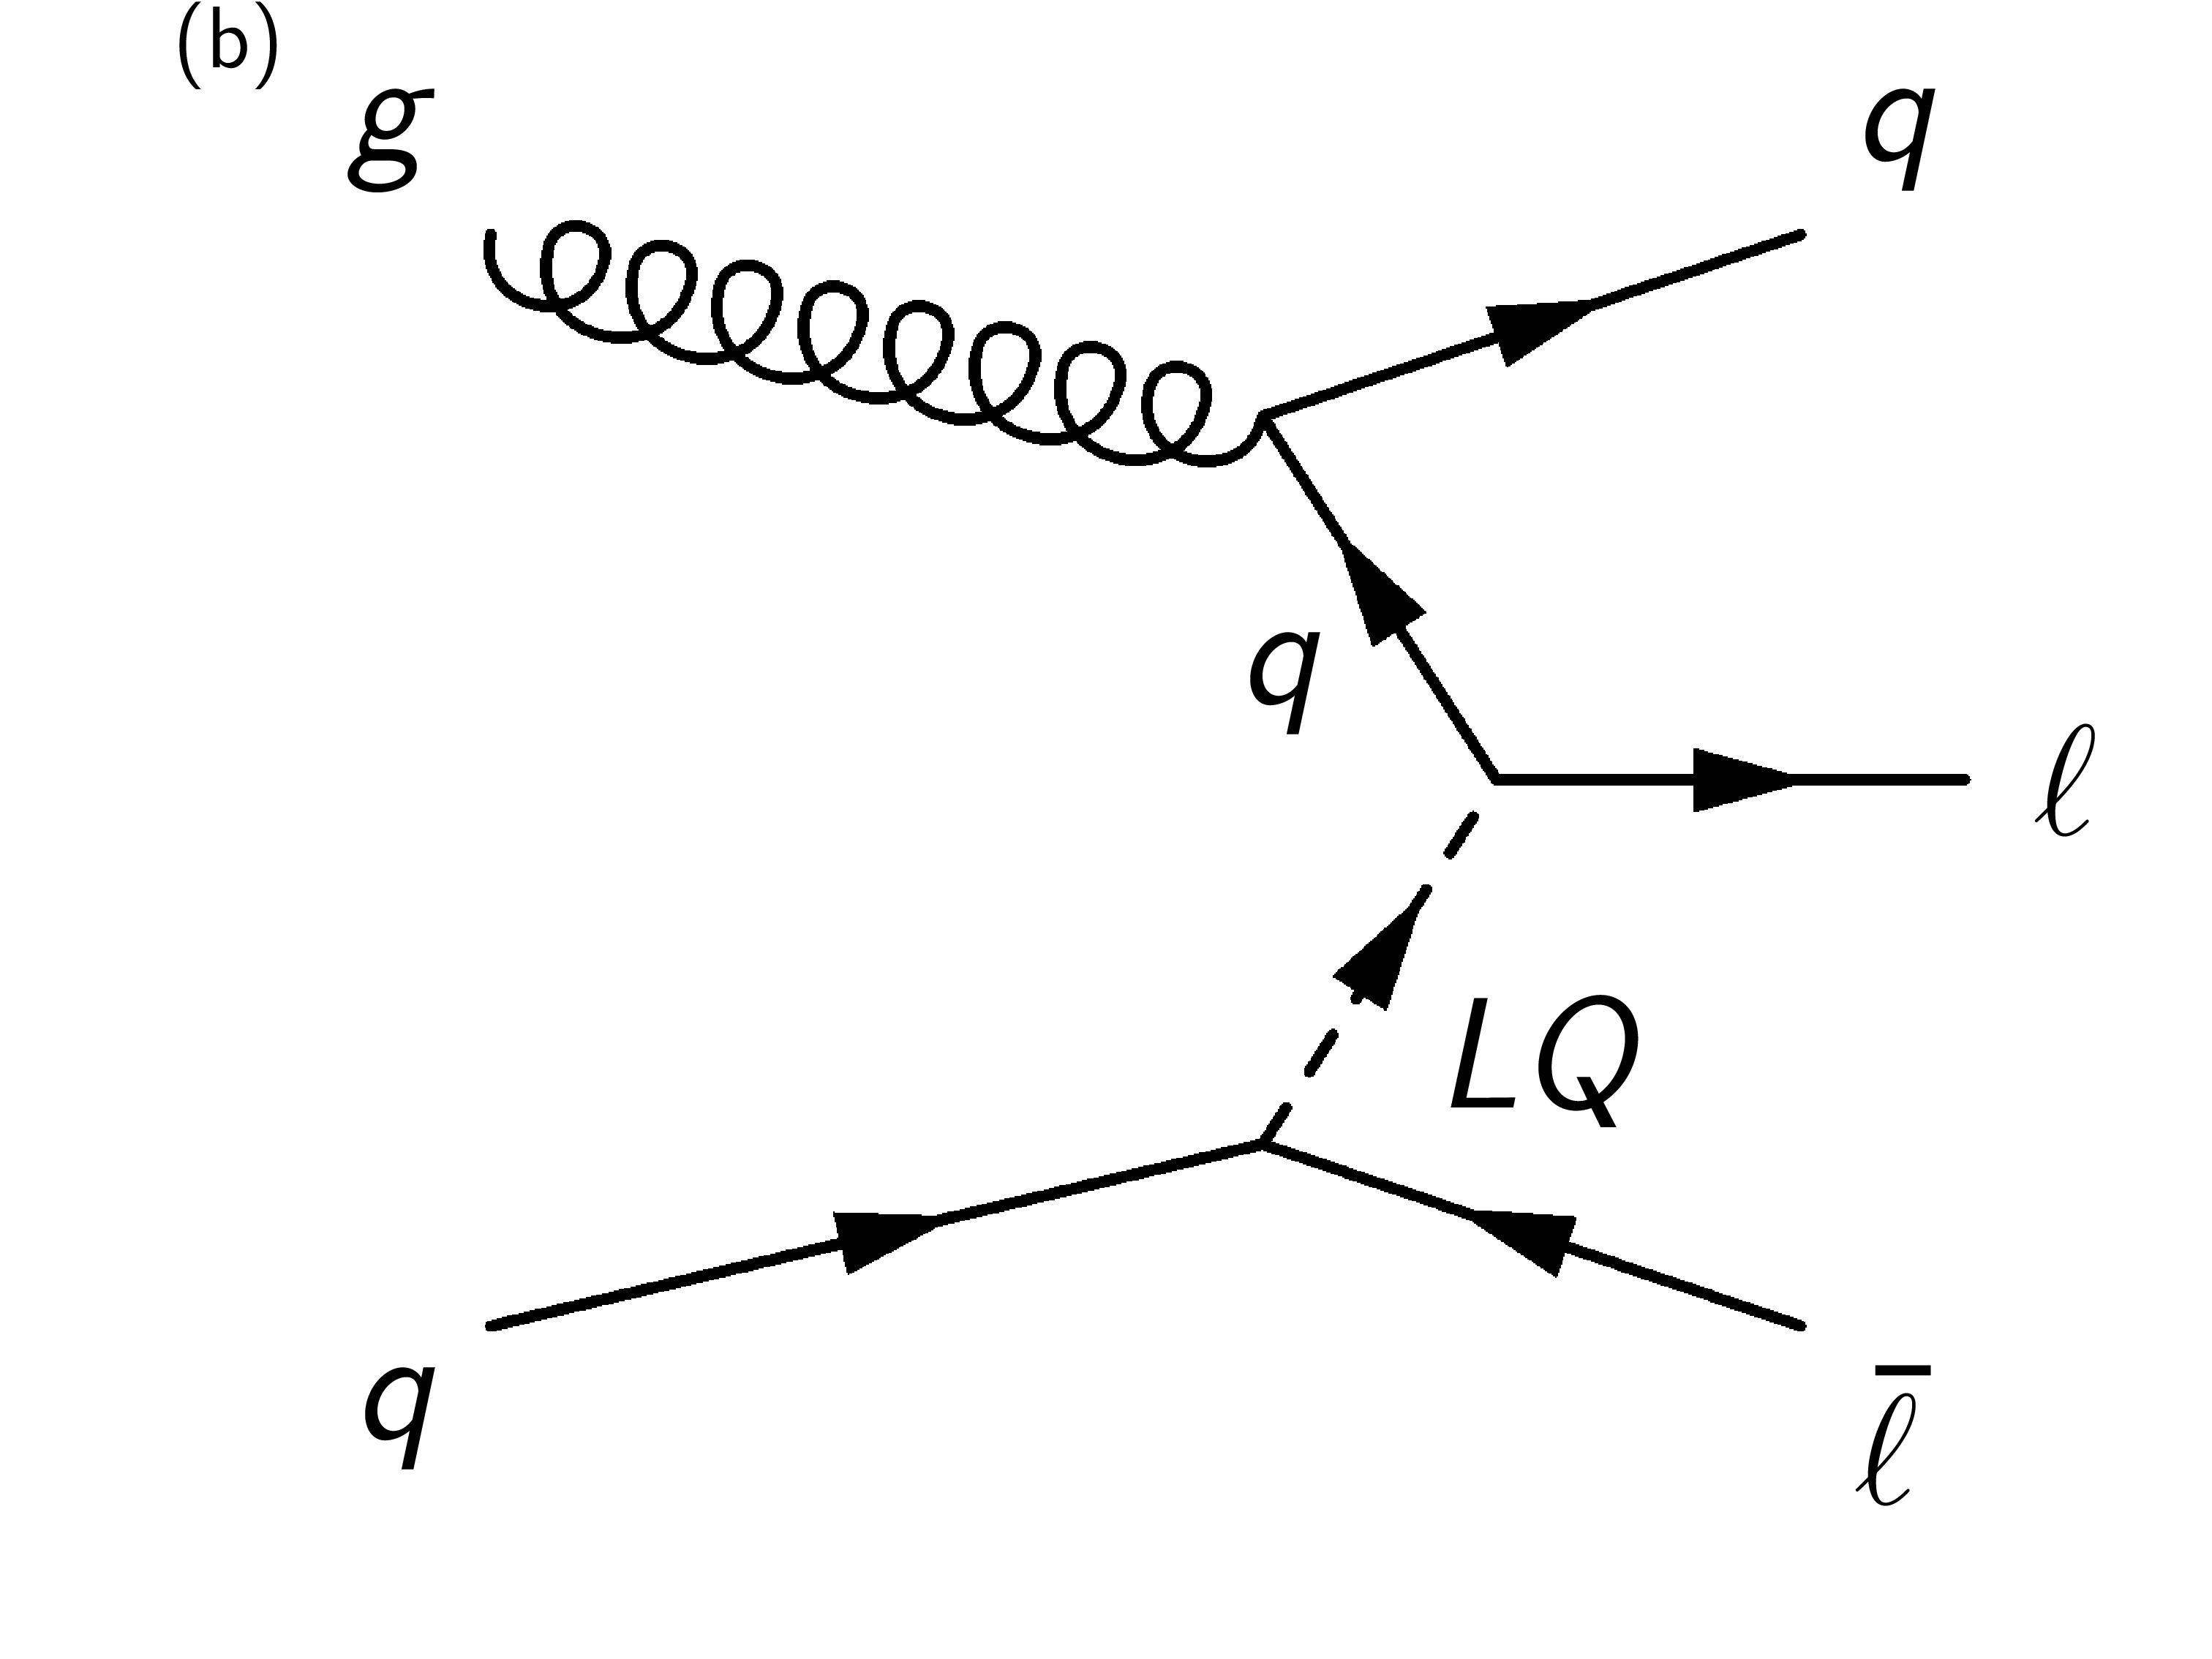
Figure 2-a:
The $t$-channel LQ production diagrams with non-resonant components. The diagram in (b) is completely non-resonant. |
png pdf |
Figure 2-b:
The $t$-channel LQ production diagrams with non-resonant components. The diagram in (b) is completely non-resonant. |
png pdf |
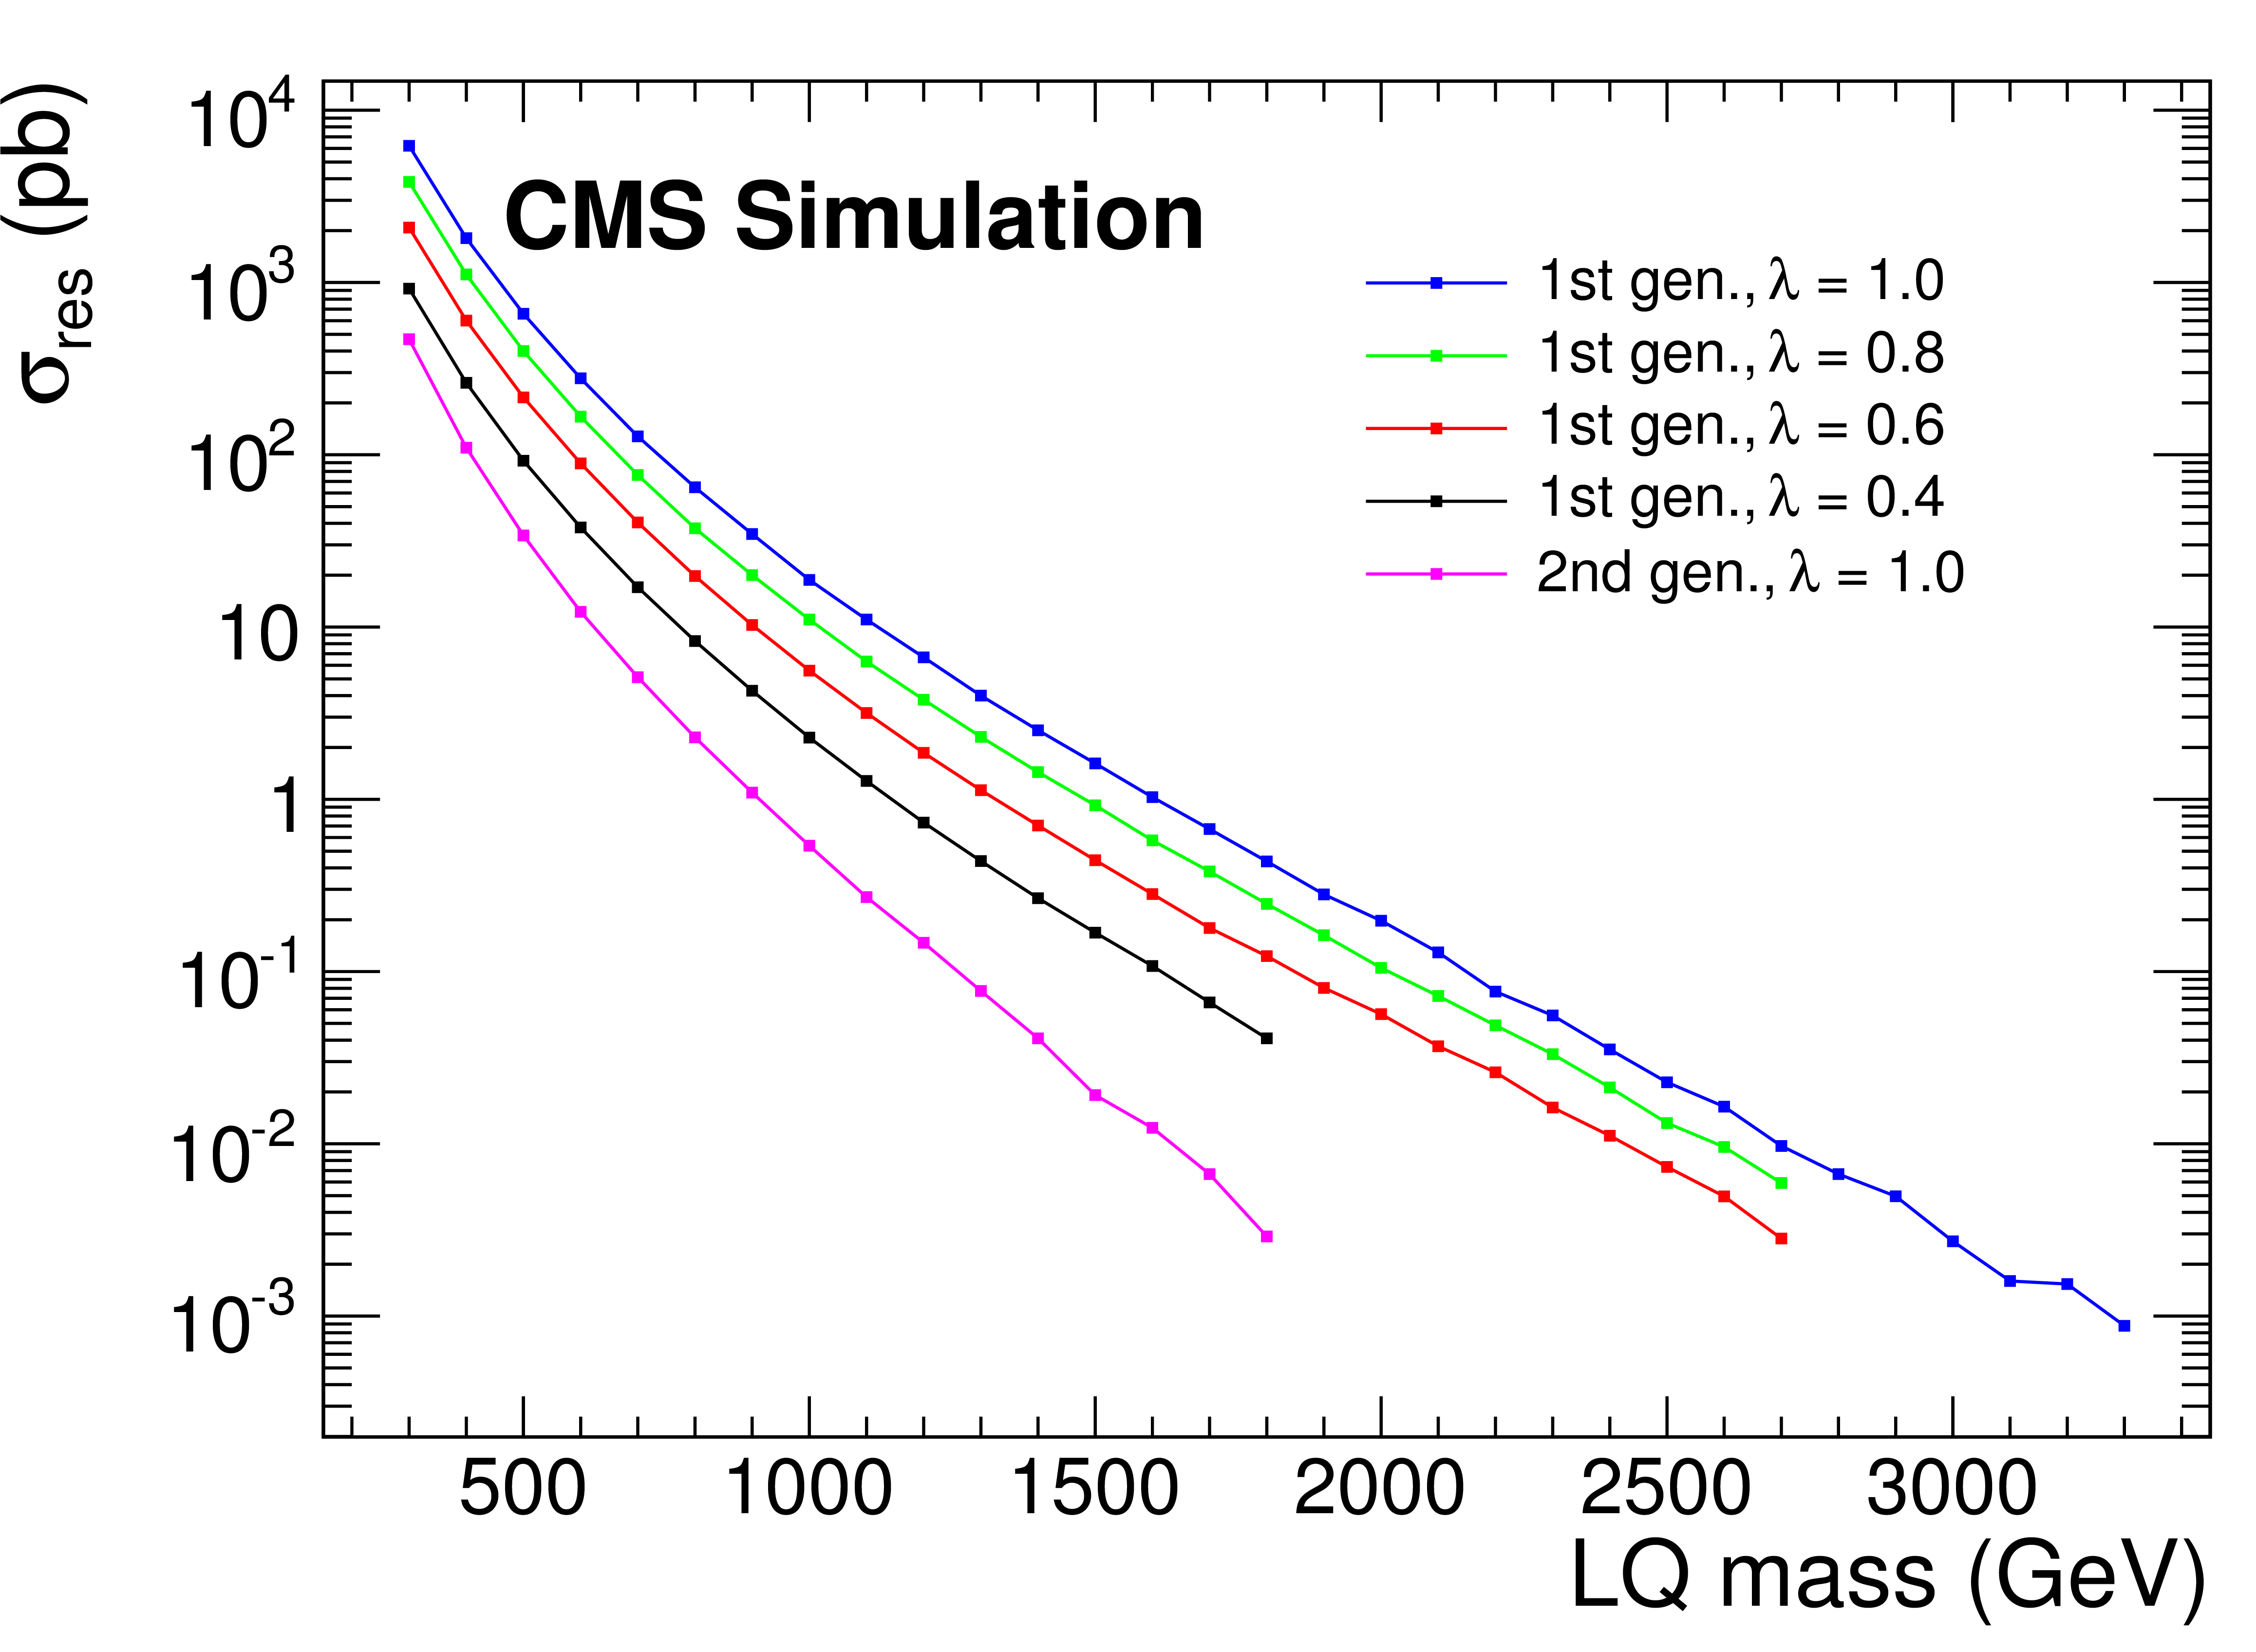
Figure 3:
Cross sections for single LQ production, calculated at LO in CalcHEP and scaled by the acceptance of the requirements described in Section 5, as a function of the LQ mass in GeV. |
png pdf |
Figure 4-a:
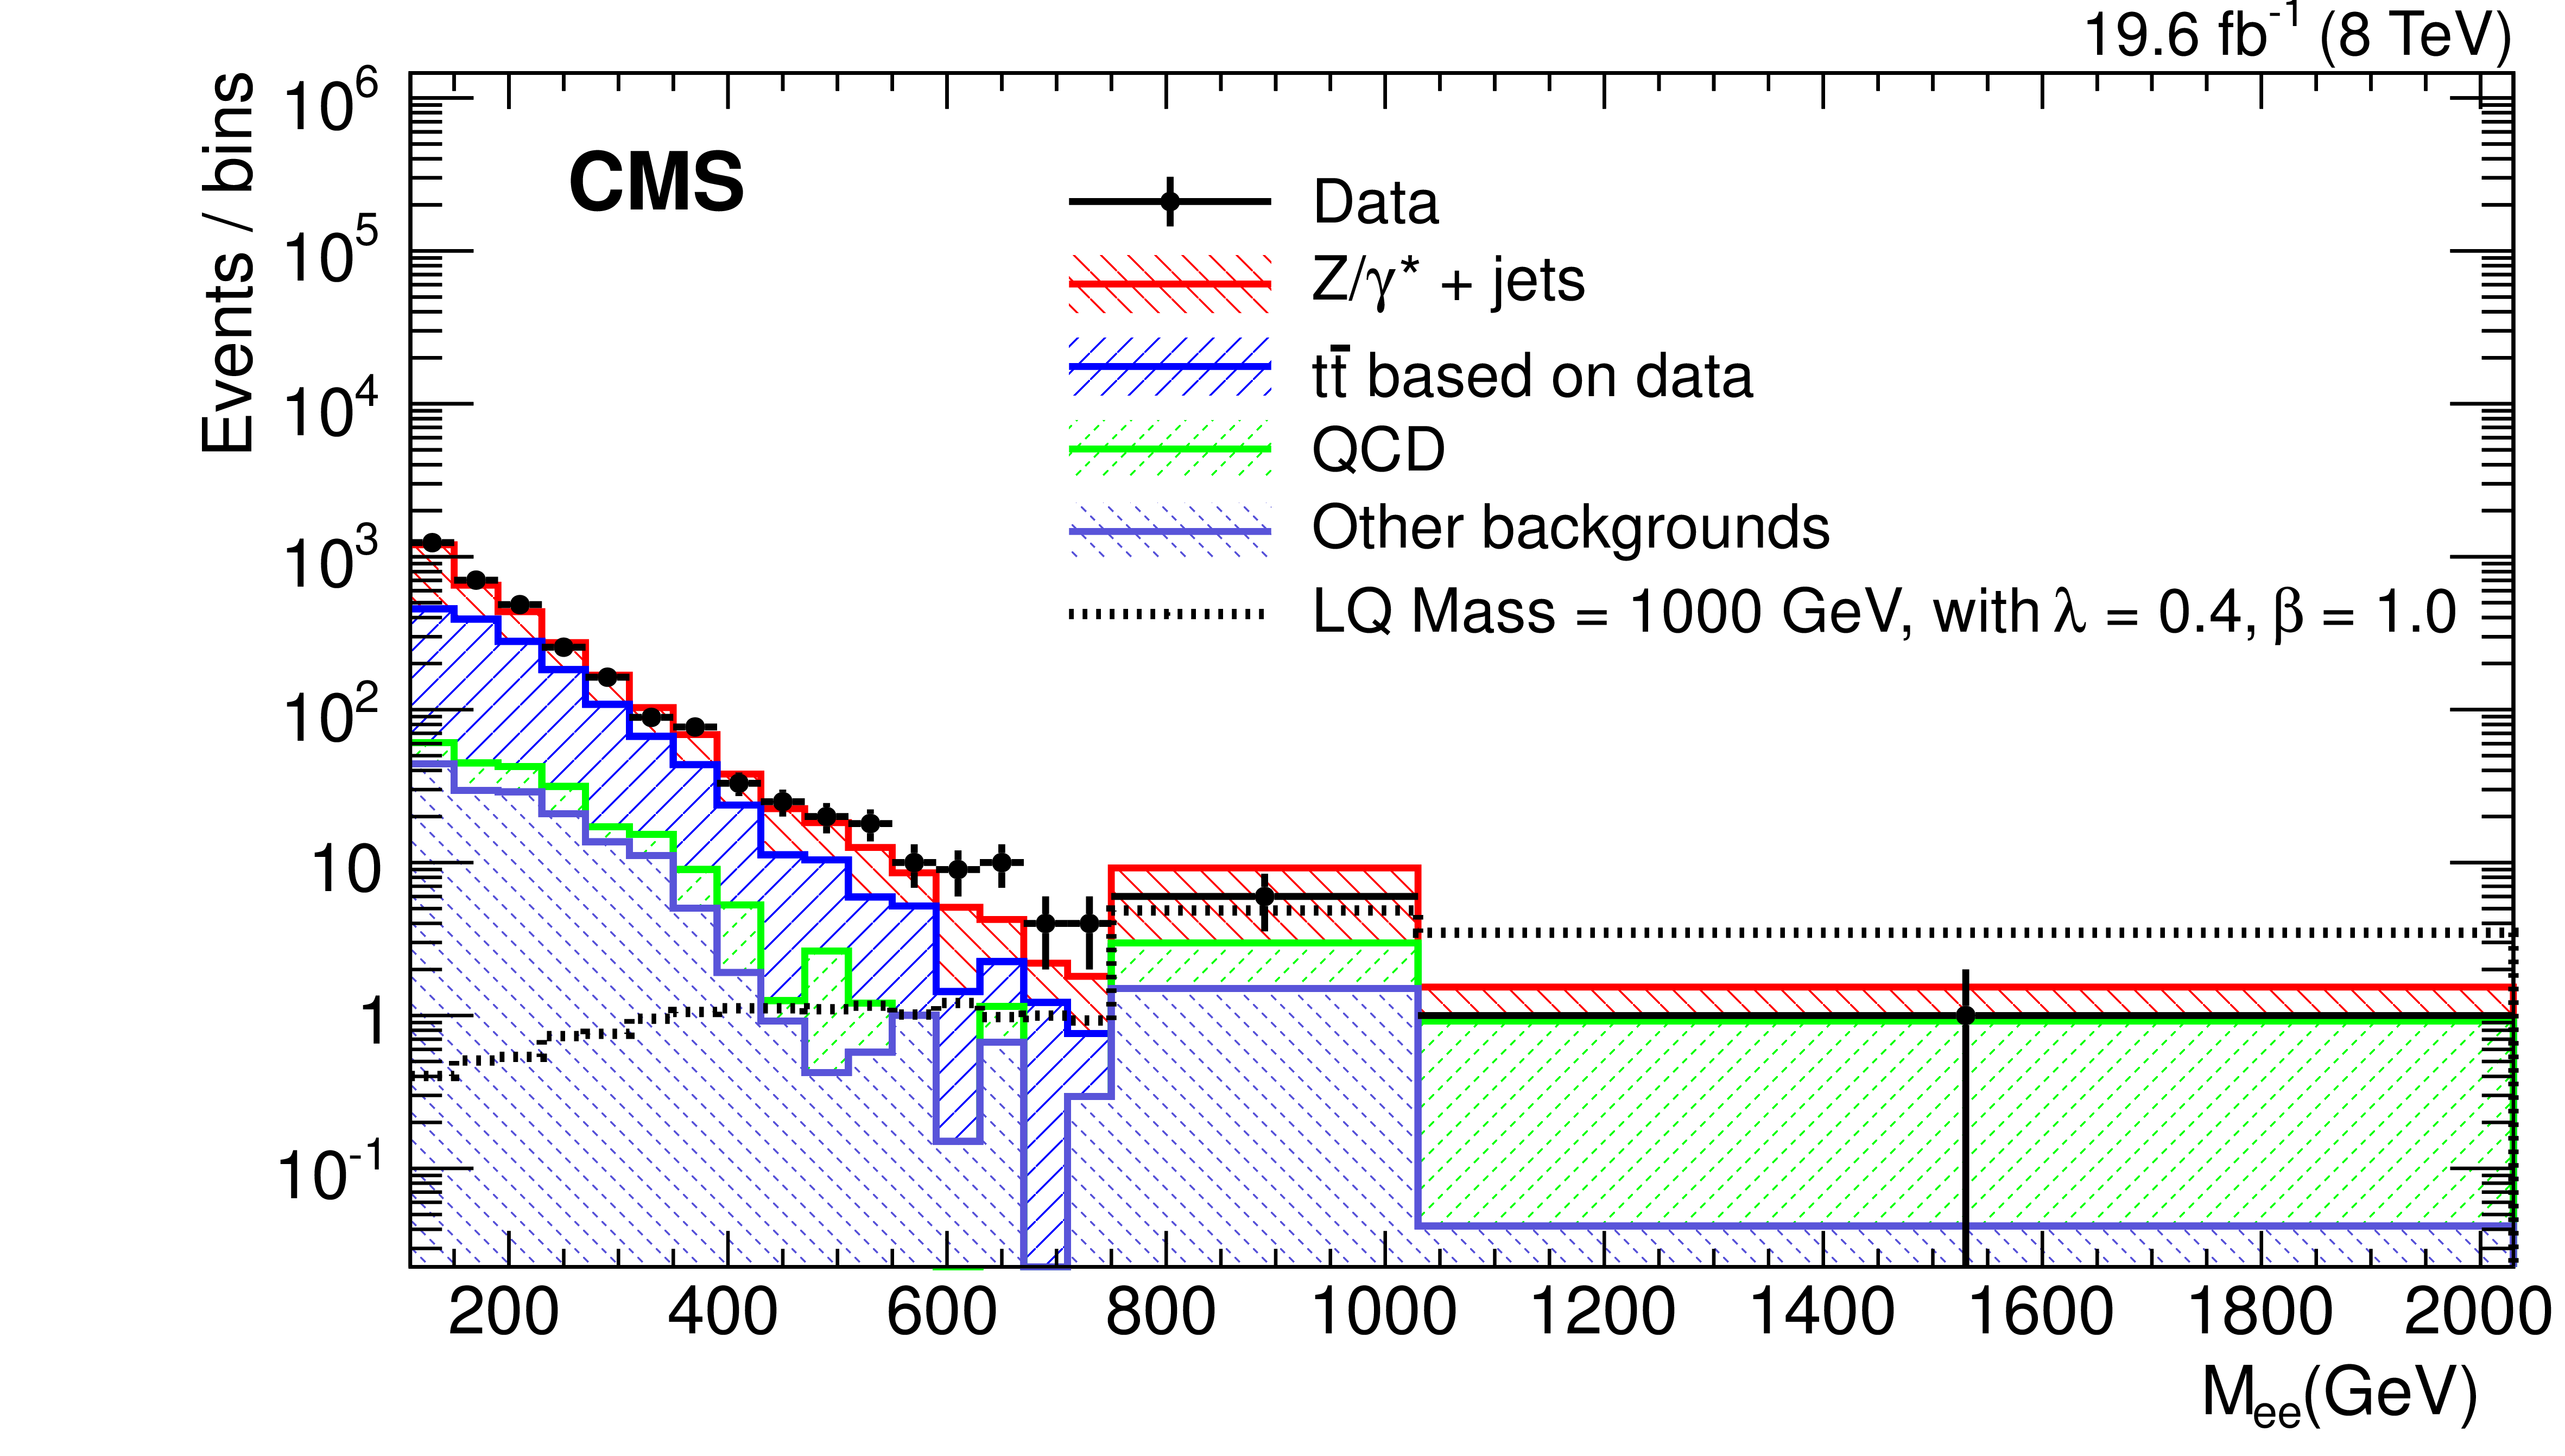
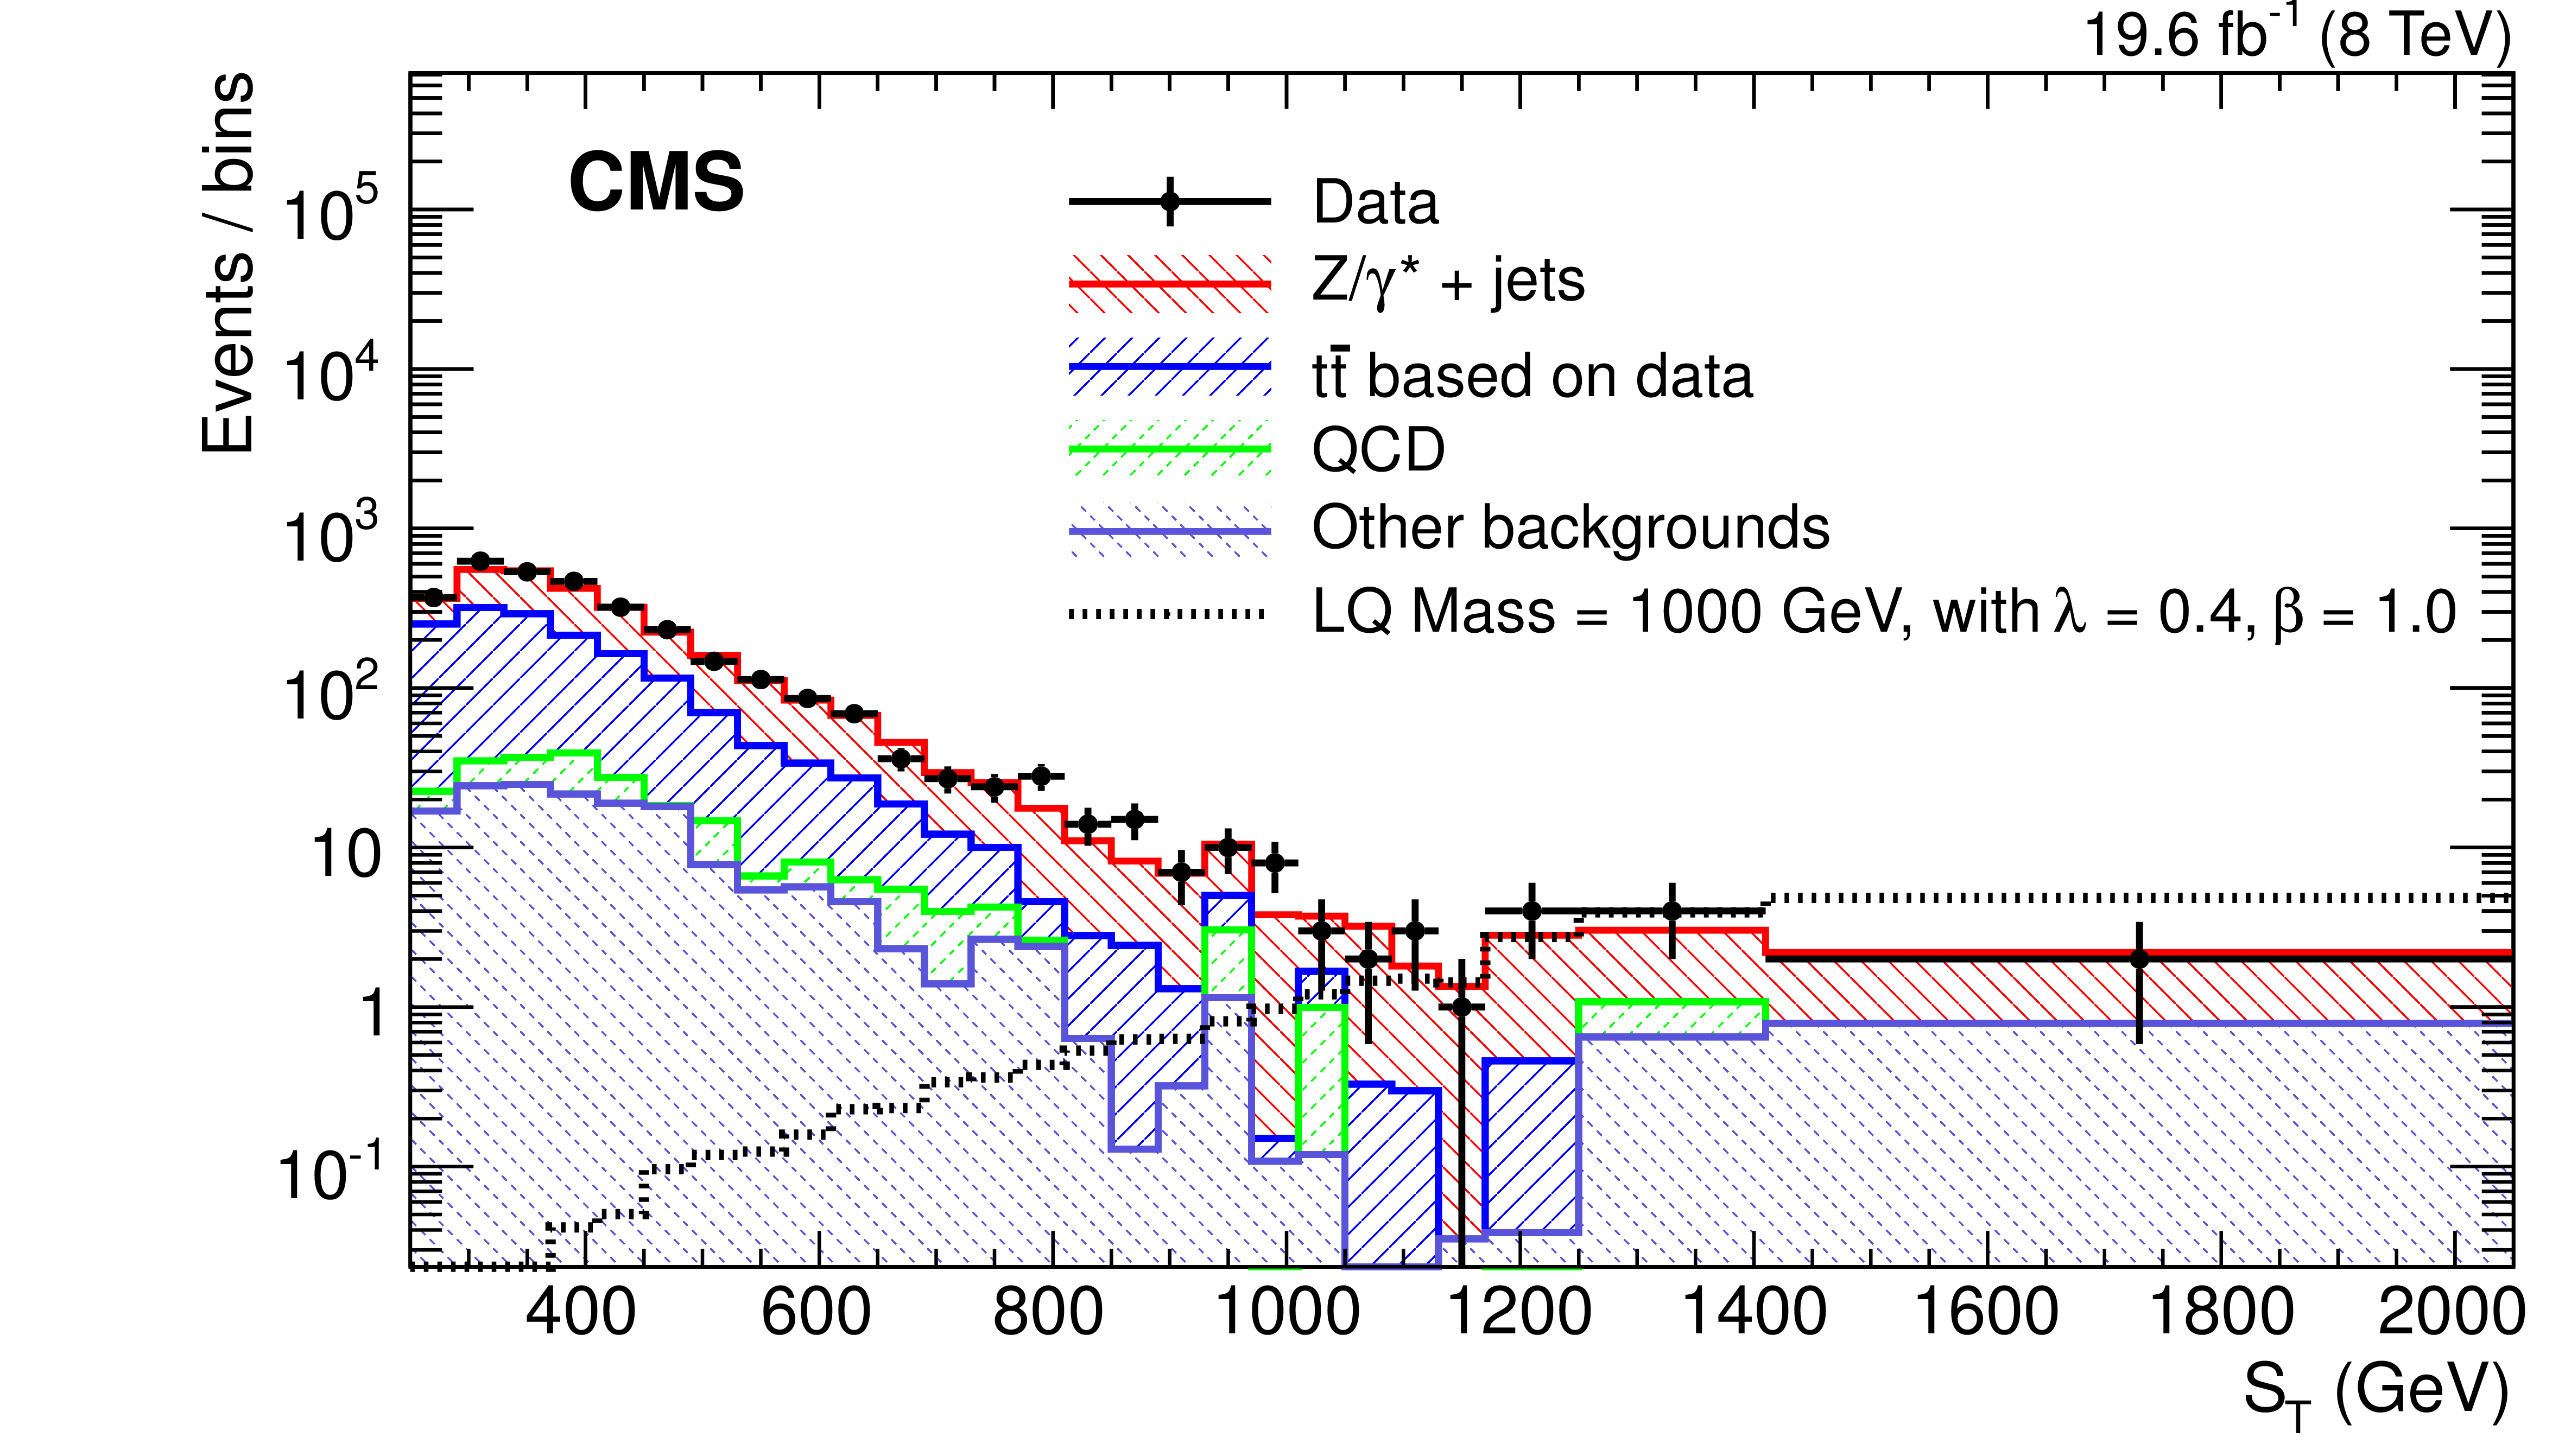
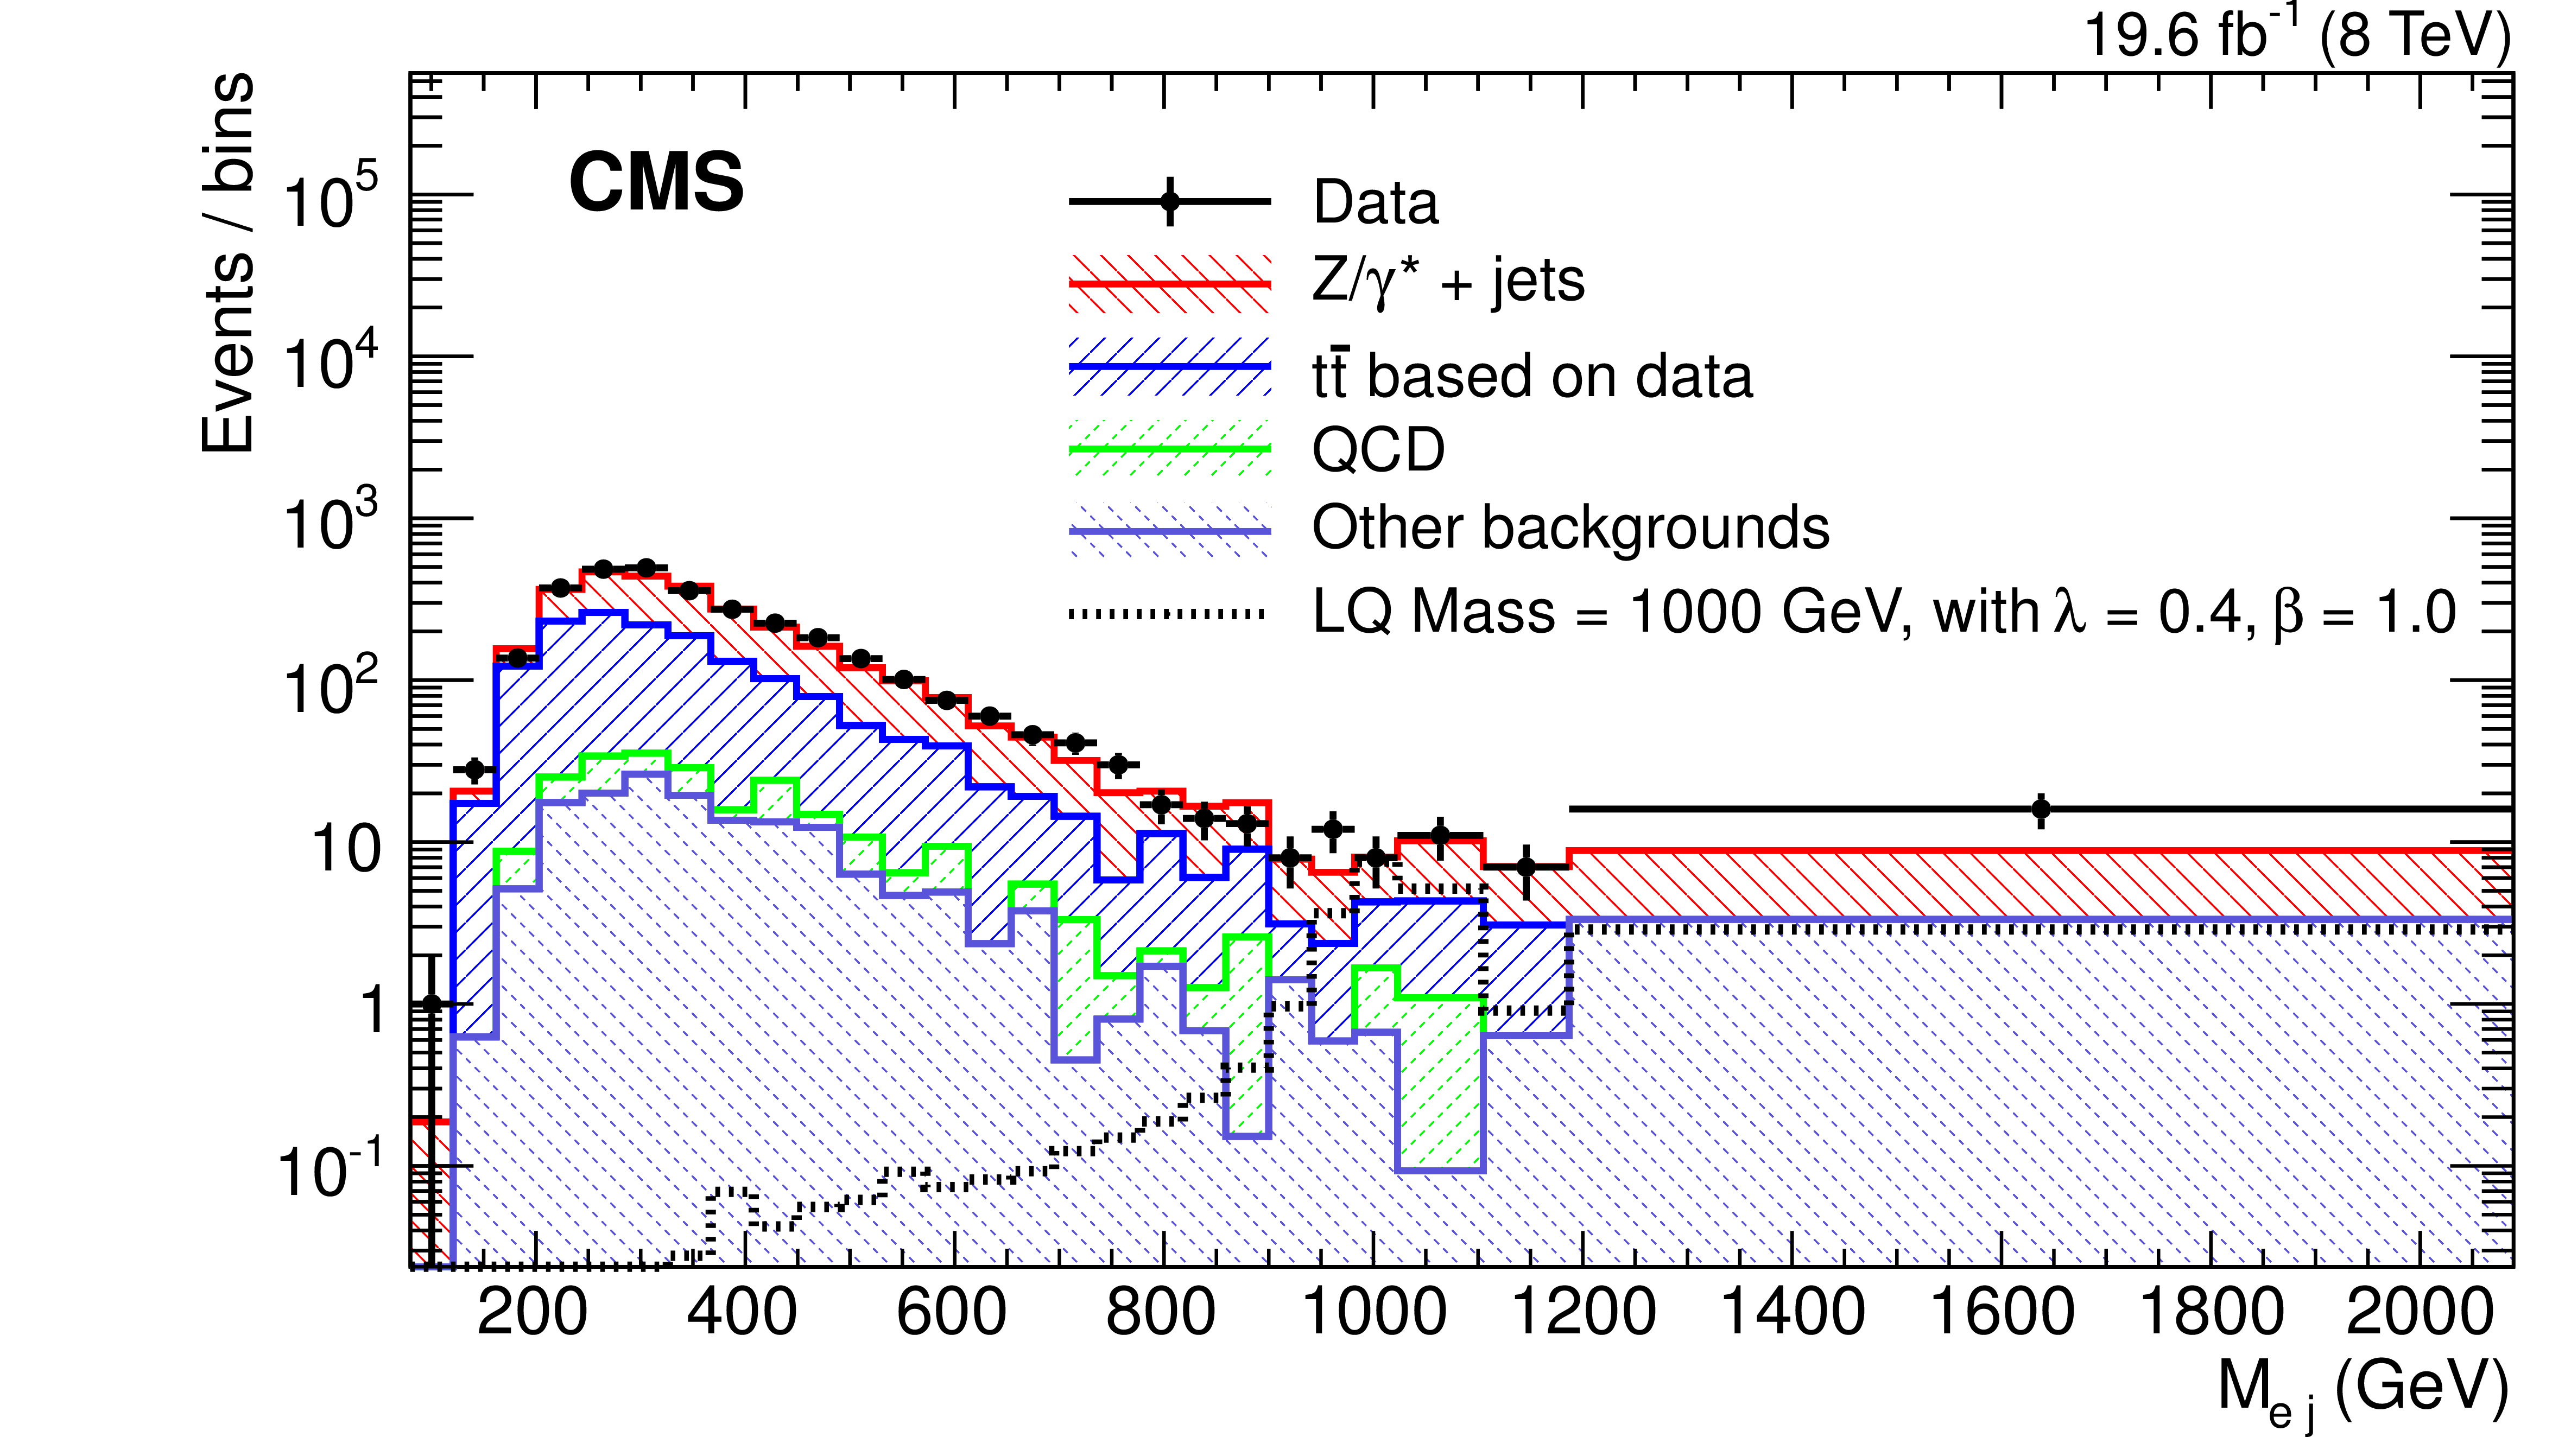
Distributions of $M_{ {\mathrm {e}} {\mathrm {e}}}$ (a), $ {S_{\mathrm {T}}} $ (b), and $M_{ {\mathrm {e}}j}$ (c) at preselection in the $ {\mathrm {e}} {\mathrm {e}}j$ channel. ``Other backgrounds'' include diboson, W+jets, and single top quark contributions. The points represent the data and the stacked histograms show the expected background contributions. The open histogram shows the prediction for an LQ signal for $M_{\text {LQ}} =$ 1000 GeV and $\lambda =$ 0.4. The horizontal error bars on the data points represent the bin width. The last bin includes overflow. |
png pdf |
Figure 4-b:
Distributions of $M_{ {\mathrm {e}} {\mathrm {e}}}$ (a), $ {S_{\mathrm {T}}} $ (b), and $M_{ {\mathrm {e}}j}$ (c) at preselection in the $ {\mathrm {e}} {\mathrm {e}}j$ channel. ``Other backgrounds'' include diboson, W+jets, and single top quark contributions. The points represent the data and the stacked histograms show the expected background contributions. The open histogram shows the prediction for an LQ signal for $M_{\text {LQ}} =$ 1000 GeV and $\lambda =$ 0.4. The horizontal error bars on the data points represent the bin width. The last bin includes overflow. |
png pdf |
Figure 4-c:
Distributions of $M_{ {\mathrm {e}} {\mathrm {e}}}$ (a), $ {S_{\mathrm {T}}} $ (b), and $M_{ {\mathrm {e}}j}$ (c) at preselection in the $ {\mathrm {e}} {\mathrm {e}}j$ channel. ``Other backgrounds'' include diboson, W+jets, and single top quark contributions. The points represent the data and the stacked histograms show the expected background contributions. The open histogram shows the prediction for an LQ signal for $M_{\text {LQ}} =$ 1000 GeV and $\lambda =$ 0.4. The horizontal error bars on the data points represent the bin width. The last bin includes overflow. |
png pdf |
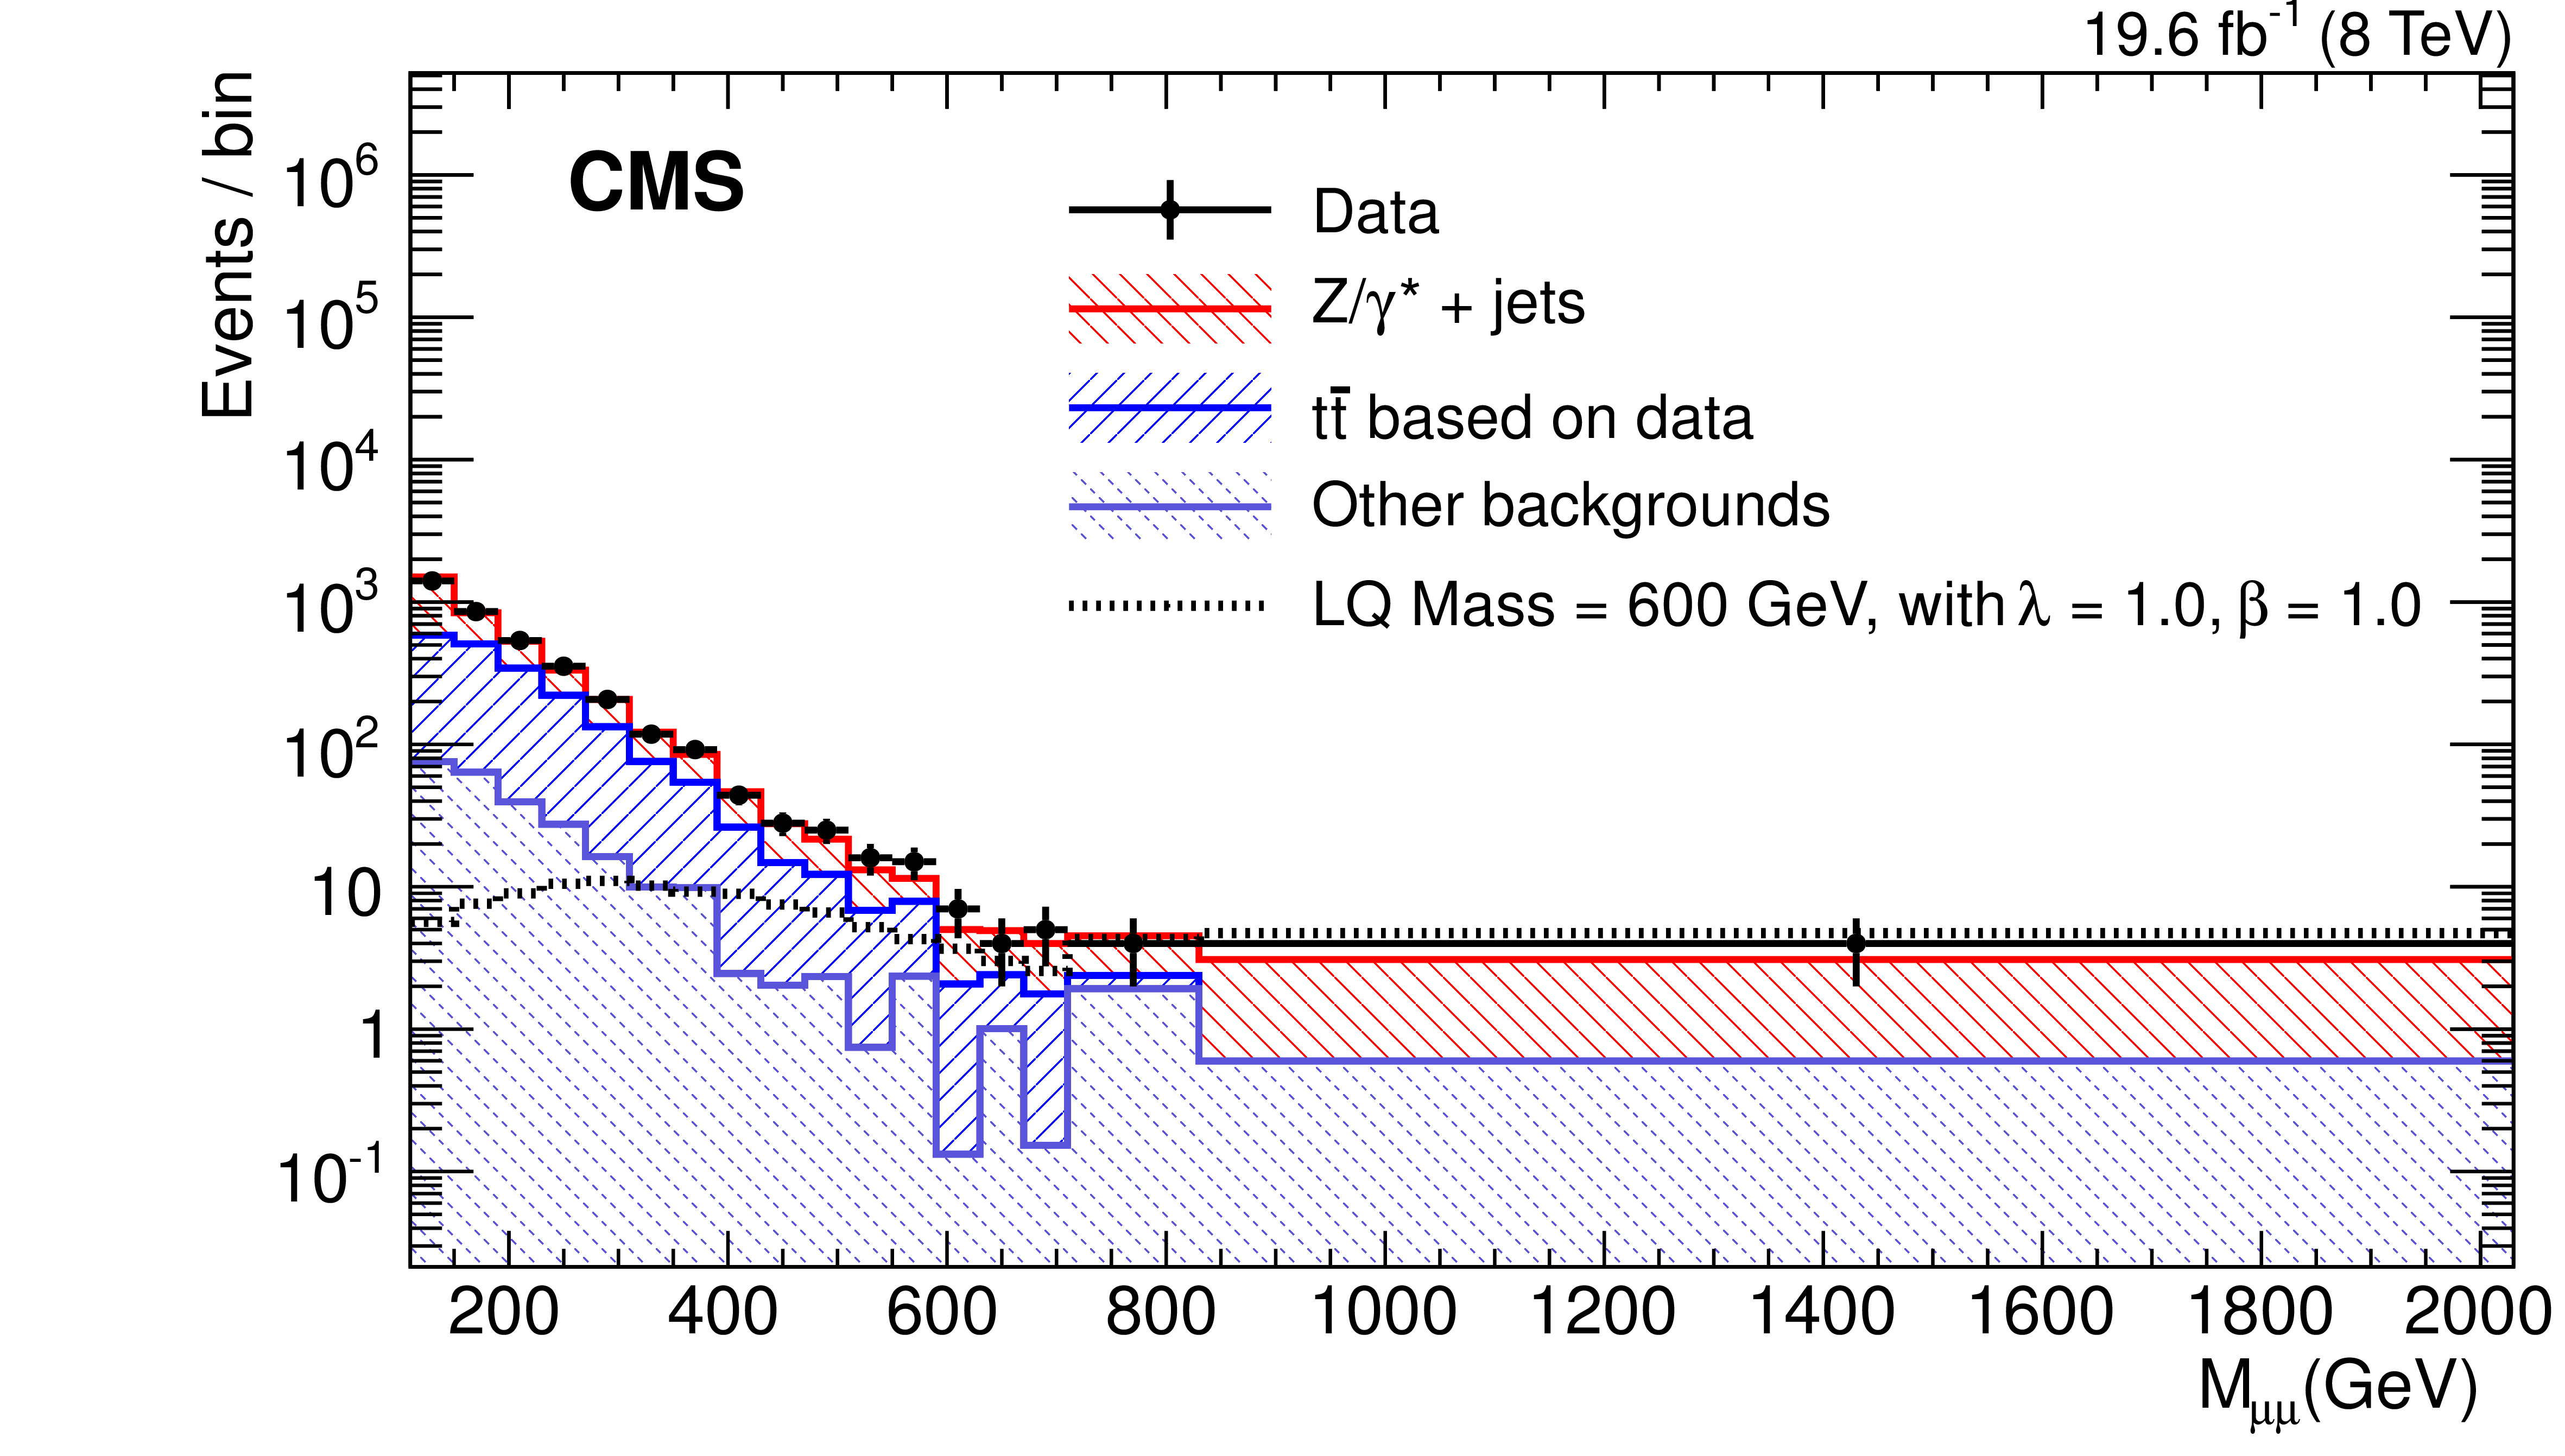
Figure 5-a:
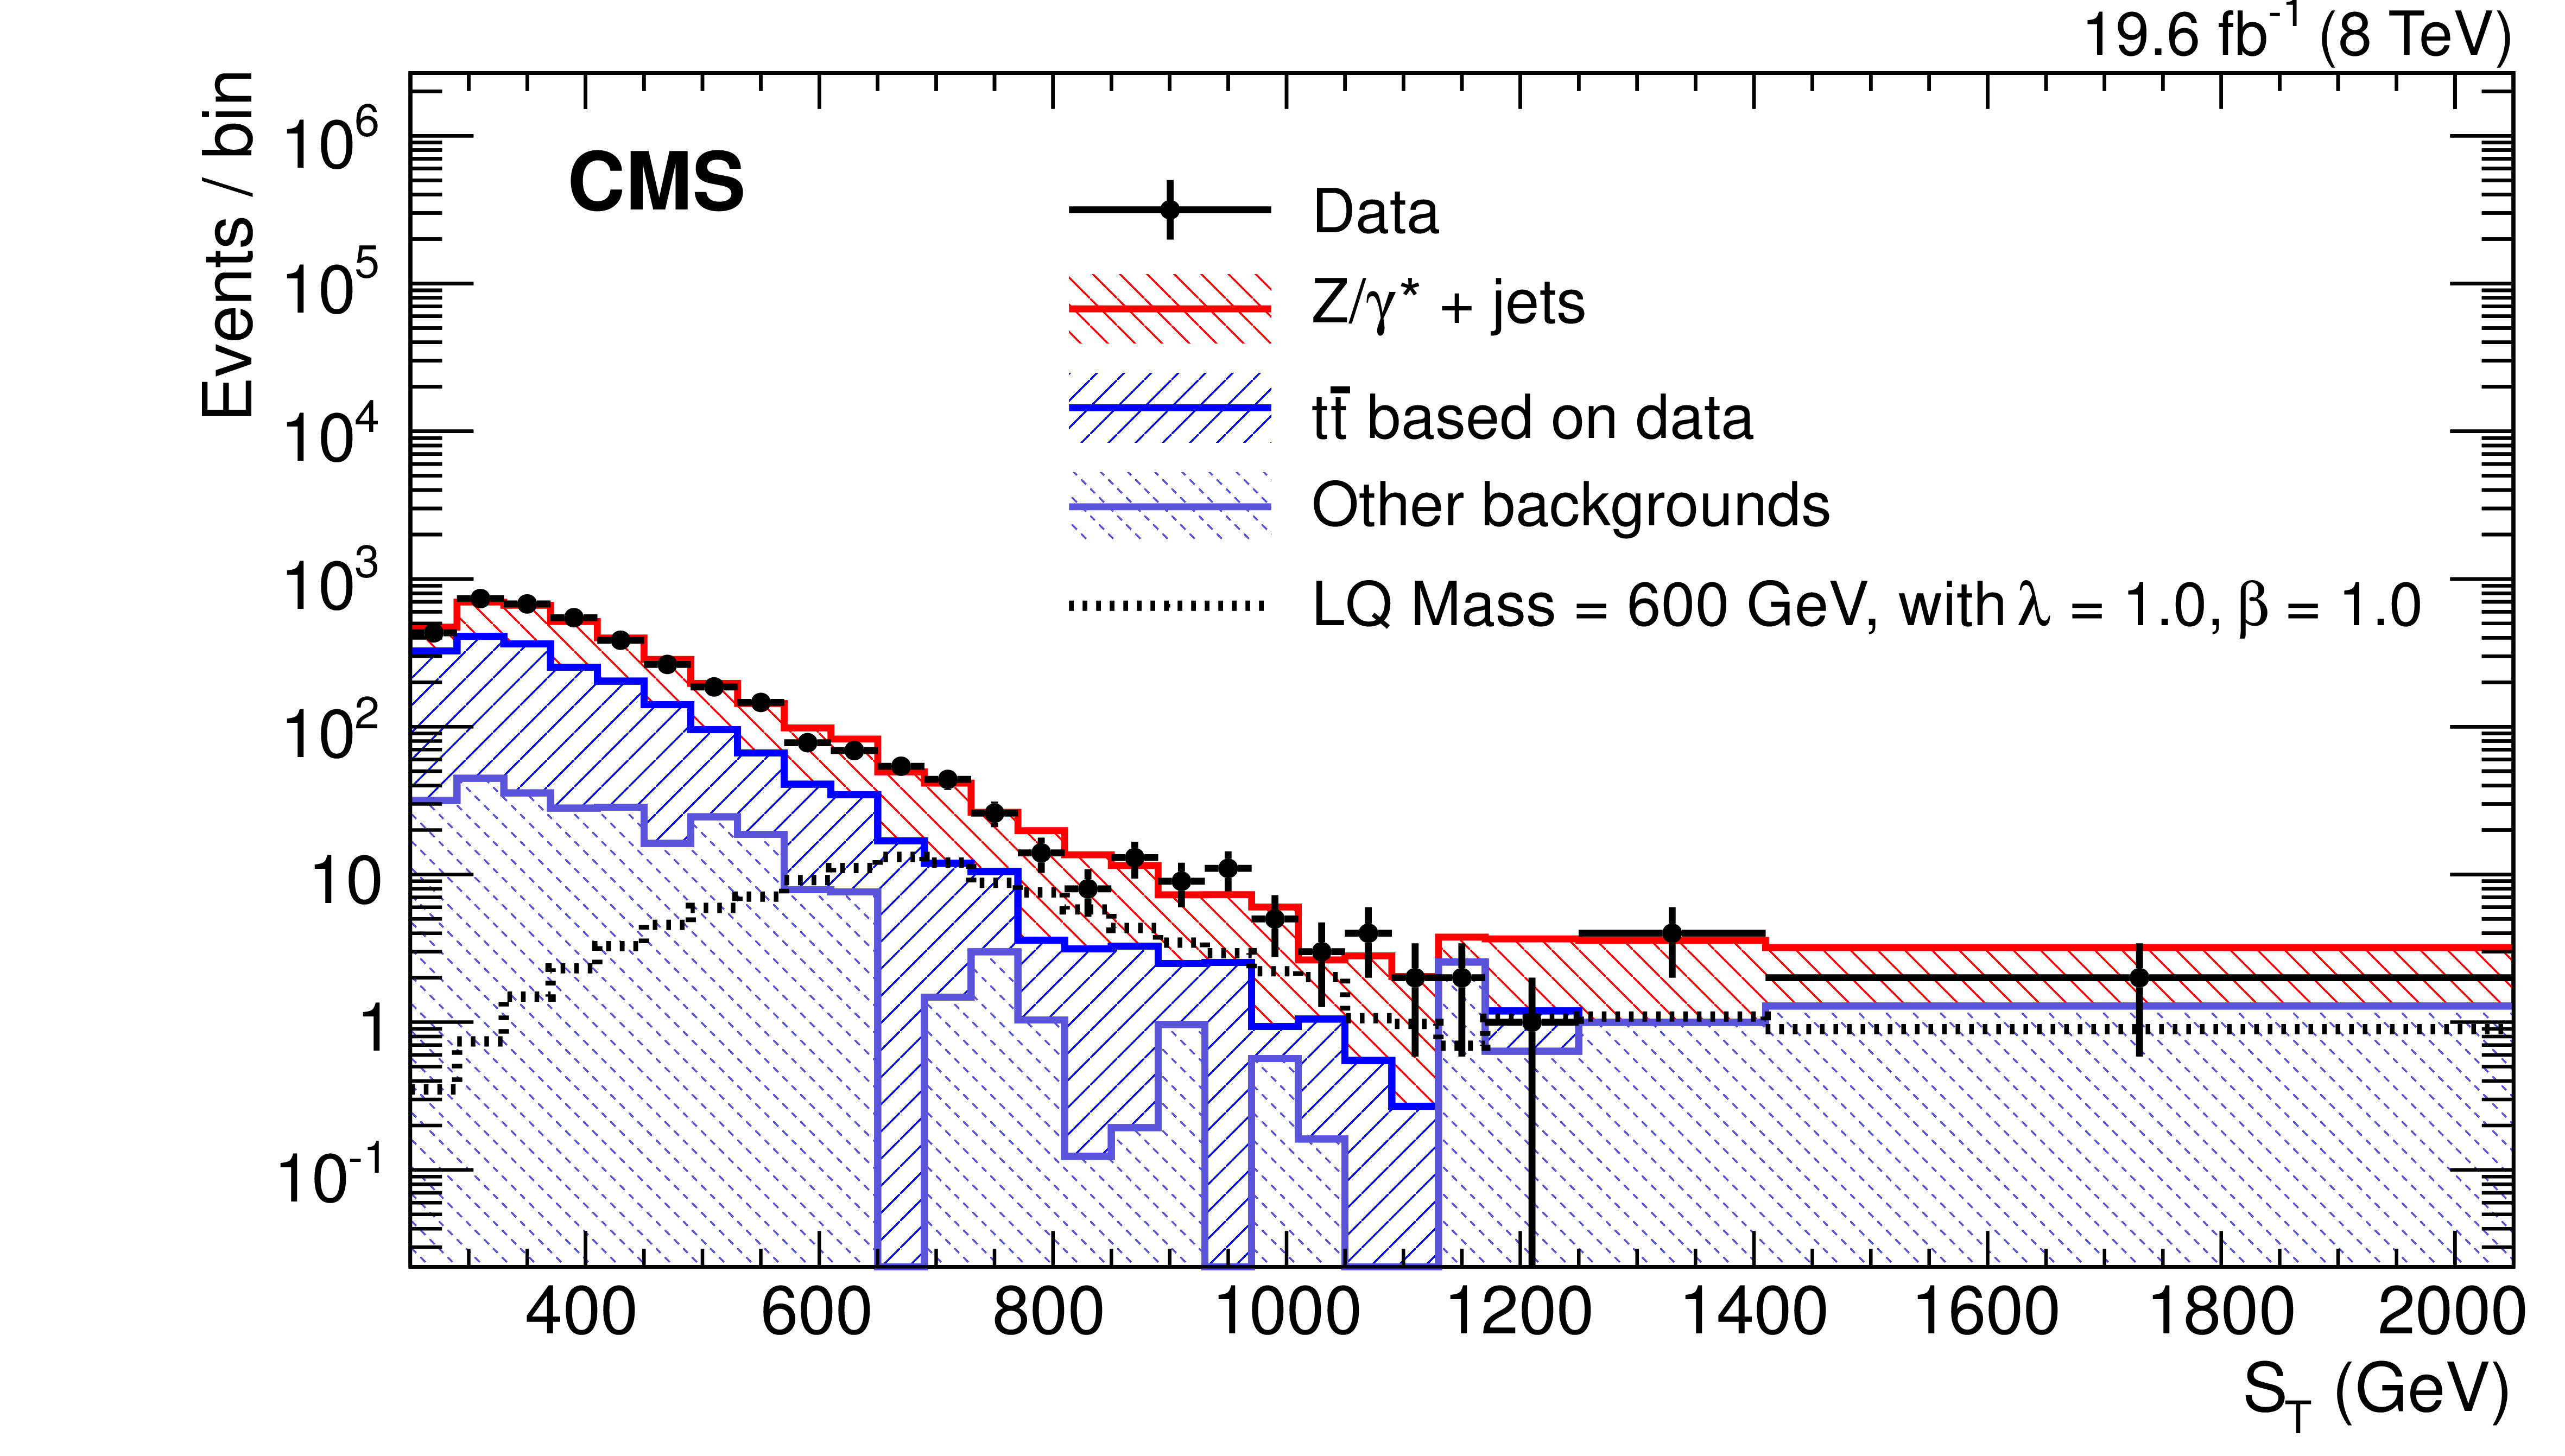
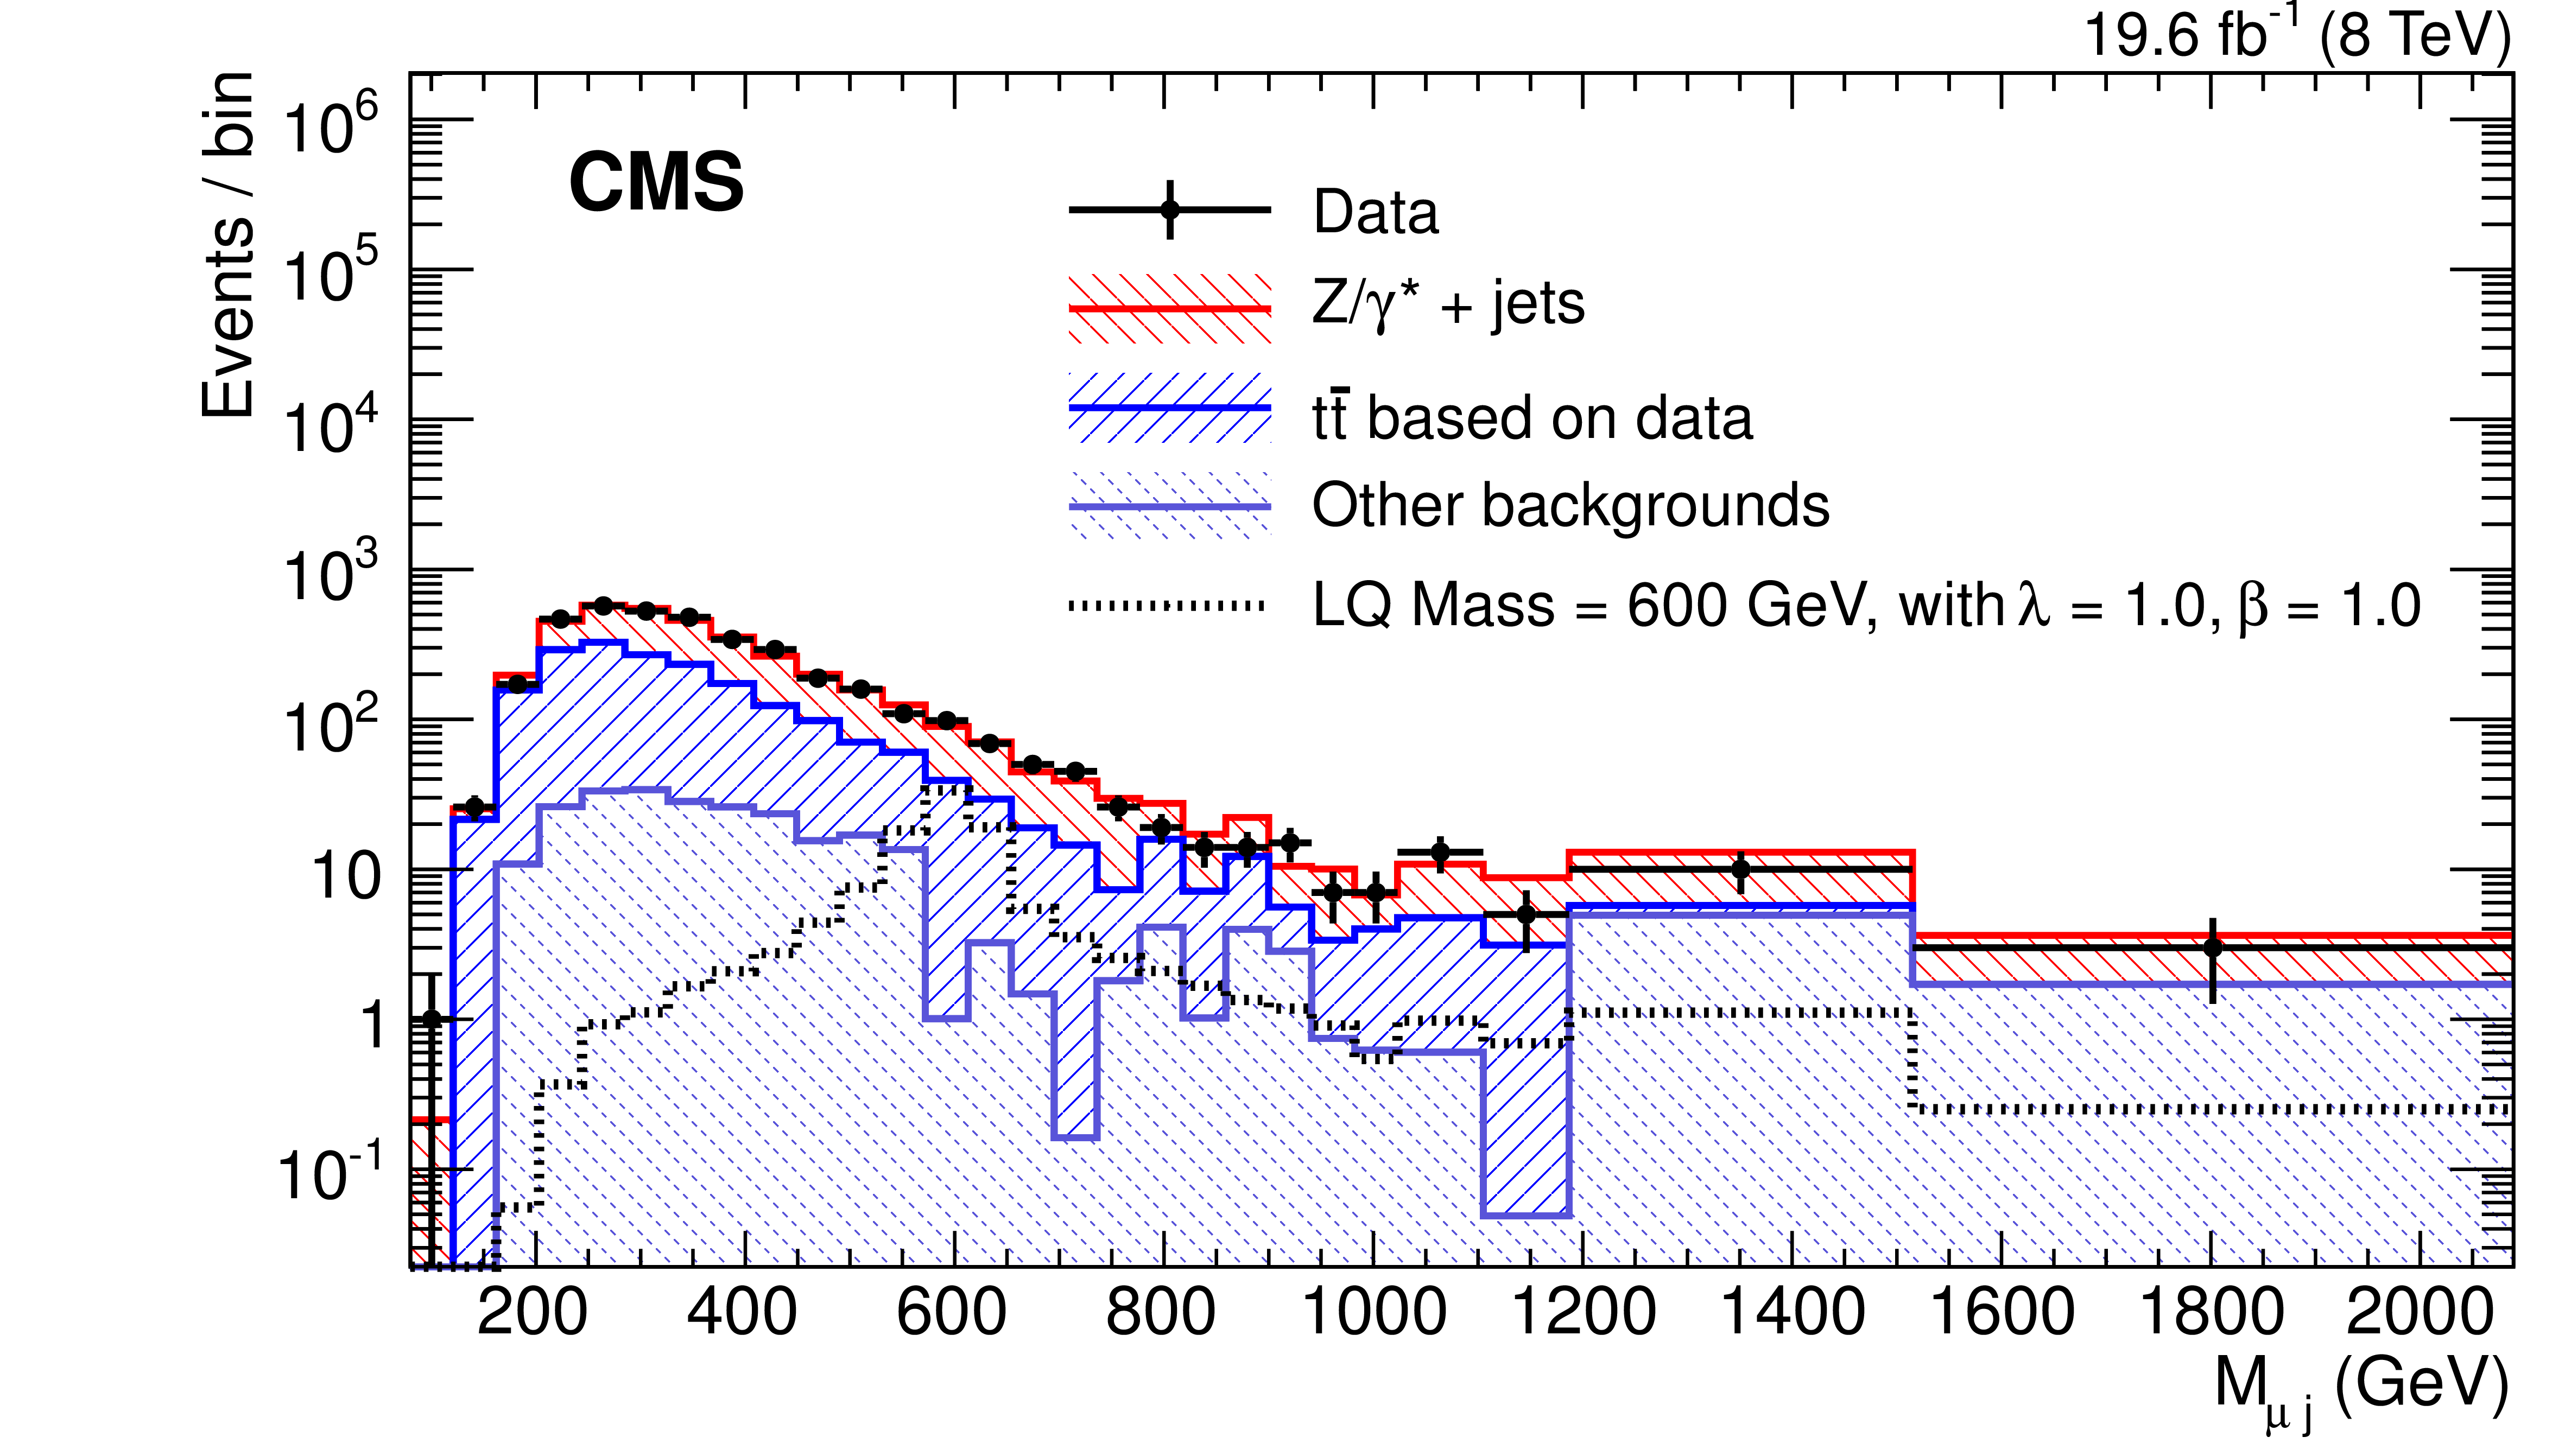
Distributions of $M_{ {{\mu }} {{\mu }}}$ (a), $ {S_{\mathrm {T}}} $ (b), and $M_{ {{\mu }}j}$ (c) at preselection in the $ {{\mu }} {{\mu }}j$ channel. ``Other backgrounds'' include diboson, W+jets, single top quark, and QCD multijet contributions. The points represent the data and the stacked histograms show the expected background contributions. The open histogram shows the prediction for an LQ signal for $M_{\text {LQ}} =$ 500 GeV and $\lambda =$ 1.0. The horizontal error bars on the data points represent the bin width. The last bin includes overflow. |
png pdf |
Figure 5-b:
Distributions of $M_{ {{\mu }} {{\mu }}}$ (a), $ {S_{\mathrm {T}}} $ (b), and $M_{ {{\mu }}j}$ (c) at preselection in the $ {{\mu }} {{\mu }}j$ channel. ``Other backgrounds'' include diboson, W+jets, single top quark, and QCD multijet contributions. The points represent the data and the stacked histograms show the expected background contributions. The open histogram shows the prediction for an LQ signal for $M_{\text {LQ}} =$ 500 GeV and $\lambda =$ 1.0. The horizontal error bars on the data points represent the bin width. The last bin includes overflow. |
png pdf |
Figure 5-c:
Distributions of $M_{ {{\mu }} {{\mu }}}$ (a), $ {S_{\mathrm {T}}} $ (b), and $M_{ {{\mu }}j}$ (c) at preselection in the $ {{\mu }} {{\mu }}j$ channel. ``Other backgrounds'' include diboson, W+jets, single top quark, and QCD multijet contributions. The points represent the data and the stacked histograms show the expected background contributions. The open histogram shows the prediction for an LQ signal for $M_{\text {LQ}} =$ 500 GeV and $\lambda =$ 1.0. The horizontal error bars on the data points represent the bin width. The last bin includes overflow. |
png pdf |
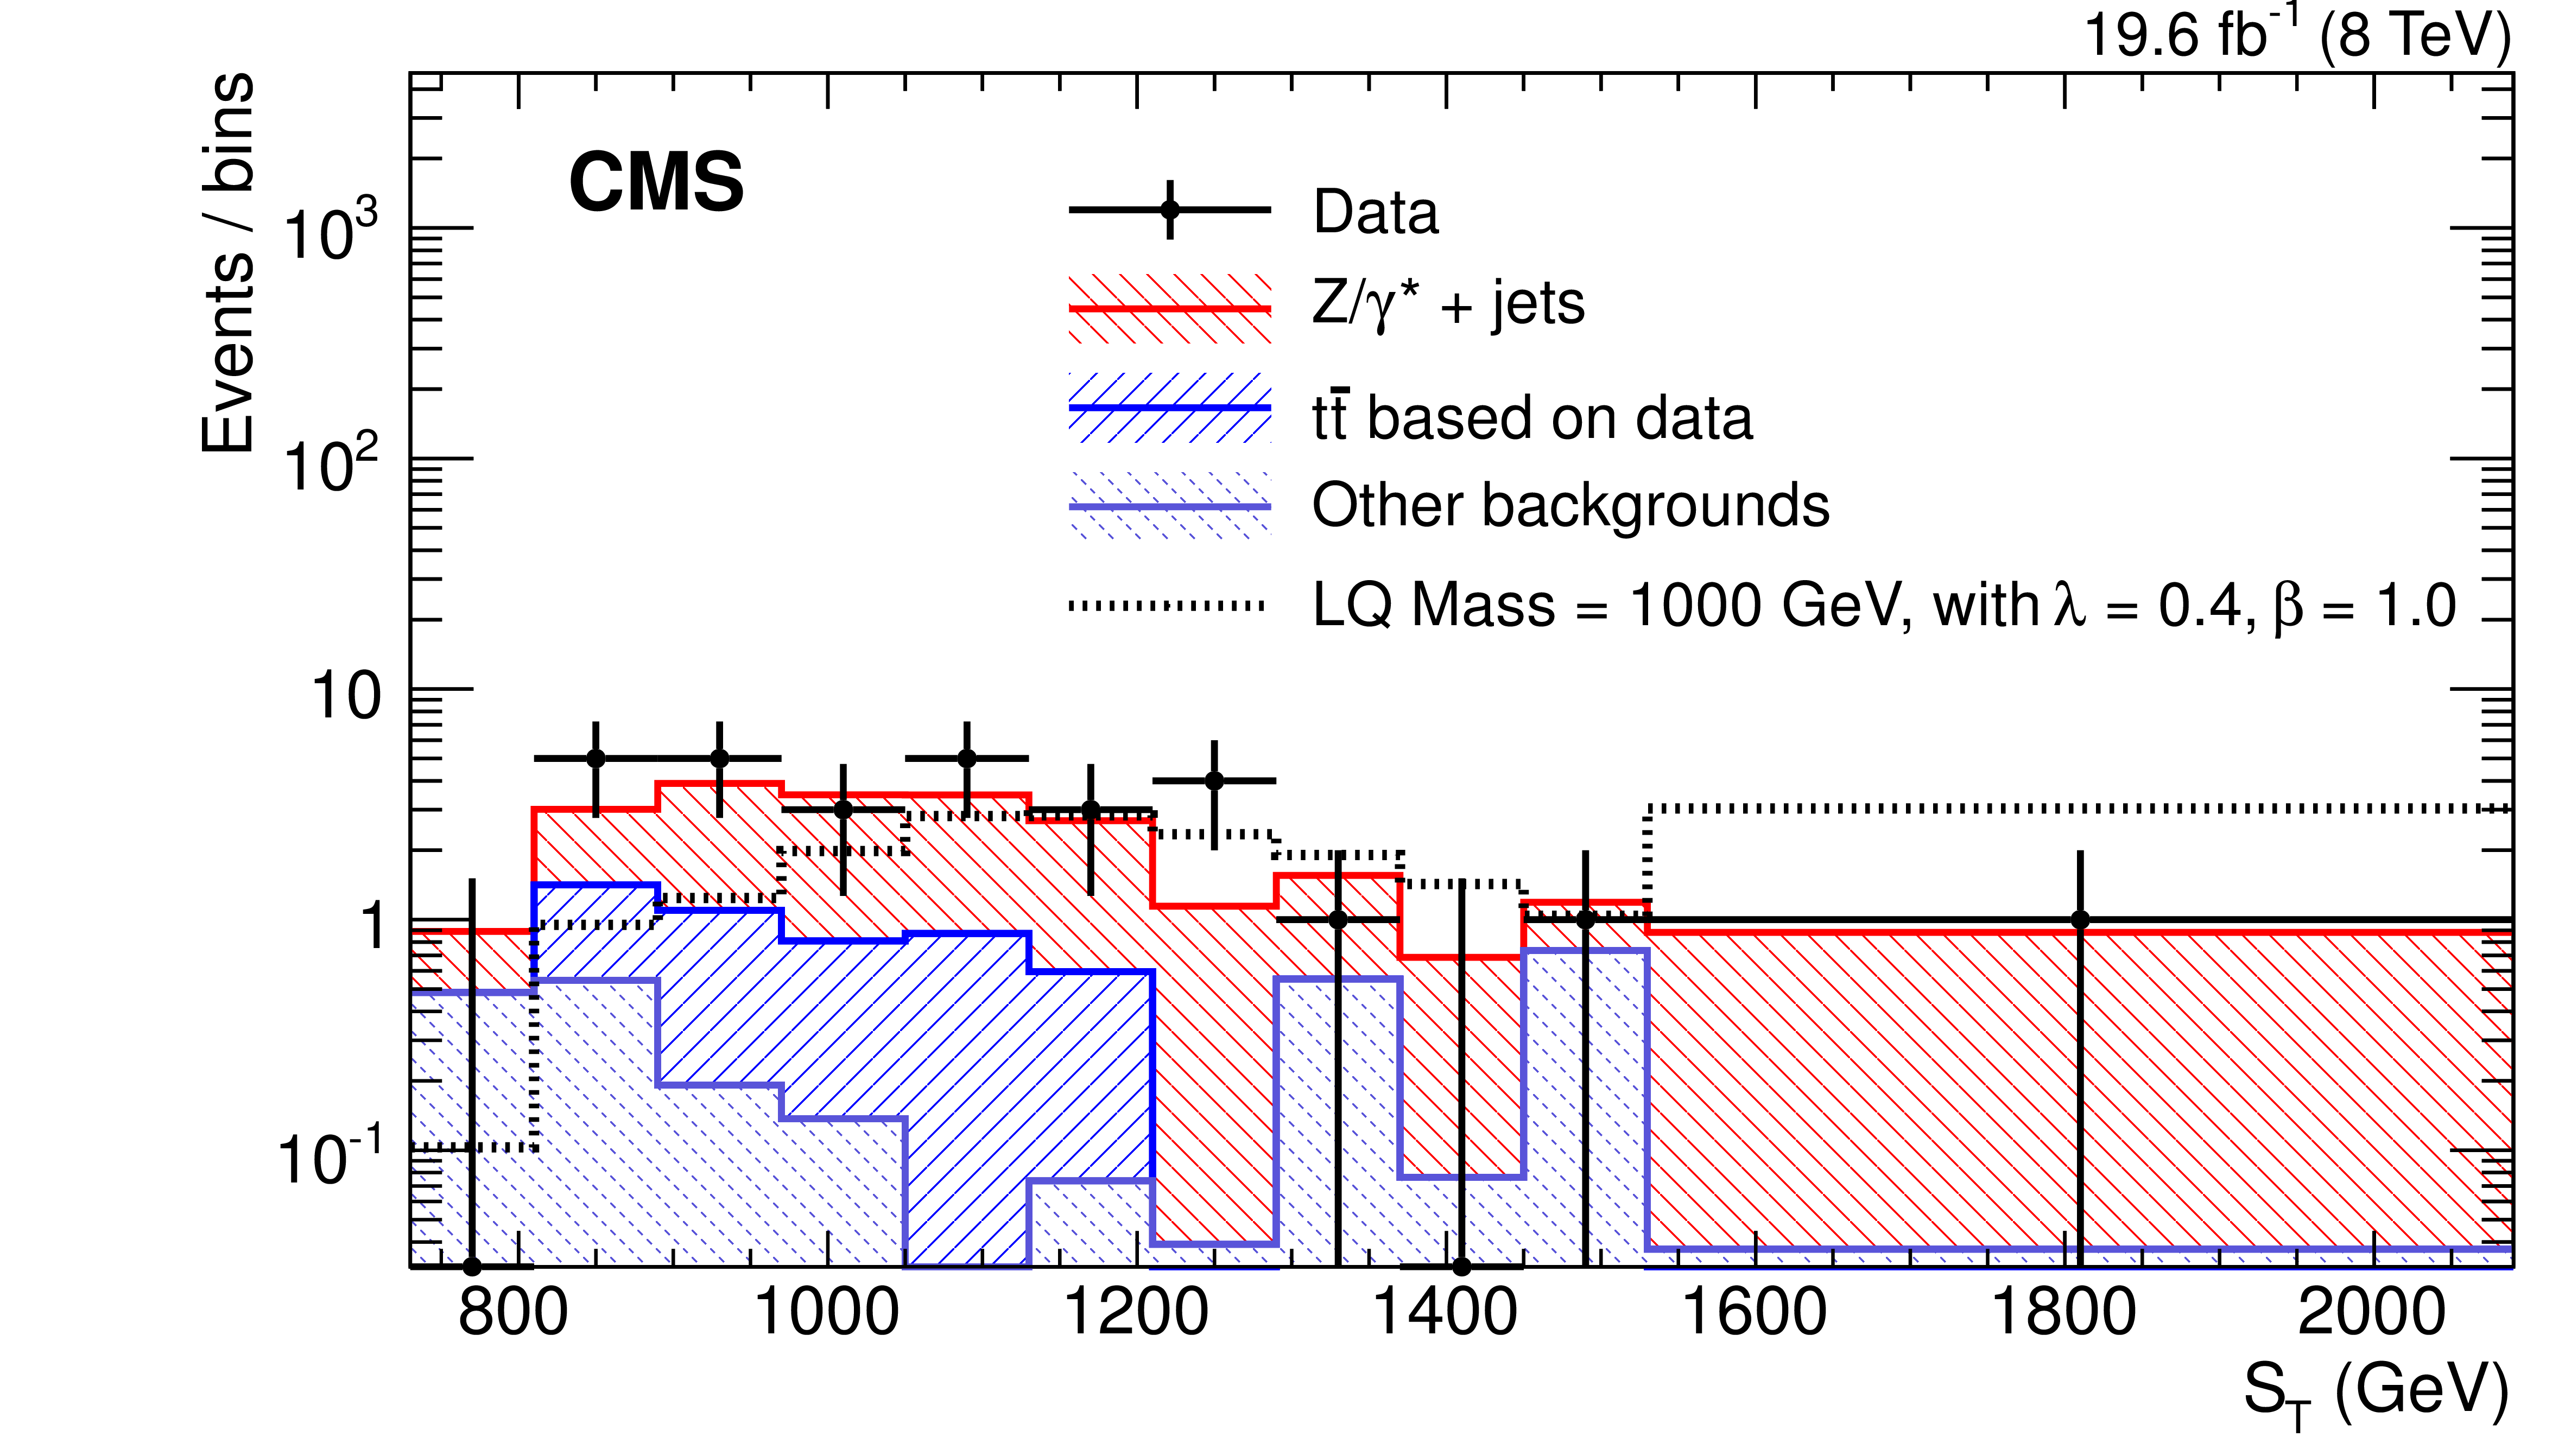
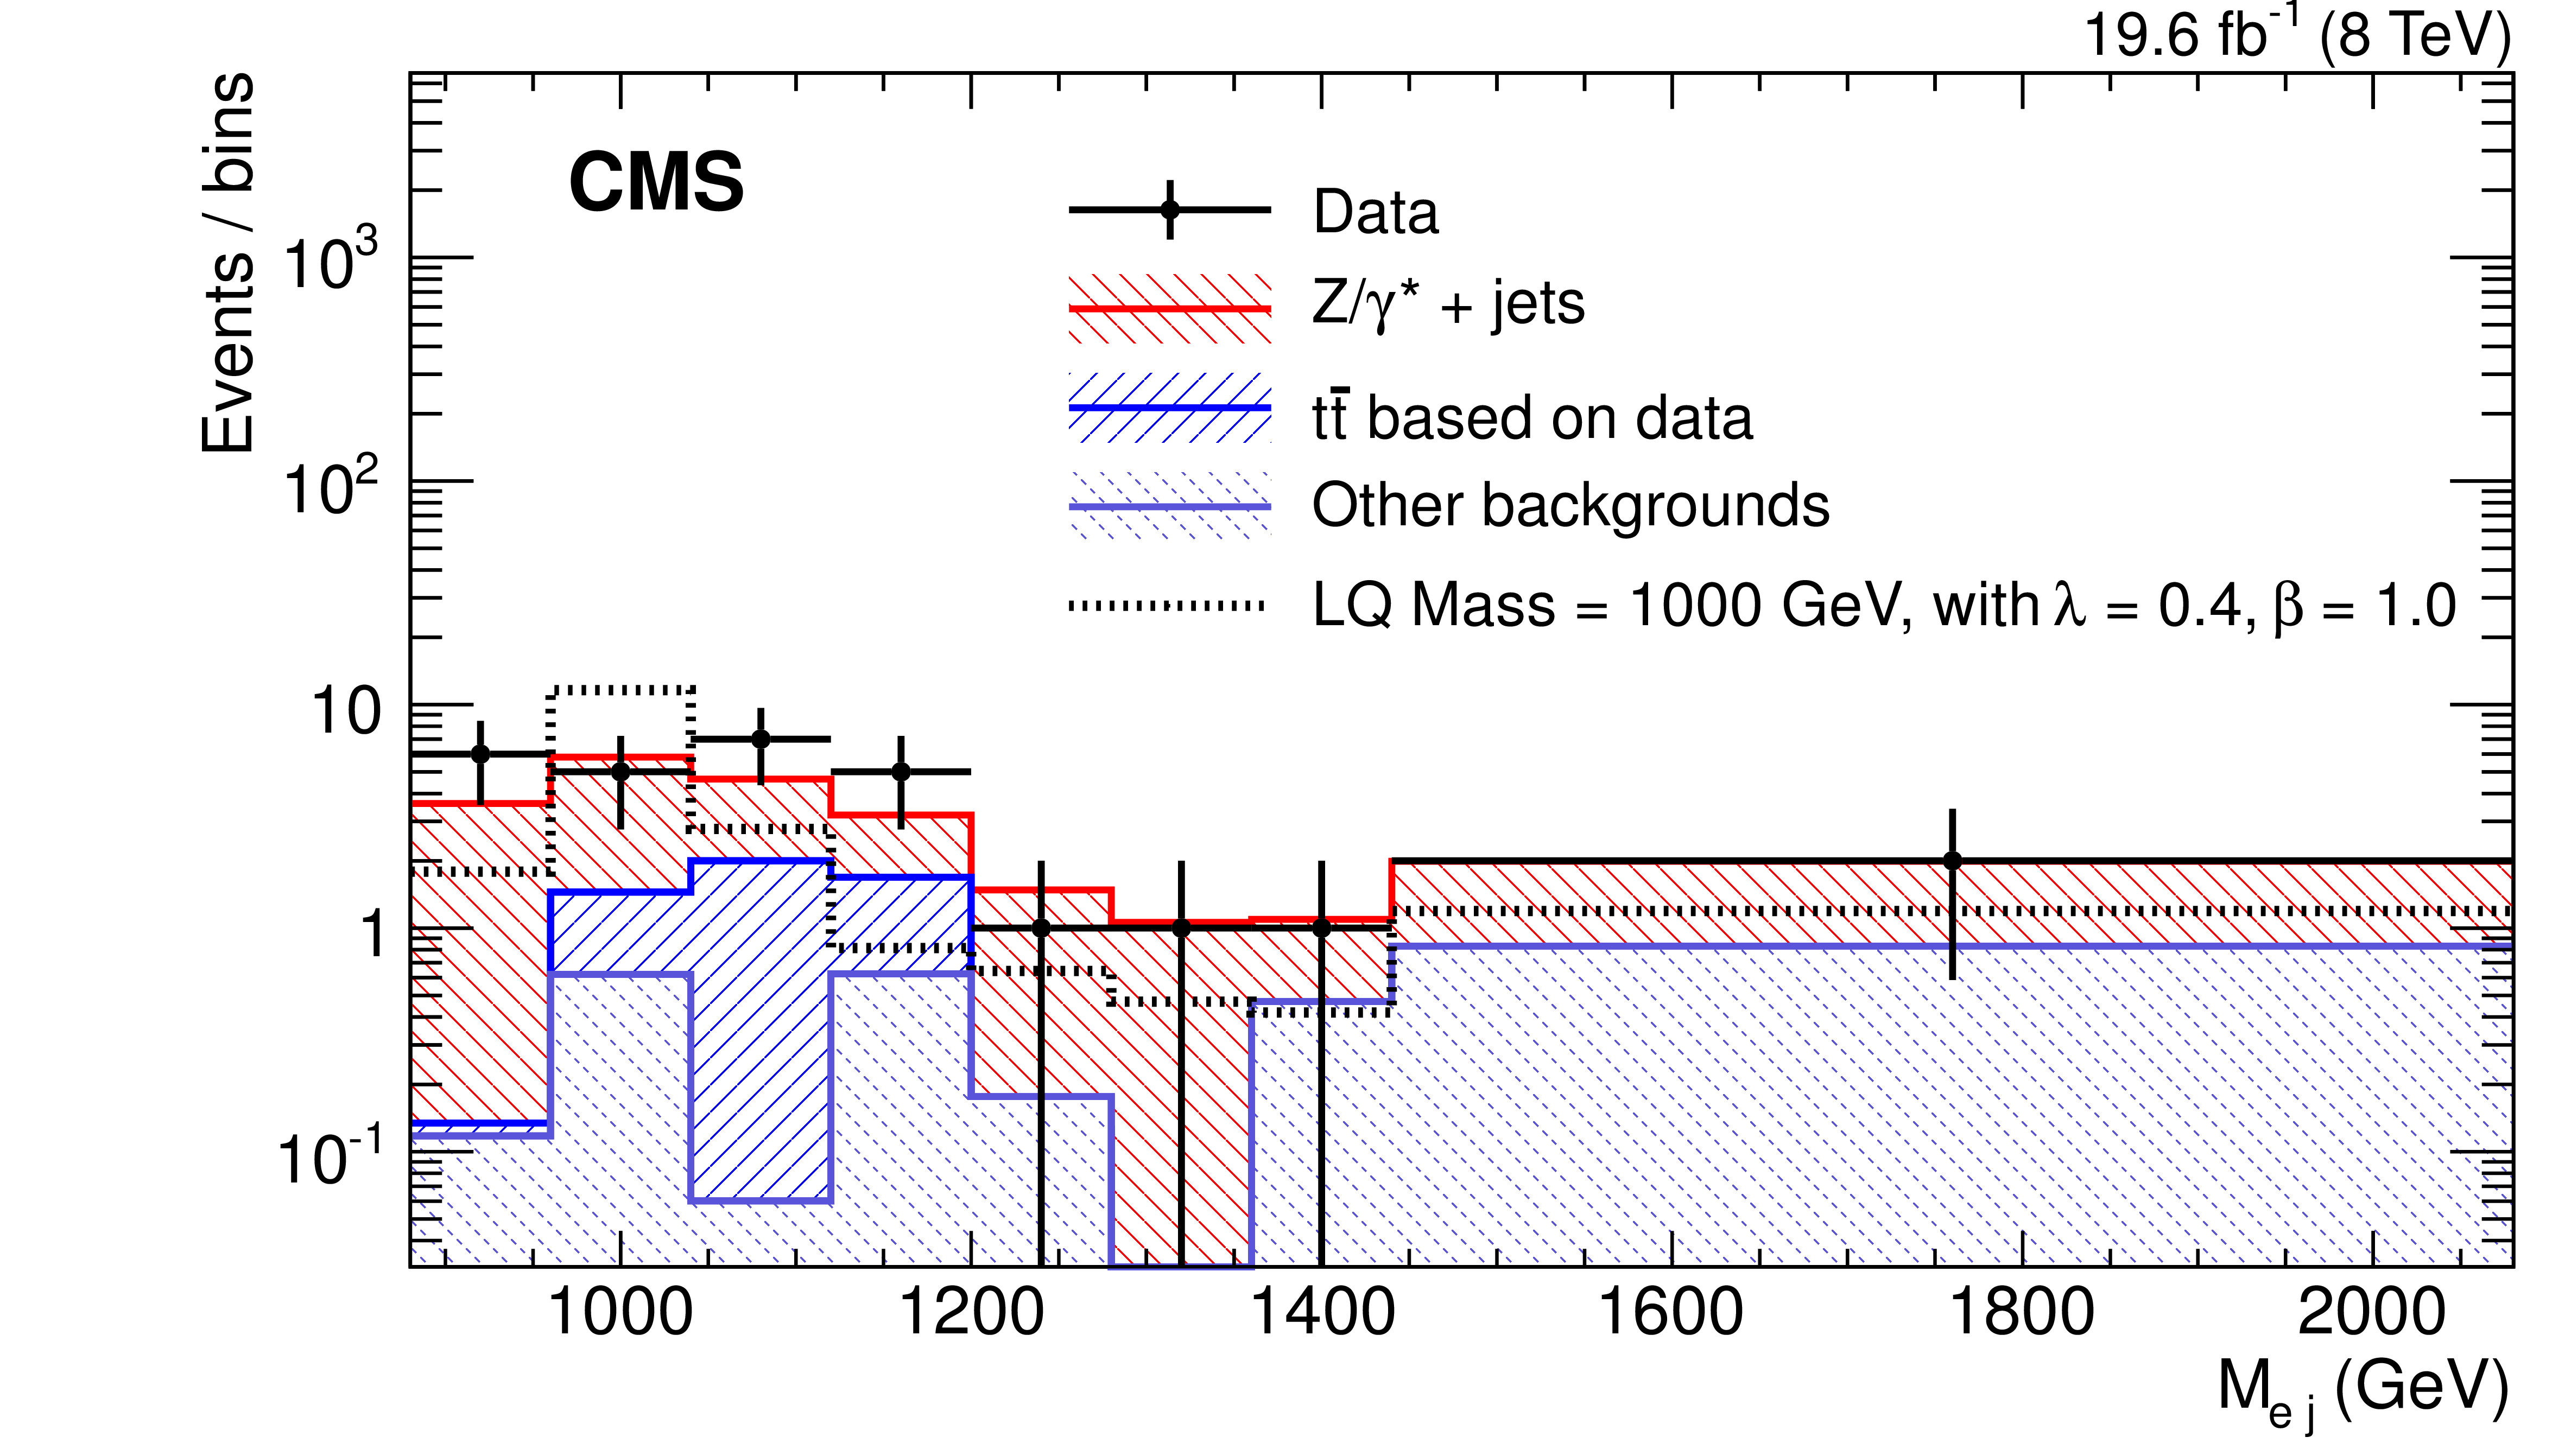
Figure 6-a:
Distributions of $ {S_{\mathrm {T}}} $ and $M_{ {\mathrm {e}}j}$ at final selection, in the $ {\mathrm {e}} {\mathrm {e}}j$ channel . The points represent the data and the stacked histograms show the expected background contributions. The open histogram shows the prediction for an LQ signal for $M_{\text {LQ}}=$ 1000 GeV and $\lambda =$ 0.4. The horizontal error bars on the data points represent the bin width. The last bin includes overflow. |
png pdf |
Figure 6-b:
Distributions of $ {S_{\mathrm {T}}} $ and $M_{ {\mathrm {e}}j}$ at final selection, in the $ {\mathrm {e}} {\mathrm {e}}j$ channel . The points represent the data and the stacked histograms show the expected background contributions. The open histogram shows the prediction for an LQ signal for $M_{\text {LQ}}=$ 1000 GeV and $\lambda =$ 0.4. The horizontal error bars on the data points represent the bin width. The last bin includes overflow. |
png pdf |
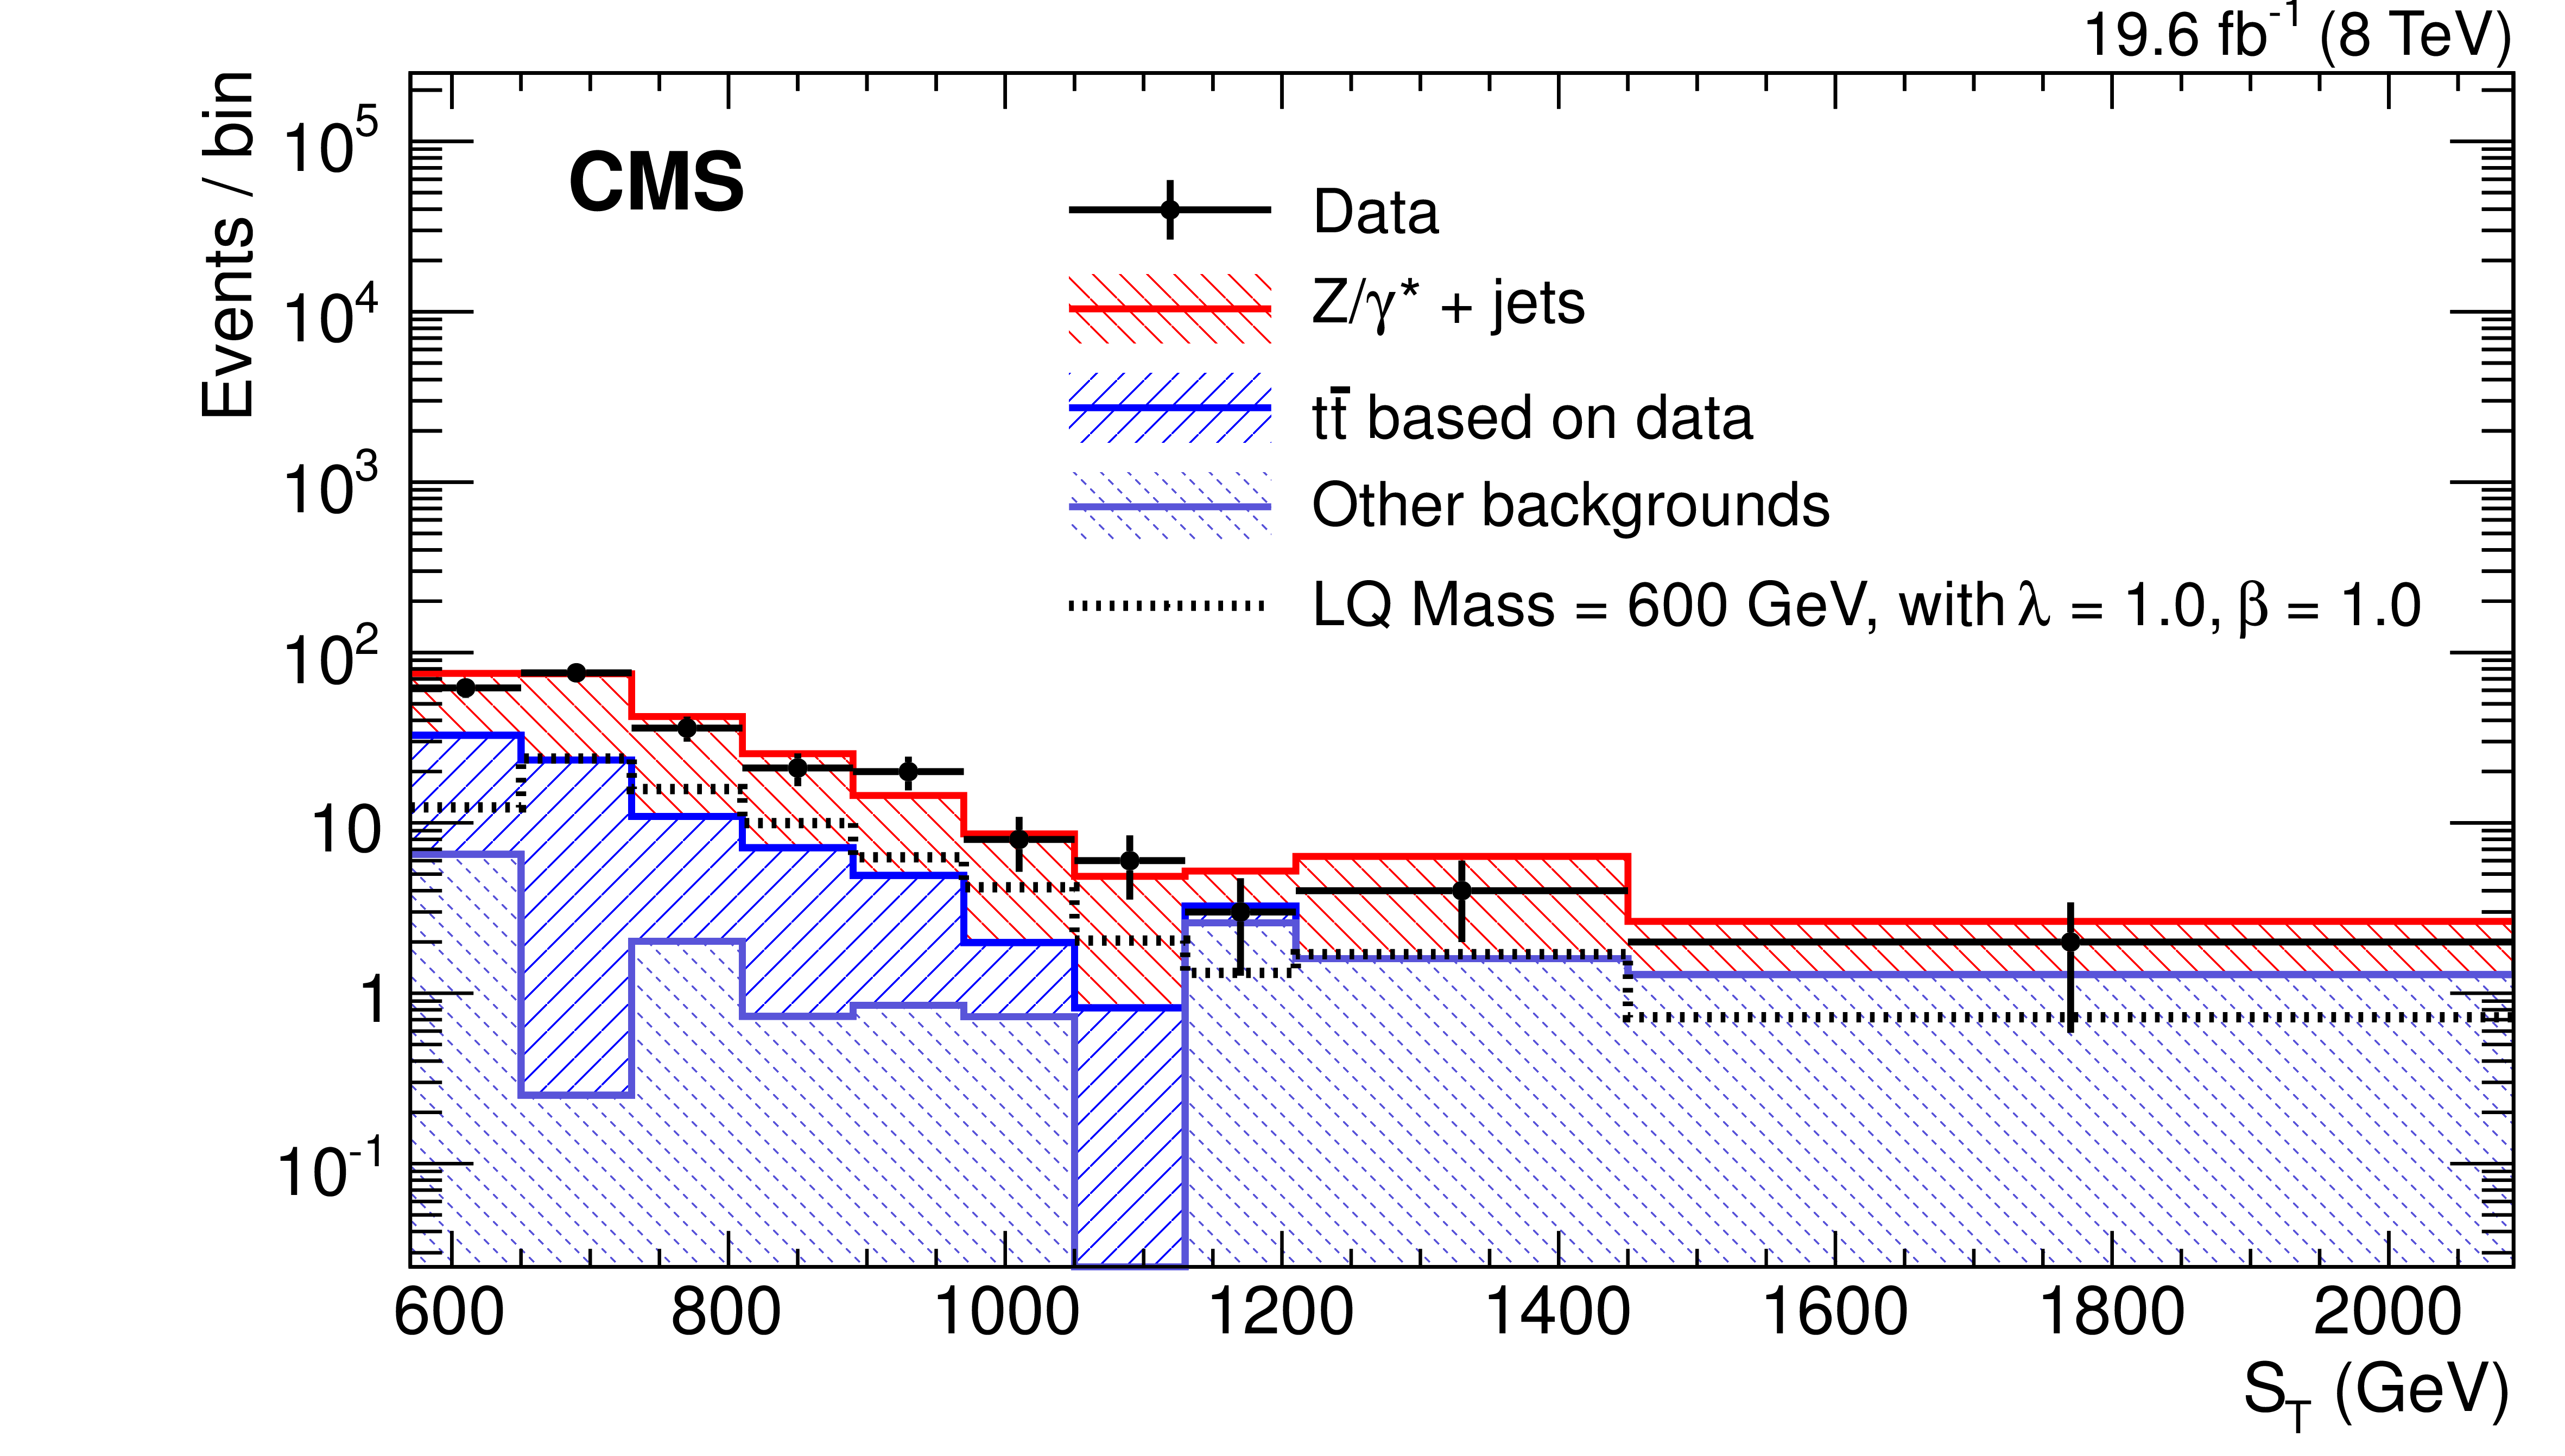
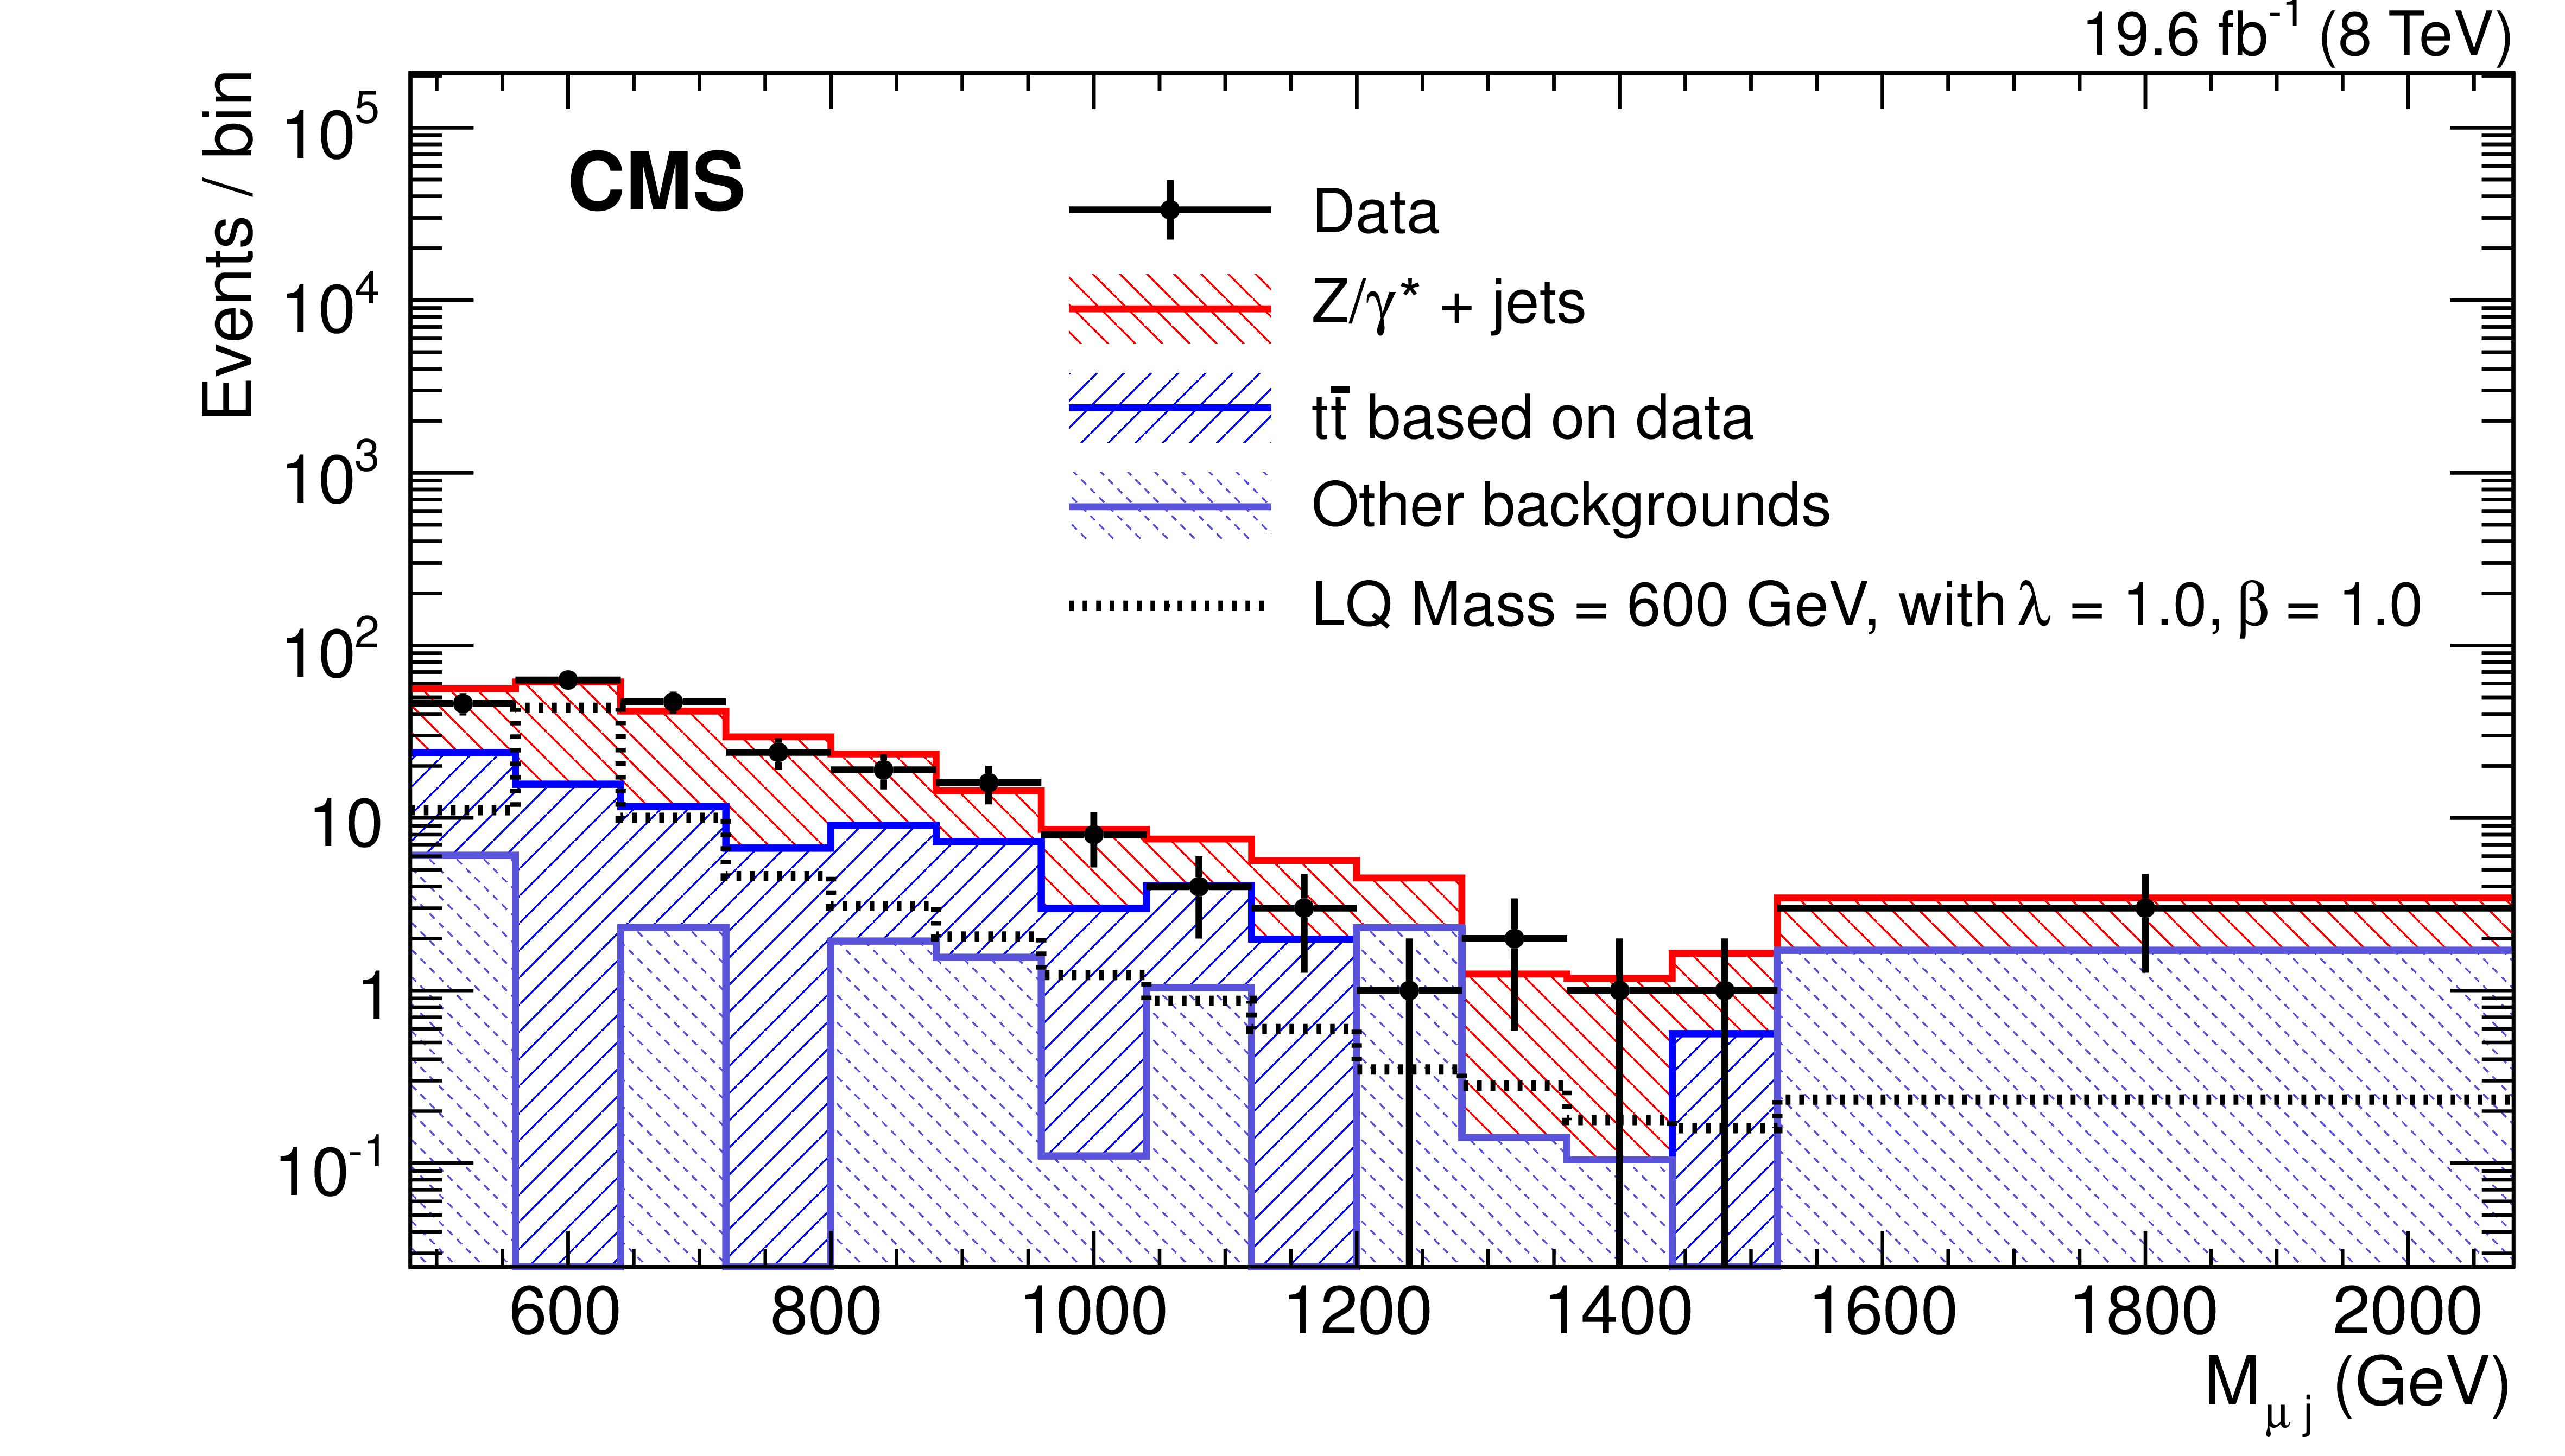
Figure 7-a:
Distributions of $ {S_{\mathrm {T}}} $ and $M_{ {{\mu }}j}$ at final selection, in the $ {{\mu }} {{\mu }}j$ channel. The points represent the data and the stacked histograms show the expected background contributions. The open histogram shows the prediction for an LQ signal for $M_{\text {LQ}}=$ 500 GeV and $\lambda =$ 1.0. The horizontal error bars on the data points represent the bin width. The last bin includes overflow. |
png pdf |
Figure 7-b:
Distributions of $ {S_{\mathrm {T}}} $ and $M_{ {{\mu }}j}$ at final selection, in the $ {{\mu }} {{\mu }}j$ channel. The points represent the data and the stacked histograms show the expected background contributions. The open histogram shows the prediction for an LQ signal for $M_{\text {LQ}}=$ 500 GeV and $\lambda =$ 1.0. The horizontal error bars on the data points represent the bin width. The last bin includes overflow. |
png pdf |
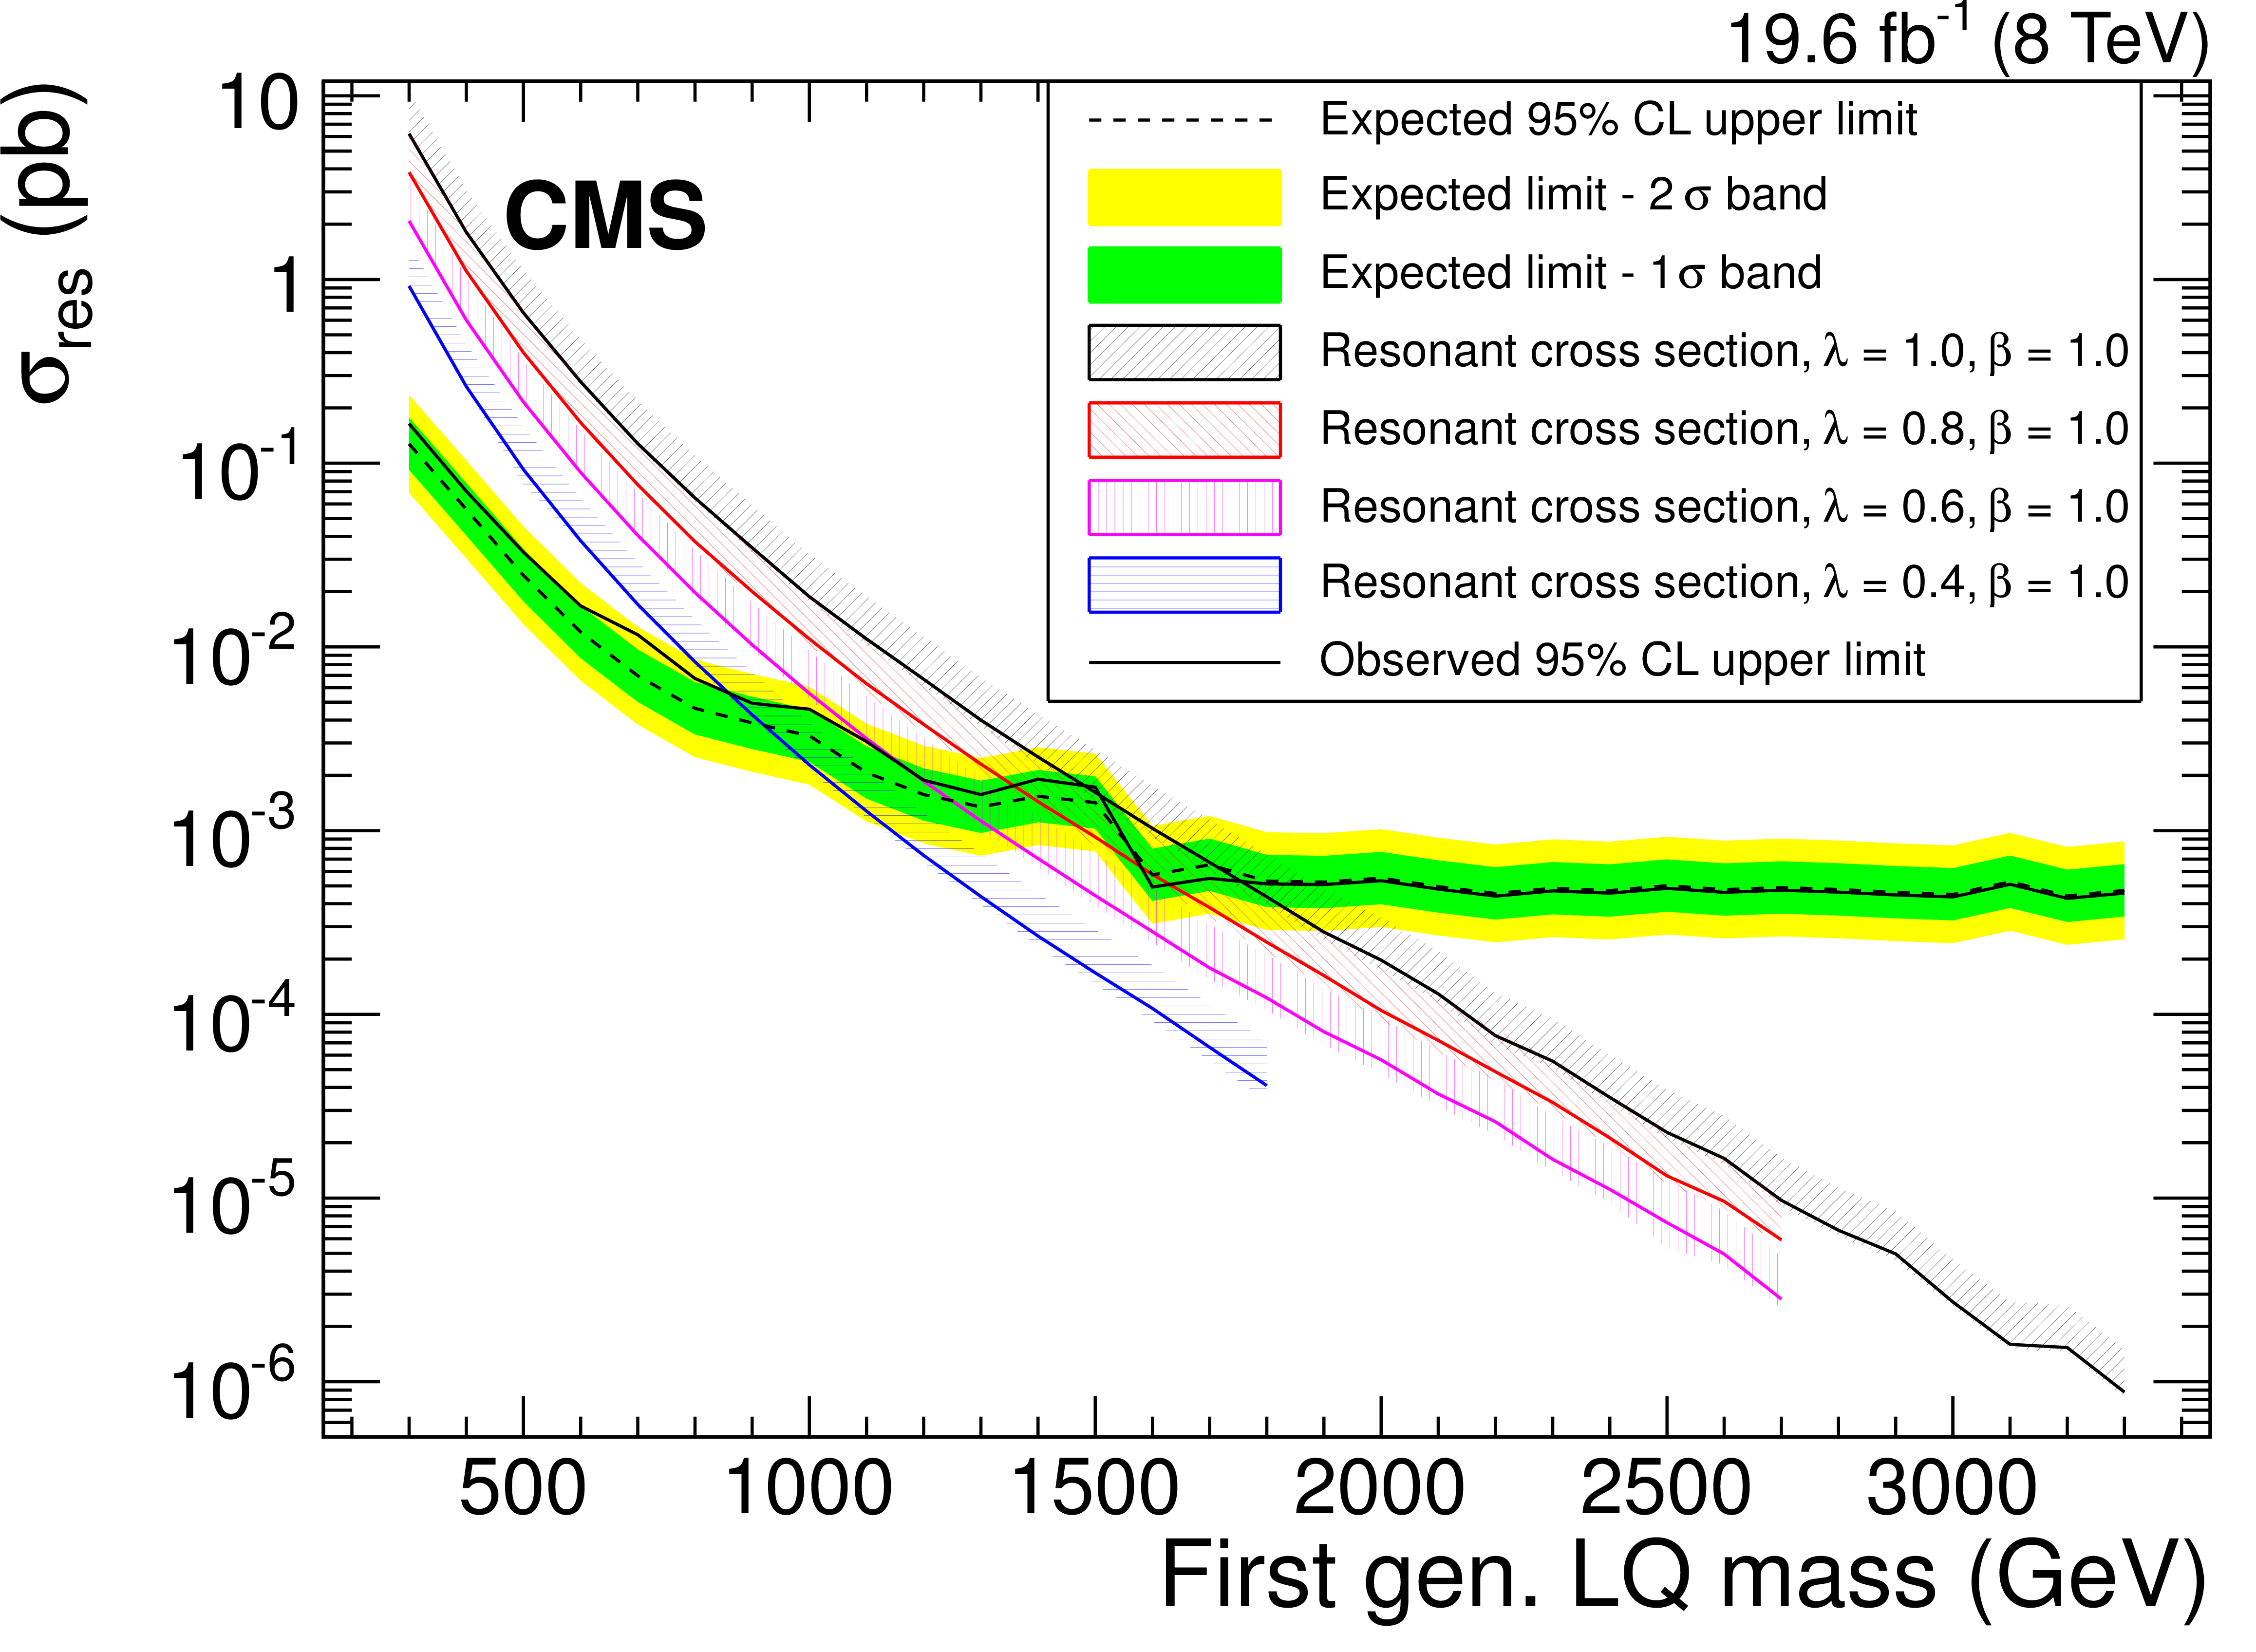
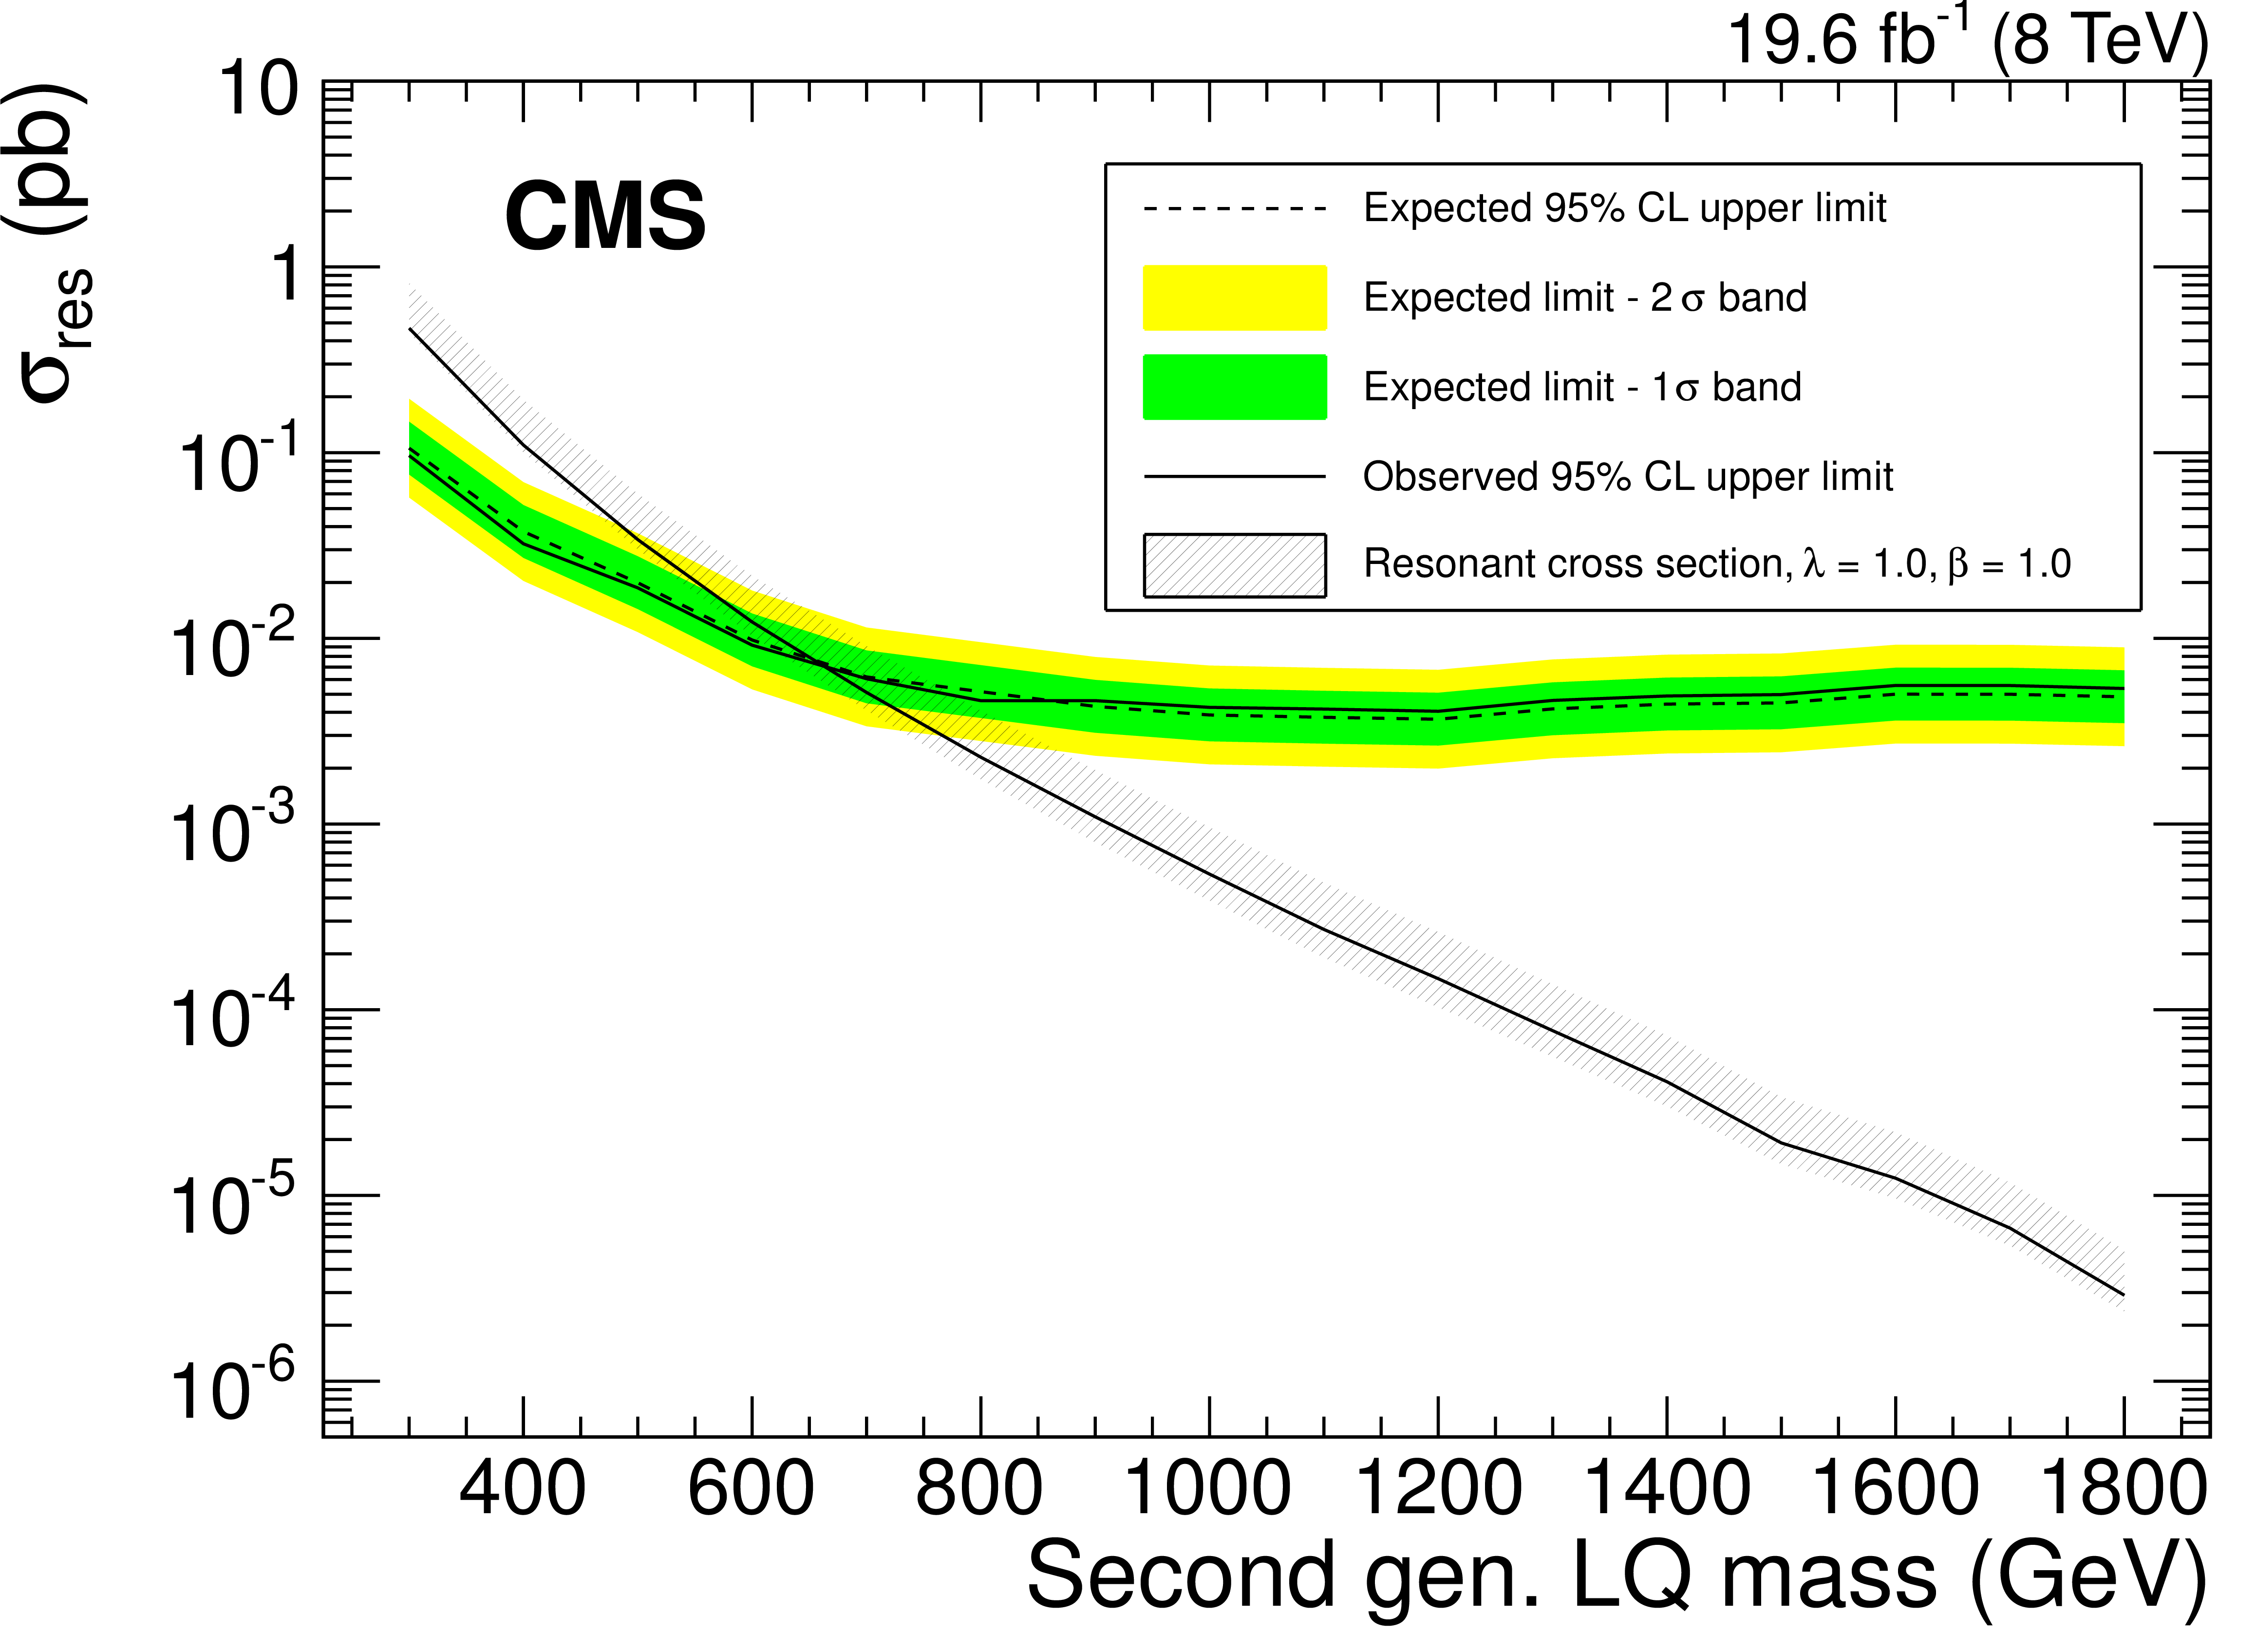
Figure 8-a:
Expected and observed upper limits at 95%CL on first and second generation leptoquark single production resonant cross section as a function of the leptoquark mass. First generation limits are shown on the (a) plot with a resonant region of $M_{\ell j} > 0.66\, M_{\text {LQ}}$, $M_{\ell \ell }>$ 110 GeV and second generation limits are shown on the (b) plot with a resonant region of $M_{\ell j} > 0.75\, M_{\text {LQ}}$, $M_{\ell \ell }>$ 110 GeV. The uncertainty bands on the observed limit represent the 68% and 95% confidence intervals. The uncertainty band on the theoretical cross section includes uncertainties due to PDF variation and the k factor. |
png pdf |
Figure 8-b:
Expected and observed upper limits at 95%CL on first and second generation leptoquark single production resonant cross section as a function of the leptoquark mass. First generation limits are shown on the (a) plot with a resonant region of $M_{\ell j} > 0.66\, M_{\text {LQ}}$, $M_{\ell \ell }>$ 110 GeV and second generation limits are shown on the (b) plot with a resonant region of $M_{\ell j} > 0.75\, M_{\text {LQ}}$, $M_{\ell \ell }>$ 110 GeV. The uncertainty bands on the observed limit represent the 68% and 95% confidence intervals. The uncertainty band on the theoretical cross section includes uncertainties due to PDF variation and the k factor. |
| Summary |
| A search has been performed for the single production of first- and second- generation scalar leptoquarks in final states with two electrons and a jet or two muons and a jet using a data set of proton-proton collisions at 8 TeV corresponding to an integrated luminosity of 19.6 fb$^{-1}$. The selection criteria are optimized for each leptoquark signal mass hypothesis. The number of observed candidates for each mass hypothesis agrees with the number of expected standard model background events. Single production of first-(second-) generation leptoquarks with a coupling of 1.0 is excluded at 95% confidence level for masses below 1755(660) GeV. These are the most stringent limits to date for single production. The first-generation limits for couplings greater than 0.6 are stronger than those from pair production and are the most stringent overall limits on leptoquark production in the first generation to date. |
|
|
Compact Muon Solenoid LHC, CERN |
|

|

|

|

|

|