

Compact Muon Solenoid
LHC, CERN
| CMS-EXO-12-050 ; CERN-PH-EP-2014-261 | ||
| Search for quark contact interactions and extra spatial dimensions using dijet angular distributions in proton-proton collisions at $\sqrt{s}$ = 8 TeV | ||
| CMS Collaboration | ||
| 11 November 2014 | ||
| Phys. Lett. B 746 (2015) 79 | ||
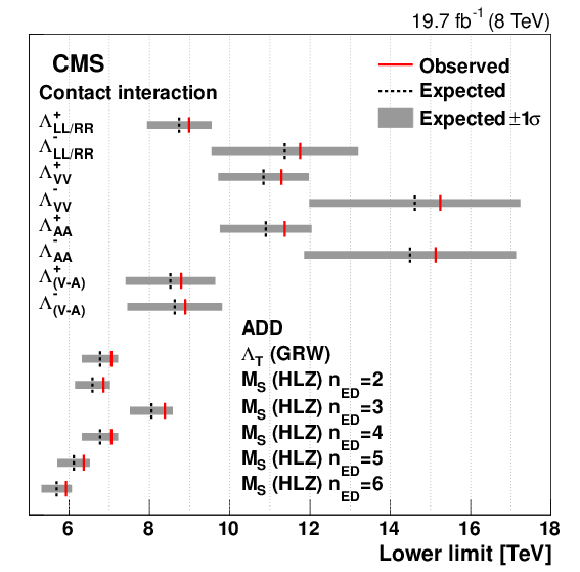
| Abstract: A search is presented for quark contact interactions and extra spatial dimensions in proton-proton collisions at $\sqrt{s}$ = 8 TeV using dijet angular distributions. The search is based on a data set corresponding to an integrated luminosity of 19.7 fb$^{-1}$ collected by the CMS detector at the CERN LHC. Dijet angular distributions are found to be in agreement with the perturbative QCD predictions that include electroweak corrections. Limits on the contact interaction scale from a variety of models at next-to-leading order in QCD corrections are obtained. A benchmark model in which only left-handed quarks participate is excluded up to a scale of 9.0 (11.7) TeV for destructive (constructive) interference at 95% confidence level. Lower limits between 6.0 and 8.4 TeV on the scale of virtual graviton exchange are extracted for the Arkani-Hamed--Dimopoulos--Dvali model of extra spatial dimensions. | ||
| Links: e-print arXiv:1411.2646 [hep-ex] (PDF) ; CDS record ; inSPIRE record ; Public twiki page ; Rivet record ; HepData record ; CADI line (restricted) ; | ||
| Figures | |
png pdf |
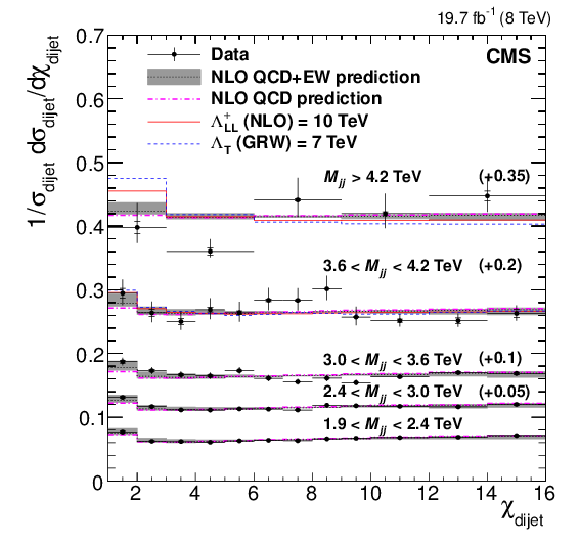
Figure 1:
Normalized $ {\chi _\text {dijet}} $ distributions for 19.7 fb$^{-1}$ of integrated luminosity at $\sqrt {s} =$ 8 TeV. The corrected data distributions are compared to NLO predictions with EW corrections (black dotted line). For clarity the individual distributions are shifted vertically by offsets indicated in parentheses. Theoretical uncertainties are indicated as a gray band. The error bars represent statistical and experimental systematic uncertainties combined in quadrature. The ticks on the error bars represent experimental systematic uncertainties only. The horizontal bars indicate the bin widths. The NLO QCD prediction without EW corrections is also shown (purple dashed dotted). The prediction for SM+CI with $\Lambda _{LL}^{+}$(NLO)$=10$ TeV is shown (red solid line), and so is the prediction for SM+ADD with $\Lambda _{T}$(GRW)$=7$ TeV (blue dashed line). |
png pdf |
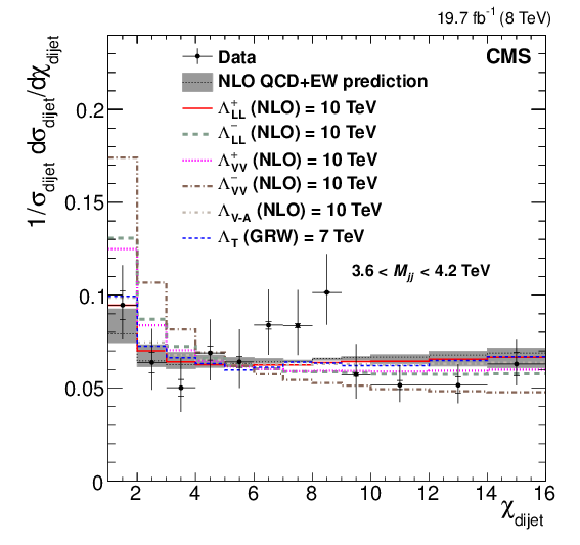
Figure 2-a:
Normalized $ {\chi _\text {dijet}} $ distributions in the two highest $ {M_{jj}} $ ranges. The corrected data distributions are compared to NLO predictions with EW corrections (black dotted line). Theoretical uncertainties are indicated as gray bands. The error bars represent statistical and experimental systematic uncertainties combined in quadrature. The ticks on the error bars represent experimental systematic uncertainties only. The horizontal bars indicate the bin widths. The predictions for the various CI and ADD models are overlaid. |
png pdf |
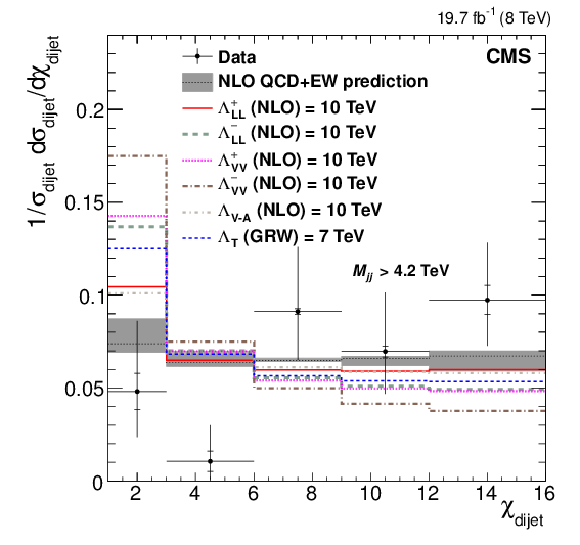
Figure 2-b:
Normalized $ {\chi _\text {dijet}} $ distributions in the two highest $ {M_{jj}} $ ranges. The corrected data distributions are compared to NLO predictions with EW corrections (black dotted line). Theoretical uncertainties are indicated as gray bands. The error bars represent statistical and experimental systematic uncertainties combined in quadrature. The ticks on the error bars represent experimental systematic uncertainties only. The horizontal bars indicate the bin widths. The predictions for the various CI and ADD models are overlaid. |
png pdf |
Figure 3:
Observed (solid lines) and expected (dashed lines) 95% CL lower limits for the CI scales $\Lambda $ for different compositeness models (NLO), for the ADD model scale with GRW parameterization $\Lambda _{T}$ and for the ADD model scale with HLZ parameterization $M_{S}$. The gray bands indicate the corresponding uncertainties in the expected exclusion limits. |
png pdf |
Figure 4:
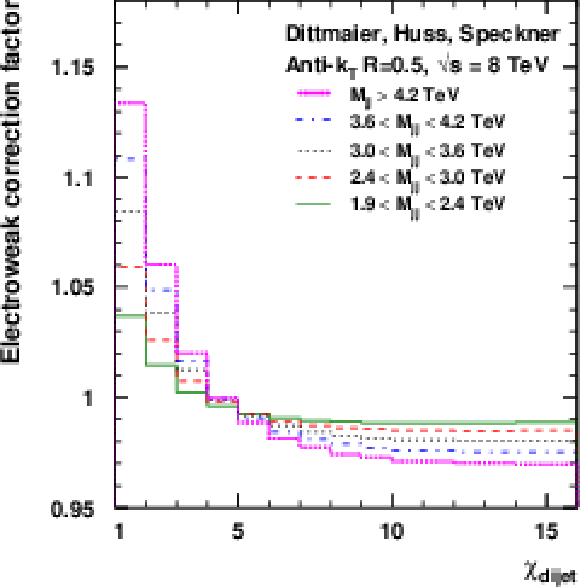
Electroweak correction factors versus $ {\chi _\text {dijet}} $ for each $ {M_{jj}} $ range, derived by the authors of Ref.[47, Dittmaier et al., JHEP 11 (2012) 095] at 8 TeV c.m. energy with $< p_\mathrm {T1,2} >$ as choice for the $ {\mu _R} $ and $ {\mu _F} $ scales and the CT10-NLO PDF set. |

|
Compact Muon Solenoid LHC, CERN |

|

|

|

|

|

|