

Compact Muon Solenoid
LHC, CERN
| CMS-EXO-14-010 ; CERN-PH-EP-2015-332 | ||
| Search for massive WH resonances decaying into the $\ell \nu\mathrm{ b \bar{b} }$ final state at $\sqrt{s}= $ 8 TeV | ||
| CMS Collaboration | ||
| 24 January 2016 | ||
| Eur. Phys. J. C 76 (2016) 237 | ||
| Abstract: A search for a massive resonance W' decaying into a W and a Higgs boson in the $\ell \nu \mathrm{ b \bar{b} }$ ($\ell = \mathrm{e}$, $\mu$) final state is presented. Results are based on data corresponding to an integrated luminosity of 19.7 fb$^{-1}$ of proton-proton collisions at $\sqrt{s}= $ 8 TeV, collected using the CMS detector at the LHC. For a high-mass (larger than 1 TeV) resonance, the two bottom quarks coming from the Higgs boson decay are reconstructed as a single jet, which can be tagged by placing requirements on its substructure and flavour. Exclusion limits at 95% confidence level are set on the production cross section of a narrow resonance decaying into WH, as a function of its mass. In the context of a little Higgs model, a lower limit on the W' mass of 1.4 TeV is set. In a heavy vector triplet model that mimics the properties of composite Higgs models, a lower limit on the W' mass of 1.5 TeV is set. In the context of this model, the results are combined with related searches to obtain a lower limit on the W' mass of 1.8 TeV, the most restrictive to date for decays to a pair of standard model bosons. | ||
| Links: e-print arXiv:1601.06431 [hep-ex] (PDF) ; CDS record ; inSPIRE record ; CADI line (restricted) ; | ||
| Figures | |
png pdf |
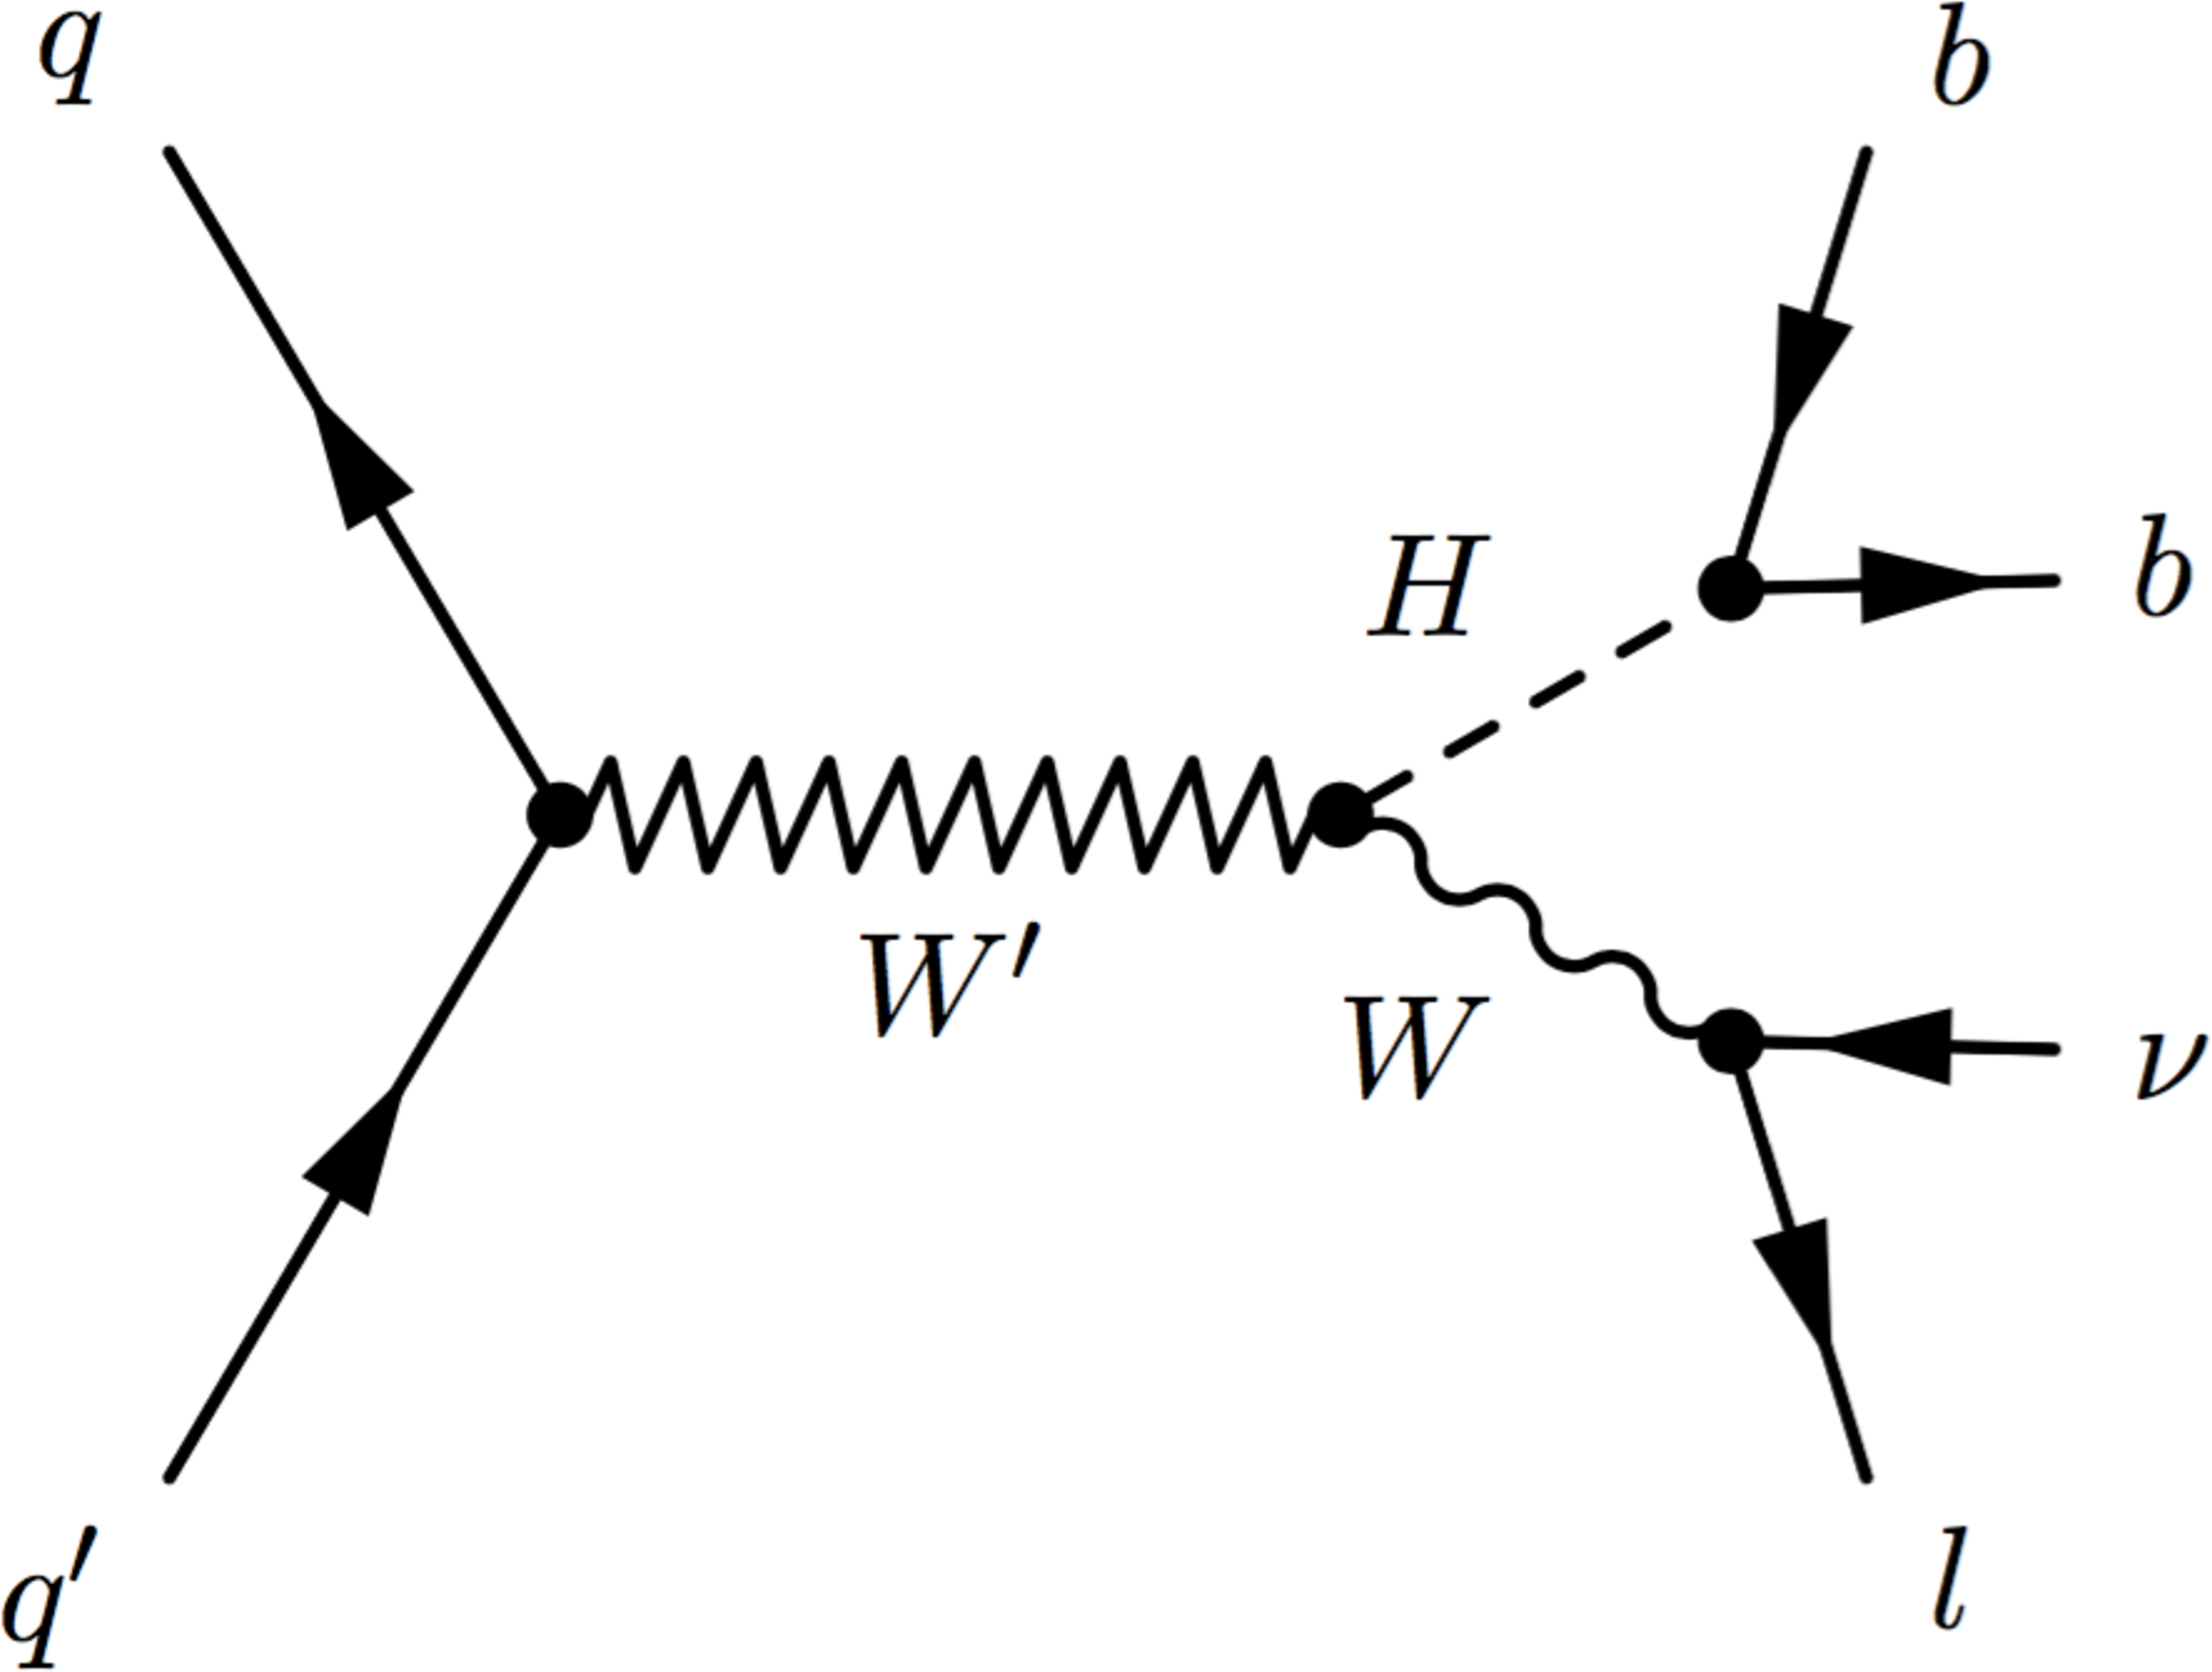
Figure 1:
Production of a resonance decaying into WH. |

png pdf |
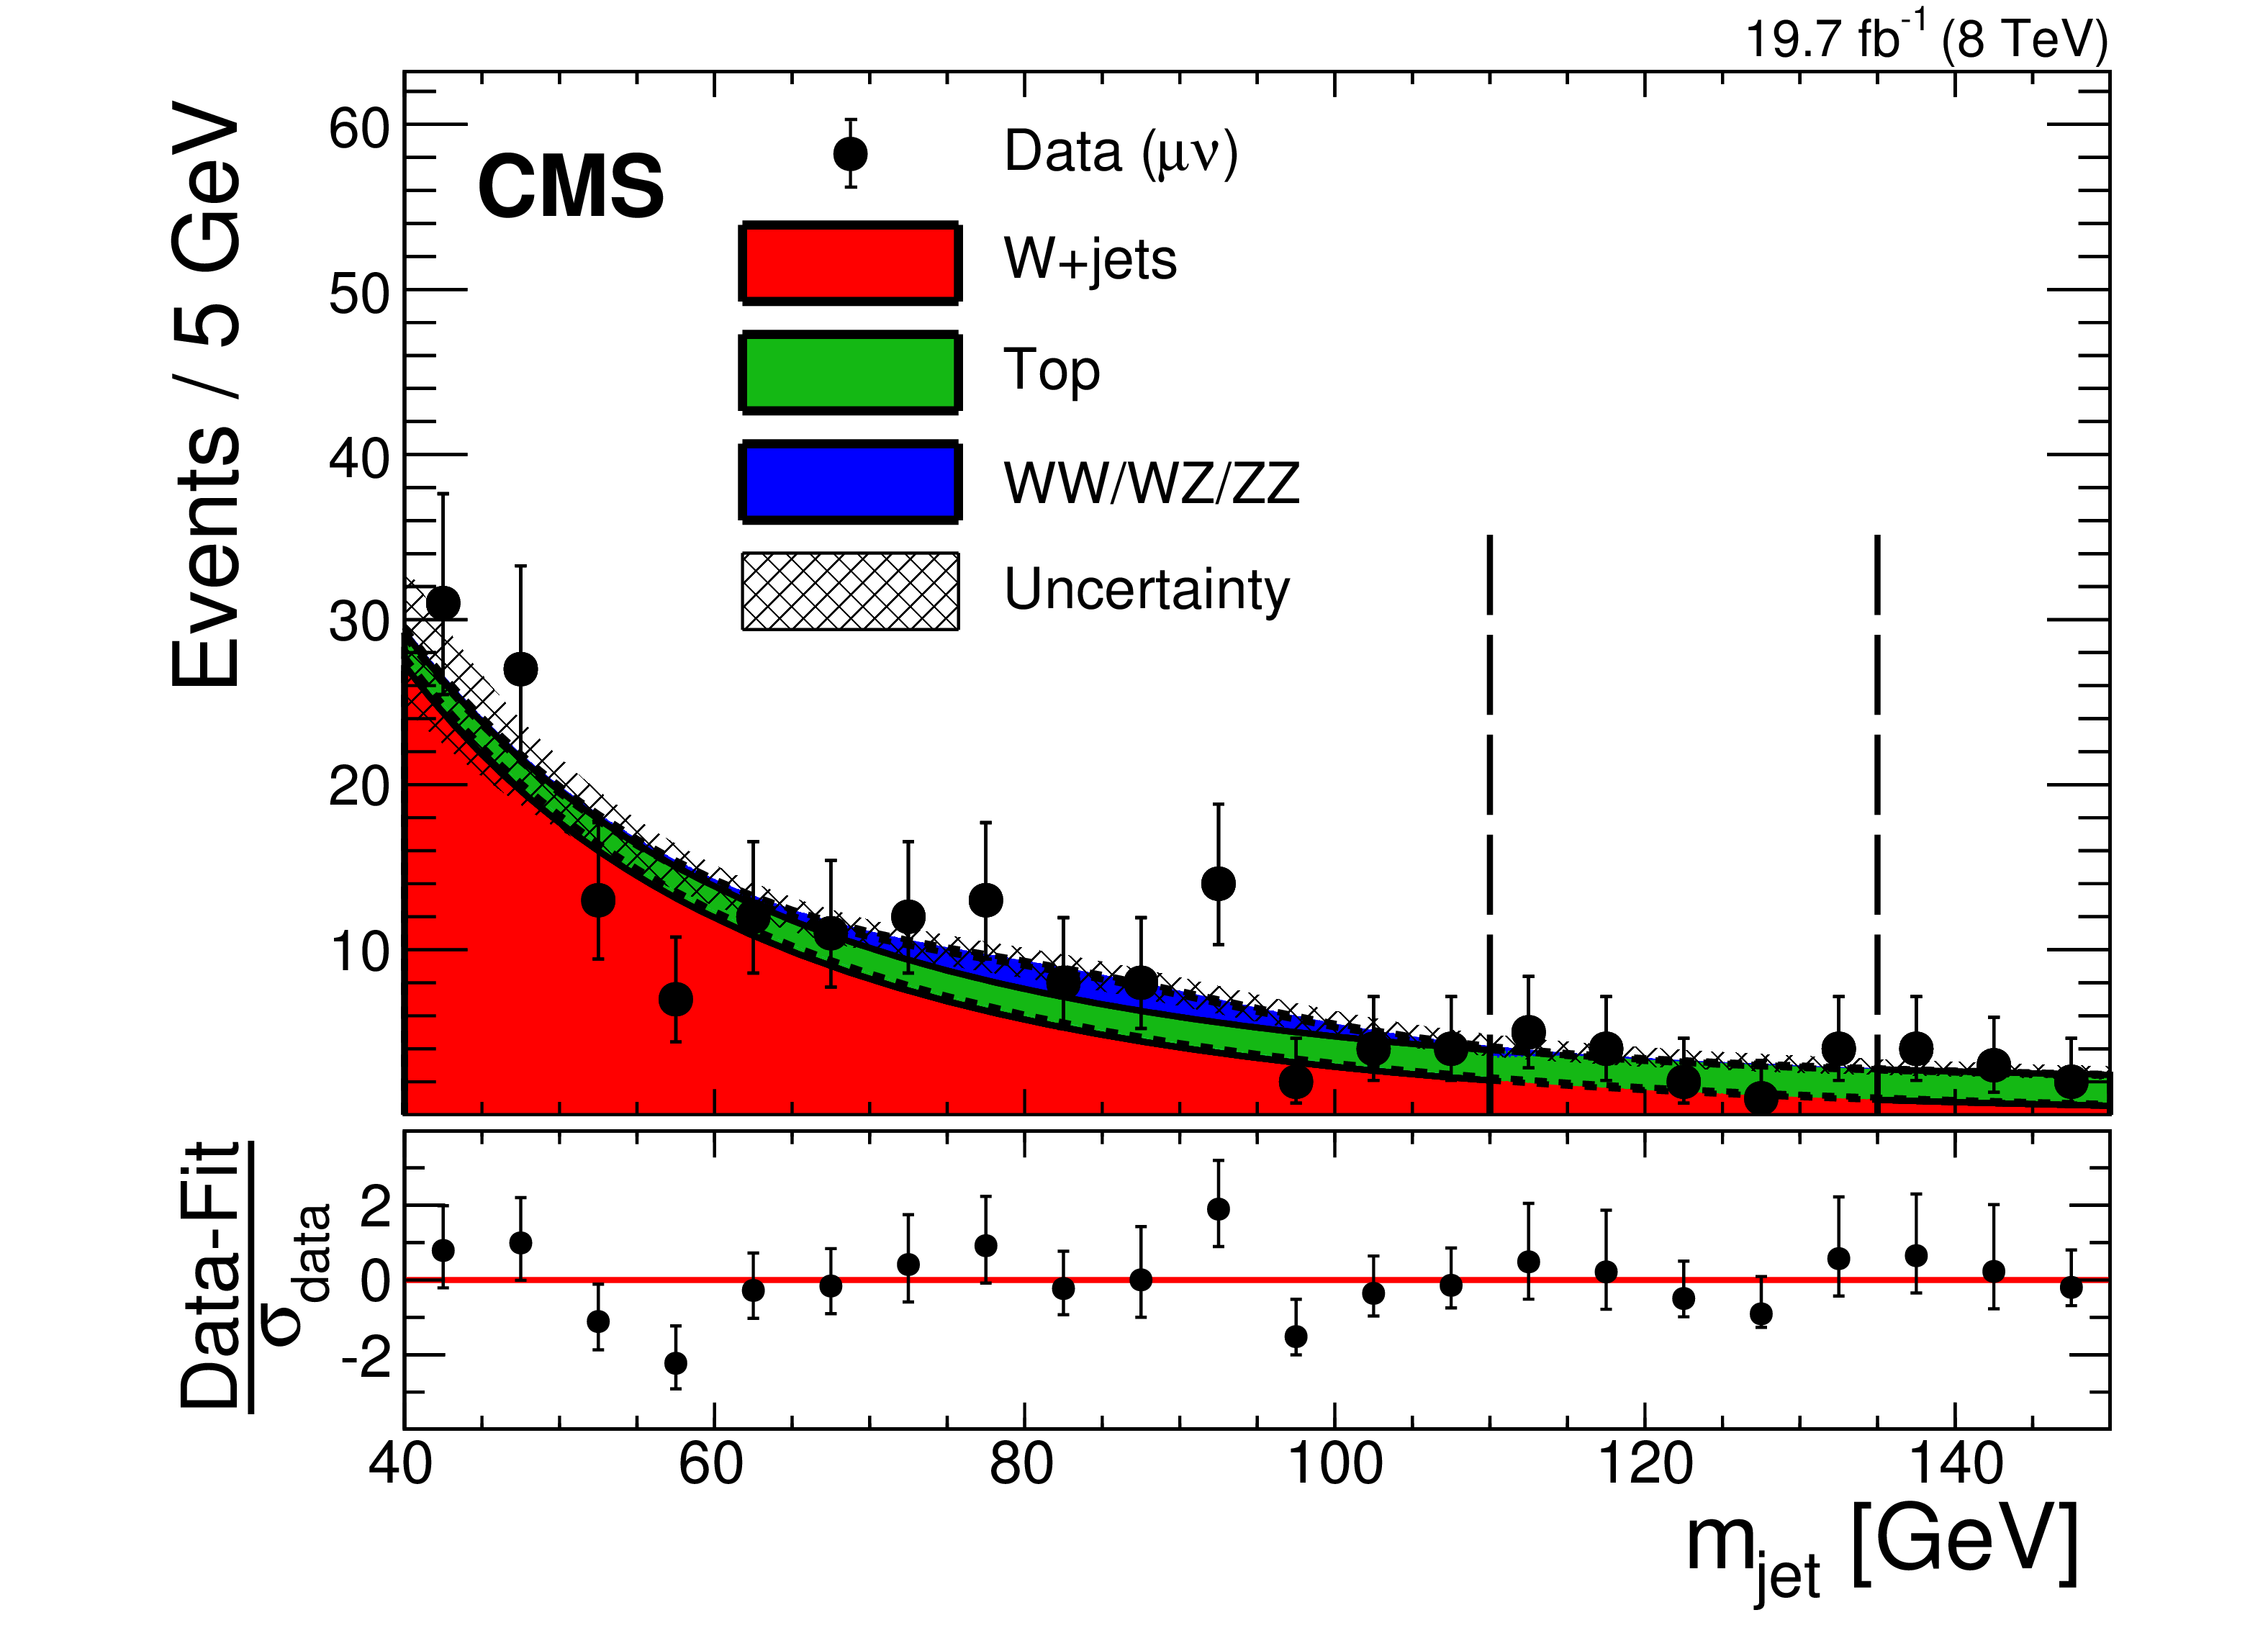
Figure 2-a:
Distributions of the pruned jet mass, $ {m_{\text {jet}}}$, in the electron (a) and muon (b) channels. The signal region lies between the dashed vertical lines. The hatched region indicates the statistical uncertainty of the fit. At the bottom of each plot, the bin-by-bin fit residuals, $(\text {Data}-\text {Fit})/\sigma _\text {data}$, are shown. |
png pdf |
Figure 2-b:
Distributions of the pruned jet mass, $ {m_{\text {jet}}}$, in the electron (a) and muon (b) channels. The signal region lies between the dashed vertical lines. The hatched region indicates the statistical uncertainty of the fit. At the bottom of each plot, the bin-by-bin fit residuals, $(\text {Data}-\text {Fit})/\sigma _\text {data}$, are shown. |
png pdf |
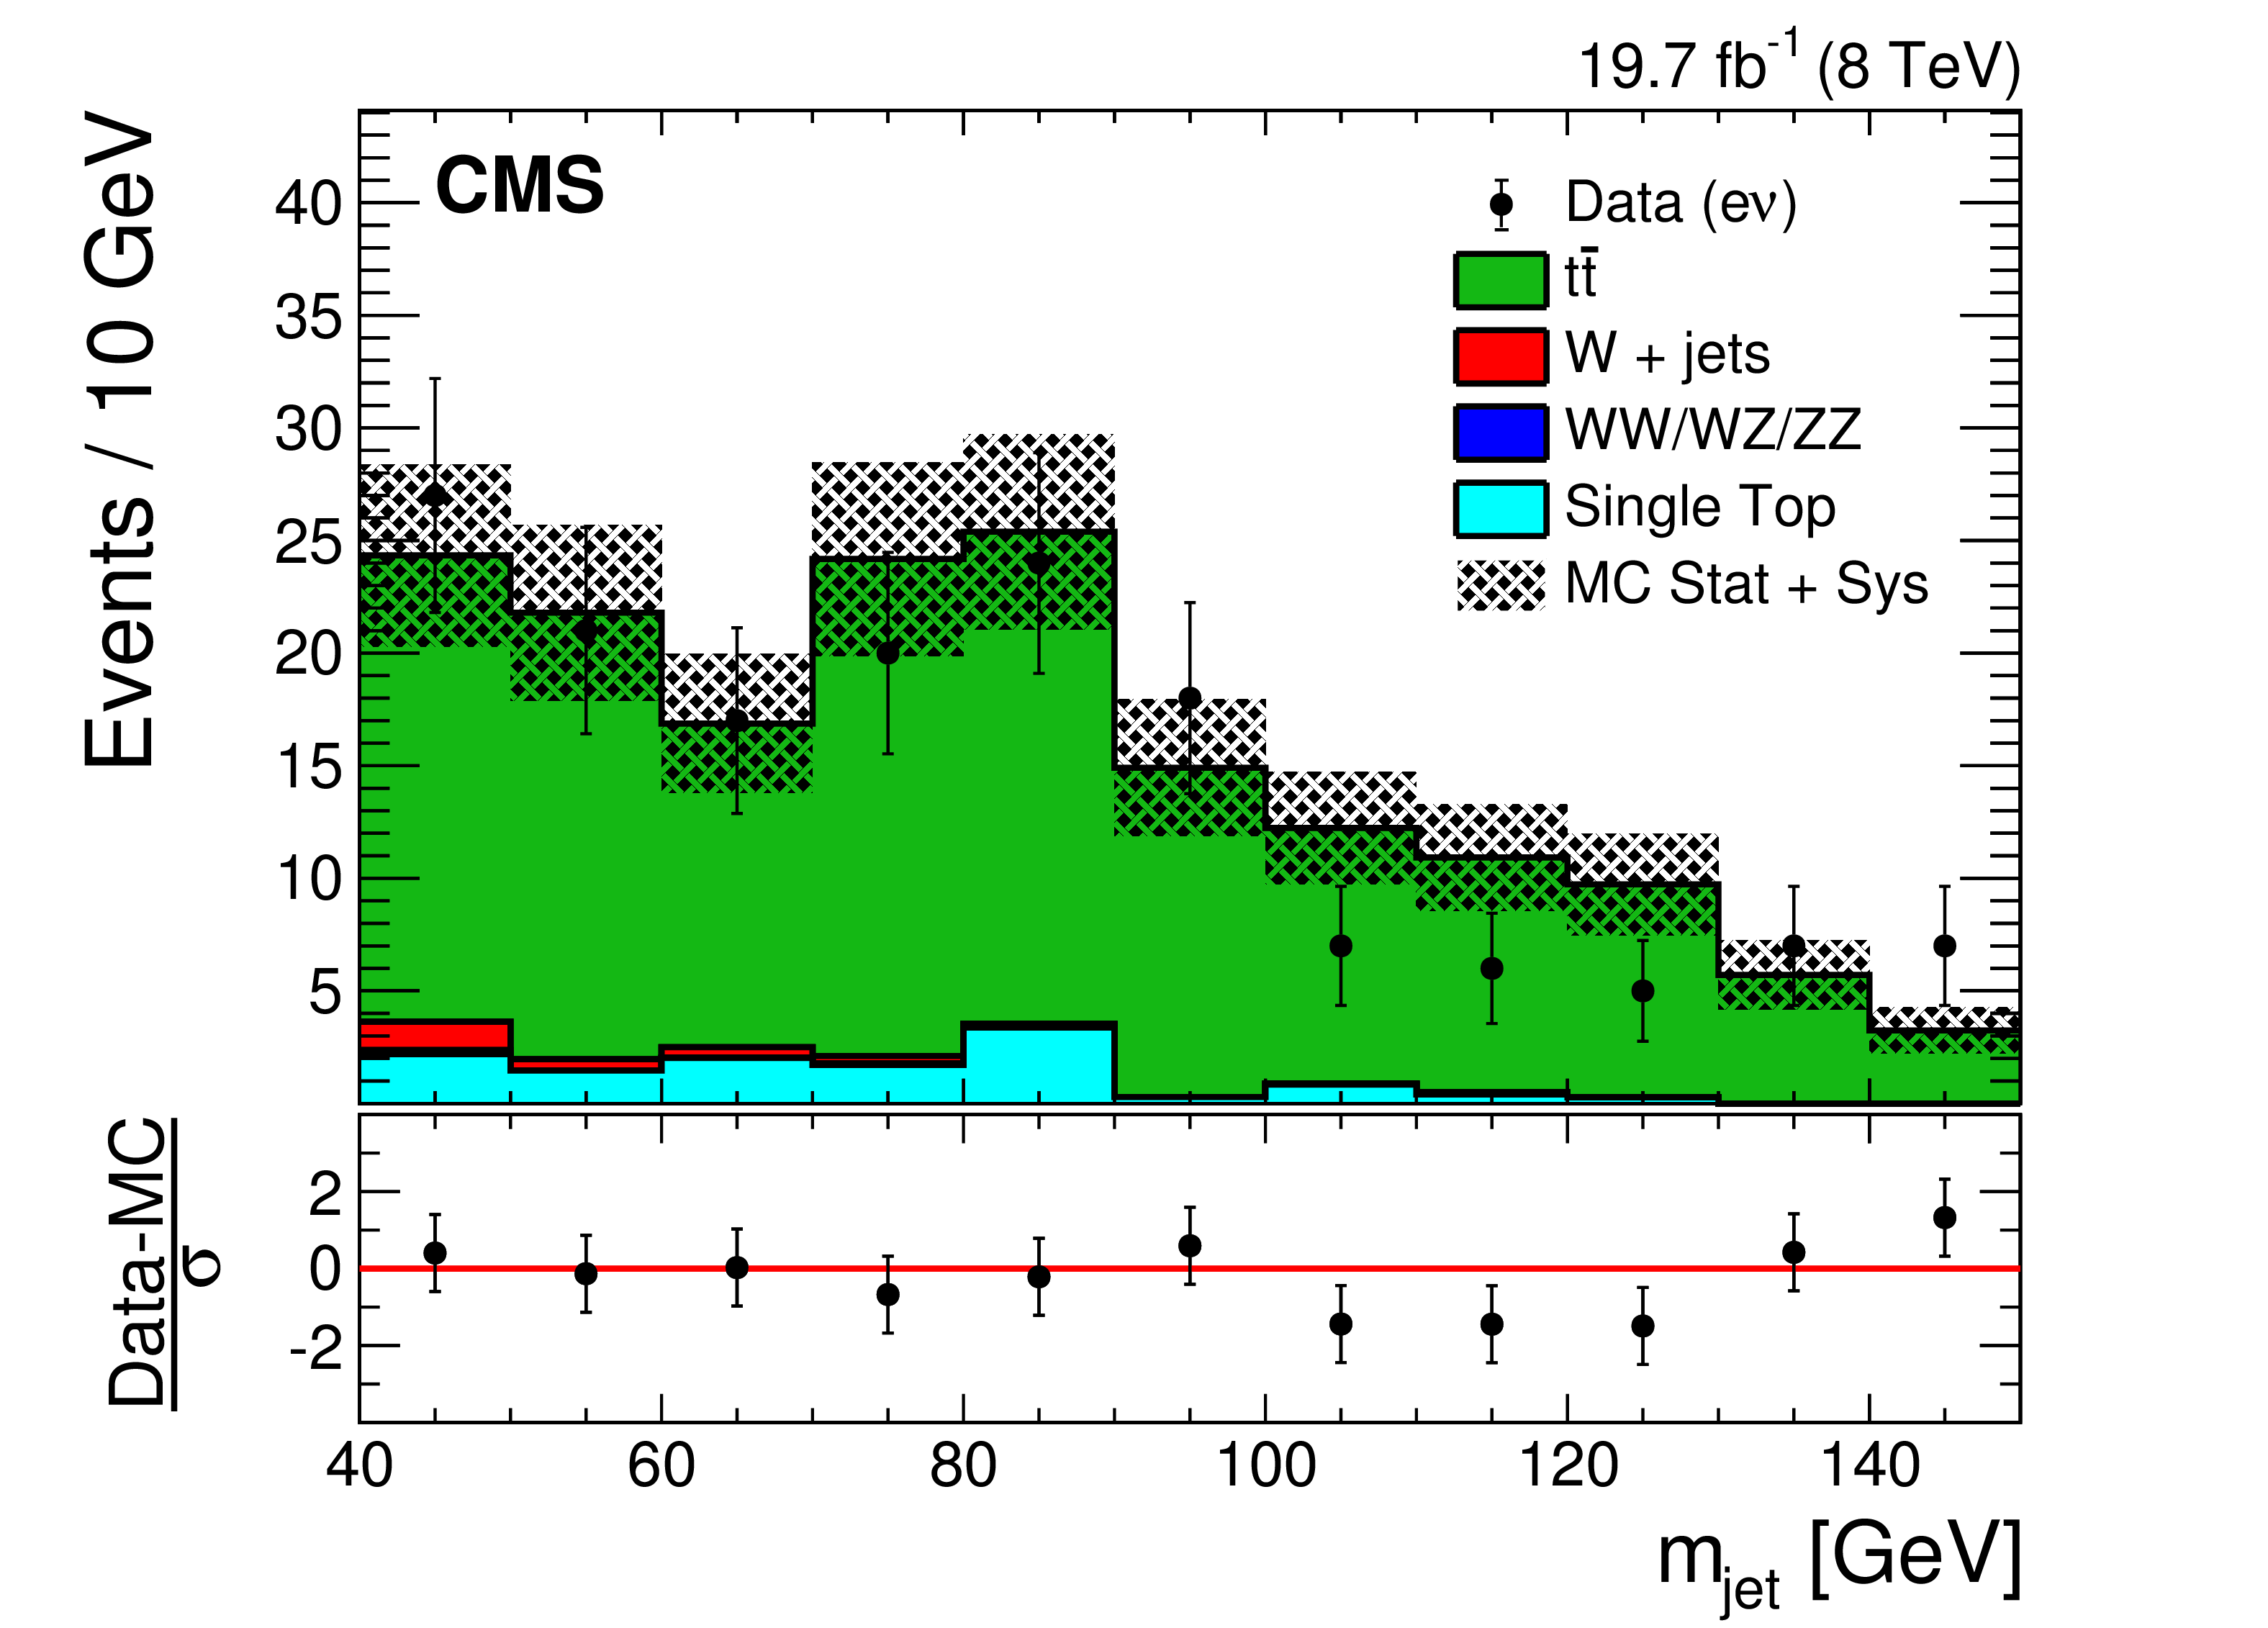
Figure 3-a:
Distributions of $ {m_{\text {jet}}}$in the top quark enriched control sample in the electron (a) and muon (b) channels. The hatched region indicates the overall uncertainty in the background. In the lower panels, the bin-by-bin residuals, $(\text {Data}-\mathrm {MC})/\sigma $ are shown, where $\sigma $ is the sum in quadrature of the statistical uncertainty of the data, the simulation, and the systematic uncertainty in the $ \mathrm{ t \bar{t} } $ background. |
png pdf |
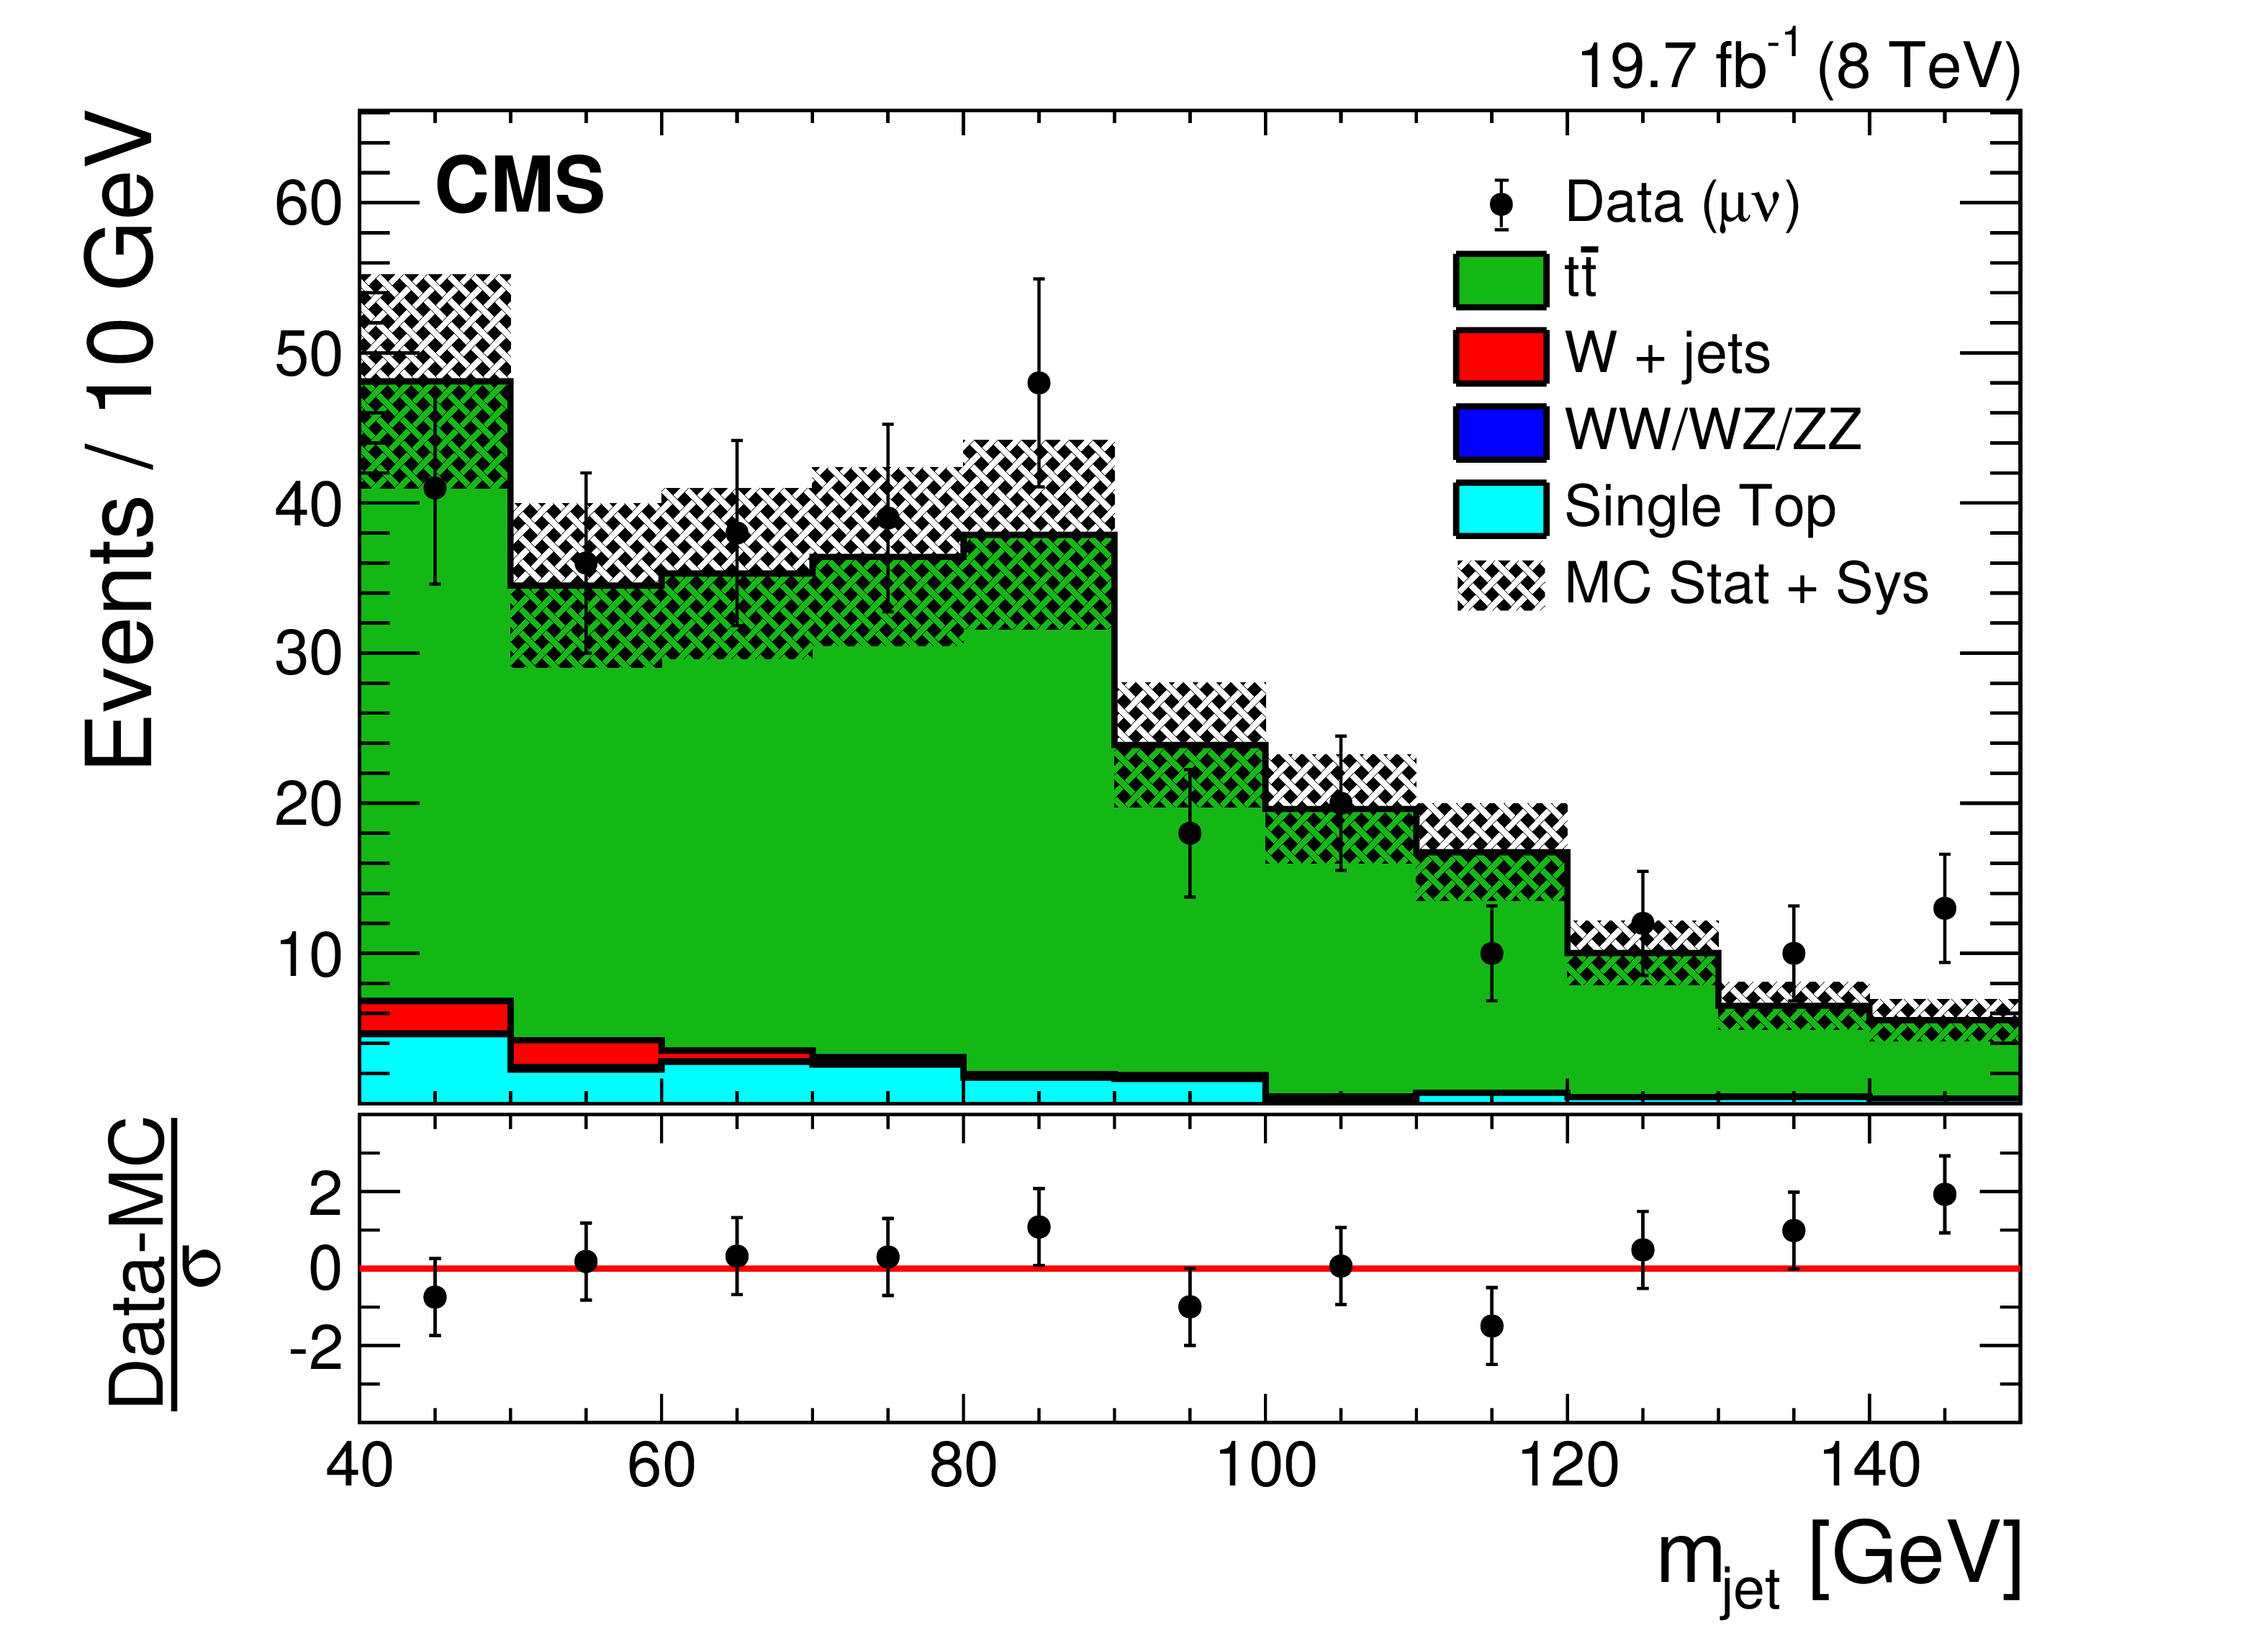
Figure 3-b:
Distributions of $ {m_{\text {jet}}}$in the top quark enriched control sample in the electron (a) and muon (b) channels. The hatched region indicates the overall uncertainty in the background. In the lower panels, the bin-by-bin residuals, $(\text {Data}-\mathrm {MC})/\sigma $ are shown, where $\sigma $ is the sum in quadrature of the statistical uncertainty of the data, the simulation, and the systematic uncertainty in the $ \mathrm{ t \bar{t} } $ background. |
png pdf |
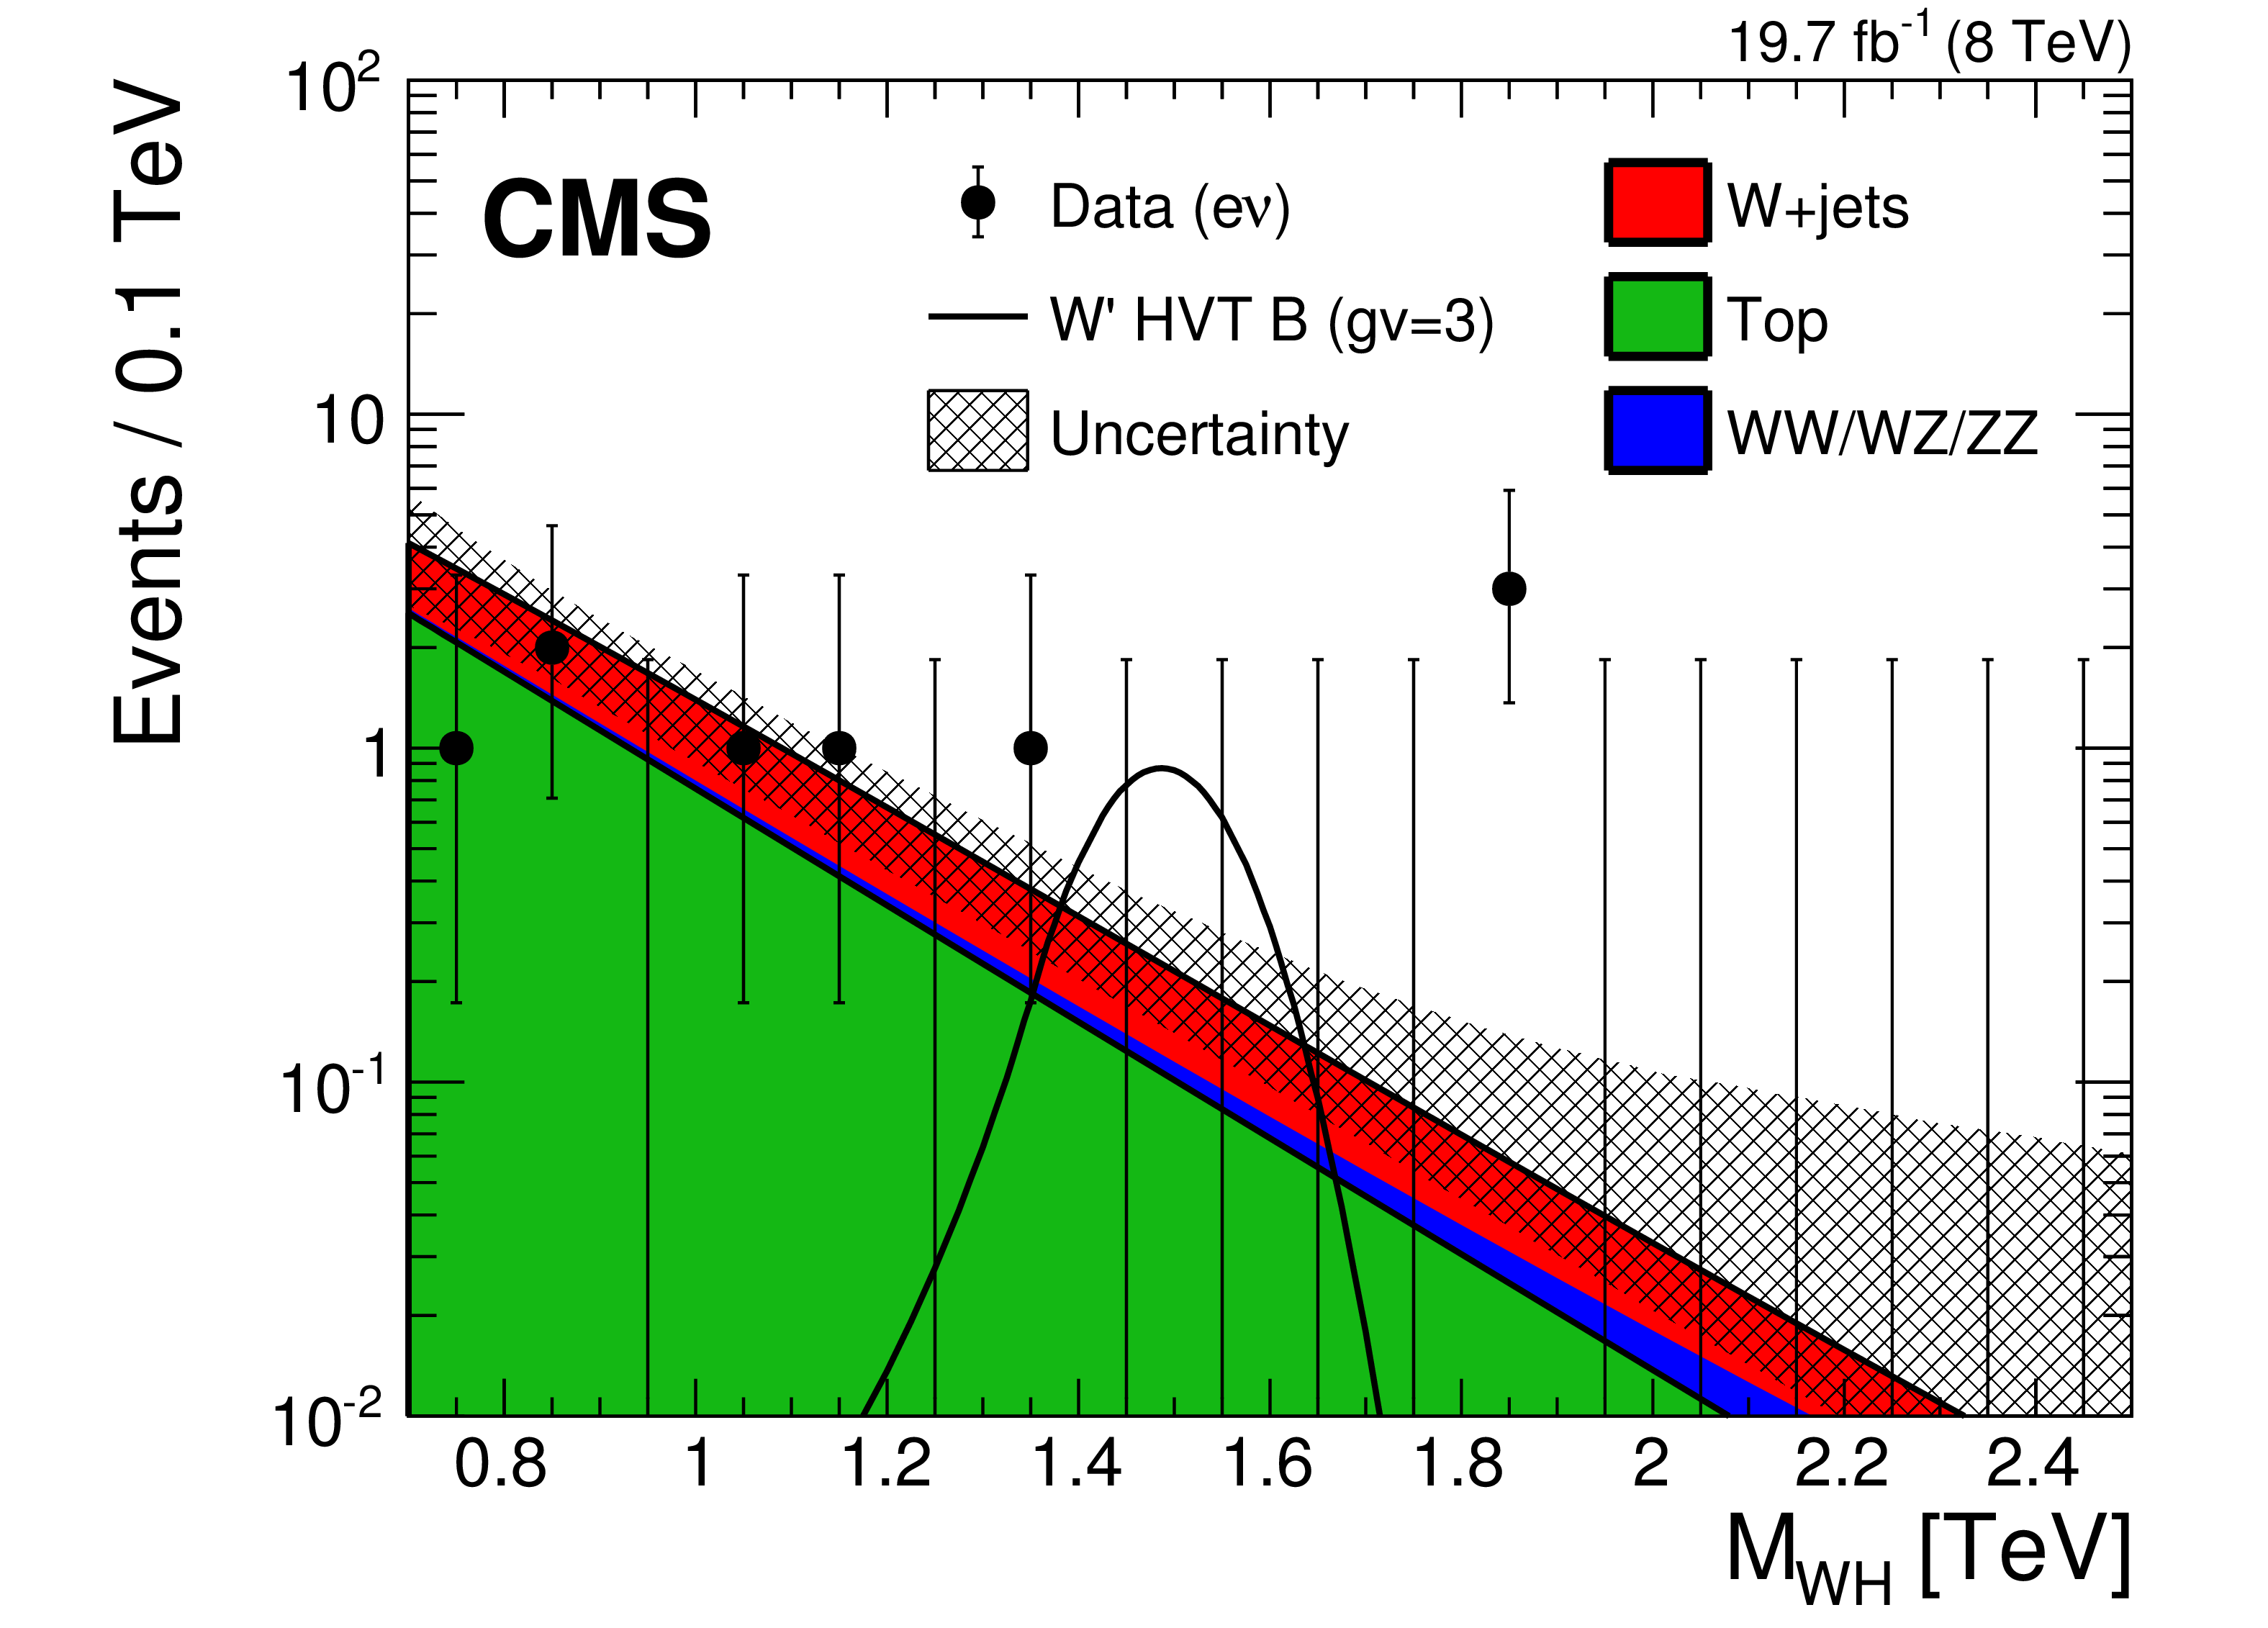
Figure 4-a:
Final distributions in $\mathrm{M}_{\mathrm{WH}}$ for data and expected backgrounds for electron (a) and muon (b) categories. The 68% error bars for Poisson event counts are obtained from the Neyman construction [76]. The hatched region indicates the statistical uncertainty of the fit combined with the systematical uncertainty in the shape. This figure also shows a hypothetical W' signal with mass of 1.5 TeV , normalized to the cross section predicted by the HVT model B with parameter $g_ {\mathrm {V}} =$ 3 as described in Section 8.2. |
png pdf |
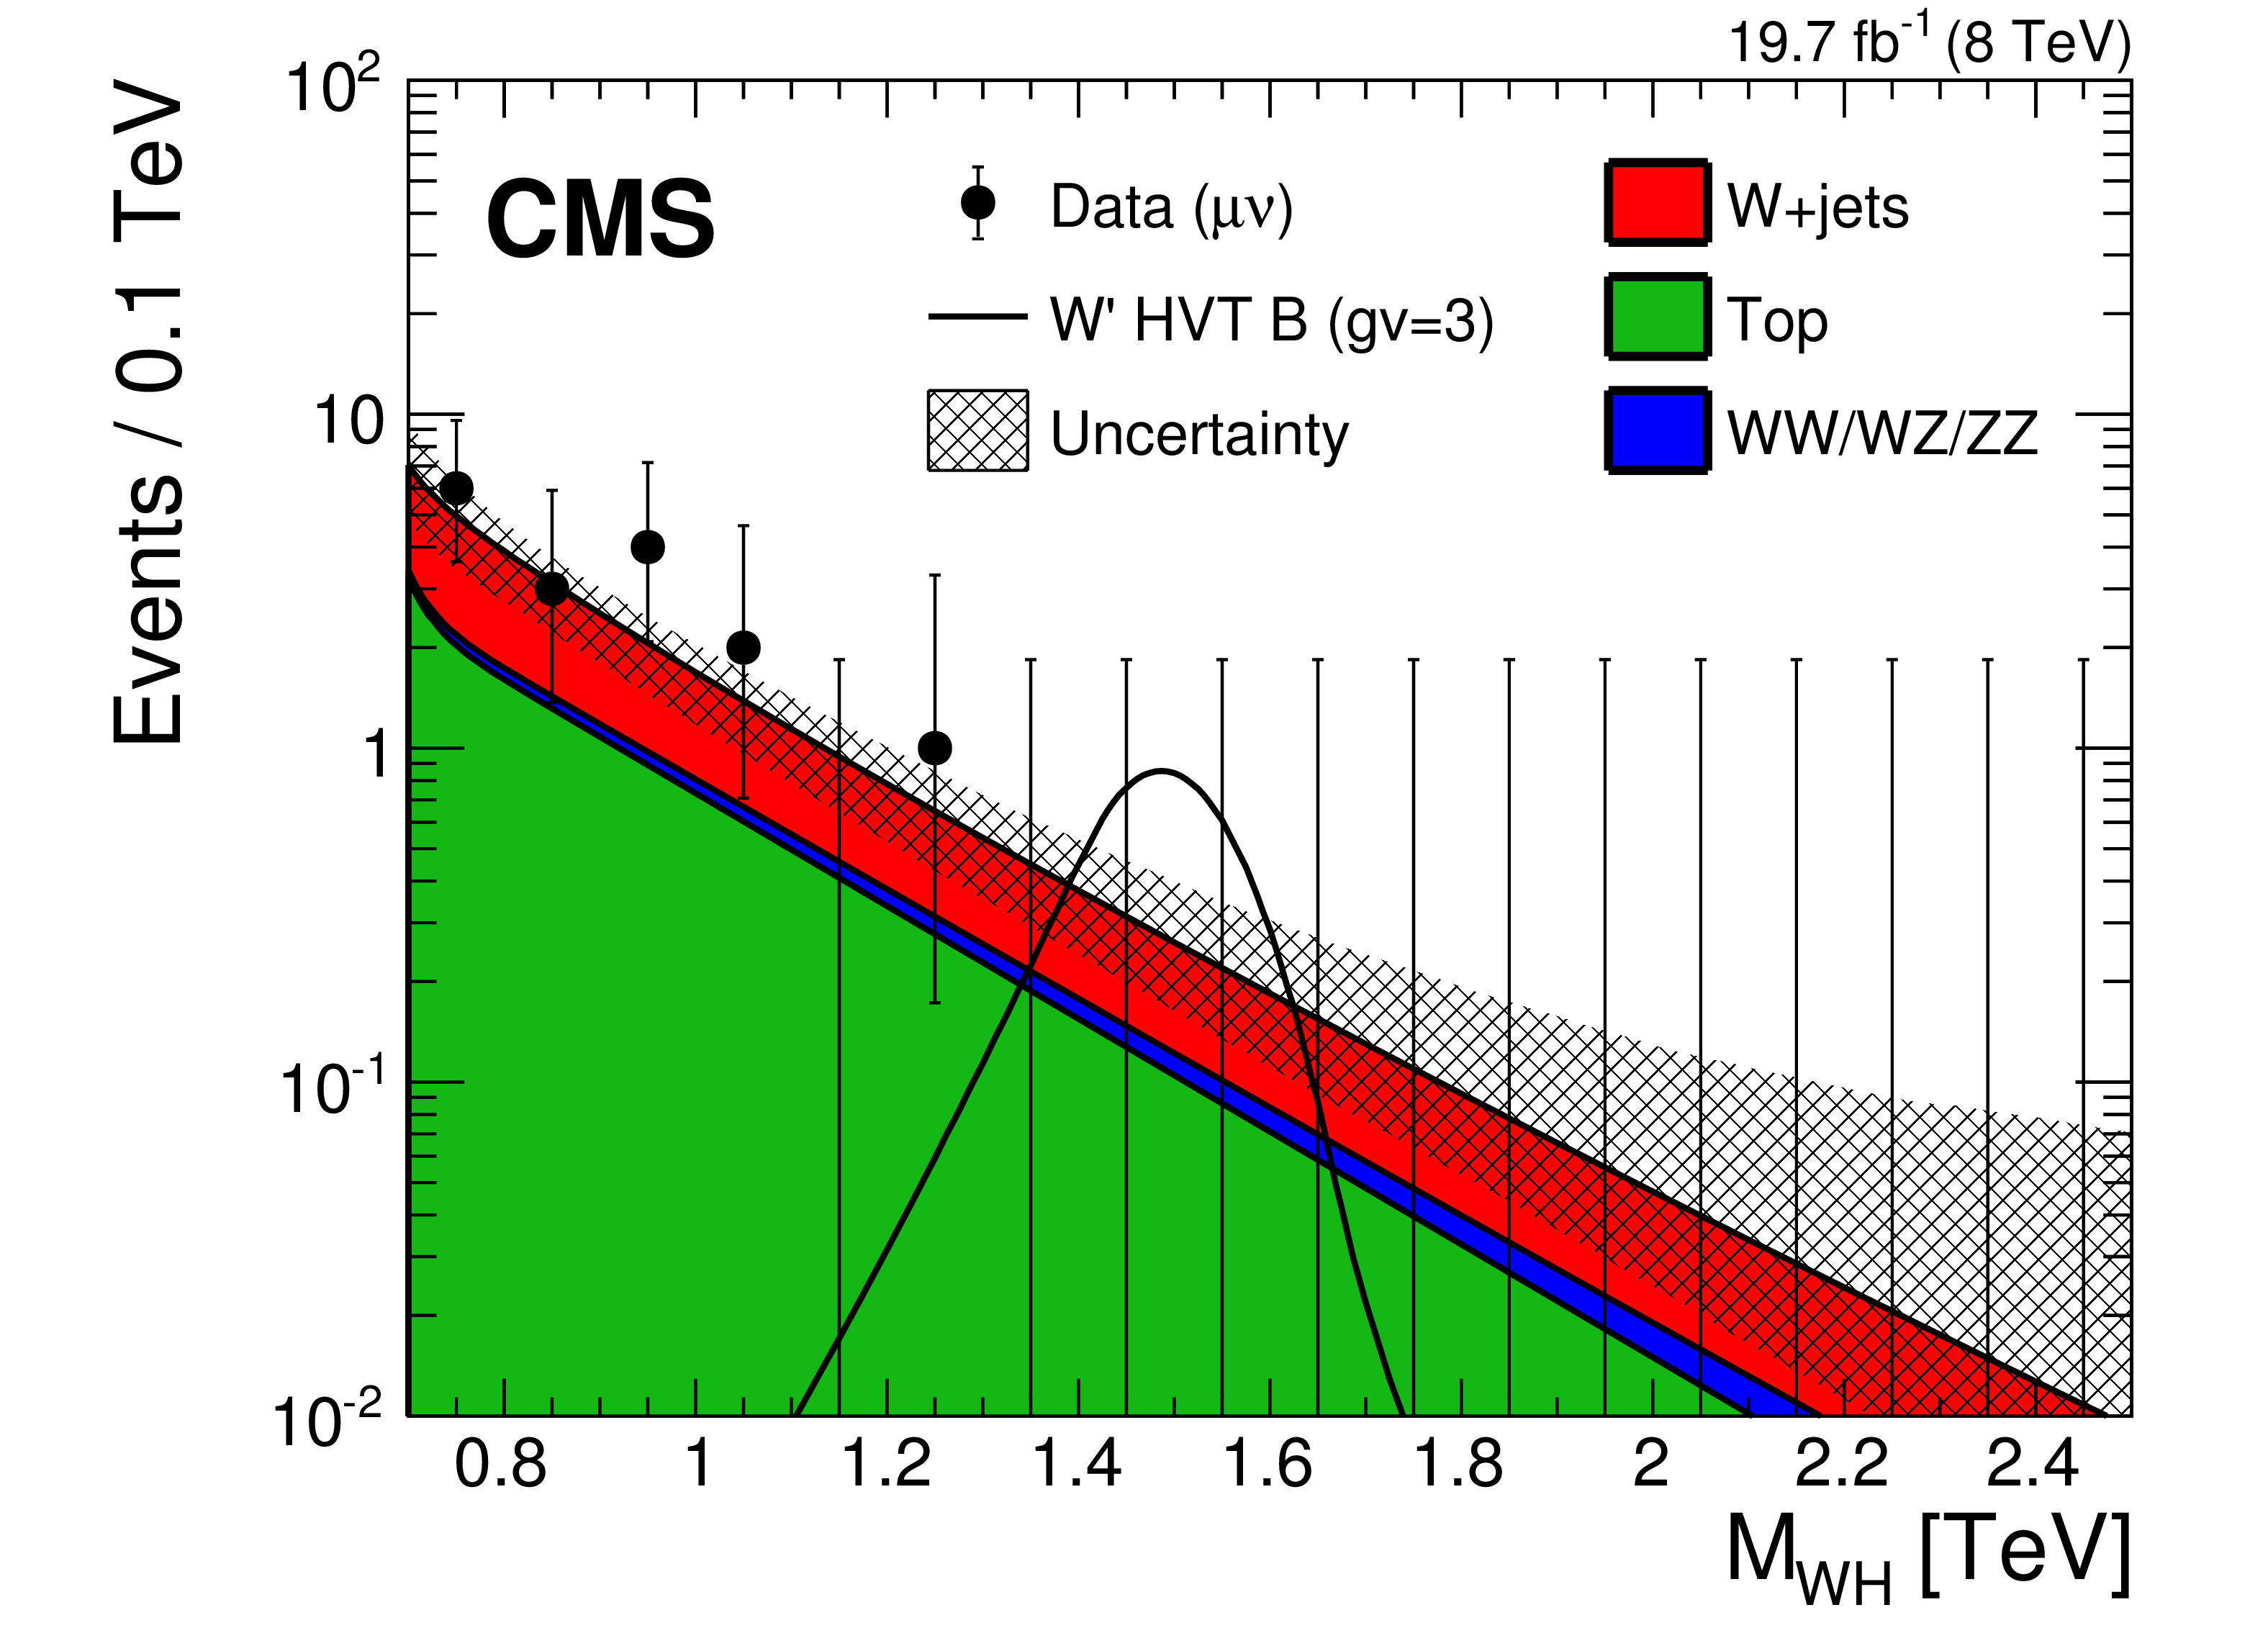
Figure 4-b:
Final distributions in $\mathrm{M}_{\mathrm{WH}}$ for data and expected backgrounds for electron (a) and muon (b) categories. The 68% error bars for Poisson event counts are obtained from the Neyman construction [76]. The hatched region indicates the statistical uncertainty of the fit combined with the systematical uncertainty in the shape. This figure also shows a hypothetical W' signal with mass of 1.5 TeV , normalized to the cross section predicted by the HVT model B with parameter $g_ {\mathrm {V}} =$ 3 as described in Section 8.2. |

png pdf |
Figure 5:
Local $p$-value of the combined electron and muon data as a function of the W' boson mass, probing a narrow WH resonance. |
png pdf |
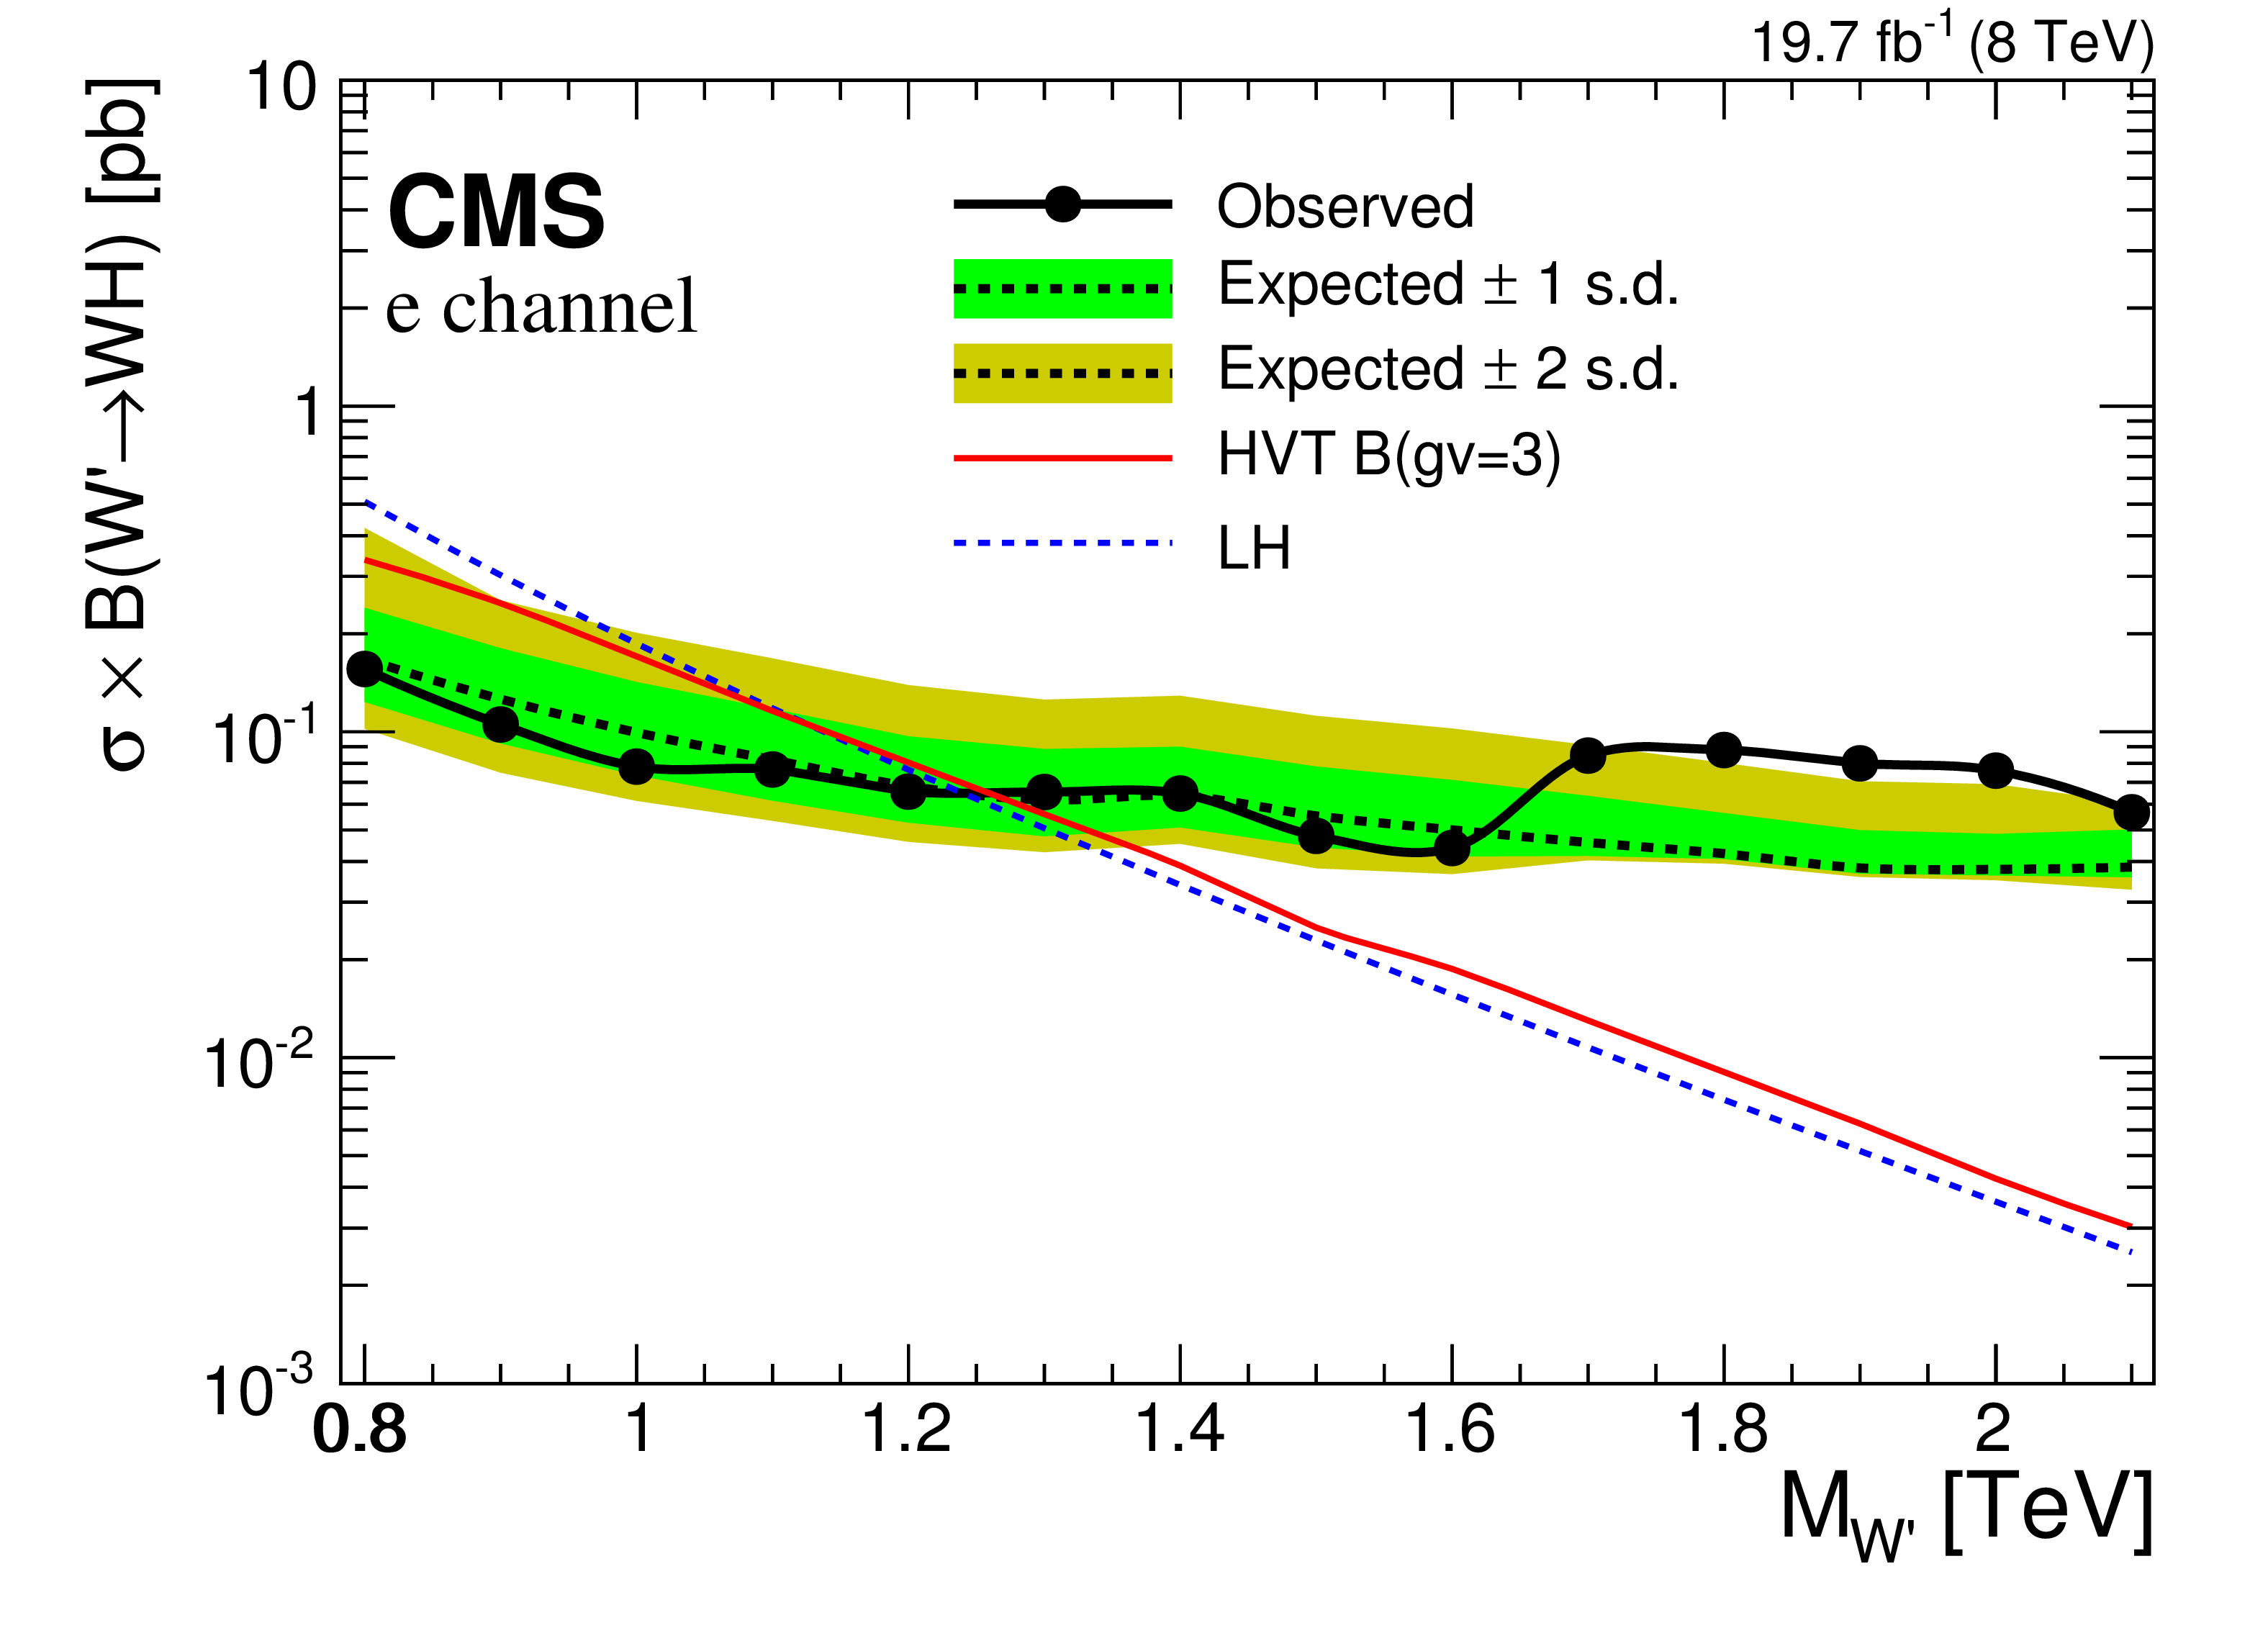
Figure 6-a:
Observed (solid) and expected (dashed) upper limits at 95% CL on the product of the W' production cross section and the branching fraction of $\mathrm{W}^{\prime} \to \mathrm{W H} $ for electron (a) and muon (b) channels, and the combination of the two channels (c). The products of cross sections and branching fractions for W' production in the LH and HVT models are overlaid. |

png pdf |
Figure 6-b:
Observed (solid) and expected (dashed) upper limits at 95% CL on the product of the W' production cross section and the branching fraction of $\mathrm{W}^{\prime} \to \mathrm{W H} $ for electron (a) and muon (b) channels, and the combination of the two channels (c). The products of cross sections and branching fractions for W' production in the LH and HVT models are overlaid. |
png pdf |
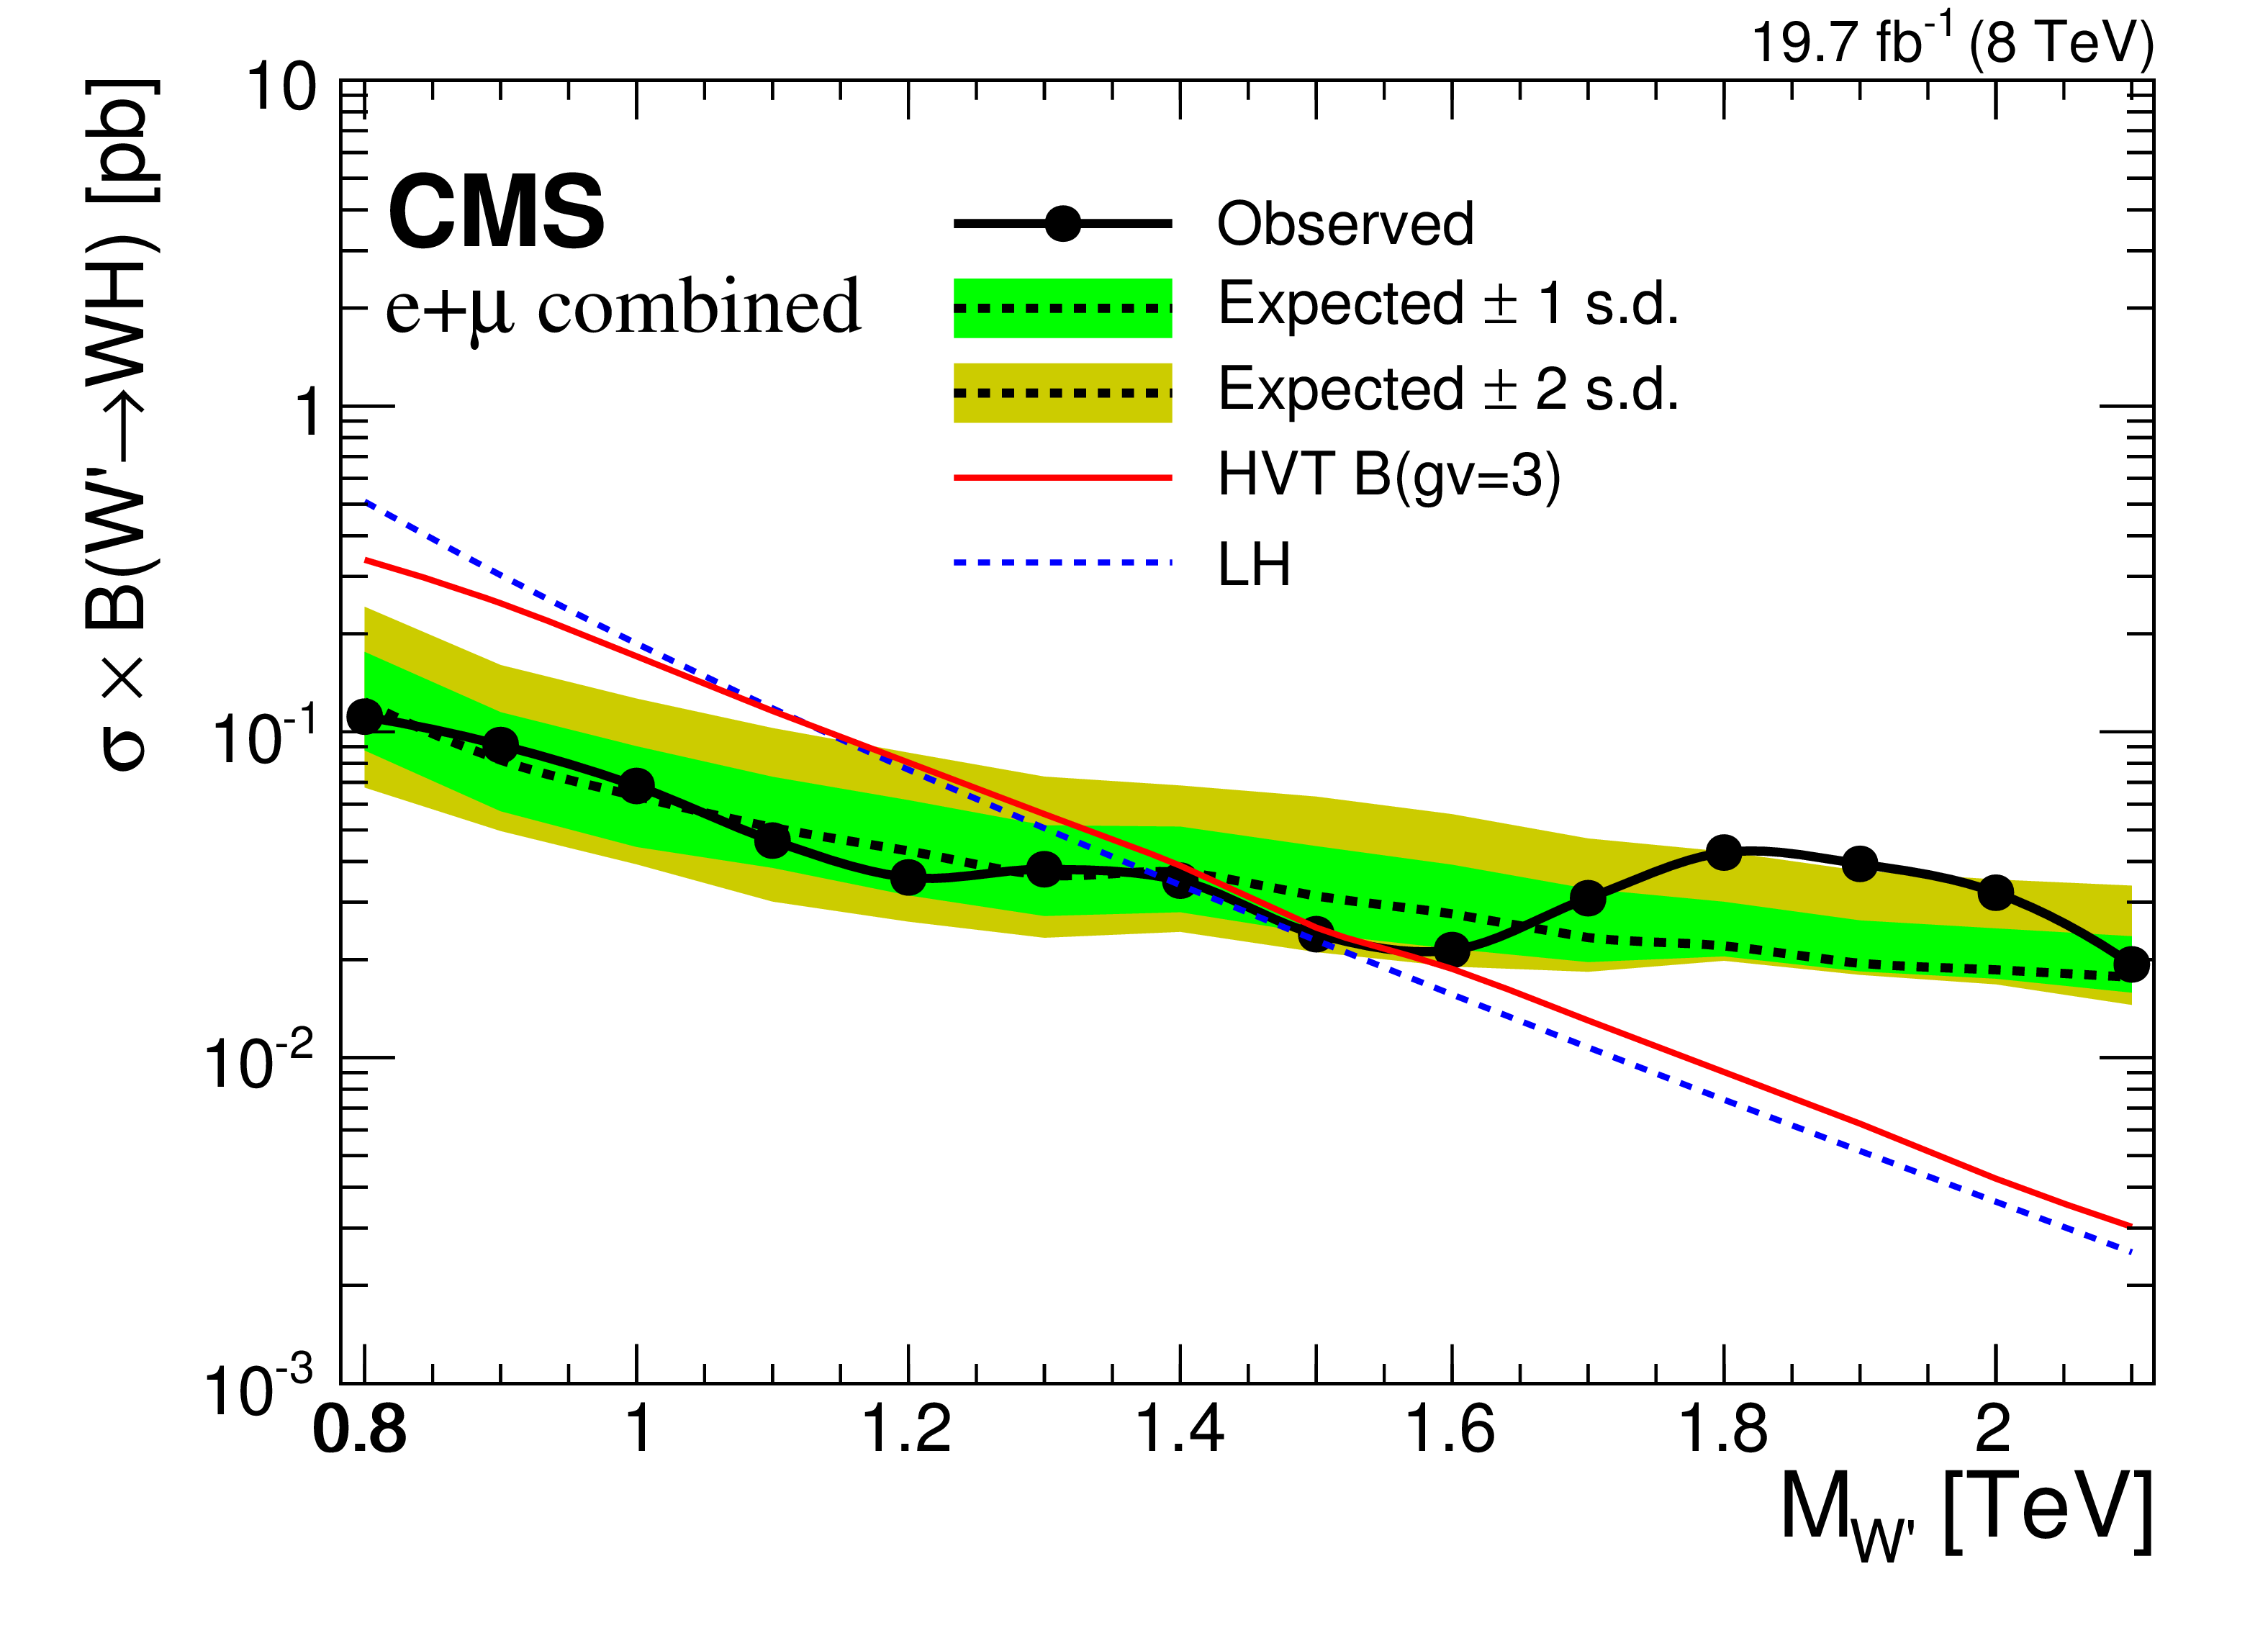
Figure 6-c:
Observed (solid) and expected (dashed) upper limits at 95% CL on the product of the W' production cross section and the branching fraction of $\mathrm{W}^{\prime} \to \mathrm{W H} $ for electron (a) and muon (b) channels, and the combination of the two channels (c). The products of cross sections and branching fractions for W' production in the LH and HVT models are overlaid. |
png pdf |
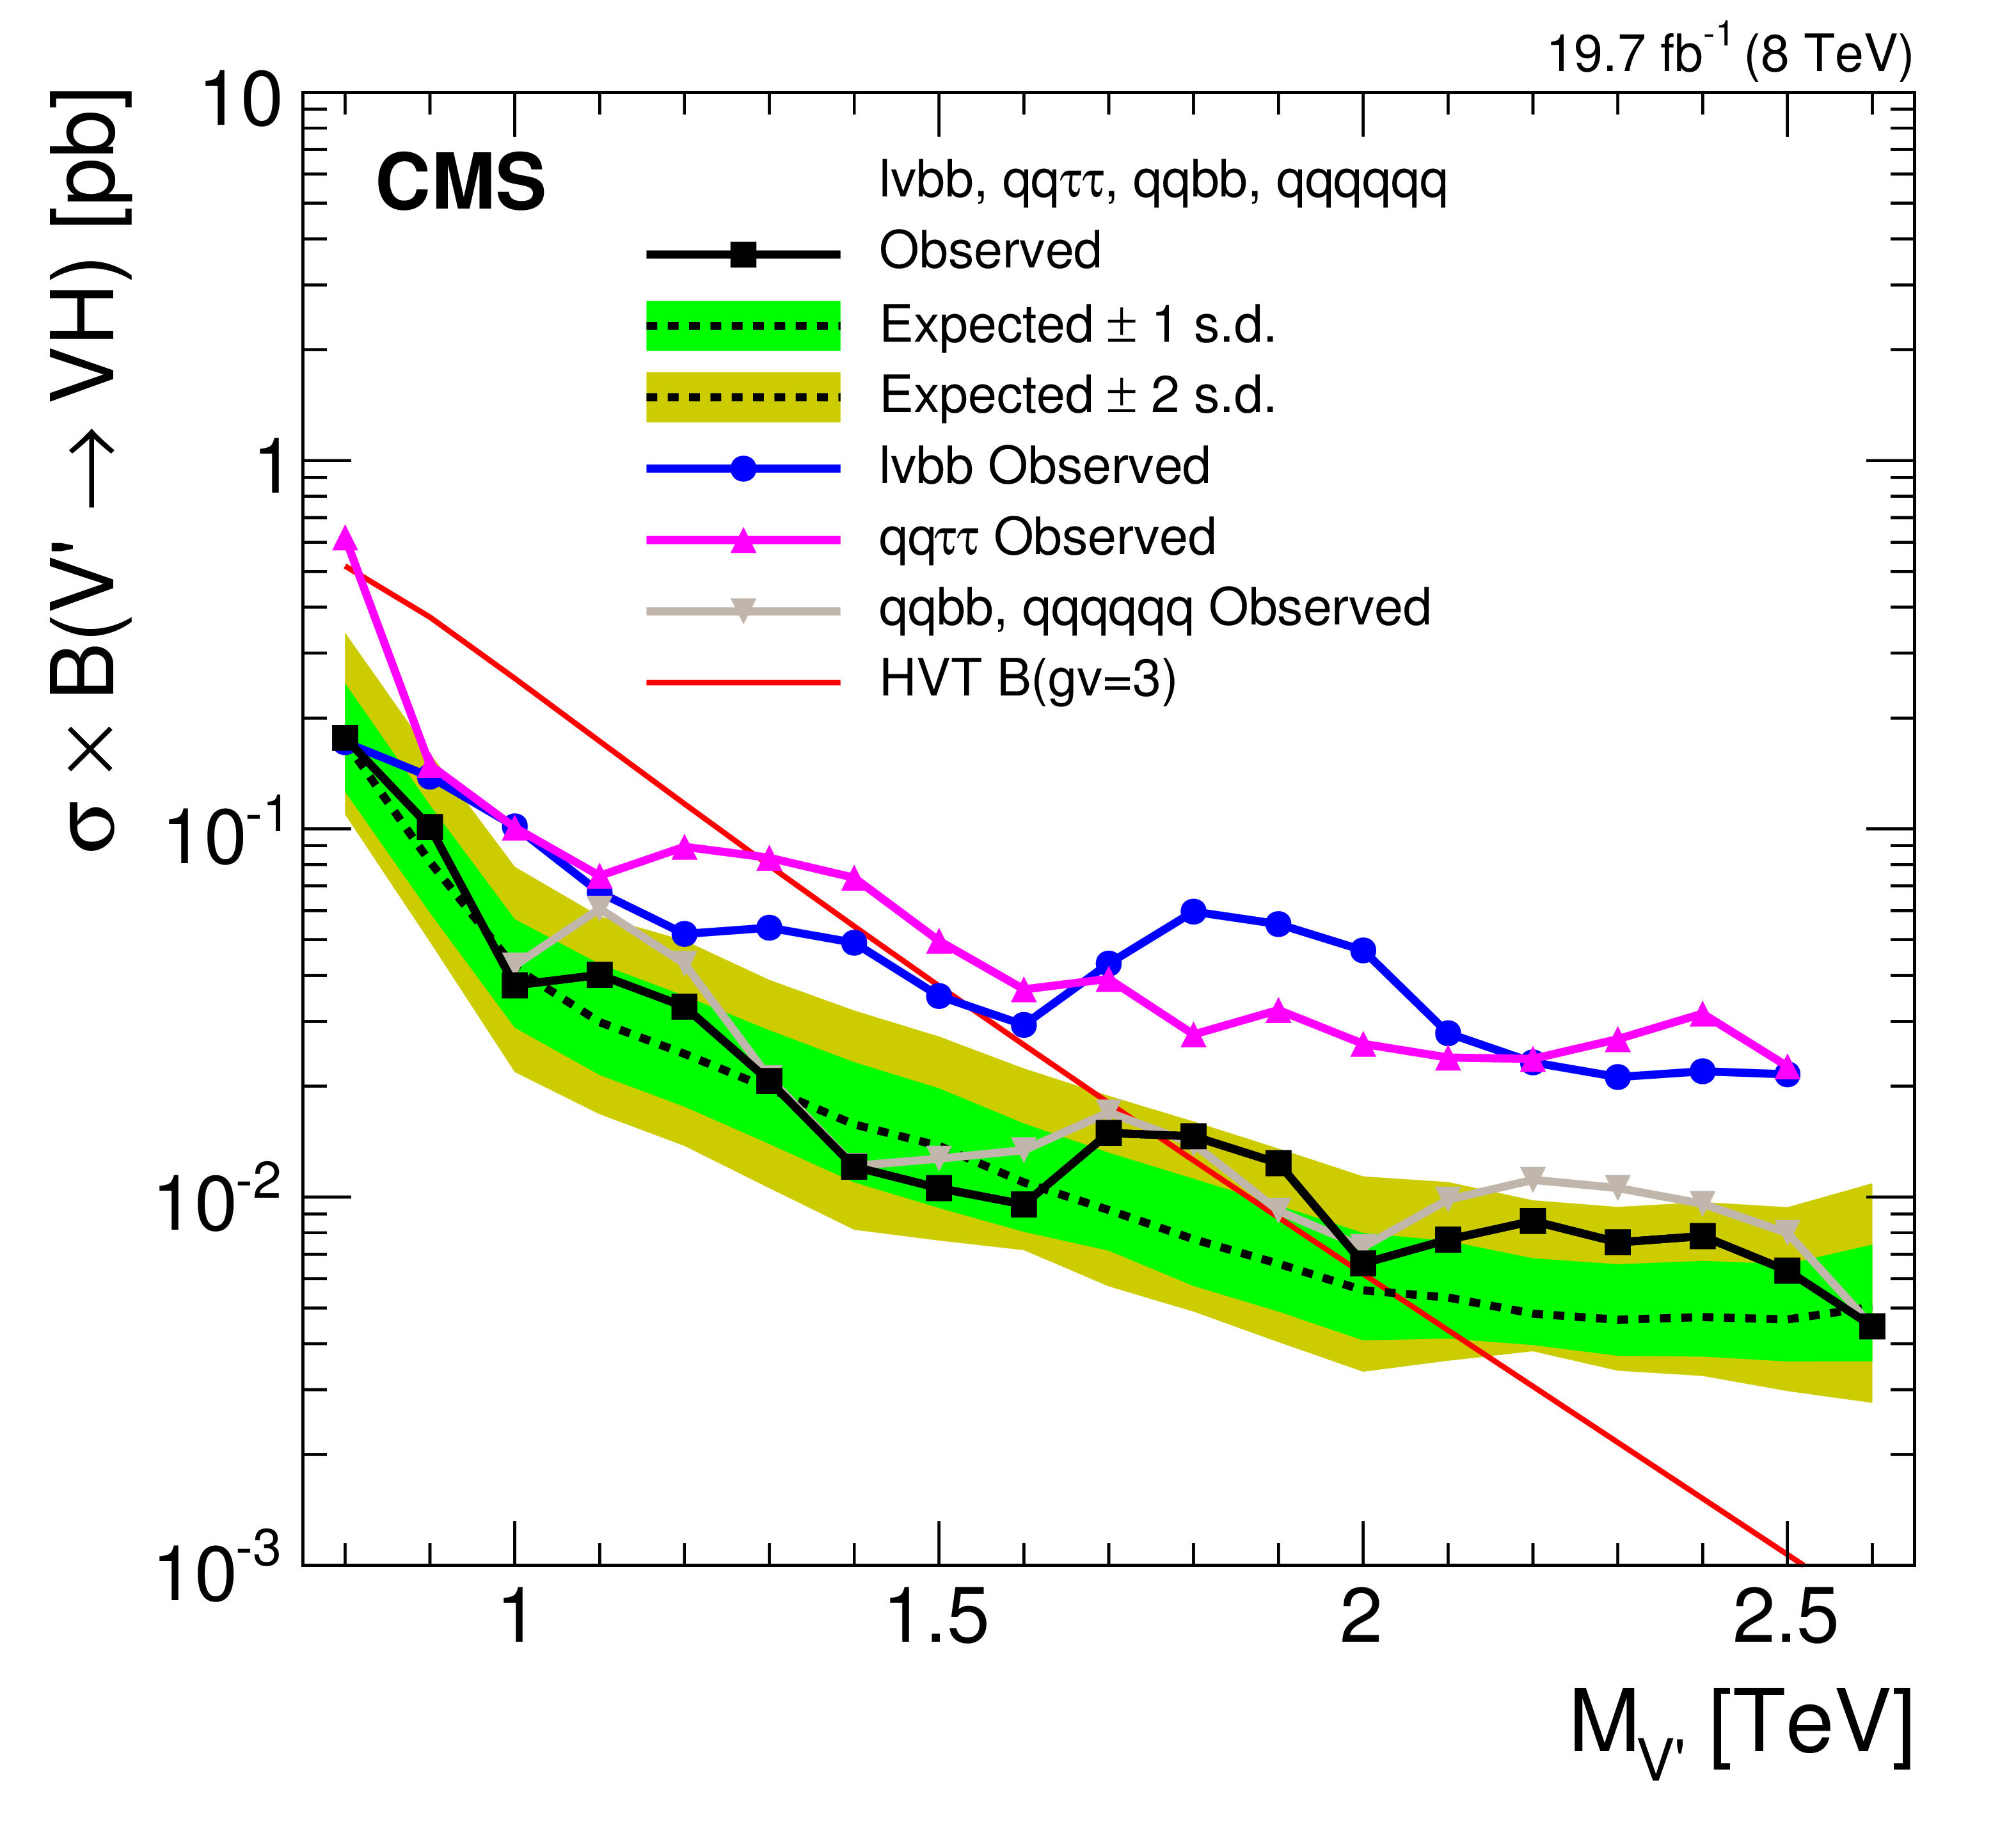
Figure 7:
Observed (full rectangles) and expected (dashed line) combined upper limits at 95% CL on the sum of the W' and Z' production cross sections, weighted by their respective branching fraction of $\mathrm{W}^{\prime} \to \mathrm{W H} $ and $\mathrm{Z}^{\prime} \to \mathrm{Z H} $. The cross section for the production of a W' and Z' in the HVT model B, multiplied by its branching fraction for the relevant process, is overlaid. The observed limits of the three analyses entering the combination in the final states, $\ell \nu \mathrm{ b \bar{b} } $ (full circle), $ \mathrm{ q \bar{q} } \tau ^{+}\tau ^{-}$ [23] (full triangle pointing up), and $ \mathrm{ q \bar{q} } \mathrm{ b \bar{b} } / \mathrm{ q \bar{q} } \mathrm{ q \bar{q} } \mathrm{ q \bar{q} } $ [21] (full triangle pointing down), are overlaid. |
png pdf |
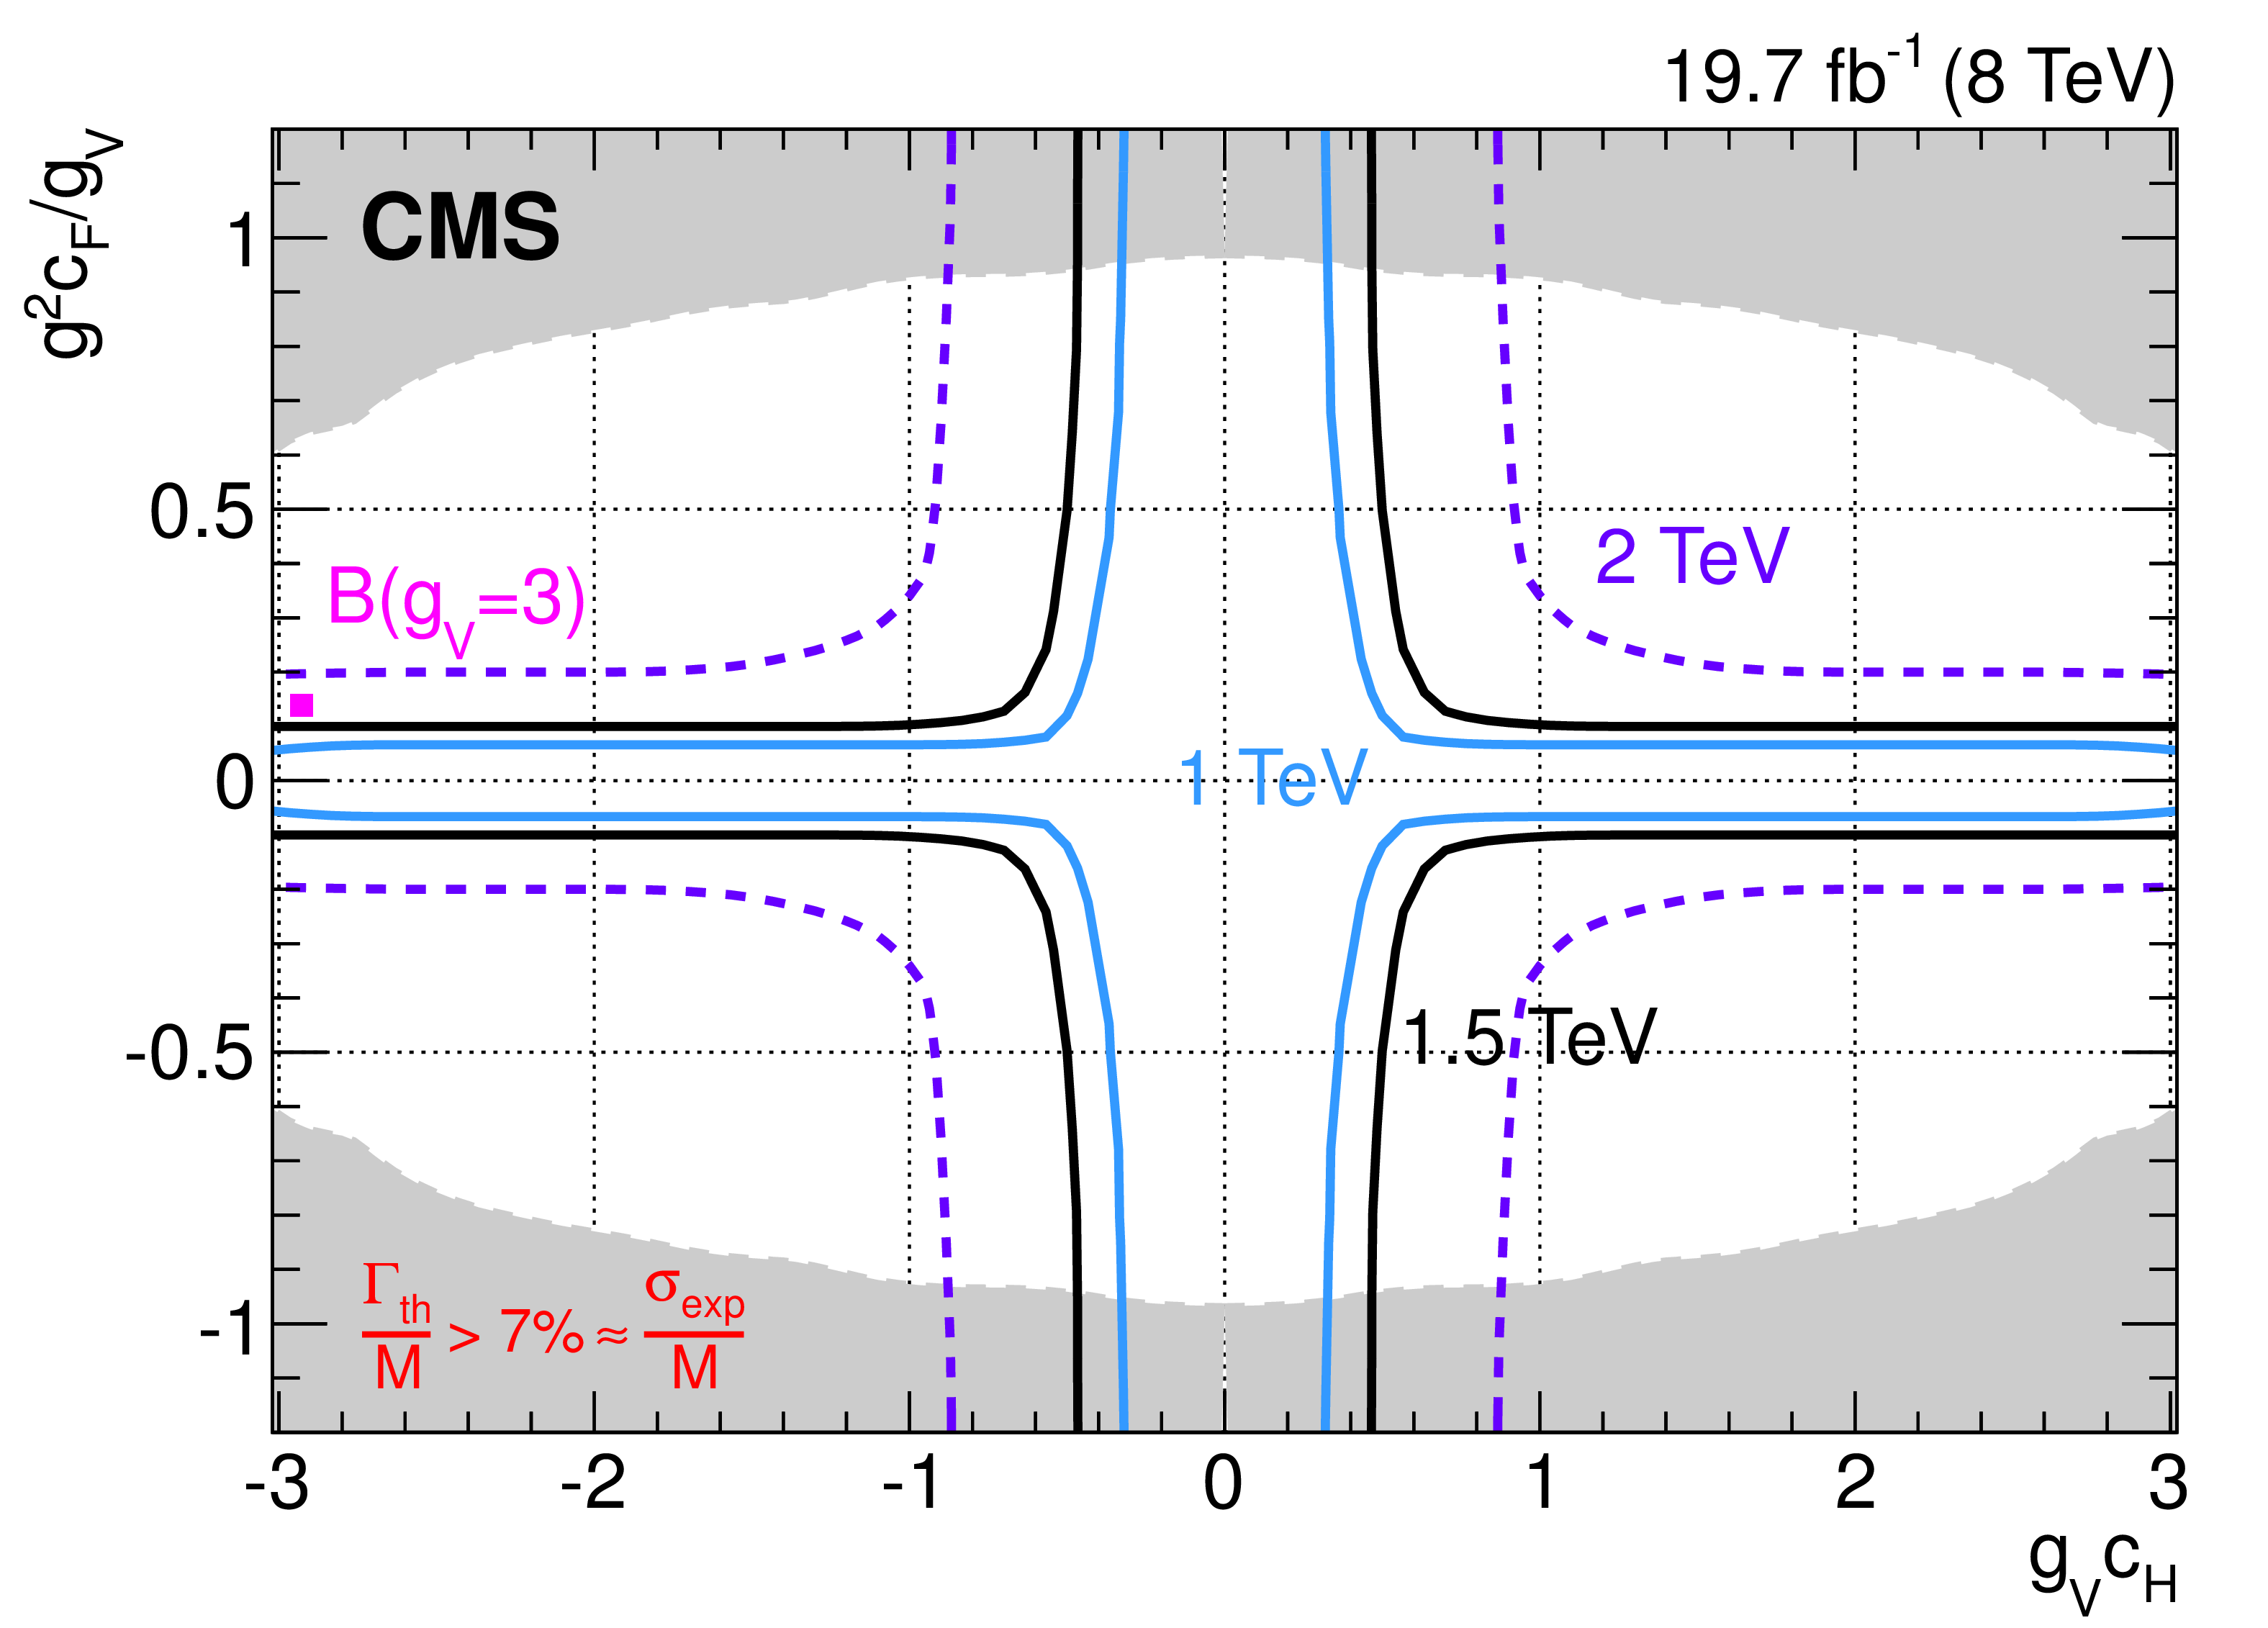
Figure 8:
Exclusion regions in the plane of the HVT-model couplings ($g_ {\mathrm {V}} c_{\mathrm{H}} $, $g^{2}c_\mathrm {F}/g_ {\mathrm {V}} $) for three resonance masses, 1, 1.5, and 2 TeV, where $g$ denotes the weak gauge coupling. The point B of the benchmark model used in the analysis is also shown. The boundaries of the regions outside these lines are excluded by this search are indicated by the solid and dashed lines (region outside these lines is excluded). The areas indicated by the solid shading correspond to regions where the resonance width is predicted to be more than 7% of the resonance mass and the narrow-resonance assumption is not satisfied. |
| Tables | |
png pdf |
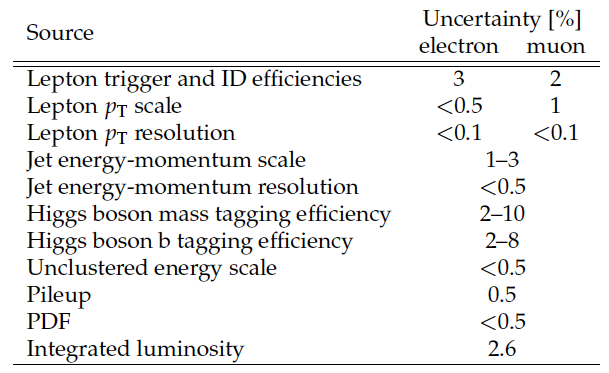
Table 1:
Summary of the systematic uncertainties in the signal yield, relative to the expected number of events. |
png pdf |
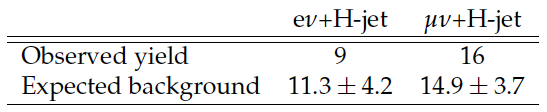
Table 2:
Observed and expected yields in the signal region together with statistical uncertainties. |
png pdf |
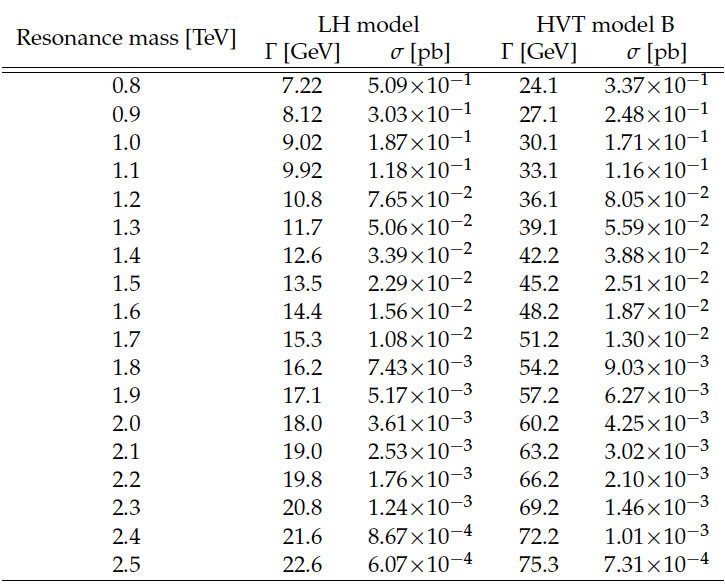
Table 3:
Intrinsic total widths ($\Gamma $) and cross sections ($\sigma $) for the LH model and HVT model B for different resonance masses. The $\mathrm{WH} \to \ell \nu \mathrm{ b \bar{b} } $ branching fraction is not included in the calculation. |
| Summary |
| A search has been presented for new resonances decaying into WH, in which the W boson decays into $\ell\nu$ with $\ell= \mathrm{e}$, $\mu$ and the Higgs boson decays to a pair of bottom quarks. Each event is reconstructed as a leptonic W boson candidate recoiling against a jet with mass compatible with the Higgs boson mass. A specialized b tagging method for Lorentz-boosted Higgs bosons is used to further reduce the background from multijet processes. No excess of events above the standard model prediction is observed in the muon channel, while an excess with a local significance of 2.9 standard deviations is observed in the electron channel near $\mathrm{ M_{WH} } \approx$ 1.8 TeV. The results are statistically compatible with the standard model within 2 standard deviations. In the context of the little Higgs and the heavy vector triplet models, upper limits at 95% confidence level are set on the W' production cross section in a range from 100 to 10 fb for masses between 0.8 and 2.5 TeV, respectively. Within the little Higgs model, a lower limit on the W' mass of 1.4 TeV has been set. A heavy vector triplet model that mimics the properties of composite Higgs models has been excluded up to a W' mass of 1.5 TeV. In this latter context, the results have been combined with related searches, improving the lower limit up to $\approx$1.8 TeV. This combined limit is the most restrictive to date for W' decays to a pair of standard model bosons. |
|
|
Compact Muon Solenoid LHC, CERN |
|

|

|

|

|

|