

Compact Muon Solenoid
LHC, CERN
| CMS-FSQ-12-005 ; CERN-PH-EP-2015-062 | ||
| Measurement of diffractive dissociation cross sections in pp collisions at $\sqrt{s}$ = 7 TeV | ||
| CMS Collaboration | ||
| 30 March 2015 | ||
| Phys. Rev. D 92 (2015) 012003 | ||
| Abstract: Measurements of diffractive dissociation cross sections in pp collisions at $\sqrt{s}$ = 7 TeV are presented in kinematic regions defined by the masses $M_X$ and $M_Y$ of the two final-state hadronic systems separated by the largest rapidity gap in the event. Differential cross sections are measured as a function of $\xi_X$ = $M^2_X / s$ in the region $\log_{10} \xi_X$ between −5.5 and −2.5, for $\log_{10} M_Y$ lower than 0.5, dominated by single dissociation (SD), and $\log_{10} M_Y$ between 0.5 and 1.1, dominated by double dissociation (DD), where $M_X$ and $M_Y$ are given in GeV. The inclusive pp cross section is also measured as a function of the width of the central pseudorapidity gap $\Delta \eta$ for $\Delta \eta$ larger than 3, $\log_{10} M_X$ larger than 1.1, and $\log_{10} M_Y$ larger than 1.1, a region dominated by DD. The cross sections integrated over these regions are used to extract the total SD and DD cross sections. In addition, the inclusive differential cross section, $\mathrm{d}\sigma/\mathrm{d}\Delta \eta^{\mathrm{F}}$, for events with a pseudorapidity gap adjacent to the edge of the detector, is measured over $\Delta \eta^{\mathrm{F}}$ = 8.4 units of pseudorapidity. The results are compared to those of other experiments and to theoretical predictions, and found compatible with slowly-rising diffractive cross sections as a function of center-of-mass energy. | ||
| Links: e-print arXiv:1503.08689 [hep-ex] (PDF) ; CDS record ; inSPIRE record ; Public twiki page ; Rivet record ; CADI line (restricted) ; | ||
| Figures | |
png pdf |
Figure 1:
Schematic diagrams of (a) nondiffractive, $ {\mathrm {p}} {\mathrm {p}}\to {X} $, and diffractive processes with (b) single dissociation, $ {\mathrm {p}} {\mathrm {p}}\to {X} {\mathrm {p}}$ or $ {\mathrm {p}} {\mathrm {p}}\to {\mathrm {p}} {Y} $, (c) double dissociation, $ {\mathrm {p}} {\mathrm {p}}\to {X} {Y} $, and (d) central diffraction, $ {\mathrm {p}} {\mathrm {p}}\to {\mathrm {p}} {X} {\mathrm {p}}$ ; $ {X} $($ {Y} $) represents a dissociated proton or a centrally produced hadronic system. |

png pdf |
Figure 2:
Event topologies in final-state particle $\eta $ space. Detector level: nondiffractive events (ND), diffractive events with a forward pseudorapidity gap on the positive (FG1) or negative (FG2) $\eta $-side of the detector, or with a central pseudorapidity gap (CG). Generator level: (a) ND, $ {\mathrm {p}} {\mathrm {p}}\to {X} $, (b) SD1, $ {\mathrm {p}} {\mathrm {p}}\to {X} {\mathrm {p}}$, (d) SD2, $ {\mathrm {p}} {\mathrm {p}}\to {\mathrm {p}} {Y} $, and (c, e ,f) DD, $ {\mathrm {p}} {\mathrm {p}}\to \mathrm {XY}$, events. The empty box represents the central CMS detector ($ {| \eta | } < 4.7$), filled full boxes indicate final-state hadronic systems or a proton---the vertical thin bar at the right/left end of sketch (b)/(d). The dotted empty boxes in (d) and (e) represent the CASTOR calorimeter ($-6.6<\eta <-5.2$). |
png pdf |
Figure 3:
Detector-level distributions for the (a) $\eta _\text {max}$, (b) $\eta _\text {min}$, and (c) $\Delta \eta ^{0} = \eta ^{0}_\text {max}-\eta ^{0}_\text {min}$ variables measured in the minimum bias sample (with only statistical errors shown), compared to predictions of the PYTHIA 8 MBR simulation normalized to the integrated luminosity of the data sample. Contributions from each of the MC-generated processes, and simulated events with at least two overlapping interactions of any type (pileup), are shown separately. The dashed vertical lines indicate the boundaries for the $\eta _\text {max} < 1$, $\eta _\text {min} > -1$, and $\Delta \eta ^{0} > 3$ selections. |
png pdf |
Figure 4-a:
Simulated distribution of the dissociated mass $M_ {X} $ at stable-particle level for the SD process in the FG2 sample at successive selection stages (trigger, minimal detector activity within BSC acceptance, $\eta _\text {min} > -1$) for PYTHIA 8 MBR (a) and PYTHIA 8 4C (b). |
png pdf |
Figure 4-b:
Simulated distribution of the dissociated mass $M_ {X} $ at stable-particle level for the SD process in the FG2 sample at successive selection stages (trigger, minimal detector activity within BSC acceptance, $\eta _\text {min} > -1$) for PYTHIA 8 MBR (a) and PYTHIA 8 4C (b). |
png pdf |
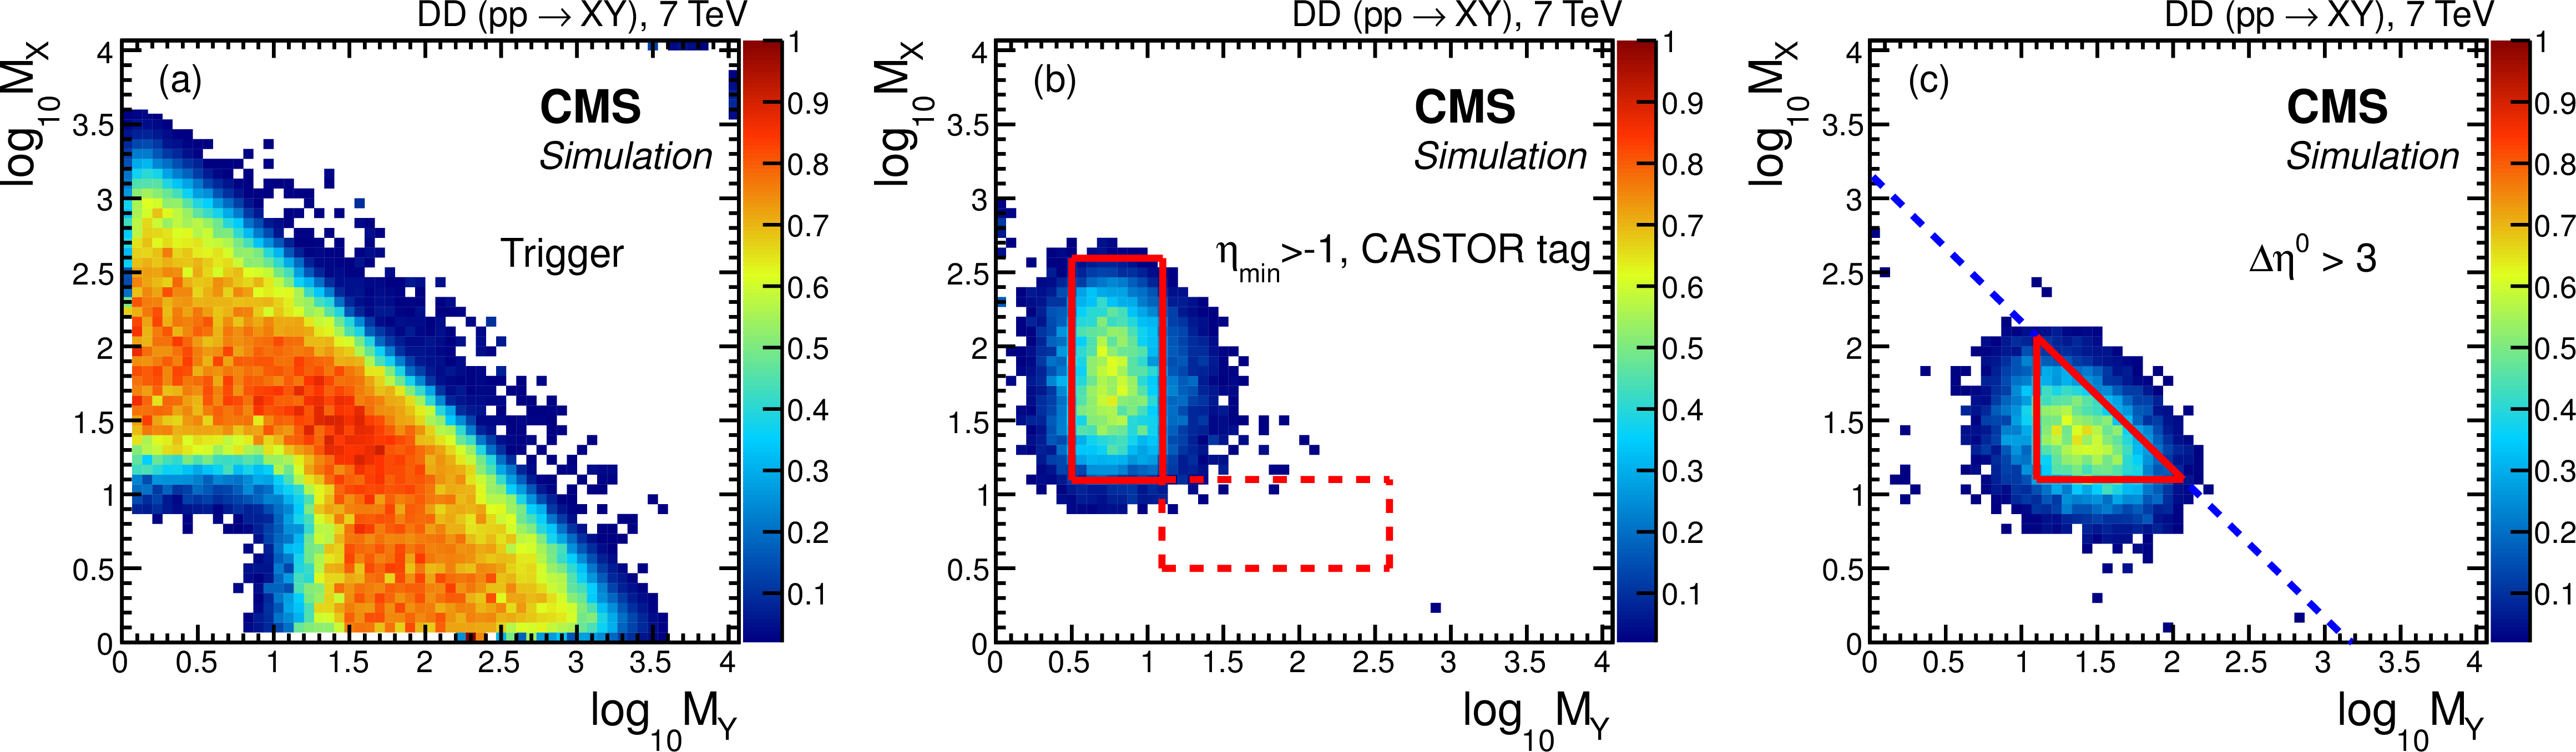
Figure 5:
Simulated (PYTHIA 8 MBR ) event selection efficiency in the $M_ {X} $ vs. $M_ {Y} $ plane for true DD events after (a) the trigger selection, and (b) the FG2 selection with a CASTOR tag or (c) the CG selection (Fig. 2). The regions confined by the solid (red) lines in (b) and (c) are those of the cross section measurements; the dashed (red) box in (b) corresponds to an enlarged region, assuming the same cross section dependence on $M_ {X} $ and $M_ {Y} $; the dashed (blue) line in (c) marks the region of $\Delta \eta > 3$. |

png pdf |
Figure 6:
Two-dimensional distribution of reconstructed $\xi ^{+}_ {X} $ vs. generated $\xi _ {X} $ values for the events in the SD2 sample obtained with the PYTHIA 8 MBR simulation. The solid red line represents the condition $\log_{10}\xi ^{+}_ {X} =\log_{10}\xi _ {X} $. |

png pdf |
Figure 7-a:
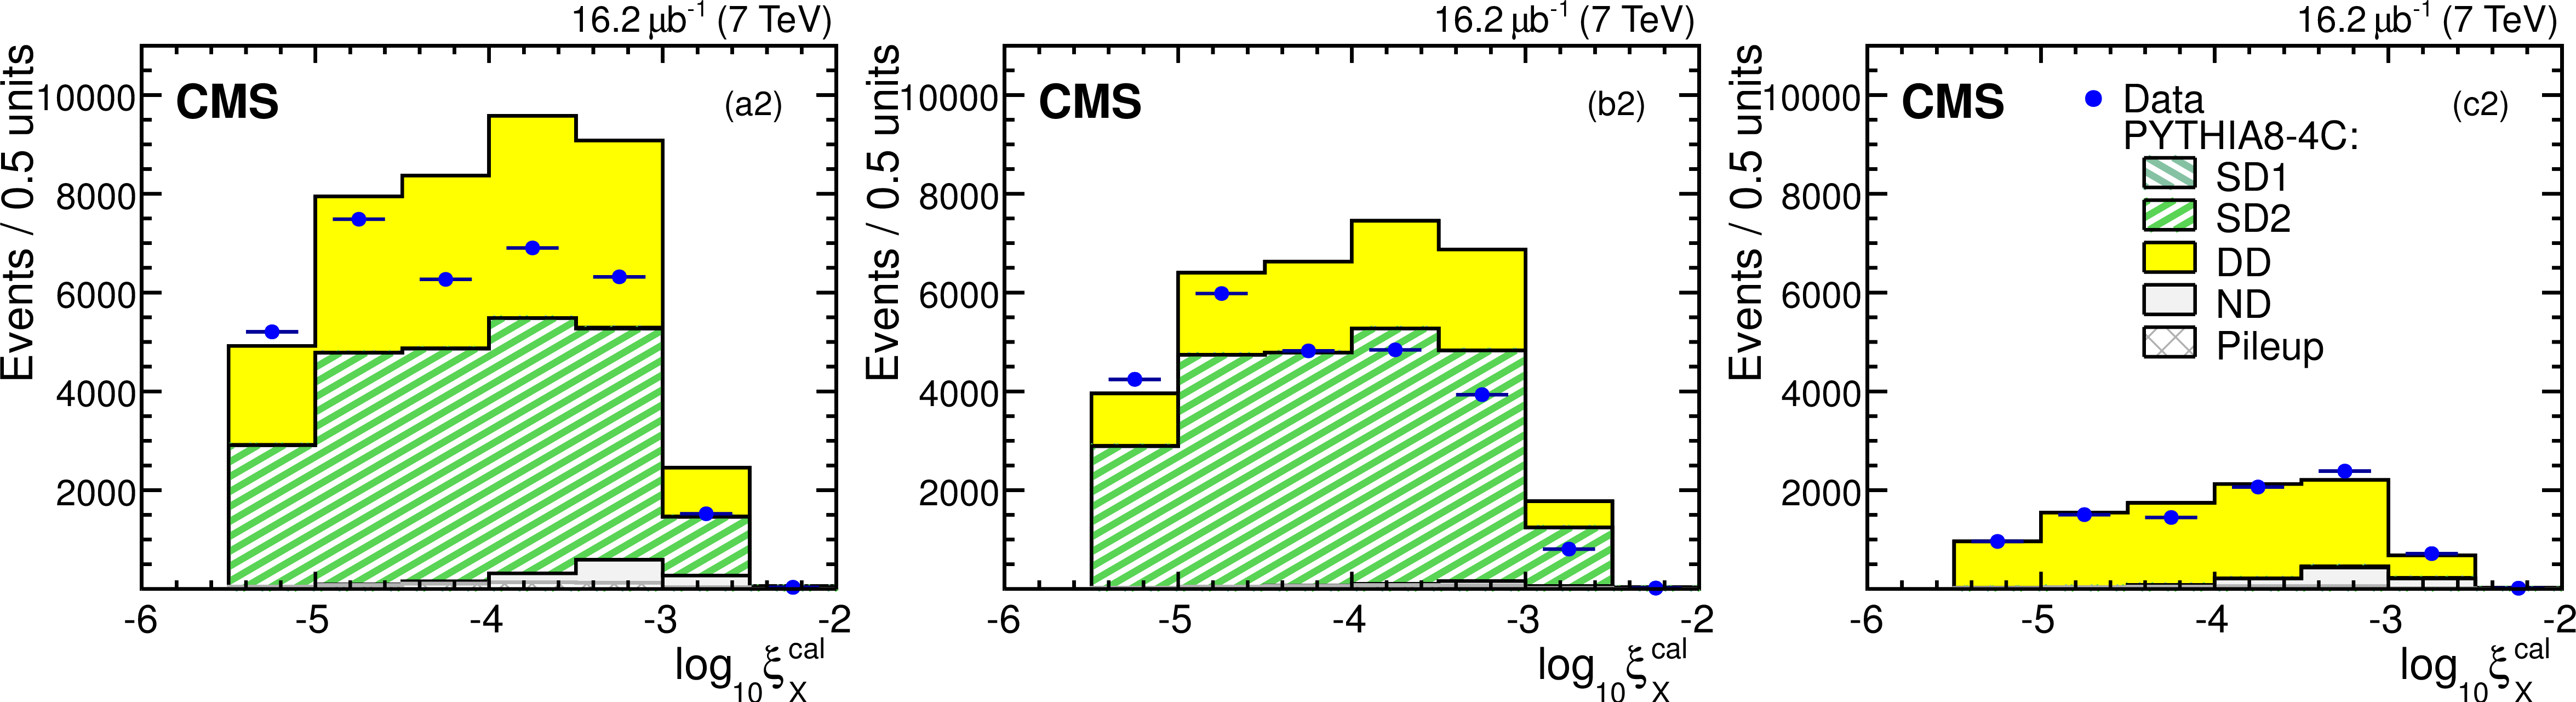
Detector-level distributions of the reconstructed and calibrated $\xi _ {X} $ for (a) the entire FG2 sample, and the FG2 subsamples with (b) no CASTOR tag, and (c) a CASTOR tag (statistical errors only). The data are compared to the predictions of the PYTHIA 8 MBR (top three plots) and PYTHIA 8 4C (bottom three plots) simulations, which are normalized to the integrated luminosity of the data sample. The contribution of each of the generated processes is shown separately. |
png pdf |
Figure 7-b:
Detector-level distributions of the reconstructed and calibrated $\xi _ {X} $ for (a) the entire FG2 sample, and the FG2 subsamples with (b) no CASTOR tag, and (c) a CASTOR tag (statistical errors only). The data are compared to the predictions of the PYTHIA 8 MBR (top three plots) and PYTHIA 8 4C (bottom three plots) simulations, which are normalized to the integrated luminosity of the data sample. The contribution of each of the generated processes is shown separately. |
png pdf |
Figure 8-a:
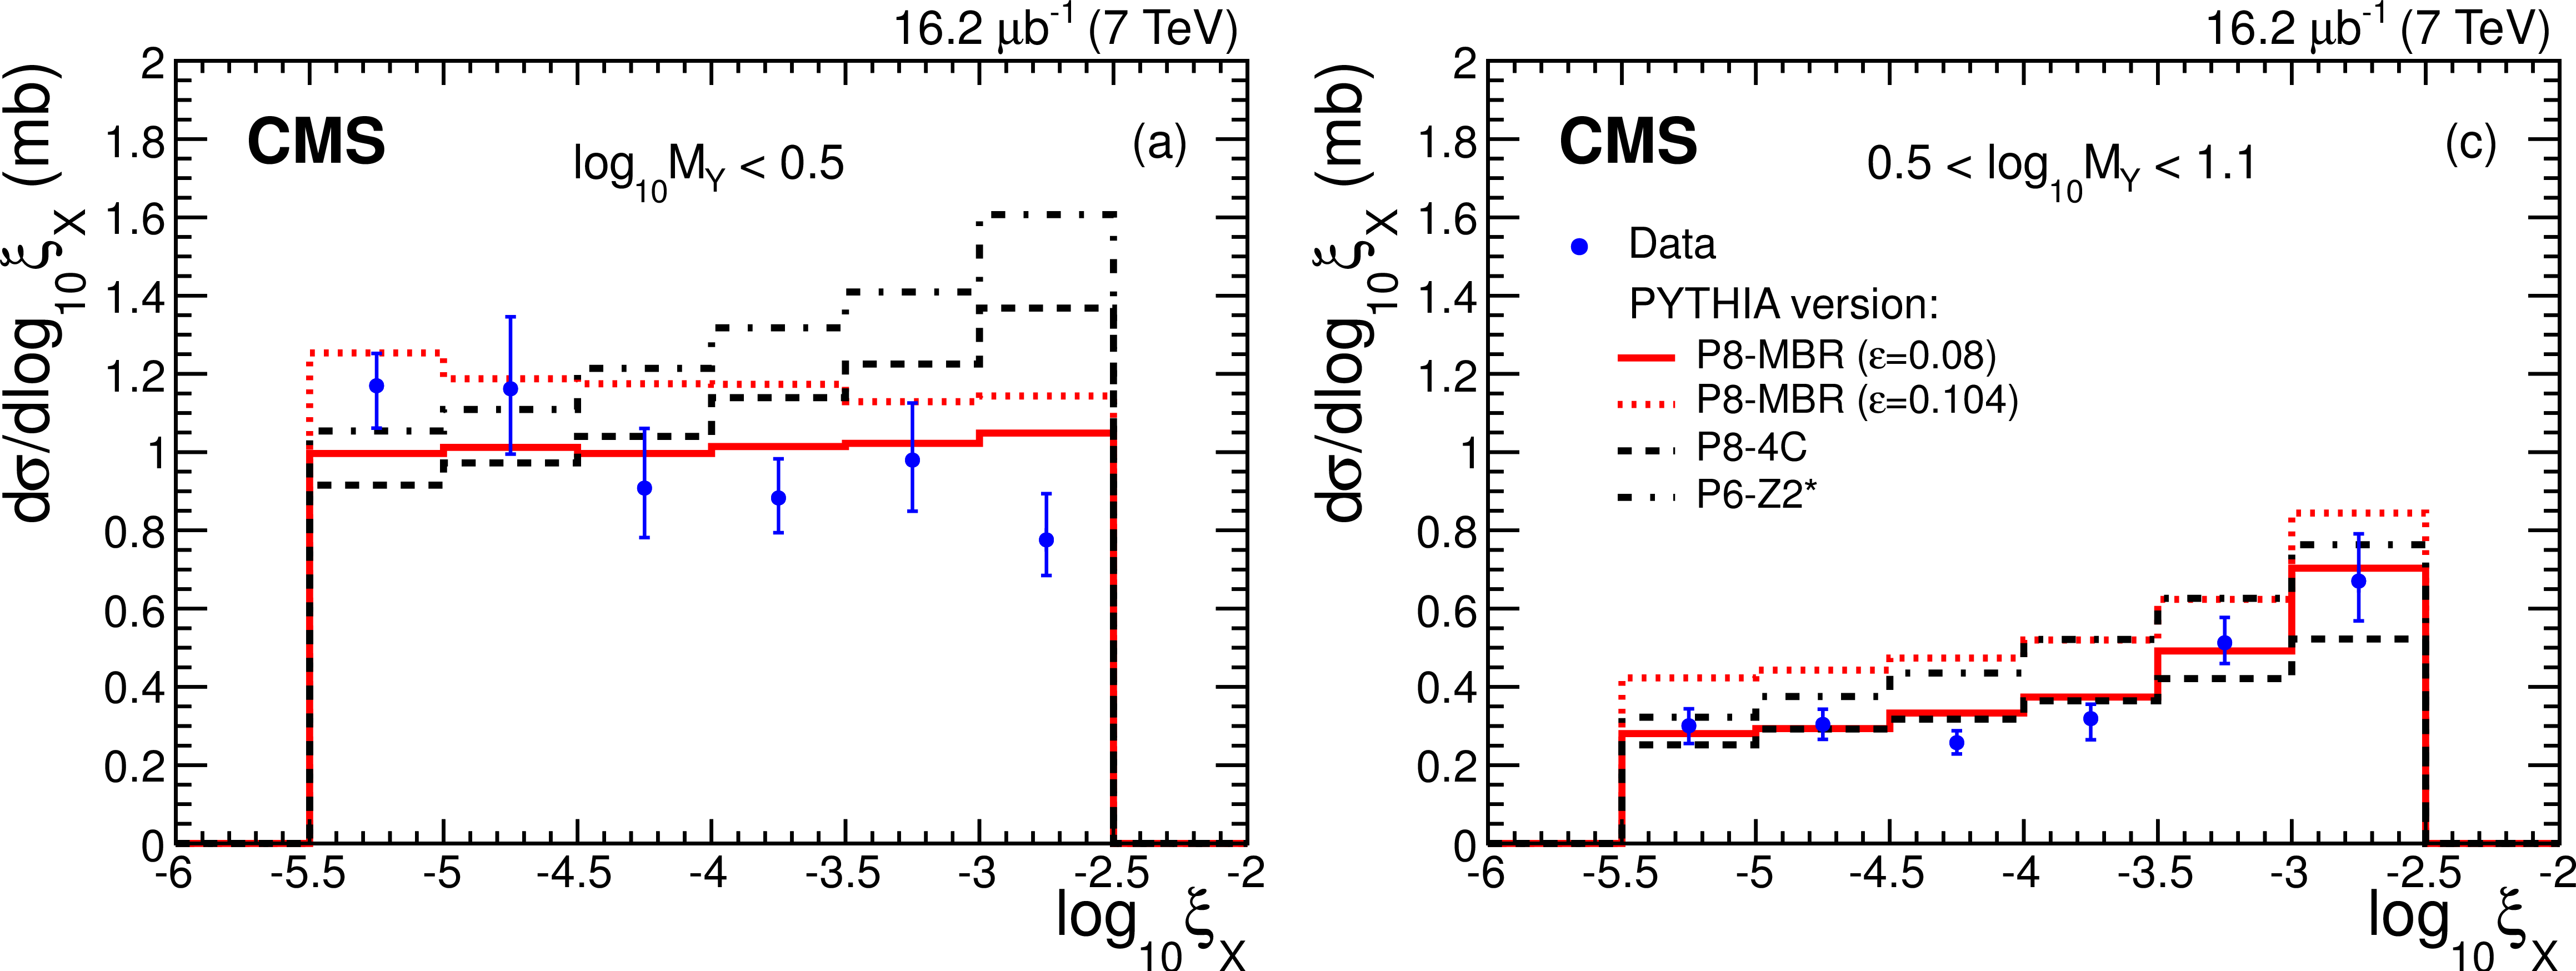
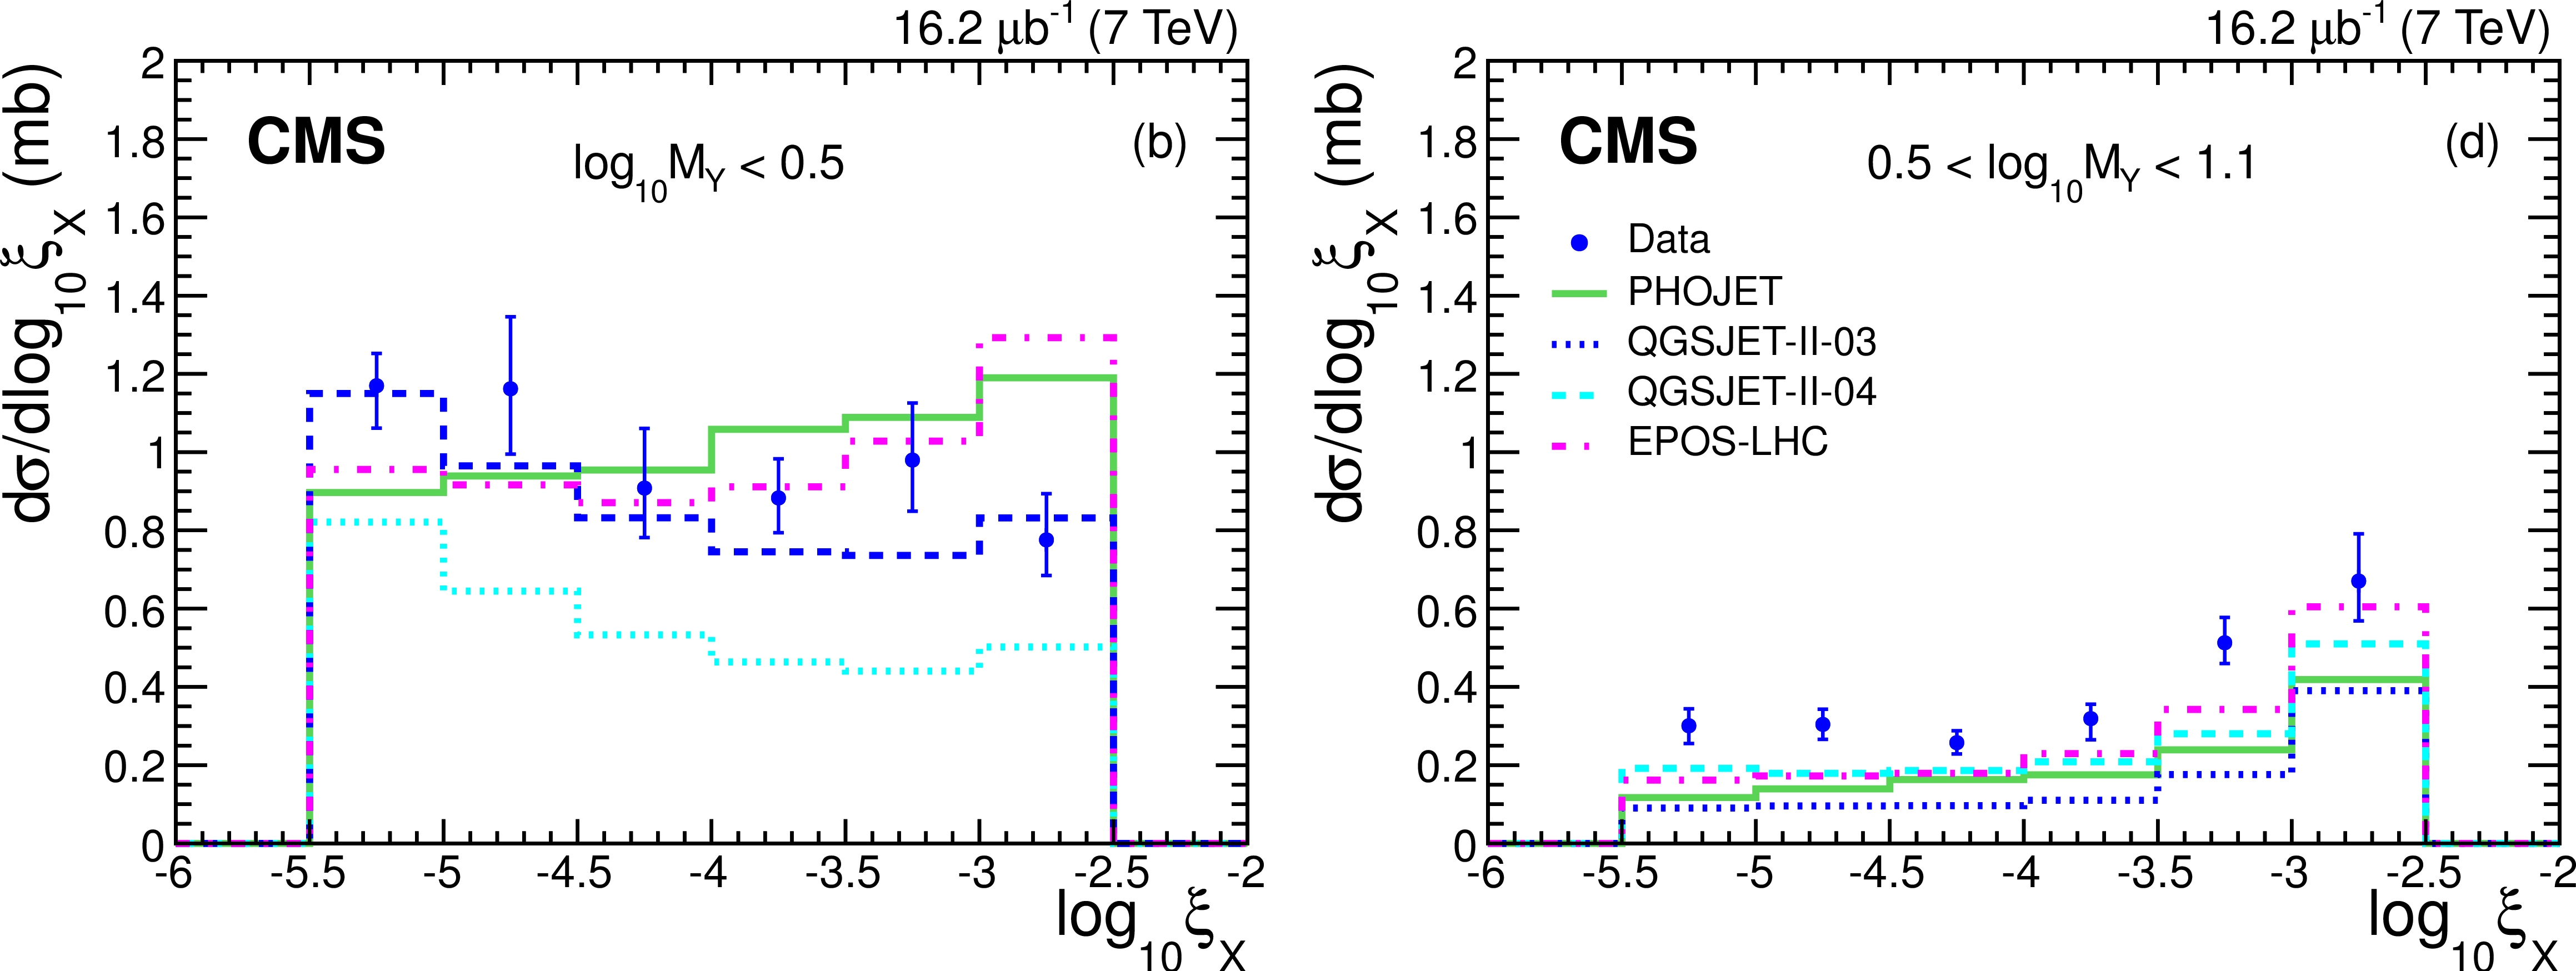
Cross sections $ {\mathrm {d}}\sigma / {\mathrm {d}}\log_{10}\xi _ {X} $ for $\log_{10} M_ {Y} < 0.5$ (SD dominated, left panels) and $0.5<\log_{10}M_ {Y} <1.1$ (DD dominated, right panels) compared to MC predictions: (top) PYTHIA 8 MBR, PYTHIA 8 4C, PYTHIA Z2*, and (bottom) PHOJET, QGSJET-II 03, QGSJET-II 04, EPOS. Error bars are dominated by systematic uncertainties (discussed in the Section on systematics). |
png pdf |
Figure 8-b:
Cross sections $ {\mathrm {d}}\sigma / {\mathrm {d}}\log_{10}\xi _ {X} $ for $\log_{10} M_ {Y} < 0.5$ (SD dominated, left panels) and $0.5<\log_{10}M_ {Y} <1.1$ (DD dominated, right panels) compared to MC predictions: (top) PYTHIA 8 MBR, PYTHIA 8 4C, PYTHIA Z2*, and (bottom) PHOJET, QGSJET-II 03, QGSJET-II 04, EPOS. Error bars are dominated by systematic uncertainties (discussed in the Section on systematics). |
png pdf |
Figure 9-a:
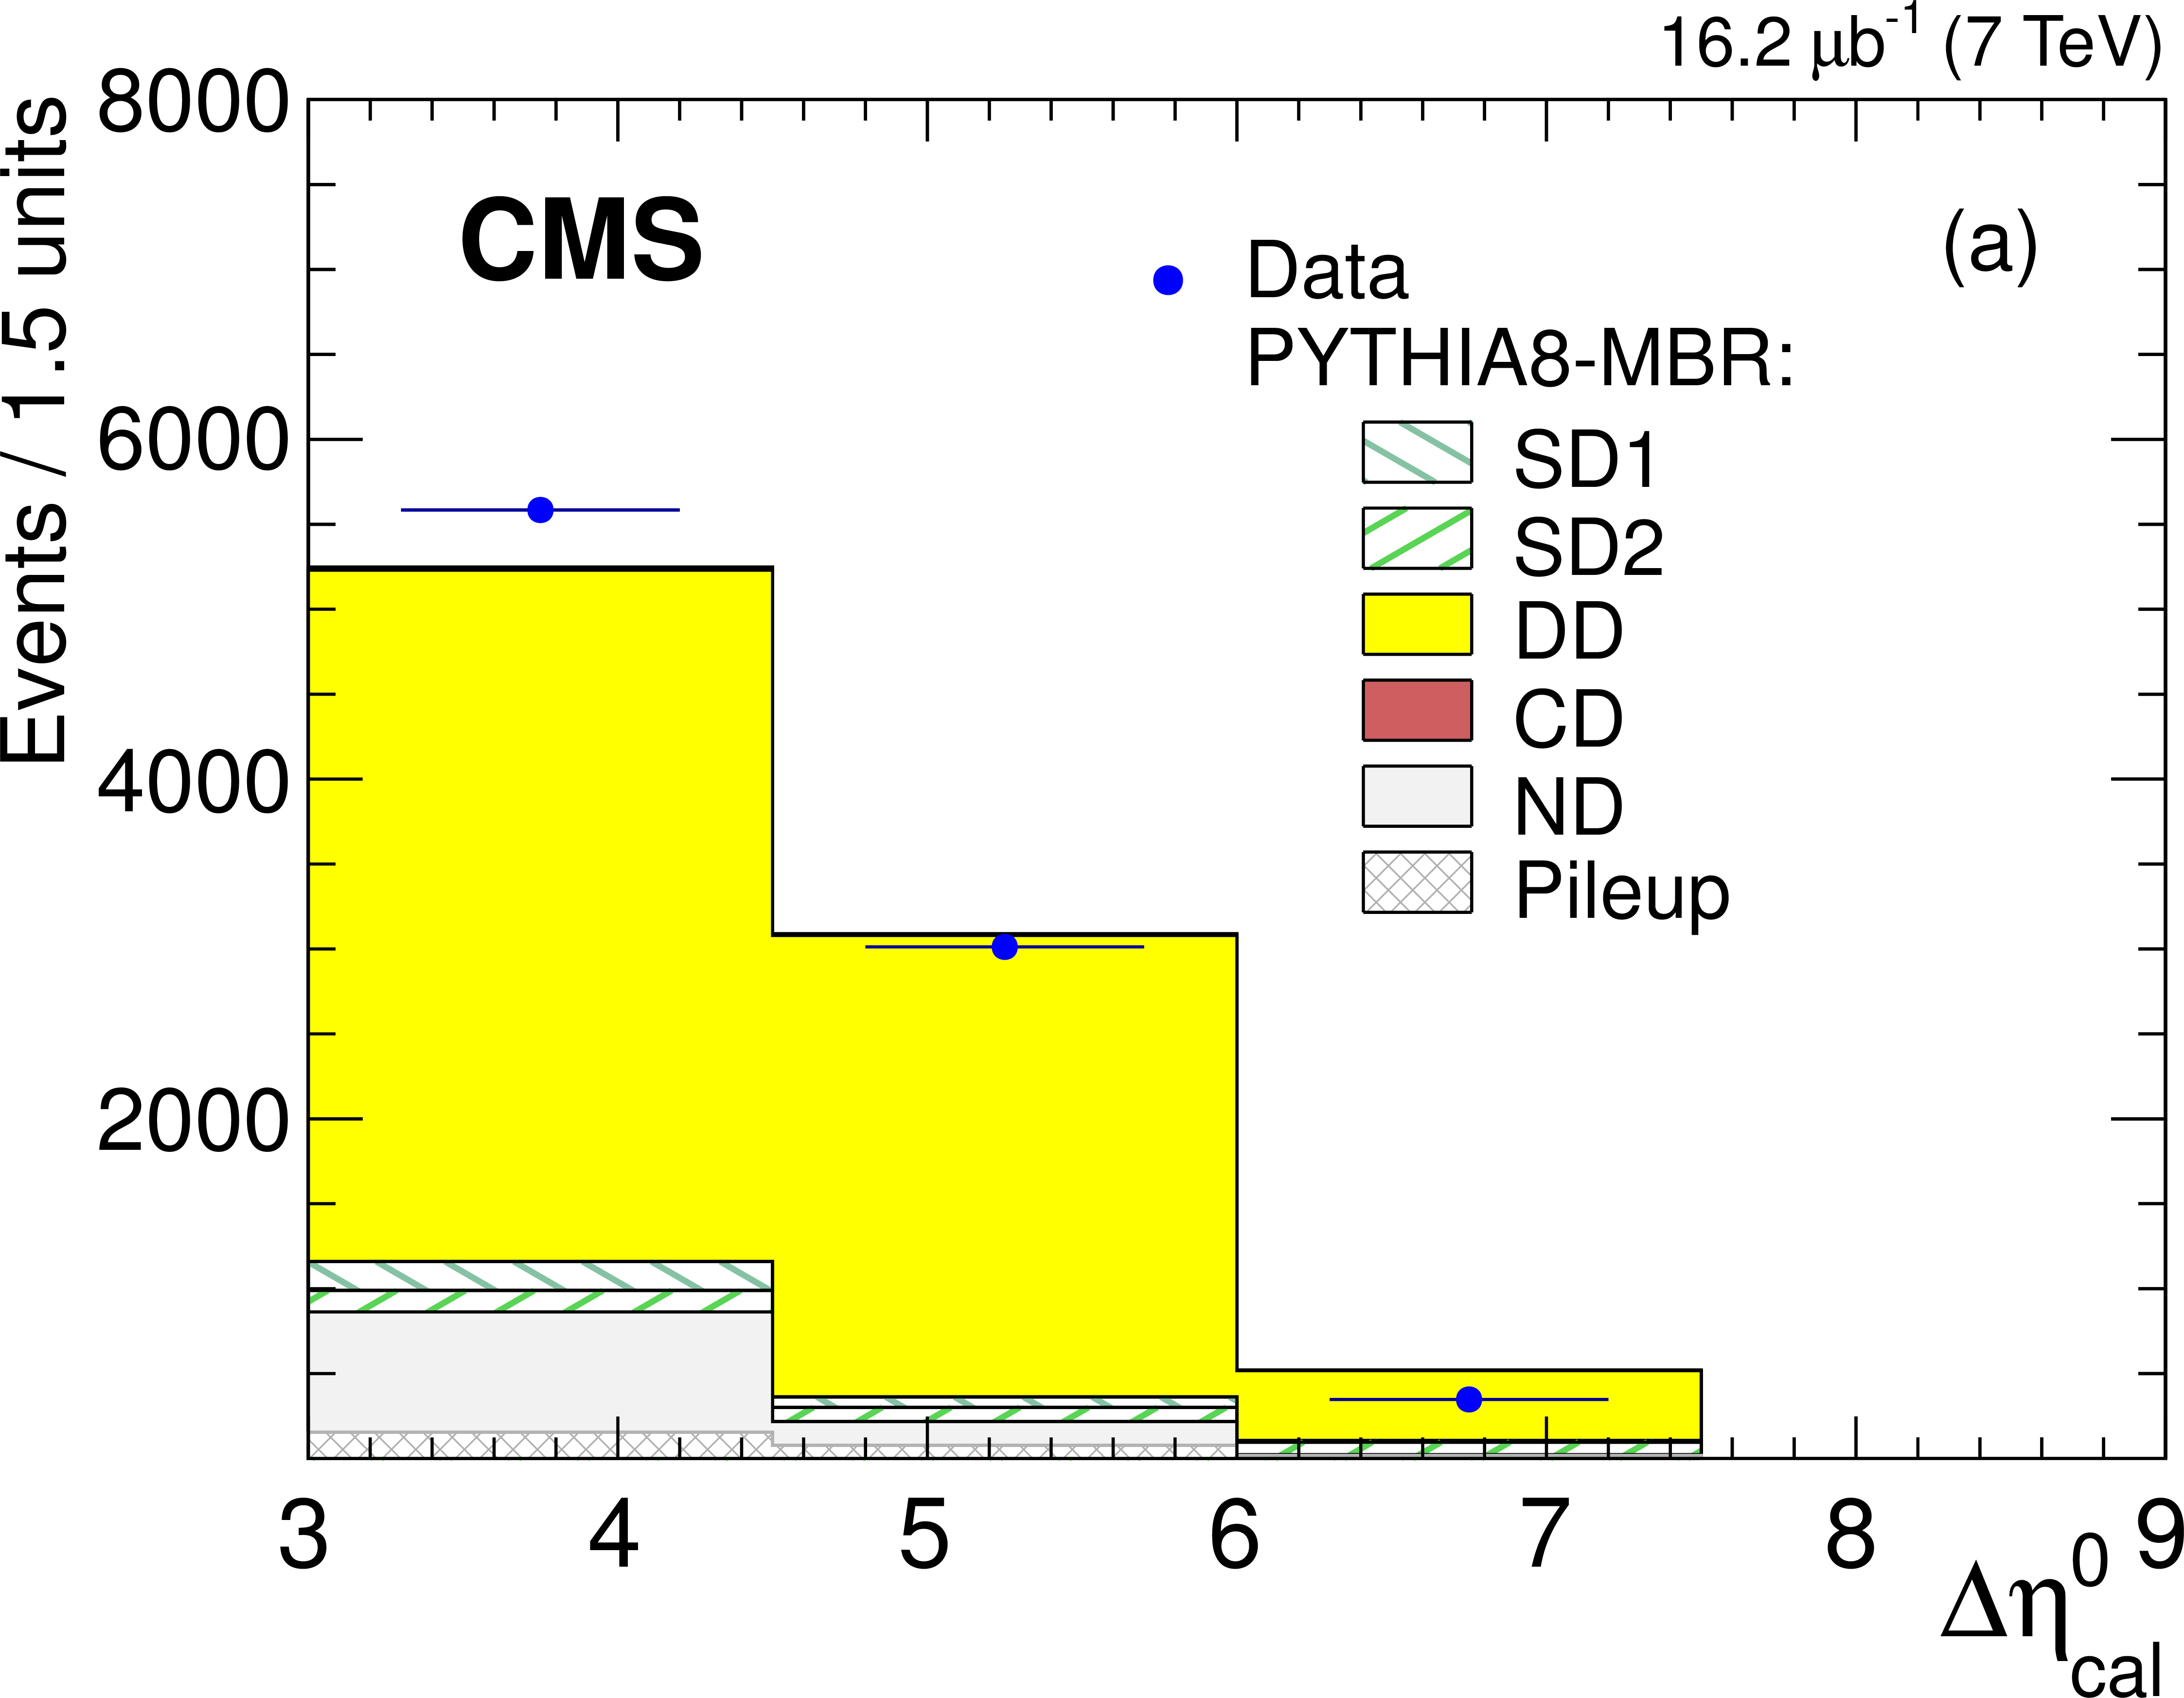
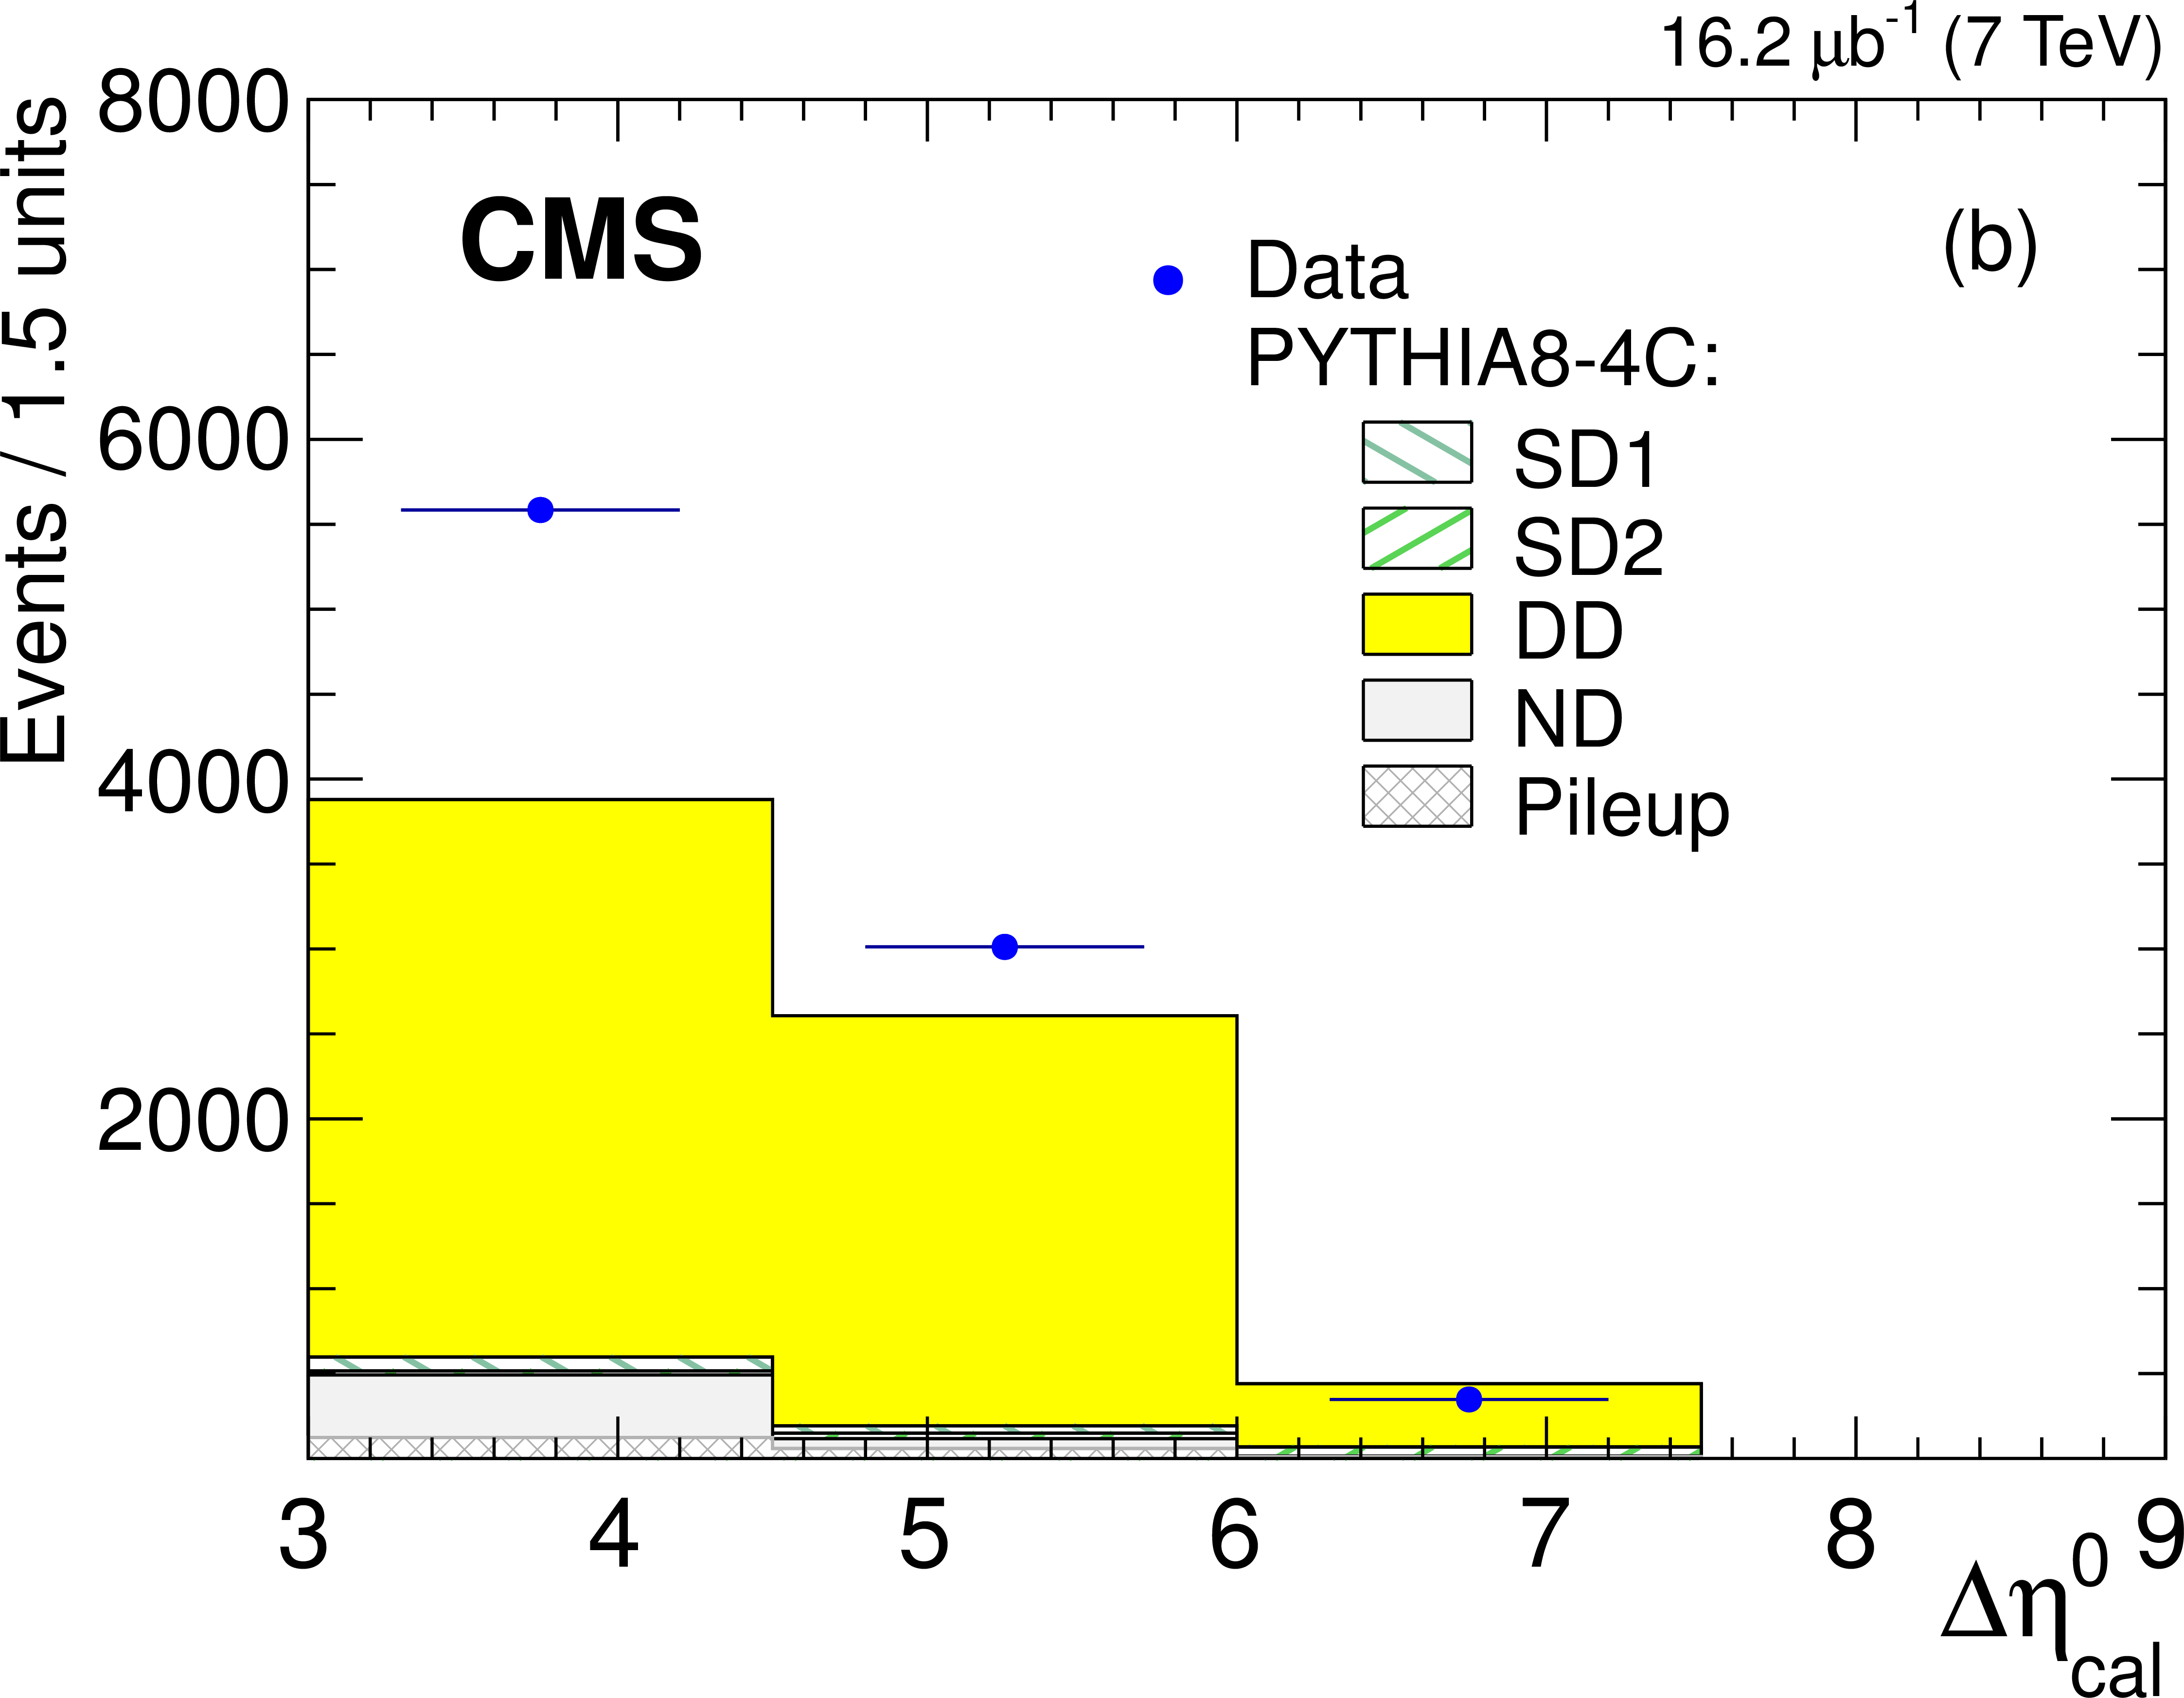
Detector-level distributions of reconstructed and calibrated $\Delta \eta ^{0}$ values for the measured CG sample with a central LRG. The data are compared to predictions of (a) PYTHIA 8 MBR , and (b) PYTHIA 8 4C simulations normalized to the integrated luminosity of the data sample. Contributions for each of the generated processes are shown separately. |
png pdf |
Figure 9-b:
Detector-level distributions of reconstructed and calibrated $\Delta \eta ^{0}$ values for the measured CG sample with a central LRG. The data are compared to predictions of (a) PYTHIA 8 MBR , and (b) PYTHIA 8 4C simulations normalized to the integrated luminosity of the data sample. Contributions for each of the generated processes are shown separately. |
png pdf |
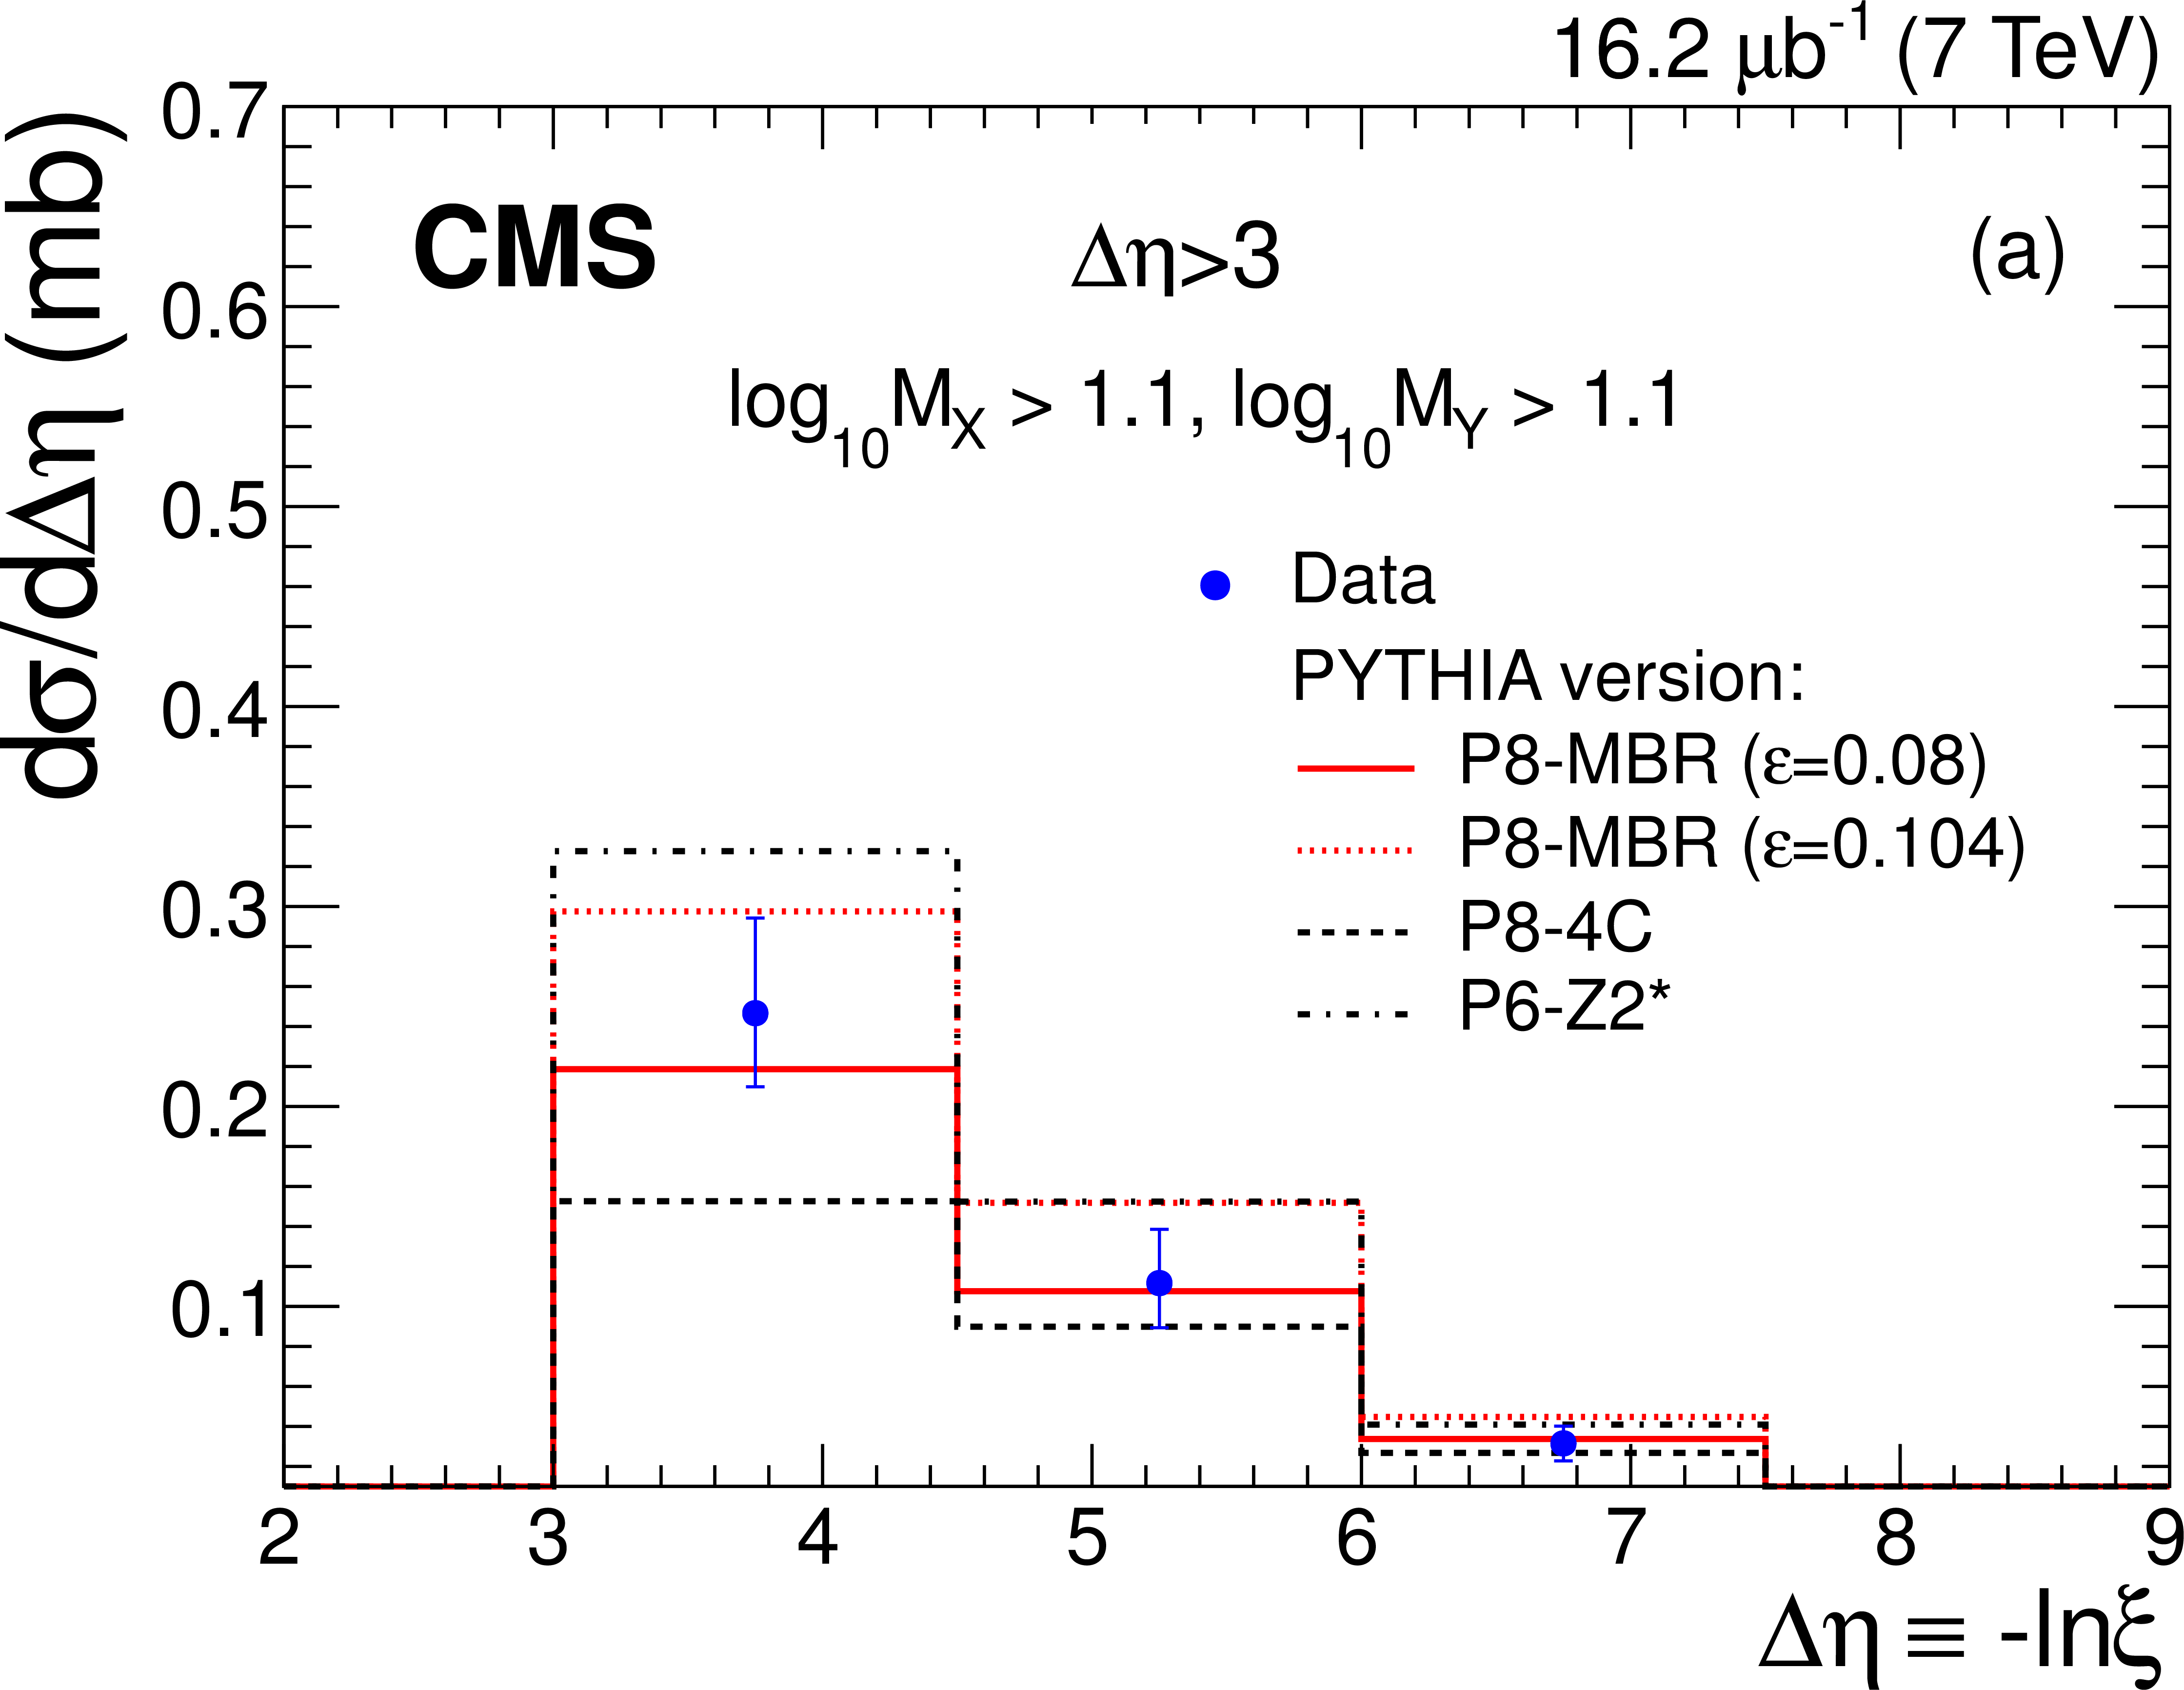
Figure 10-a:
The central pseudorapidity-gap cross section $ {\mathrm {d}}\sigma / {\mathrm {d}}\Delta \eta $ (DD dominated) compared to MC predictions: (a) PYTHIA 8 MBR, PYTHIA 8 4C, and PYTHIA 6 Z2*, and (b) PHOJET, QGSJET-II 03, QGSJET-II 04, and EPOS. Error bars are dominated by systematic uncertainties, which are discussed in the Section on systematic uncertainties. |
png pdf |
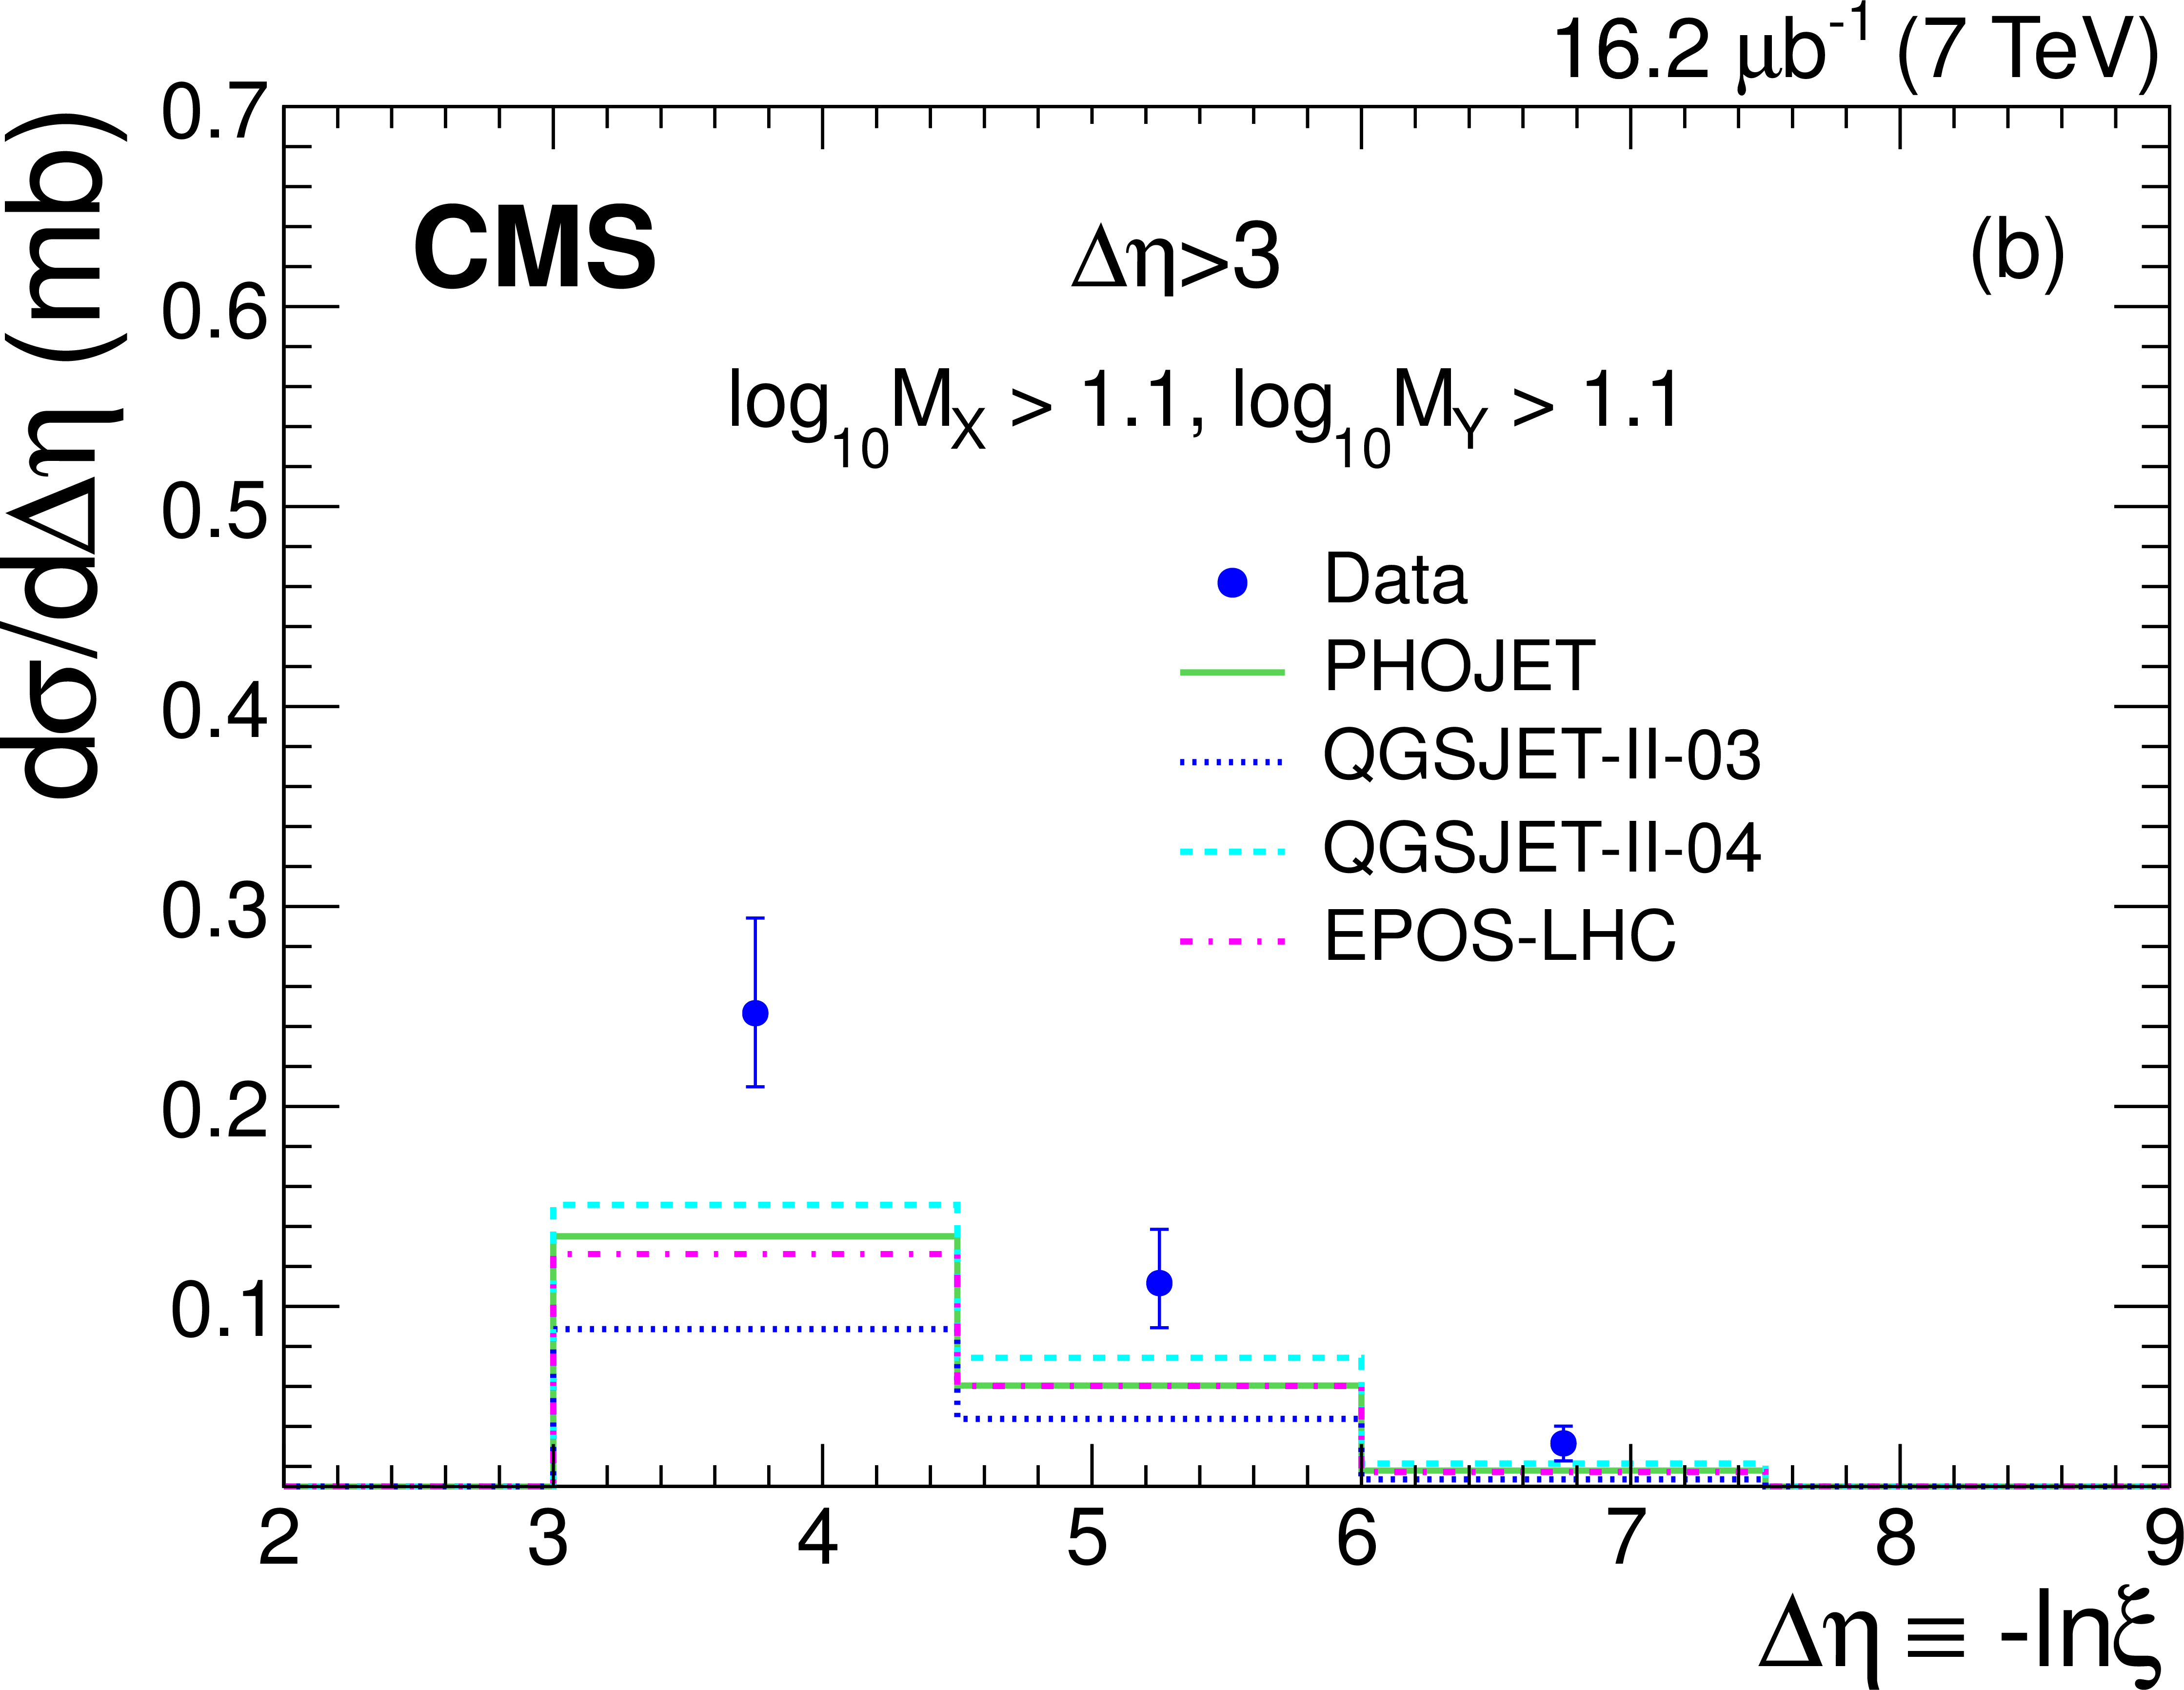
Figure 10-b:
The central pseudorapidity-gap cross section $ {\mathrm {d}}\sigma / {\mathrm {d}}\Delta \eta $ (DD dominated) compared to MC predictions: (a) PYTHIA 8 MBR, PYTHIA 8 4C, and PYTHIA 6 Z2*, and (b) PHOJET, QGSJET-II 03, QGSJET-II 04, and EPOS. Error bars are dominated by systematic uncertainties, which are discussed in the Section on systematic uncertainties. |

png pdf |
Figure 11-a:
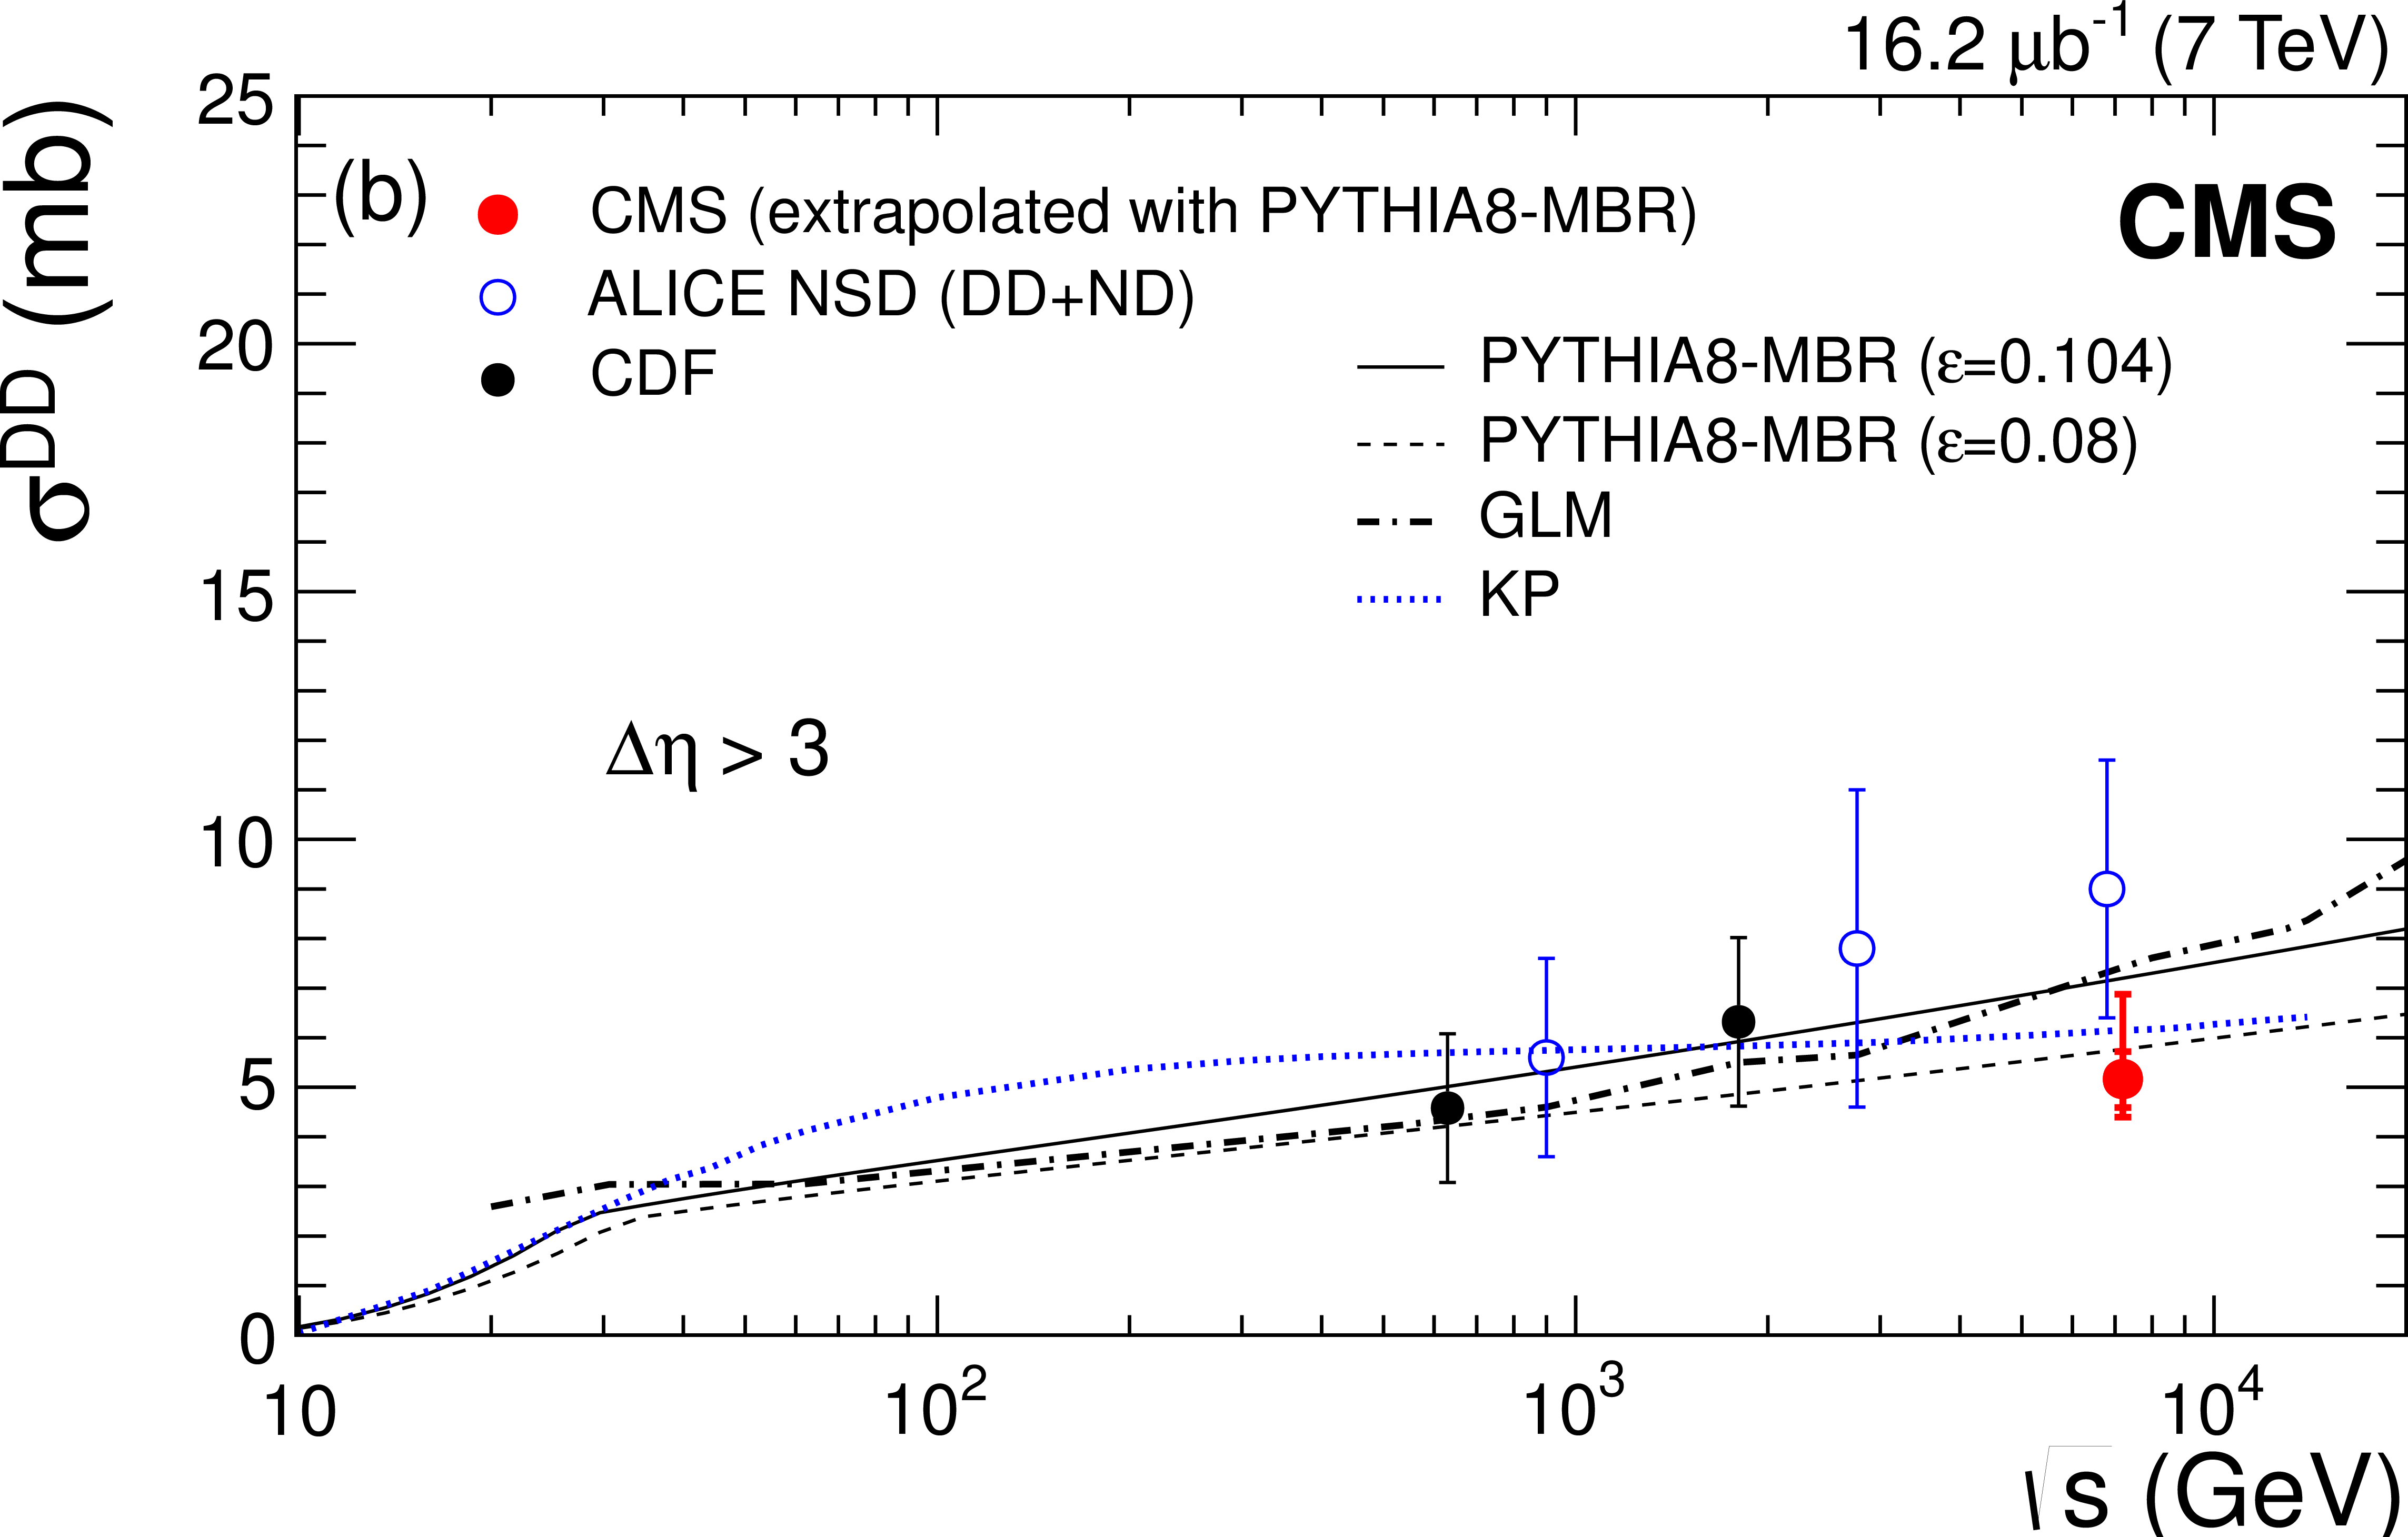
Diffractive cross sections as a function of collision energy measured in $ {\mathrm {p}} {\mathrm {p}}$ and $ {\mathrm {p}} {\mathrm {\overline {p}}}$ collisions compared to PYTHIA 8 MBR ($\varepsilon = 0.08, 0.104$) and other model predictions PLB 716 (2012) 425, EPJC 67 (2010) 397, arXiv:1109.3697: (a) total SD cross section for $\xi <0.05$, and (b) total DD cross section for $\Delta \eta >3$. The inner (outer) error bars of the CMS data points correspond to the statistical and systematic (and the additional extrapolation) uncertainties added in quadrature. |
png pdf |
Figure 11-b:
Diffractive cross sections as a function of collision energy measured in $ {\mathrm {p}} {\mathrm {p}}$ and $ {\mathrm {p}} {\mathrm {\overline {p}}}$ collisions compared to PYTHIA 8 MBR ($\varepsilon = 0.08, 0.104$) and other model predictions PLB 716 (2012) 425, EPJC 67 (2010) 397, arXiv:1109.3697: (a) total SD cross section for $\xi <0.05$, and (b) total DD cross section for $\Delta \eta >3$. The inner (outer) error bars of the CMS data points correspond to the statistical and systematic (and the additional extrapolation) uncertainties added in quadrature. |
png pdf |
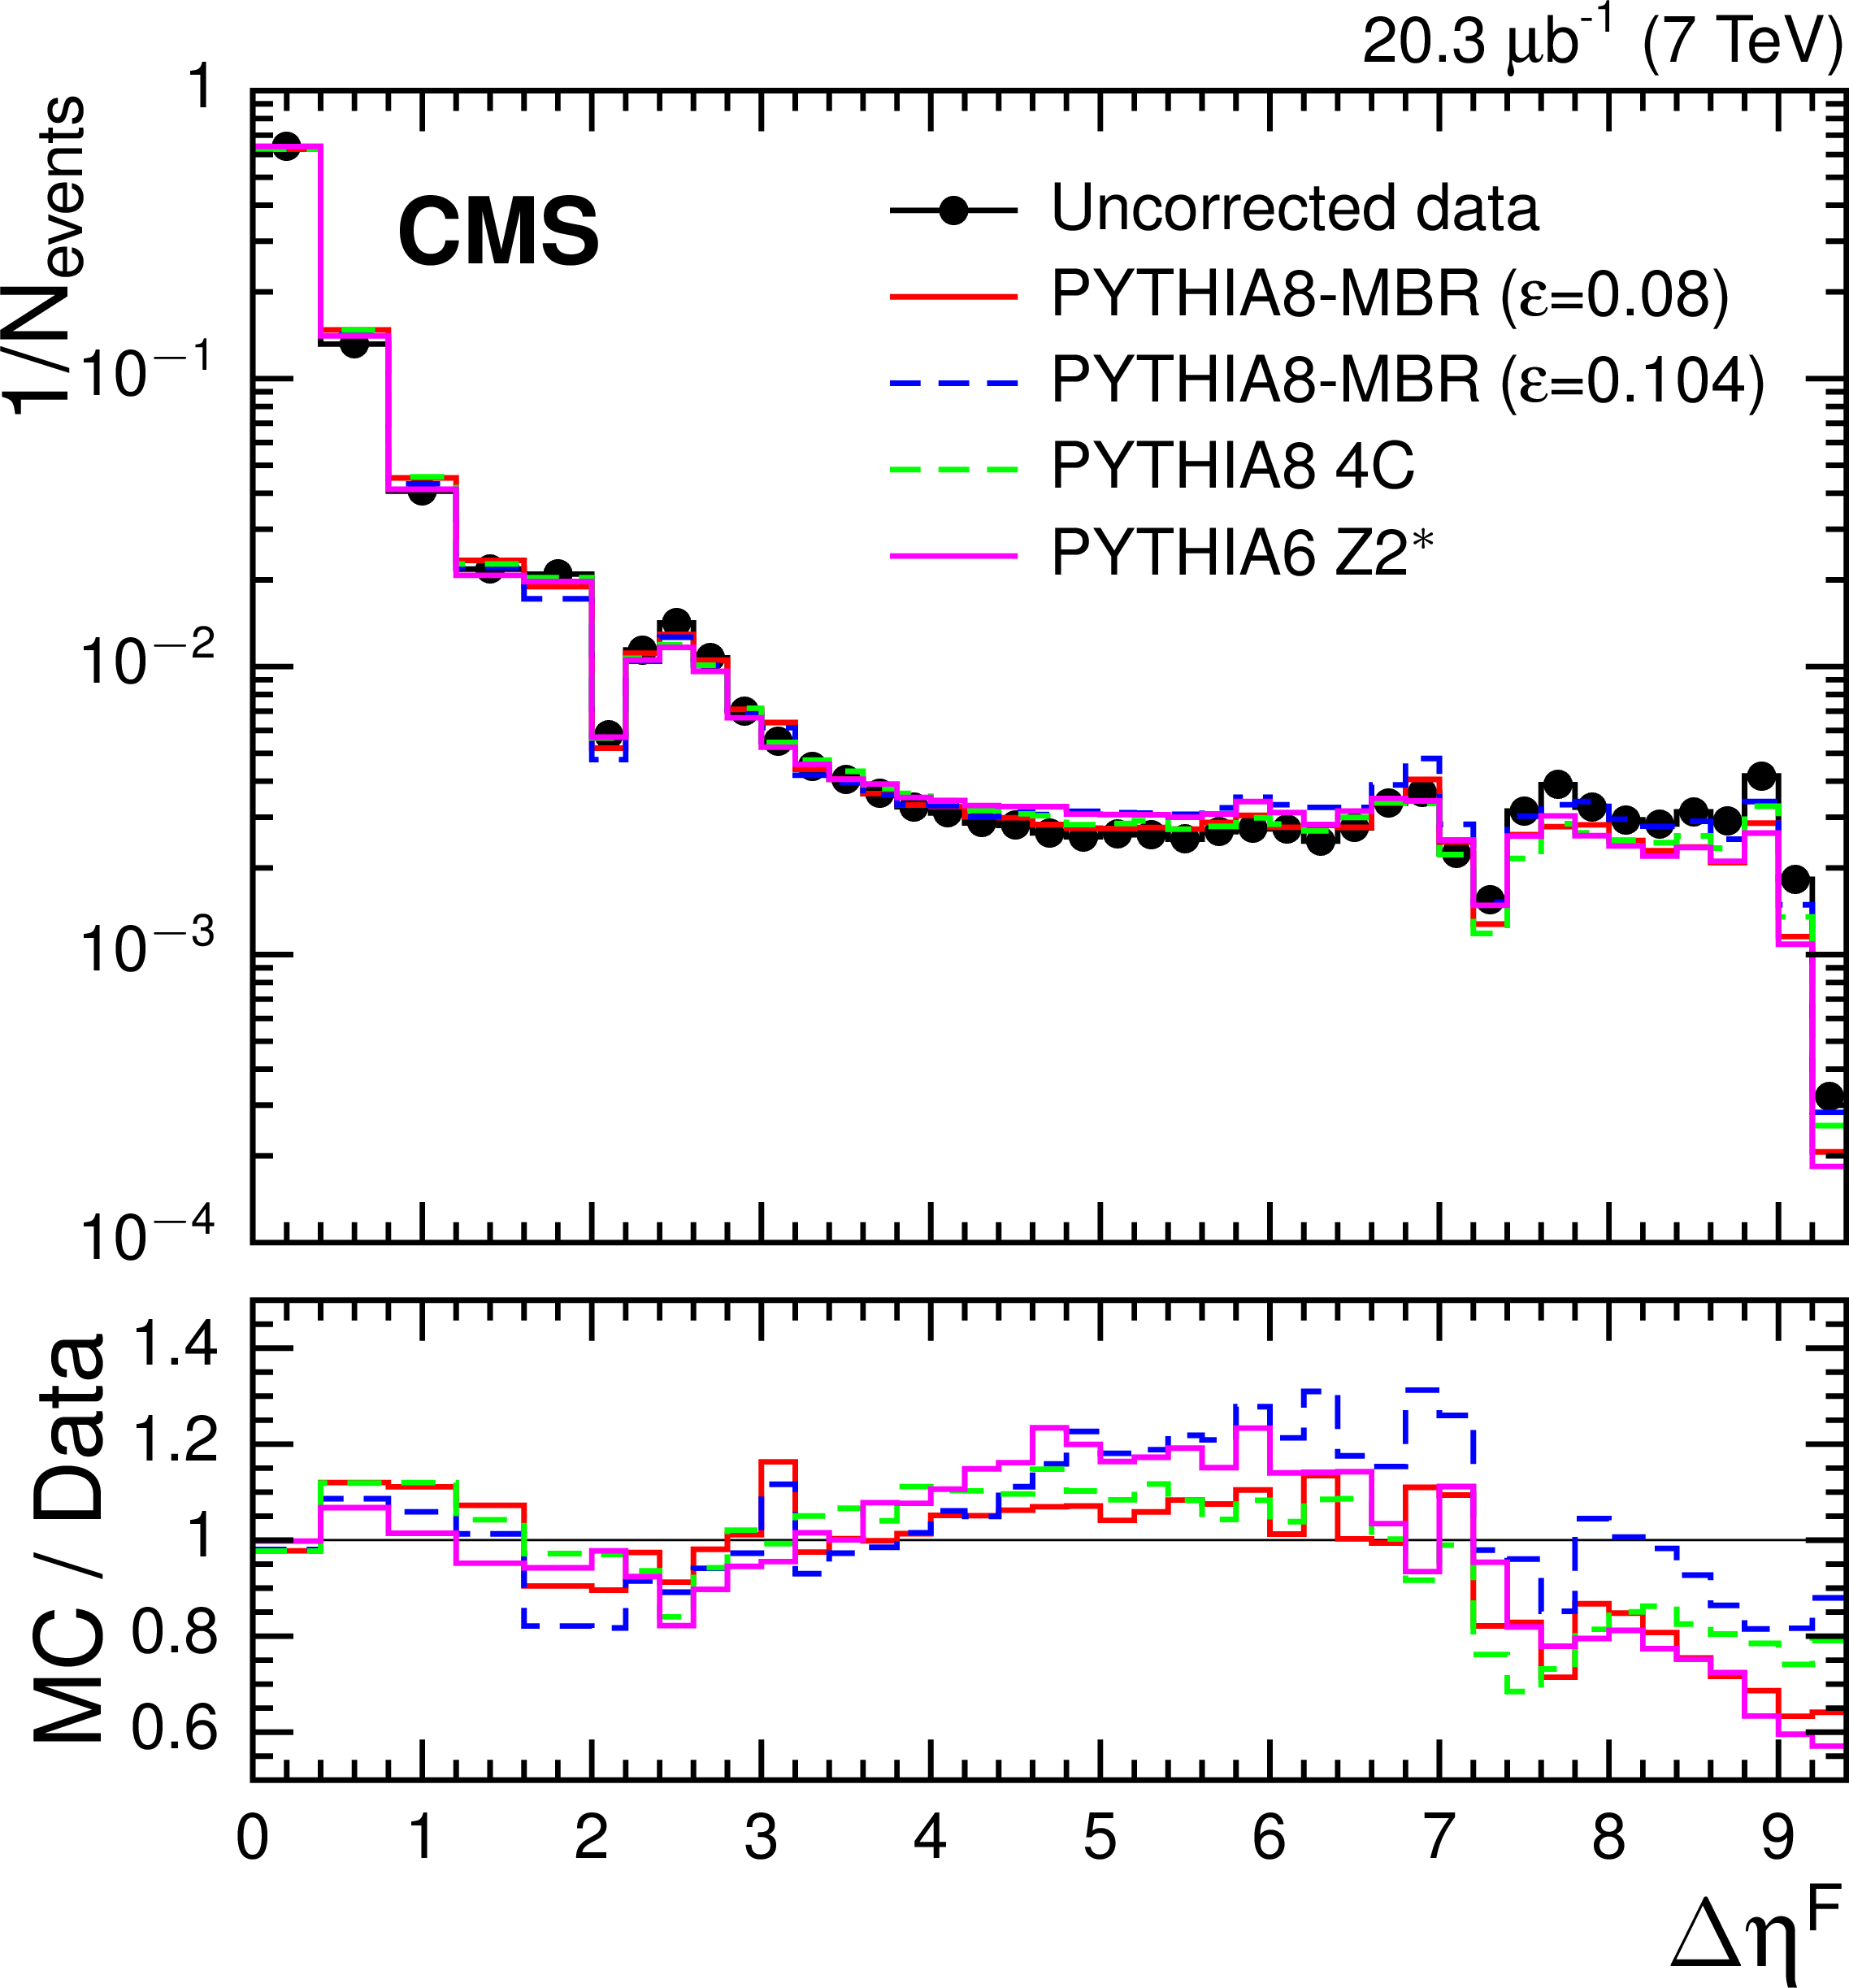
Figure 12:
Uncorrected $\Delta \eta ^\mathrm {F}$ distribution compared to various detector-level MC predictions. |
png pdf |
Figure 13-a:
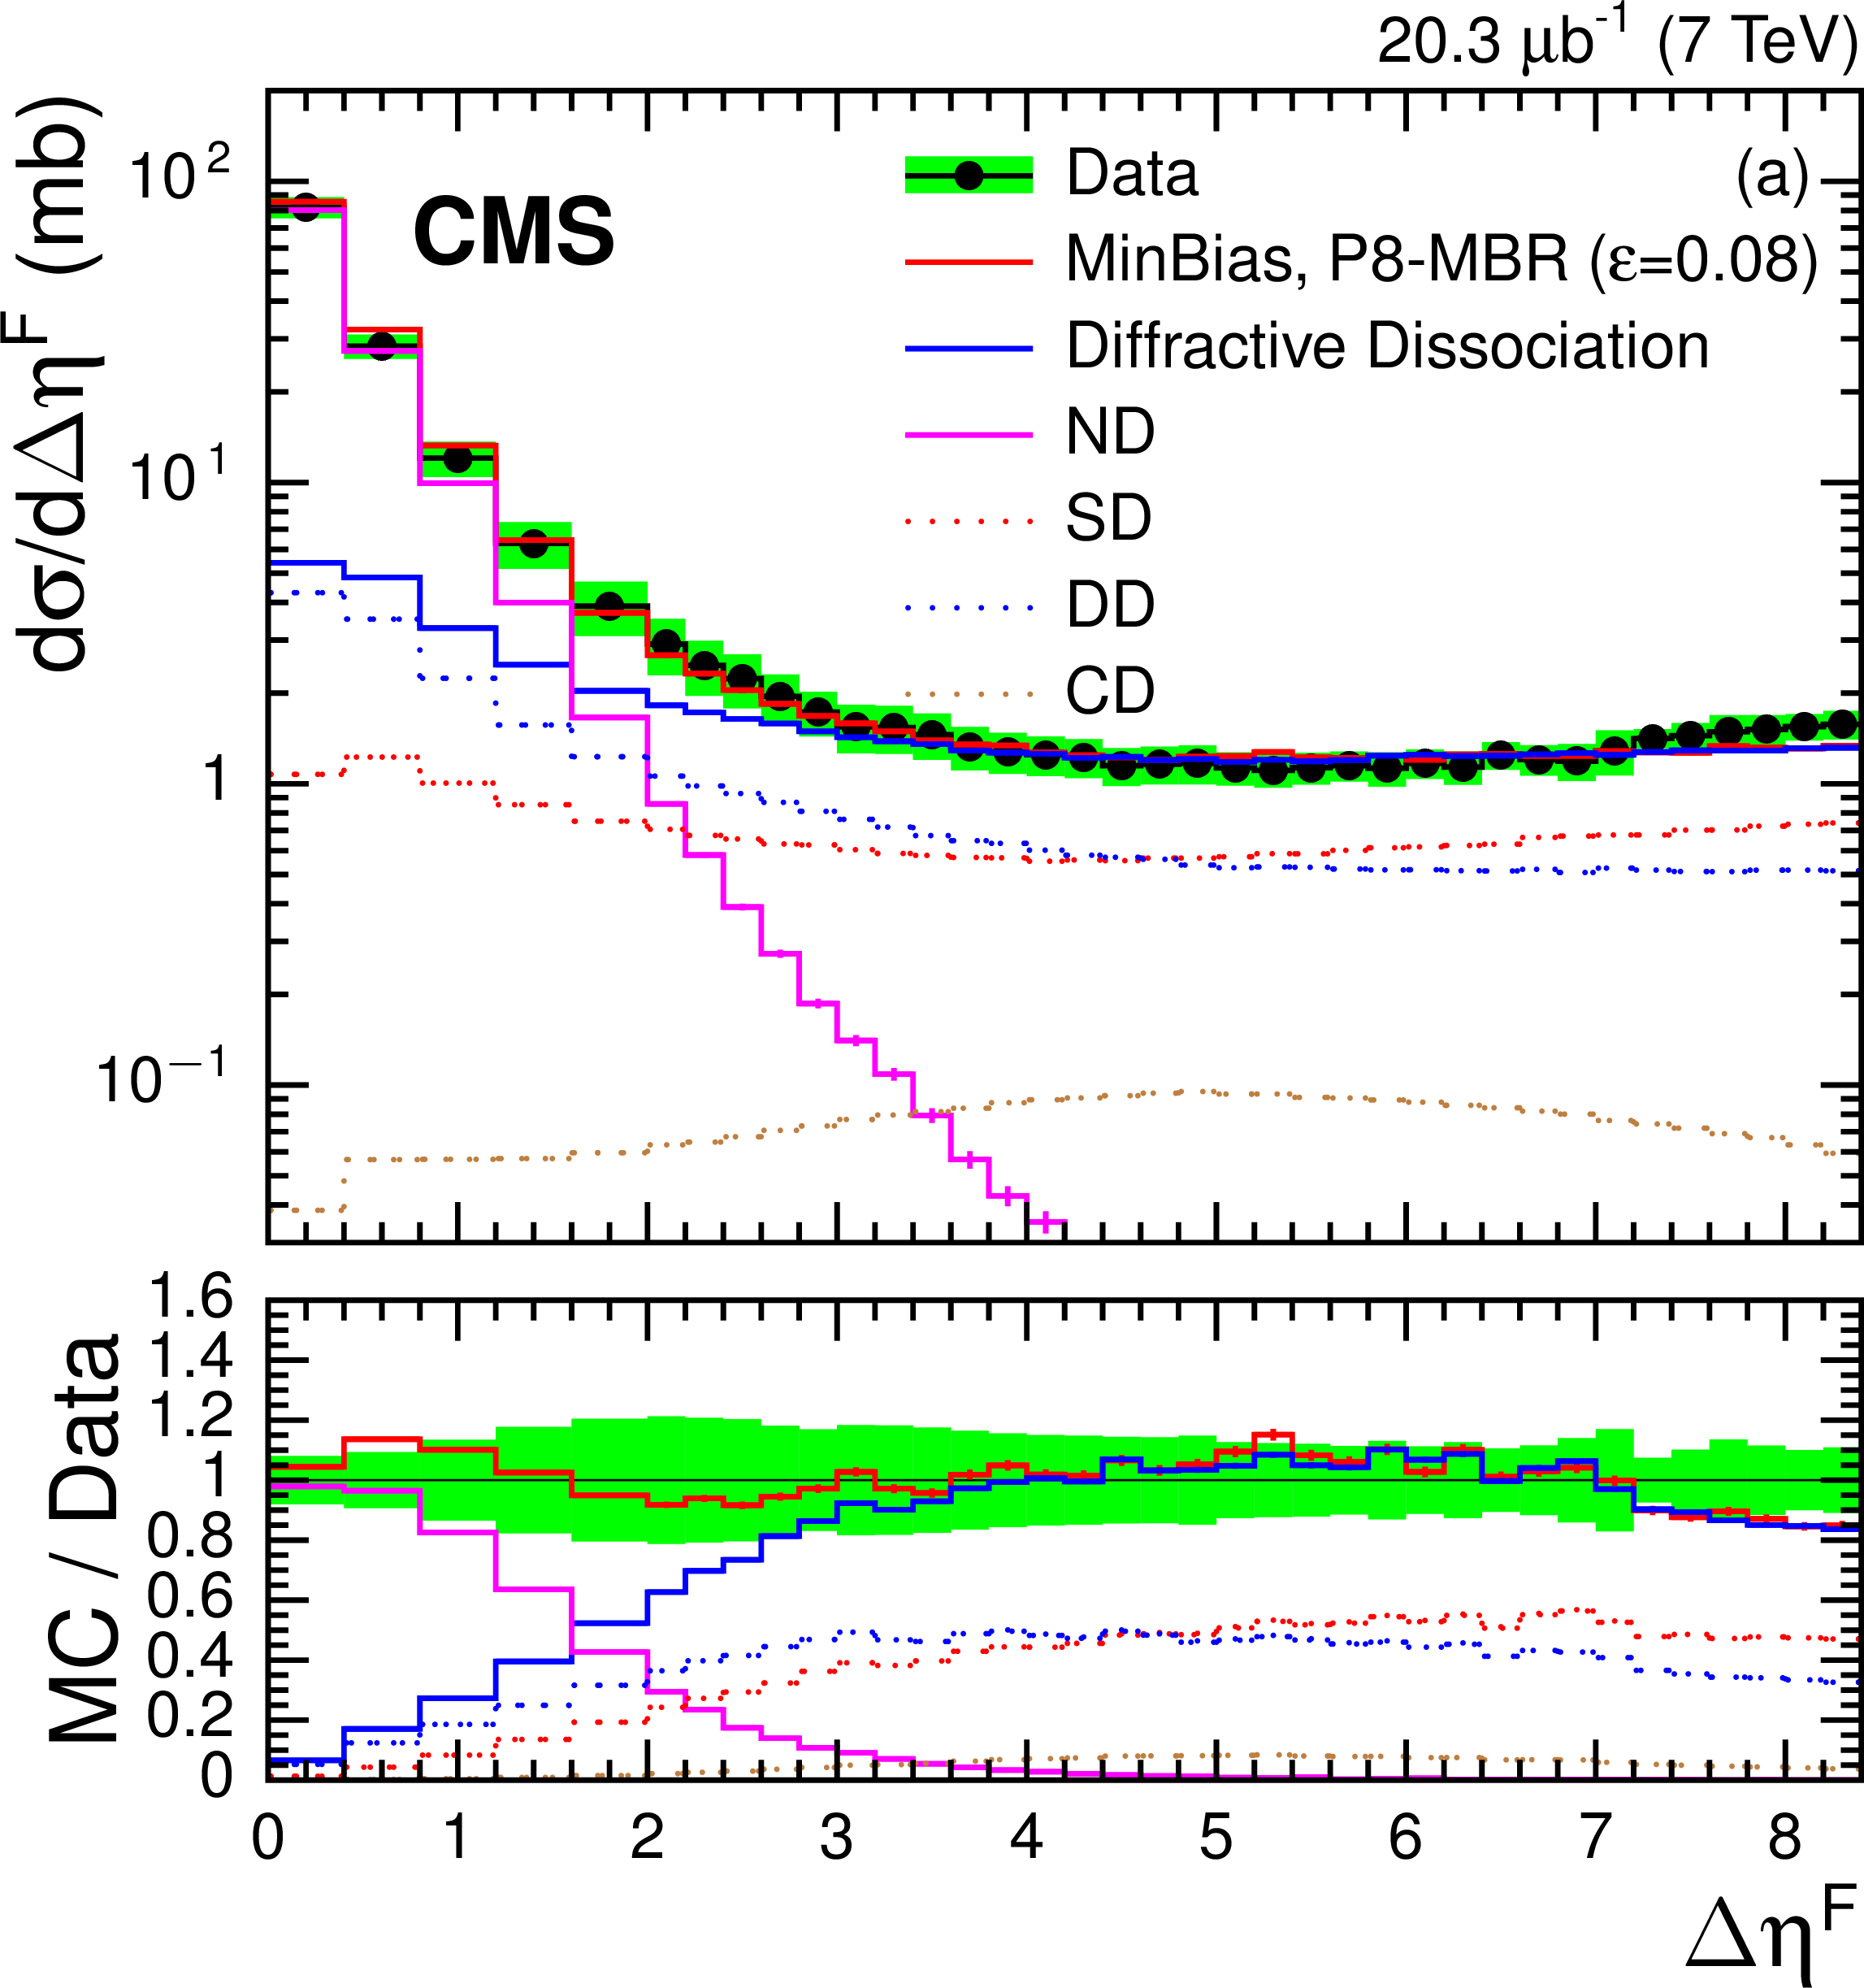
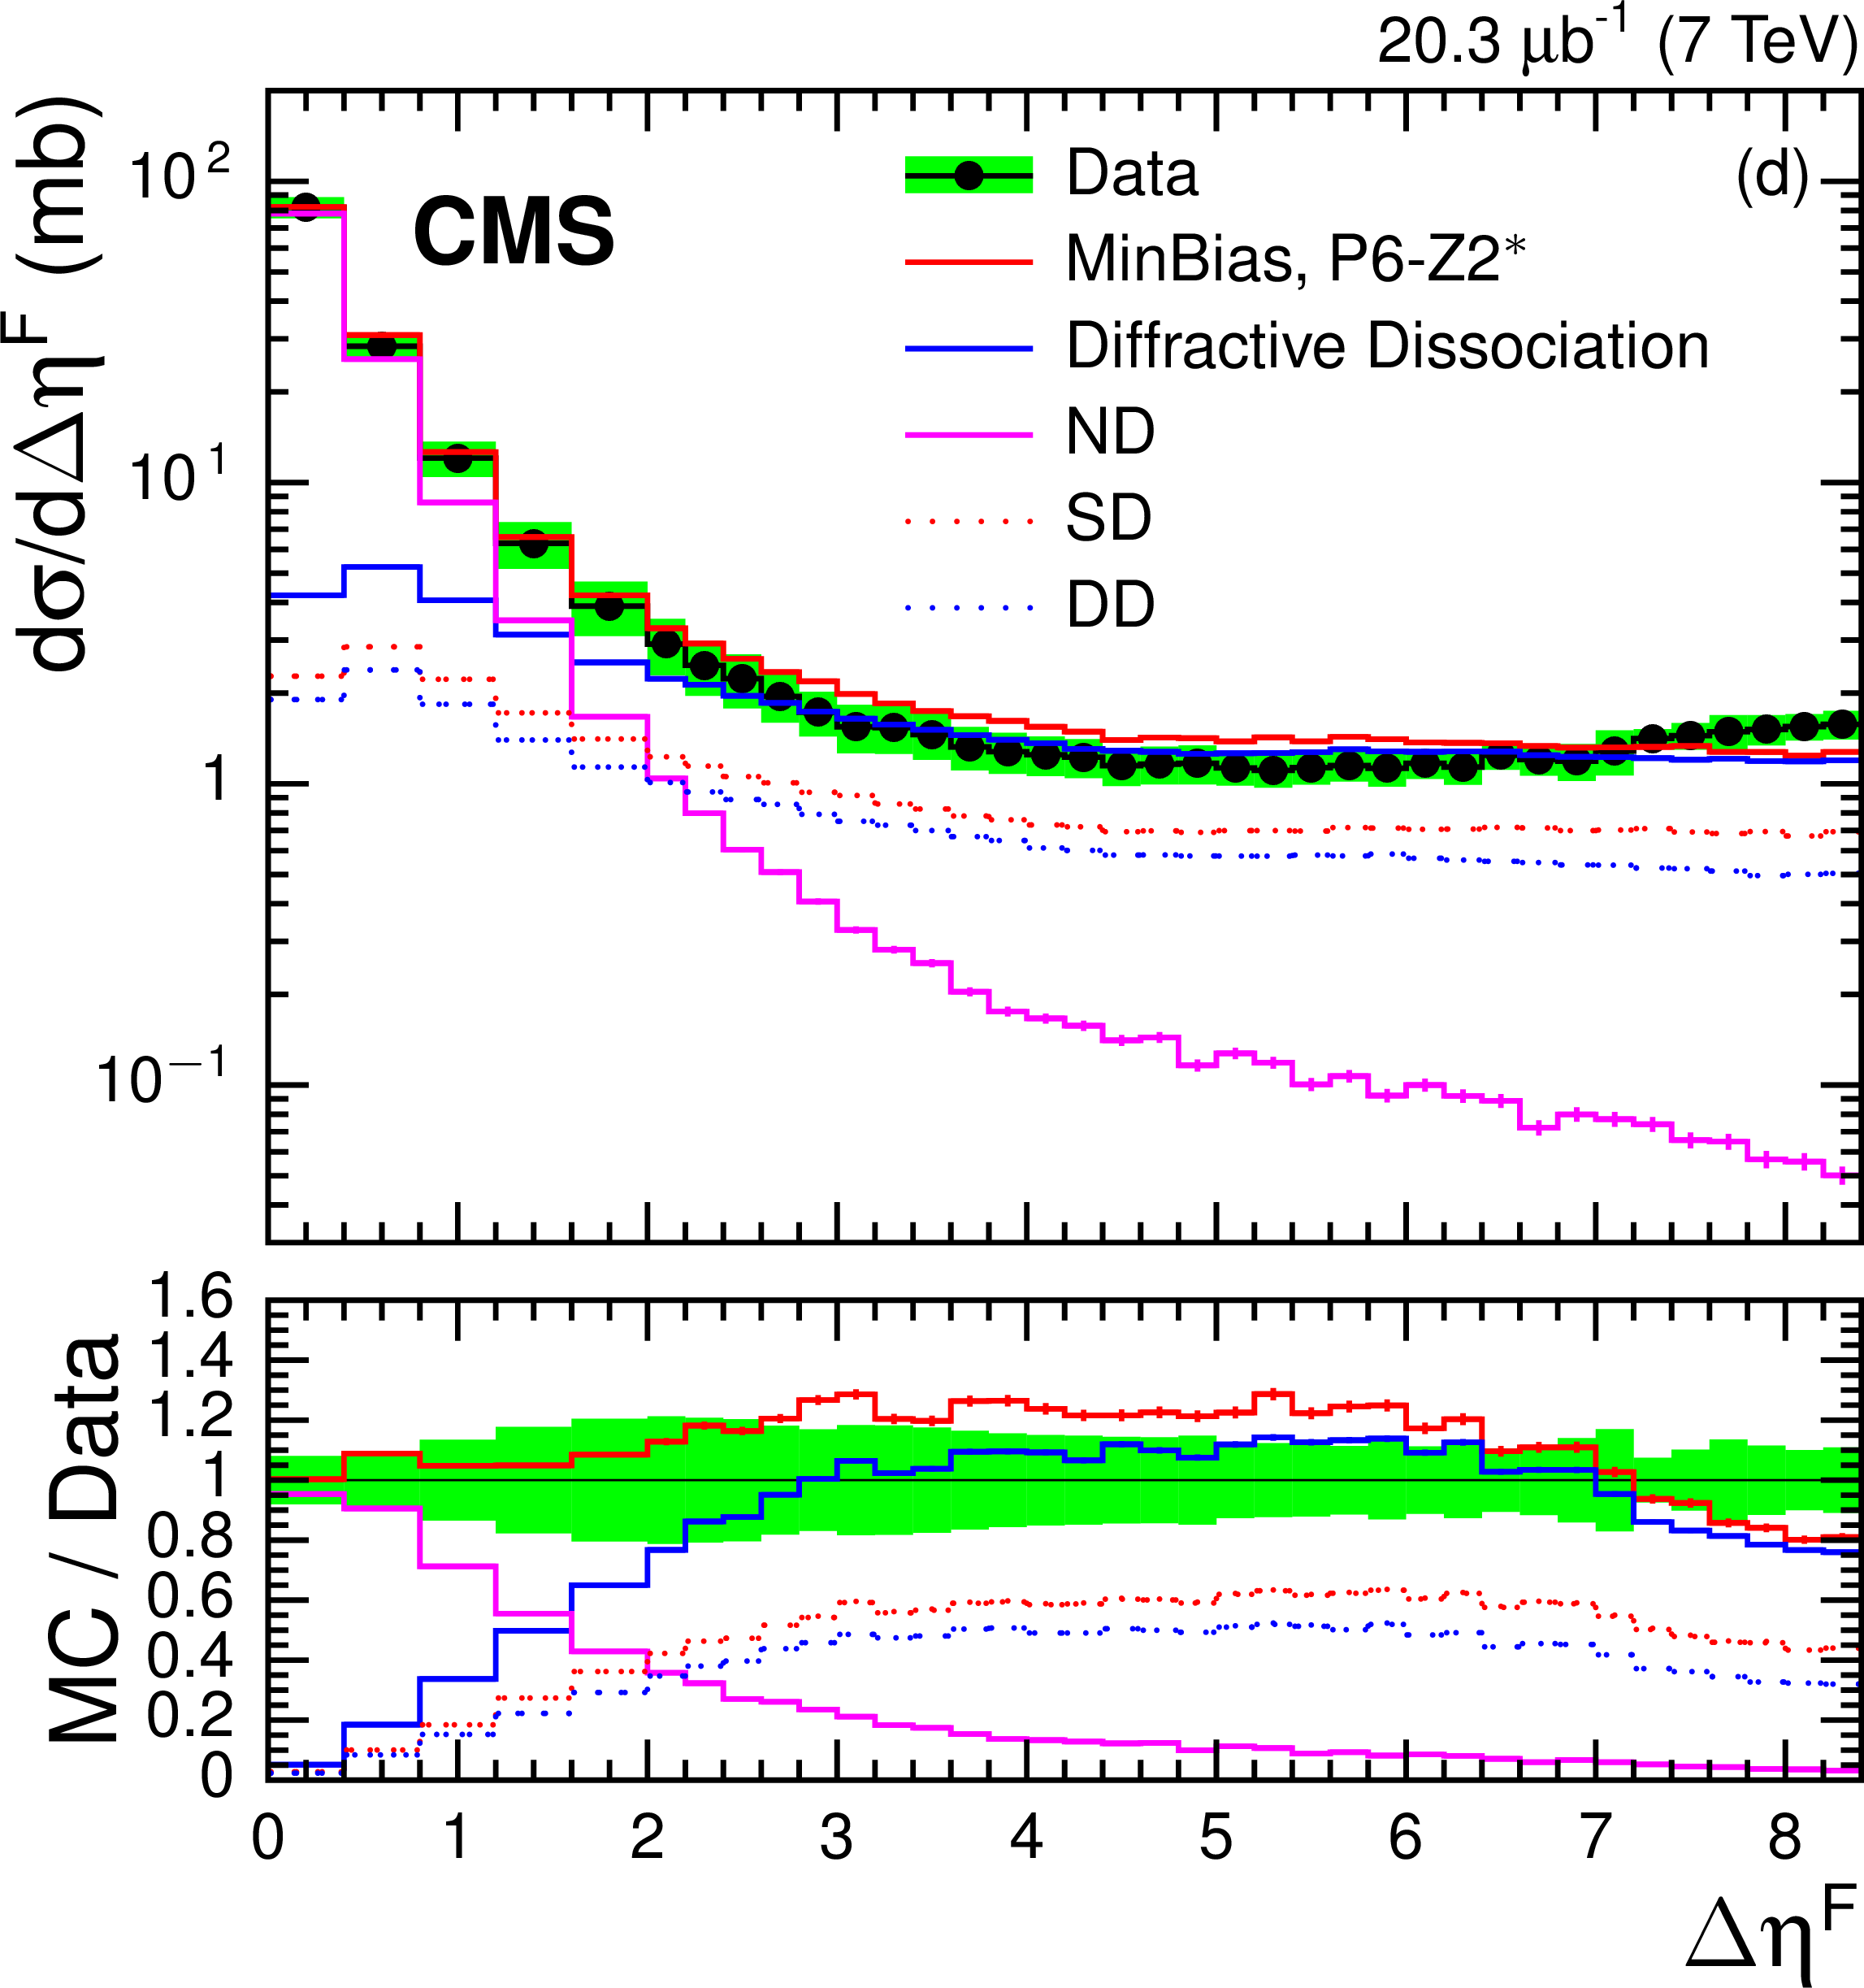
Differential cross section $ {\mathrm {d}}\sigma / {\mathrm {d}}\Delta \eta ^\mathrm {F}$ for stable particles with $ {p_{\mathrm {T}}} > $ 200 MeV in the region $ {| \eta | } < 4.7$ compared to the corresponding predictions of (a) PYTHIA 8 MBR ($\varepsilon = 0.08$), (b) PYTHIA 8 MBR ($\varepsilon = 0.104$), (c) PYTHIA 8 4C, and (d) PYTHIA 8 4C. The band around the data points represents the total systematic uncertainty, which is discussed in Section on systematic uncertainties. |
png pdf |
Figure 13-b:
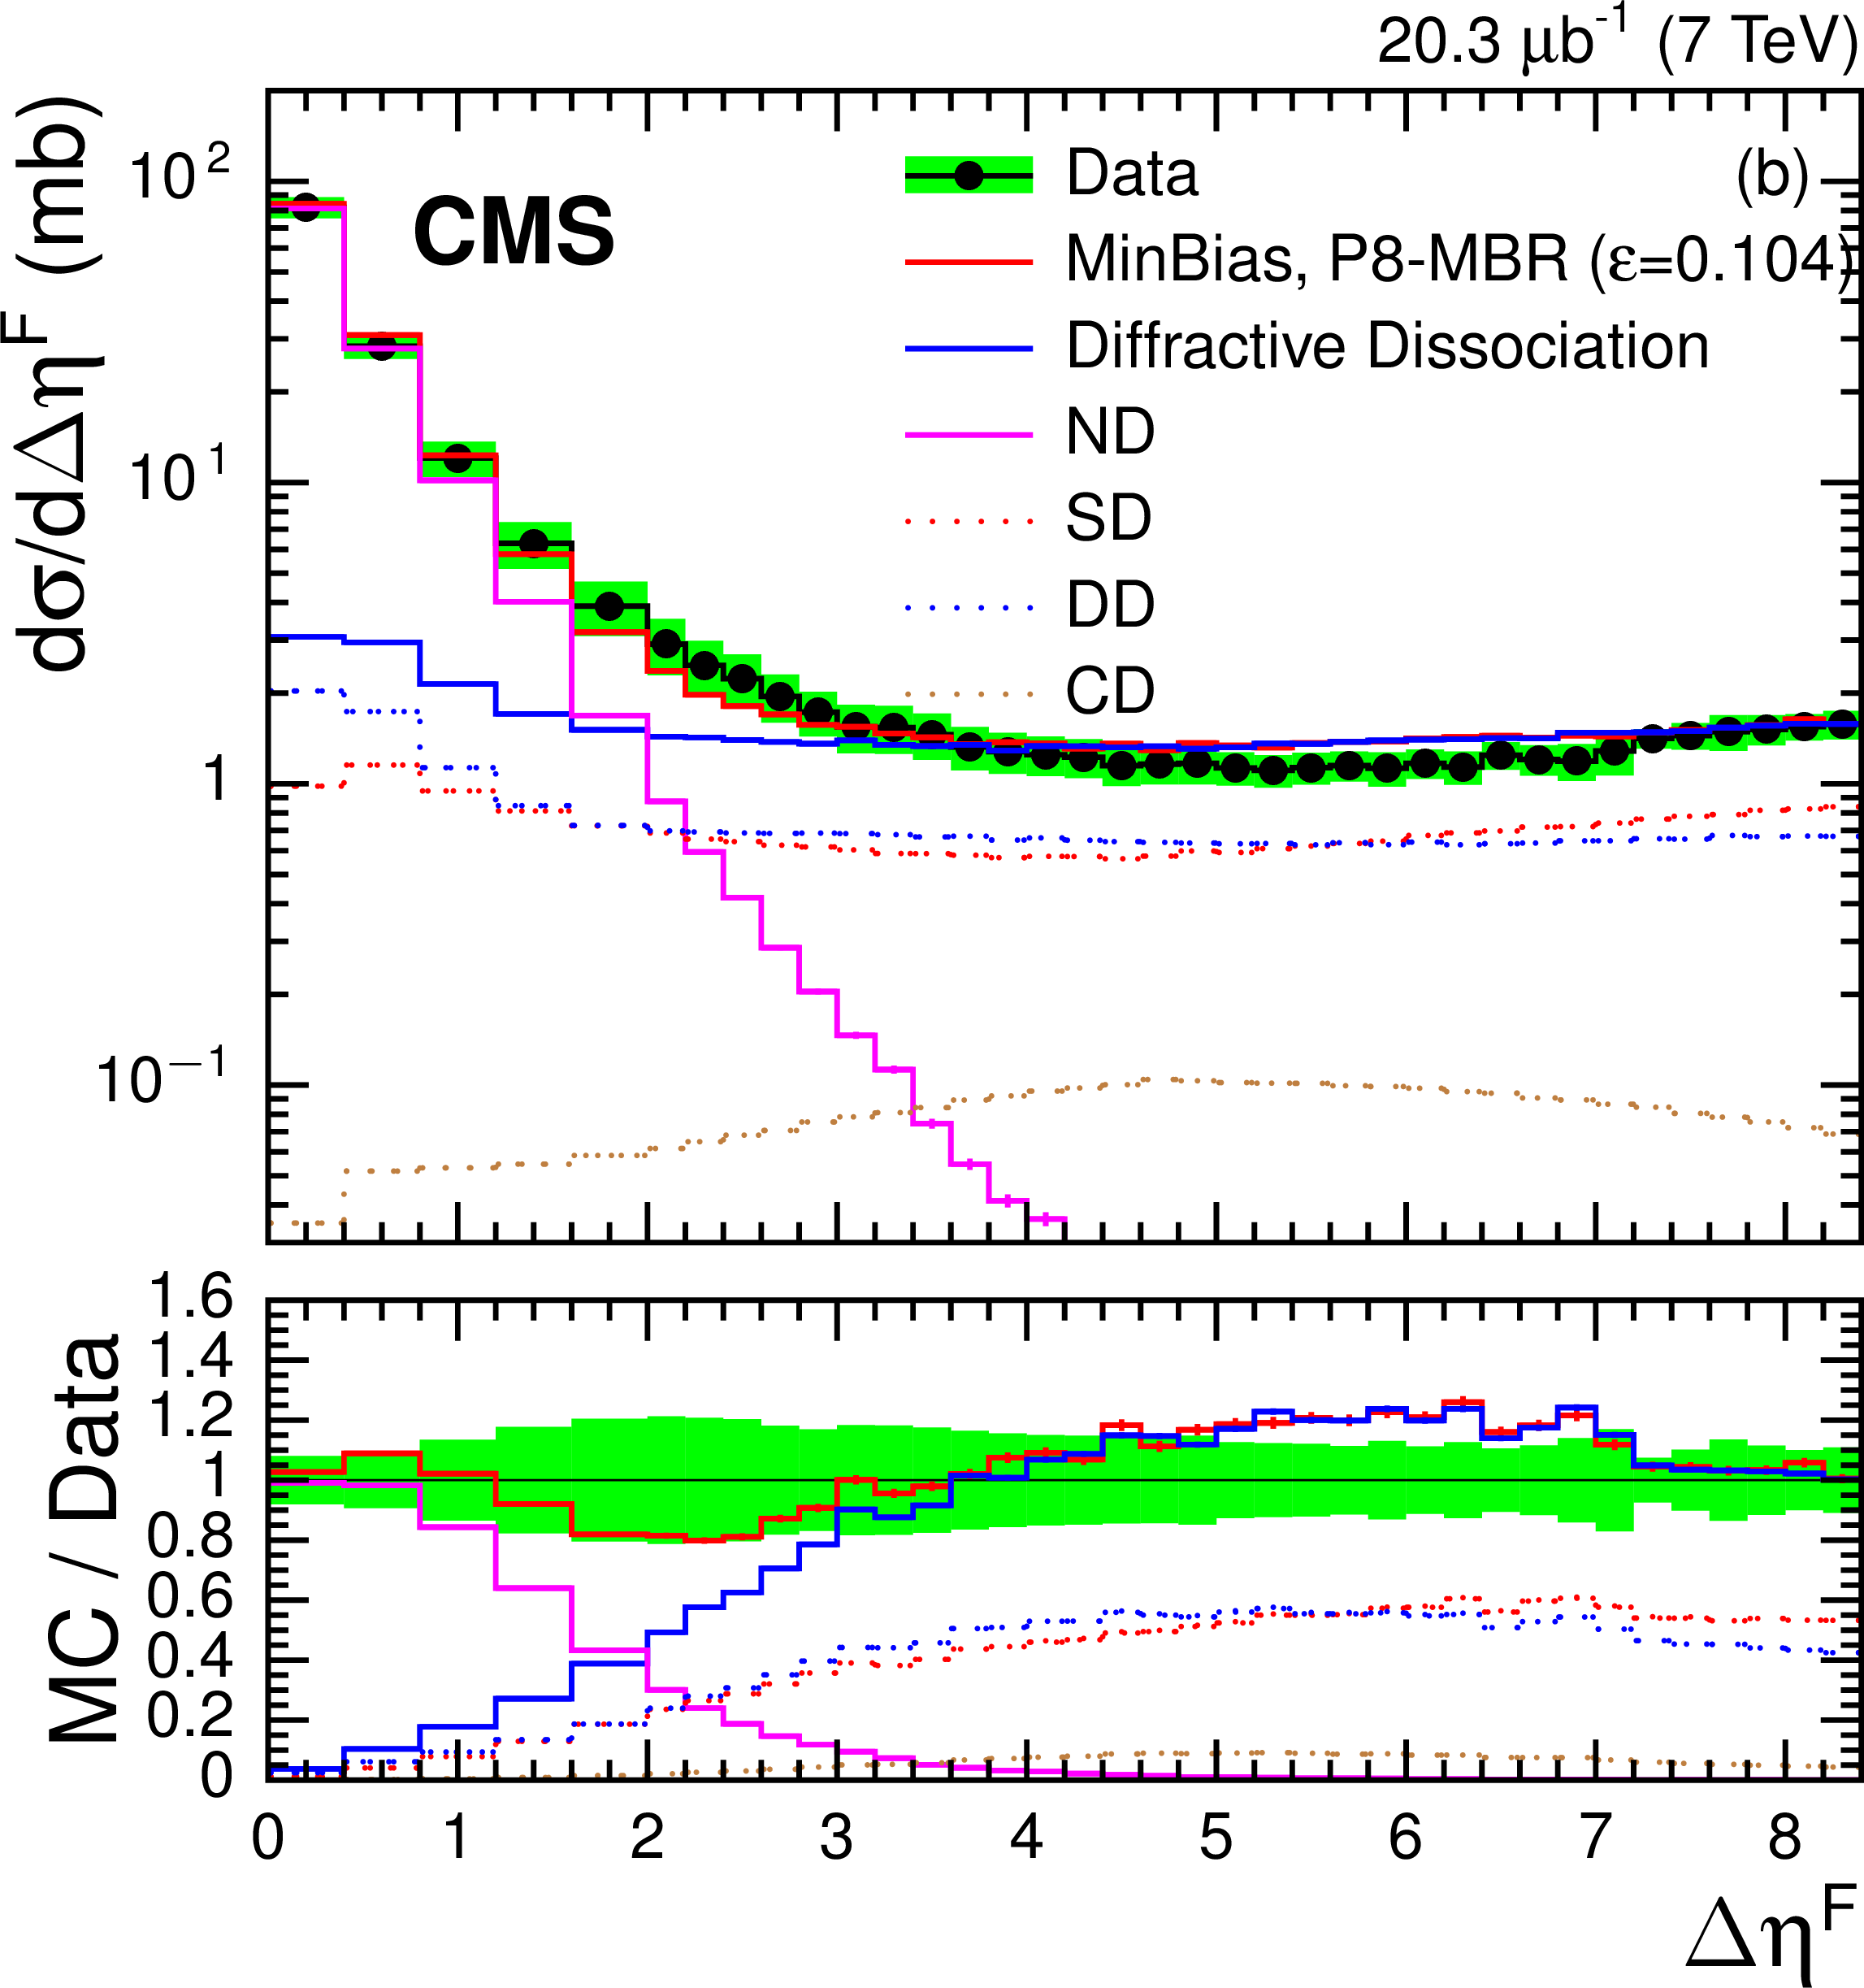
Differential cross section $ {\mathrm {d}}\sigma / {\mathrm {d}}\Delta \eta ^\mathrm {F}$ for stable particles with $ {p_{\mathrm {T}}} > $ 200 MeV in the region $ {| \eta | } < 4.7$ compared to the corresponding predictions of (a) PYTHIA 8 MBR ($\varepsilon = 0.08$), (b) PYTHIA 8 MBR ($\varepsilon = 0.104$), (c) PYTHIA 8 4C, and (d) PYTHIA 8 4C. The band around the data points represents the total systematic uncertainty, which is discussed in Section on systematic uncertainties. |

png pdf |
Figure 13-c:
Differential cross section $ {\mathrm {d}}\sigma / {\mathrm {d}}\Delta \eta ^\mathrm {F}$ for stable particles with $ {p_{\mathrm {T}}} > $ 200 MeV in the region $ {| \eta | } < 4.7$ compared to the corresponding predictions of (a) PYTHIA 8 MBR ($\varepsilon = 0.08$), (b) PYTHIA 8 MBR ($\varepsilon = 0.104$), (c) PYTHIA 8 4C, and (d) PYTHIA 8 4C. The band around the data points represents the total systematic uncertainty, which is discussed in Section on systematic uncertainties. |
png pdf |
Figure 13-d:
Differential cross section $ {\mathrm {d}}\sigma / {\mathrm {d}}\Delta \eta ^\mathrm {F}$ for stable particles with $ {p_{\mathrm {T}}} > $ 200 MeV in the region $ {| \eta | } < 4.7$ compared to the corresponding predictions of (a) PYTHIA 8 MBR ($\varepsilon = 0.08$), (b) PYTHIA 8 MBR ($\varepsilon = 0.104$), (c) PYTHIA 8 4C, and (d) PYTHIA 8 4C. The band around the data points represents the total systematic uncertainty, which is discussed in Section on systematic uncertainties. |

png pdf |
Figure 14:
Differential cross section $ {\mathrm {d}}\sigma / {\mathrm {d}}\Delta \eta ^\mathrm {F}$ for stable particles with $ {p_{\mathrm {T}}} >200$ MeV in the region $ {| \eta | } < 4.7$ compared to the ATLAS result [EPJC 72 (2012) 1926] distributions (top) and ratio to the CMS measurement (bottom). The band represents the total systematic uncertainty in the CMS measurement, while the uncertainty in the ATLAS measurement is shown by the error bars. The stable-particle level definitions of the two measurements are not exactly identical: CMS measures the forward pseudorapidity gap size starting from $\eta = {\pm }4.7$, whereas the ATLAS limit is $\eta = {\pm }4.9$. |
png pdf |
Figure 15:
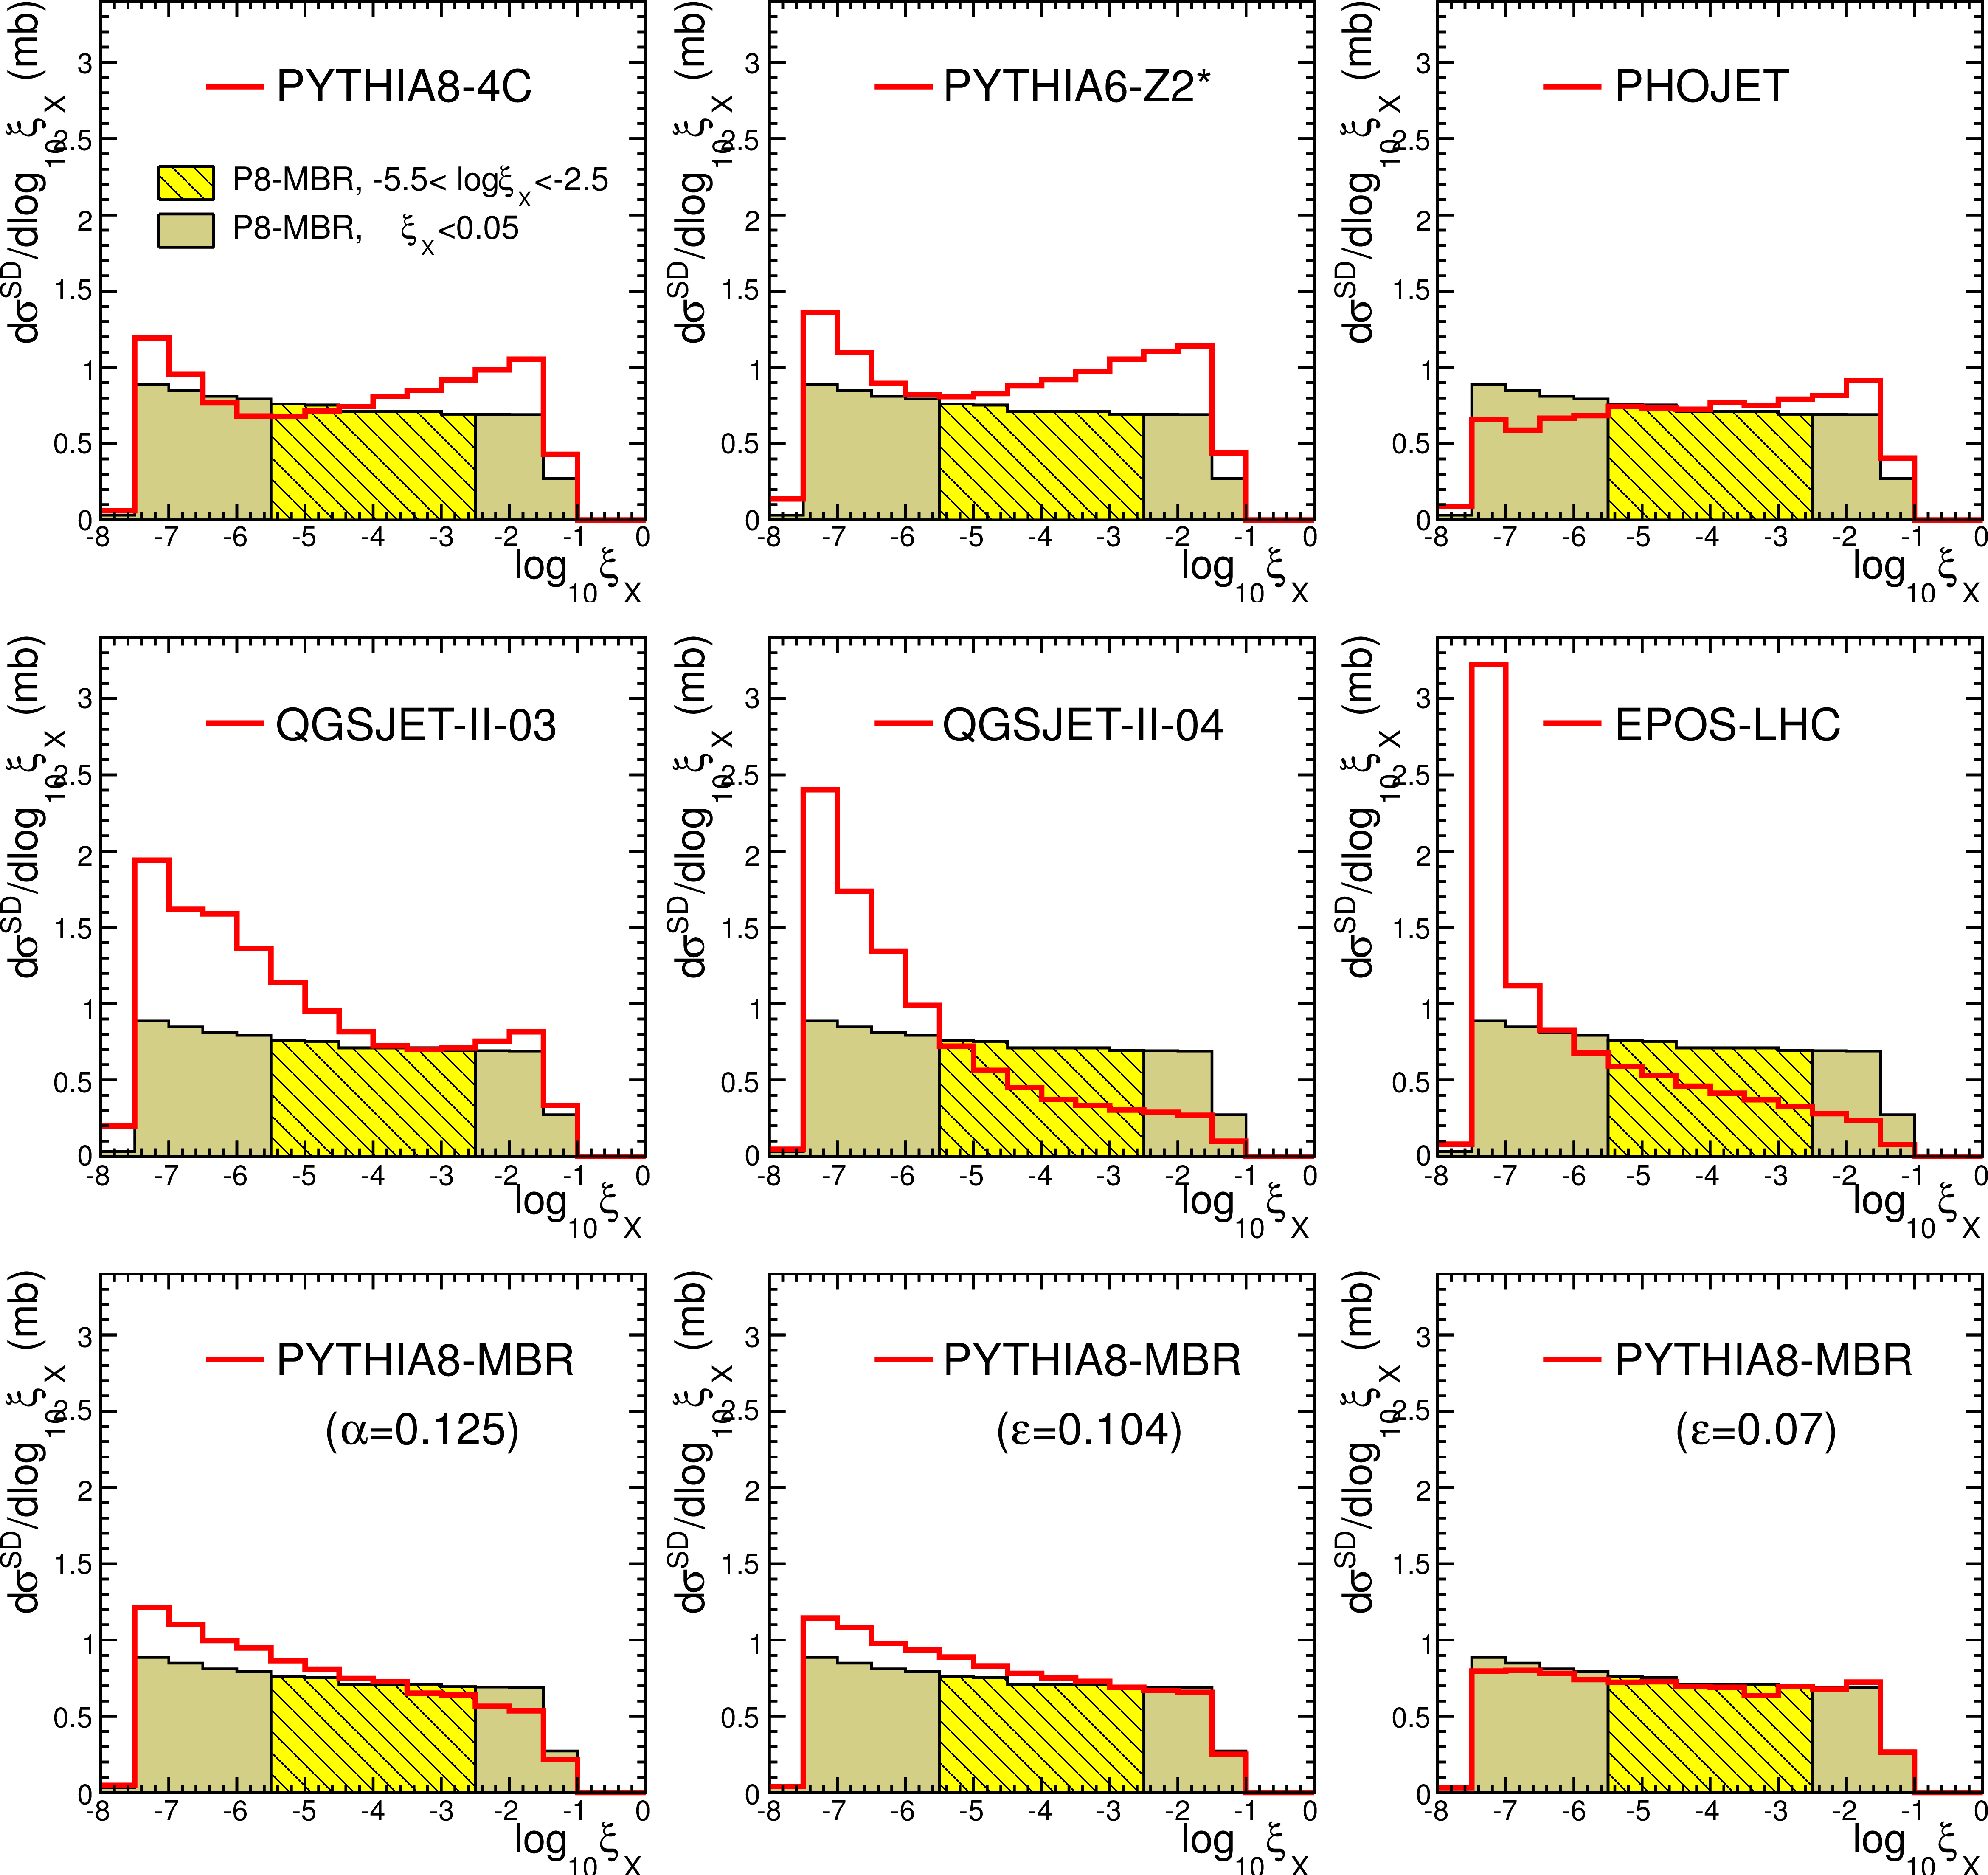
Generator-level SD cross section as a function of $\xi _ {X} =M^2_ {X} /s$ for $\xi _ {X} <0.05$, shown for PYTHIA 8 4C, PYTHIA 6 Z2*, PHOJET, QGSJET-II 03, QGSJET-II 04, EPOS MC, and PYTHIA 8 MBR with the parameters of the Pomeron trajectory changed from the nominal values ($\alpha '=$ 0.25 GeV$^{-2}$, $\varepsilon = 0.08$) to $\alpha '$ = 0.125 GeV$^{-2}$, $\varepsilon$ =0.104, and $\varepsilon$ = 0.07 (one parameter changed at a time). The nominal PYTHIA 8 MBR simulation is presented in each plot for the two regions of $\xi _ {X} $, $-$5.5 $<\log_{10}\xi _ {X} <-$2.5 (dashed yellow) and $\xi _ {X} <$ 0.05 (solid khaki), used to extrapolate the measured SD cross section (from the dashed (yellow) to the solid (khaki) regions). |
png pdf |
Figure 16:
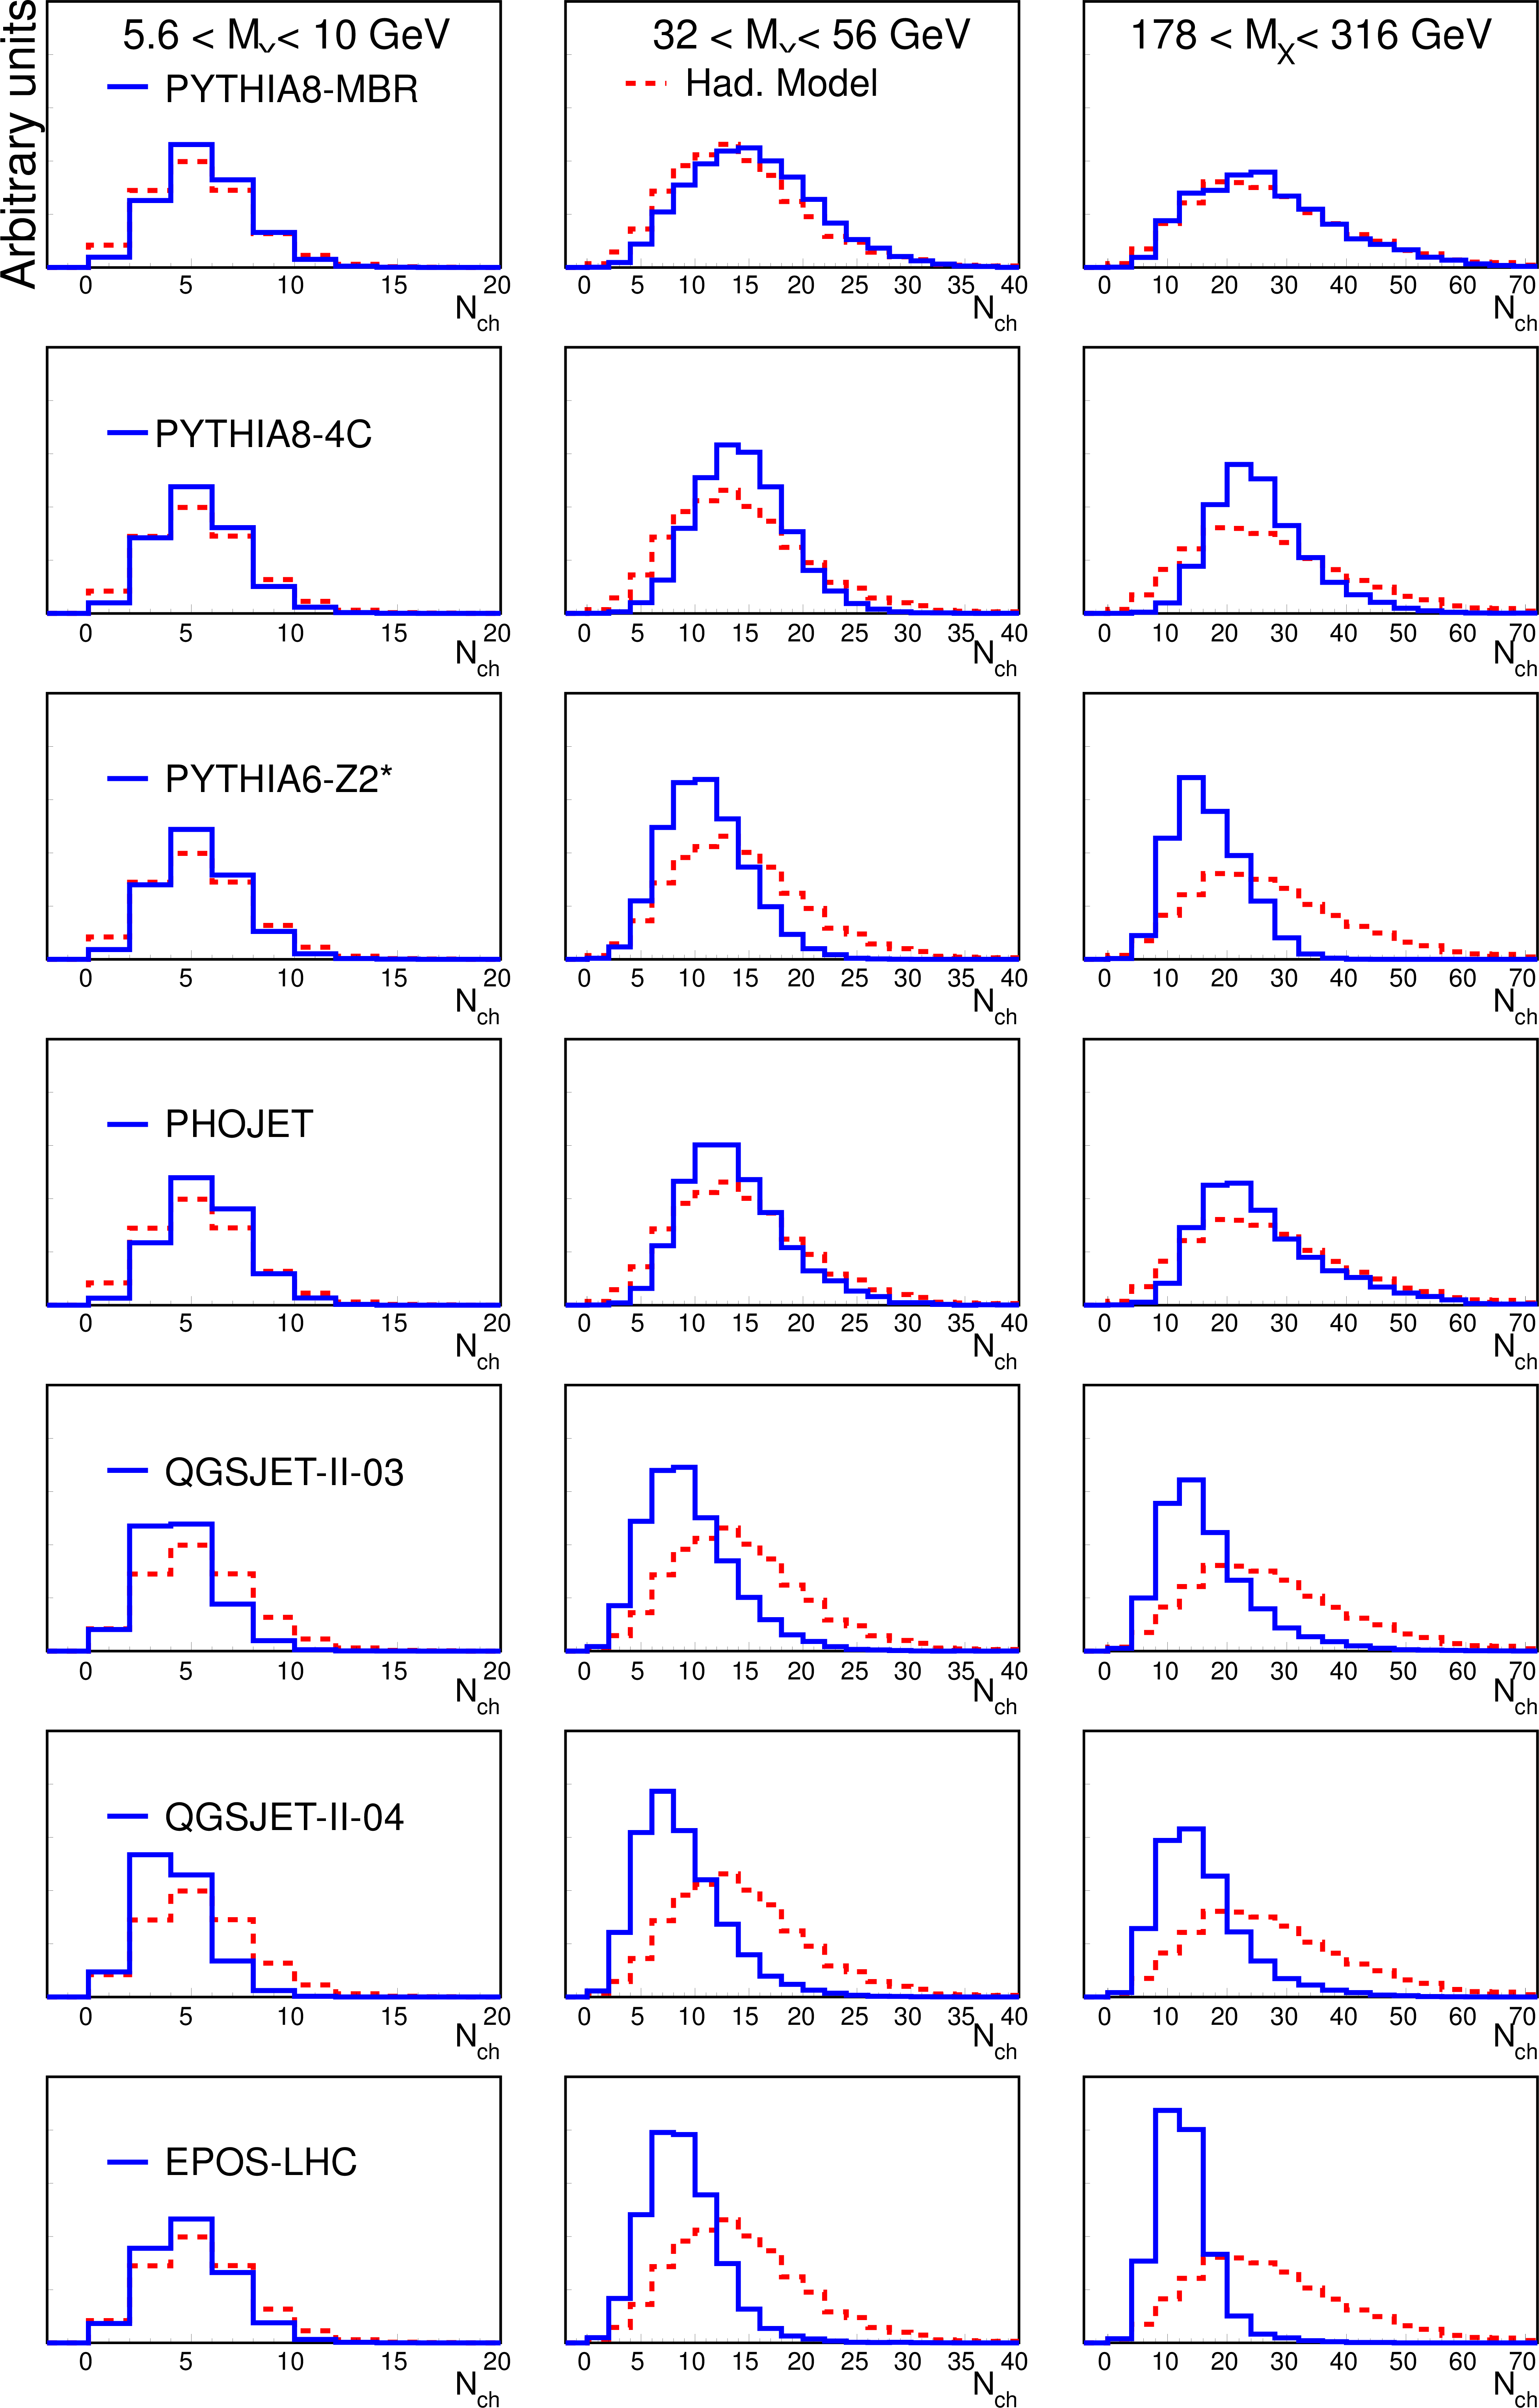
Charged-particle multiplicity ($N_\mathrm {ch}$) distributions (area-normalized) in the PYTHIA 8 MBR, PYTHIA 8 4C, PYTHIA 6 Z2*, PHOJET, QGSJET-II 03, QGSJET-II 04, and EPOS MC simulations (rows) in three bins of $M_ {X} $ (columns) in SD collisions, compared to a reference hadronization model (dashed line), which describes the available data at $\sqrt {s} \le$ 1800 GeV [PLB 193 (1987) 151, PLB 118 (1982) 167]. |
png pdf |
Figure 17:
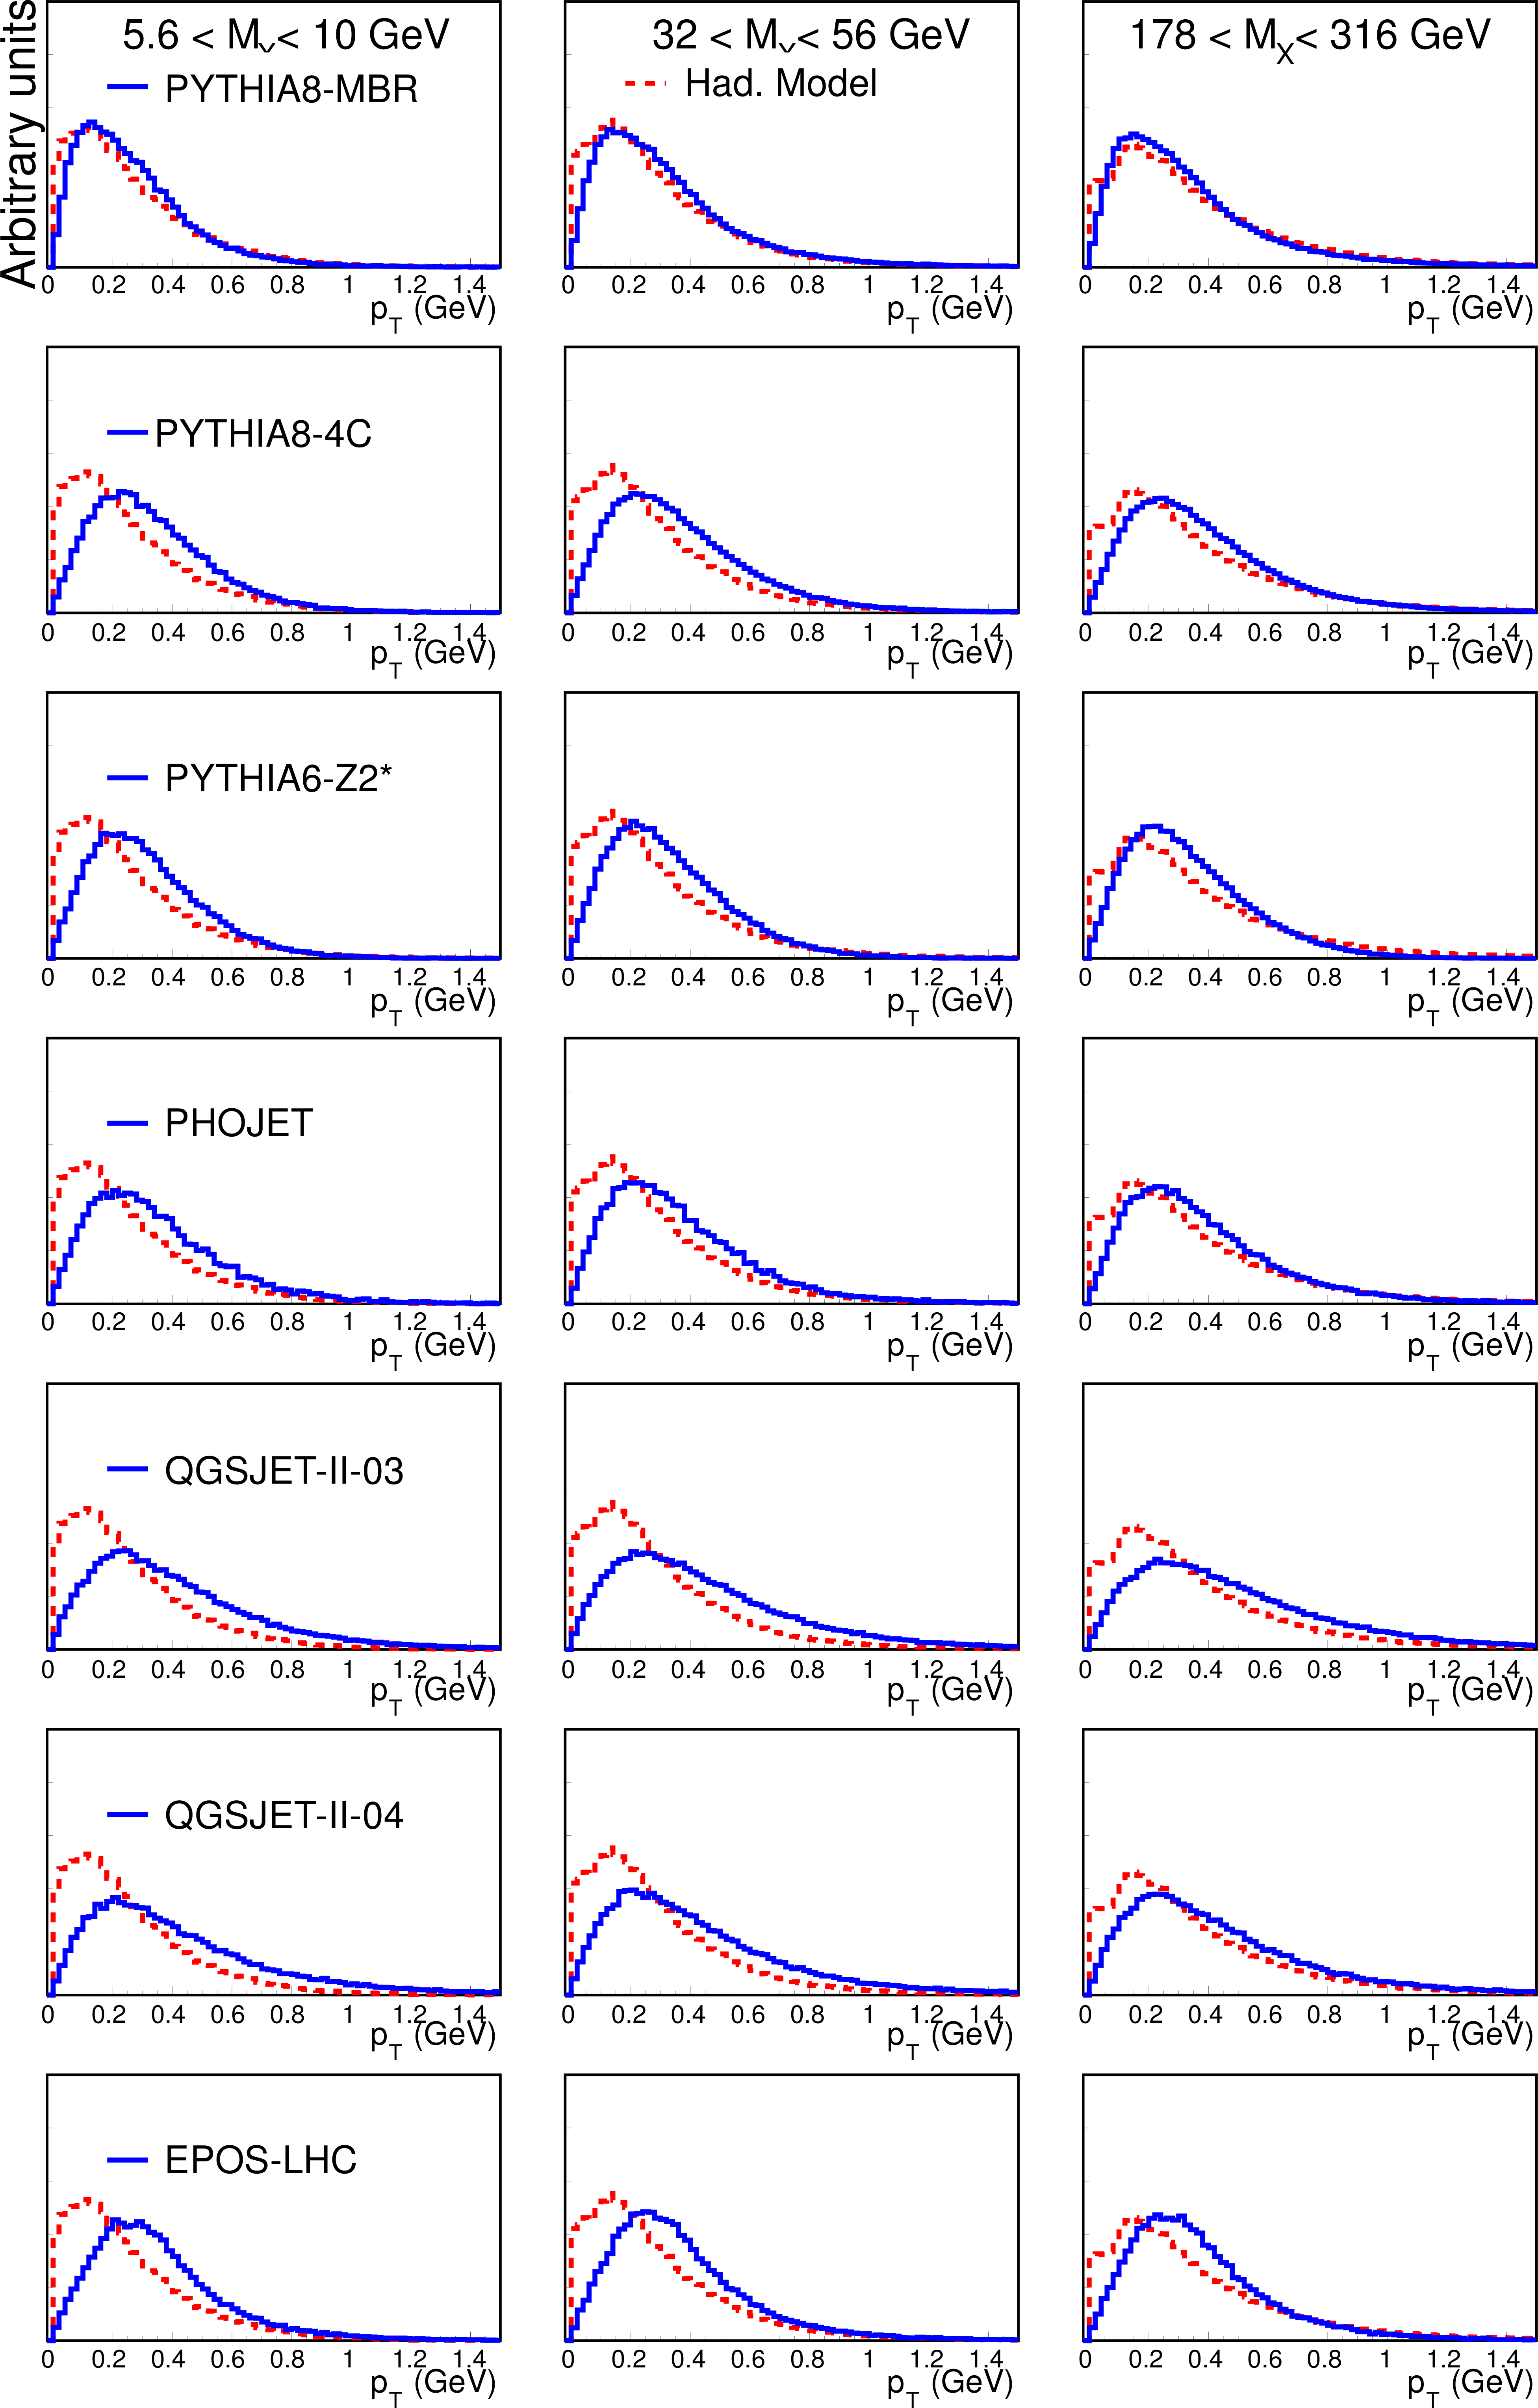
Transverse-momentum ($ {p_{\mathrm {T}}} $) distributions (area-normalized) in the PYTHIA 8 MBR, PYTHIA 8 4C, PYTHIA 6 Z2*, PHOJET, QGSJET-II 03, QGSJET-II 04, EPOS MC simulations (rows) in three bins of $M_ {X} $ (columns) in SD collisions, compared to a reference hadronization model (dashed line), which describes the available data at $\sqrt {s} \le$ 1800 GeV [PLB 193 (1987) 151, PLB 118 (1982) 167]. |
|
|
Compact Muon Solenoid LHC, CERN |
|

|

|

|

|

|