

Compact Muon Solenoid
LHC, CERN
| CMS-FSQ-12-010 ; CERN-PH-EP-2013-084 | ||
| Study of exclusive two-photon production of $\mathrm{ W }^+\mathrm{ W }^-$ in pp collisions at $ \sqrt{s} = $ 7 TeV and constraints on anomalous quartic gauge couplings | ||
| CMS Collaboration | ||
| 24 May 2013 | ||
| J. High Energy Phys. 07 (2013) 116 | ||
| Abstract: A search for exclusive or quasi-exclusive $\mathrm{ W }^+\mathrm{ W }^-$ production by photon-photon interactions, $\mathrm{ p }\mathrm{ p } \rightarrow\mathrm{ p }^{(*)}\mathrm{ W }^+\mathrm{ W }^-\mathrm{ p }^{(*)}$, at $ \sqrt{s} = $ 7 TeV is reported using data collected by the CMS detector with an integrated luminosity of 5.05 fb$^{-1}$. Events are selected by requiring a $\mu^{\pm}\mathrm{ e }^{\mp}$ vertex with no additional associated charged tracks and dilepton transverse momentum $p_\mathrm{T}(\mu^{\pm}\mathrm{ e }^{\mp})> $ 30 GeV. Two events passing all selection requirements are observed in the data, compared to a standard model expectation of 2.2 $\pm$ 0.4 signal events with 0.84 $\pm$ 0.15 background. The tail of the dilepton $p_\mathrm{T}$ distribution is studied for deviations from the standard model. No events are observed with $p_\mathrm{T} > $ 100 GeV. Model-independent upper limits are computed and compared to predictions involving anomalous quartic gauge couplings. The limits on the parameters $a^{\mathrm{ W }}_{0,C}/\Lambda^{2}$ with a dipole form factor and an energy cutoff $\Lambda_{\text{cutoff}}= $ 500 GeV are of the order of 10$^{-4}$. | ||
| Links: e-print arXiv:1305.5596 [hep-ex] (PDF) ; CDS record ; inSPIRE record ; Public twiki page ; CADI line (restricted) ; | ||
| Figures | |
png pdf |
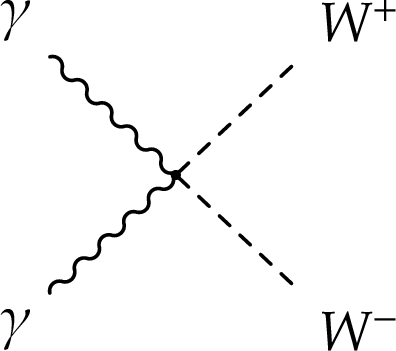
Figure 1-a:
Quartic gauge coupling (a) and $t$- (b) and $u$-channel (c) $\mathrm{ W } $-boson exchange diagrams contributing to the $\gamma \gamma \to \mathrm{ W }^+ \mathrm{ W }^- $ process at leading order in the SM. |

png pdf |
Figure 1-b:
Quartic gauge coupling (a) and $t$- (b) and $u$-channel (c) $\mathrm{ W } $-boson exchange diagrams contributing to the $\gamma \gamma \to \mathrm{ W }^+ \mathrm{ W }^- $ process at leading order in the SM. |

png pdf |
Figure 1-c:
Quartic gauge coupling (a) and $t$- (b) and $u$-channel (c) $\mathrm{ W } $-boson exchange diagrams contributing to the $\gamma \gamma \to \mathrm{ W }^+ \mathrm{ W }^- $ process at leading order in the SM. |

png pdf |
Figure 2:
Transverse momentum distribution of lepton pairs for the $\gamma \gamma \to \mathrm{ W }^+ \mathrm{ W }^- $ process at generator level in the SM (shaded histogram), and for several values of anomalous quartic gauge coupling parameters $a^{\mathrm{ W } }_{0}$ and $a^{\mathrm{ W } }_{C}$ (open histograms). In this plot $\Lambda _{\text {cutoff}}= $ 500 GeV is the energy cutoff scale in the dipole form factor. |

png pdf |
Figure 3:
Invariant mass distribution of the muon pairs for the elastic selection with no additional track on the dimuon vertex. The dashed lines indicate the $\mathrm{ Z } $-peak region. The hatched bands indicate the statistical uncertainty in the simulation. |

png pdf |
Figure 4-a:
Kinematic distributions for the elastic selection, for the $\mathrm{ Z } $ region only (70 GeV $ |

png pdf |
Figure 4-b:
Kinematic distributions for the elastic selection, for the $\mathrm{ Z } $ region only (70 GeV $ |

png pdf |
Figure 4-c:
Kinematic distributions for the elastic selection, for the $\mathrm{ Z } $ region only (70 GeV $ |
png pdf |
Figure 4-d:
Kinematic distributions for the elastic selection, for the $\mathrm{ Z } $ region only (70 GeV $ |

png pdf |
Figure 5:
Invariant mass distribution of the muon pairs for the dissociation selection. The dashed lines indicate the $\mathrm{ Z } $-peak region. The hatched bands indicate the statistical uncertainty in the simulation. |

png pdf |
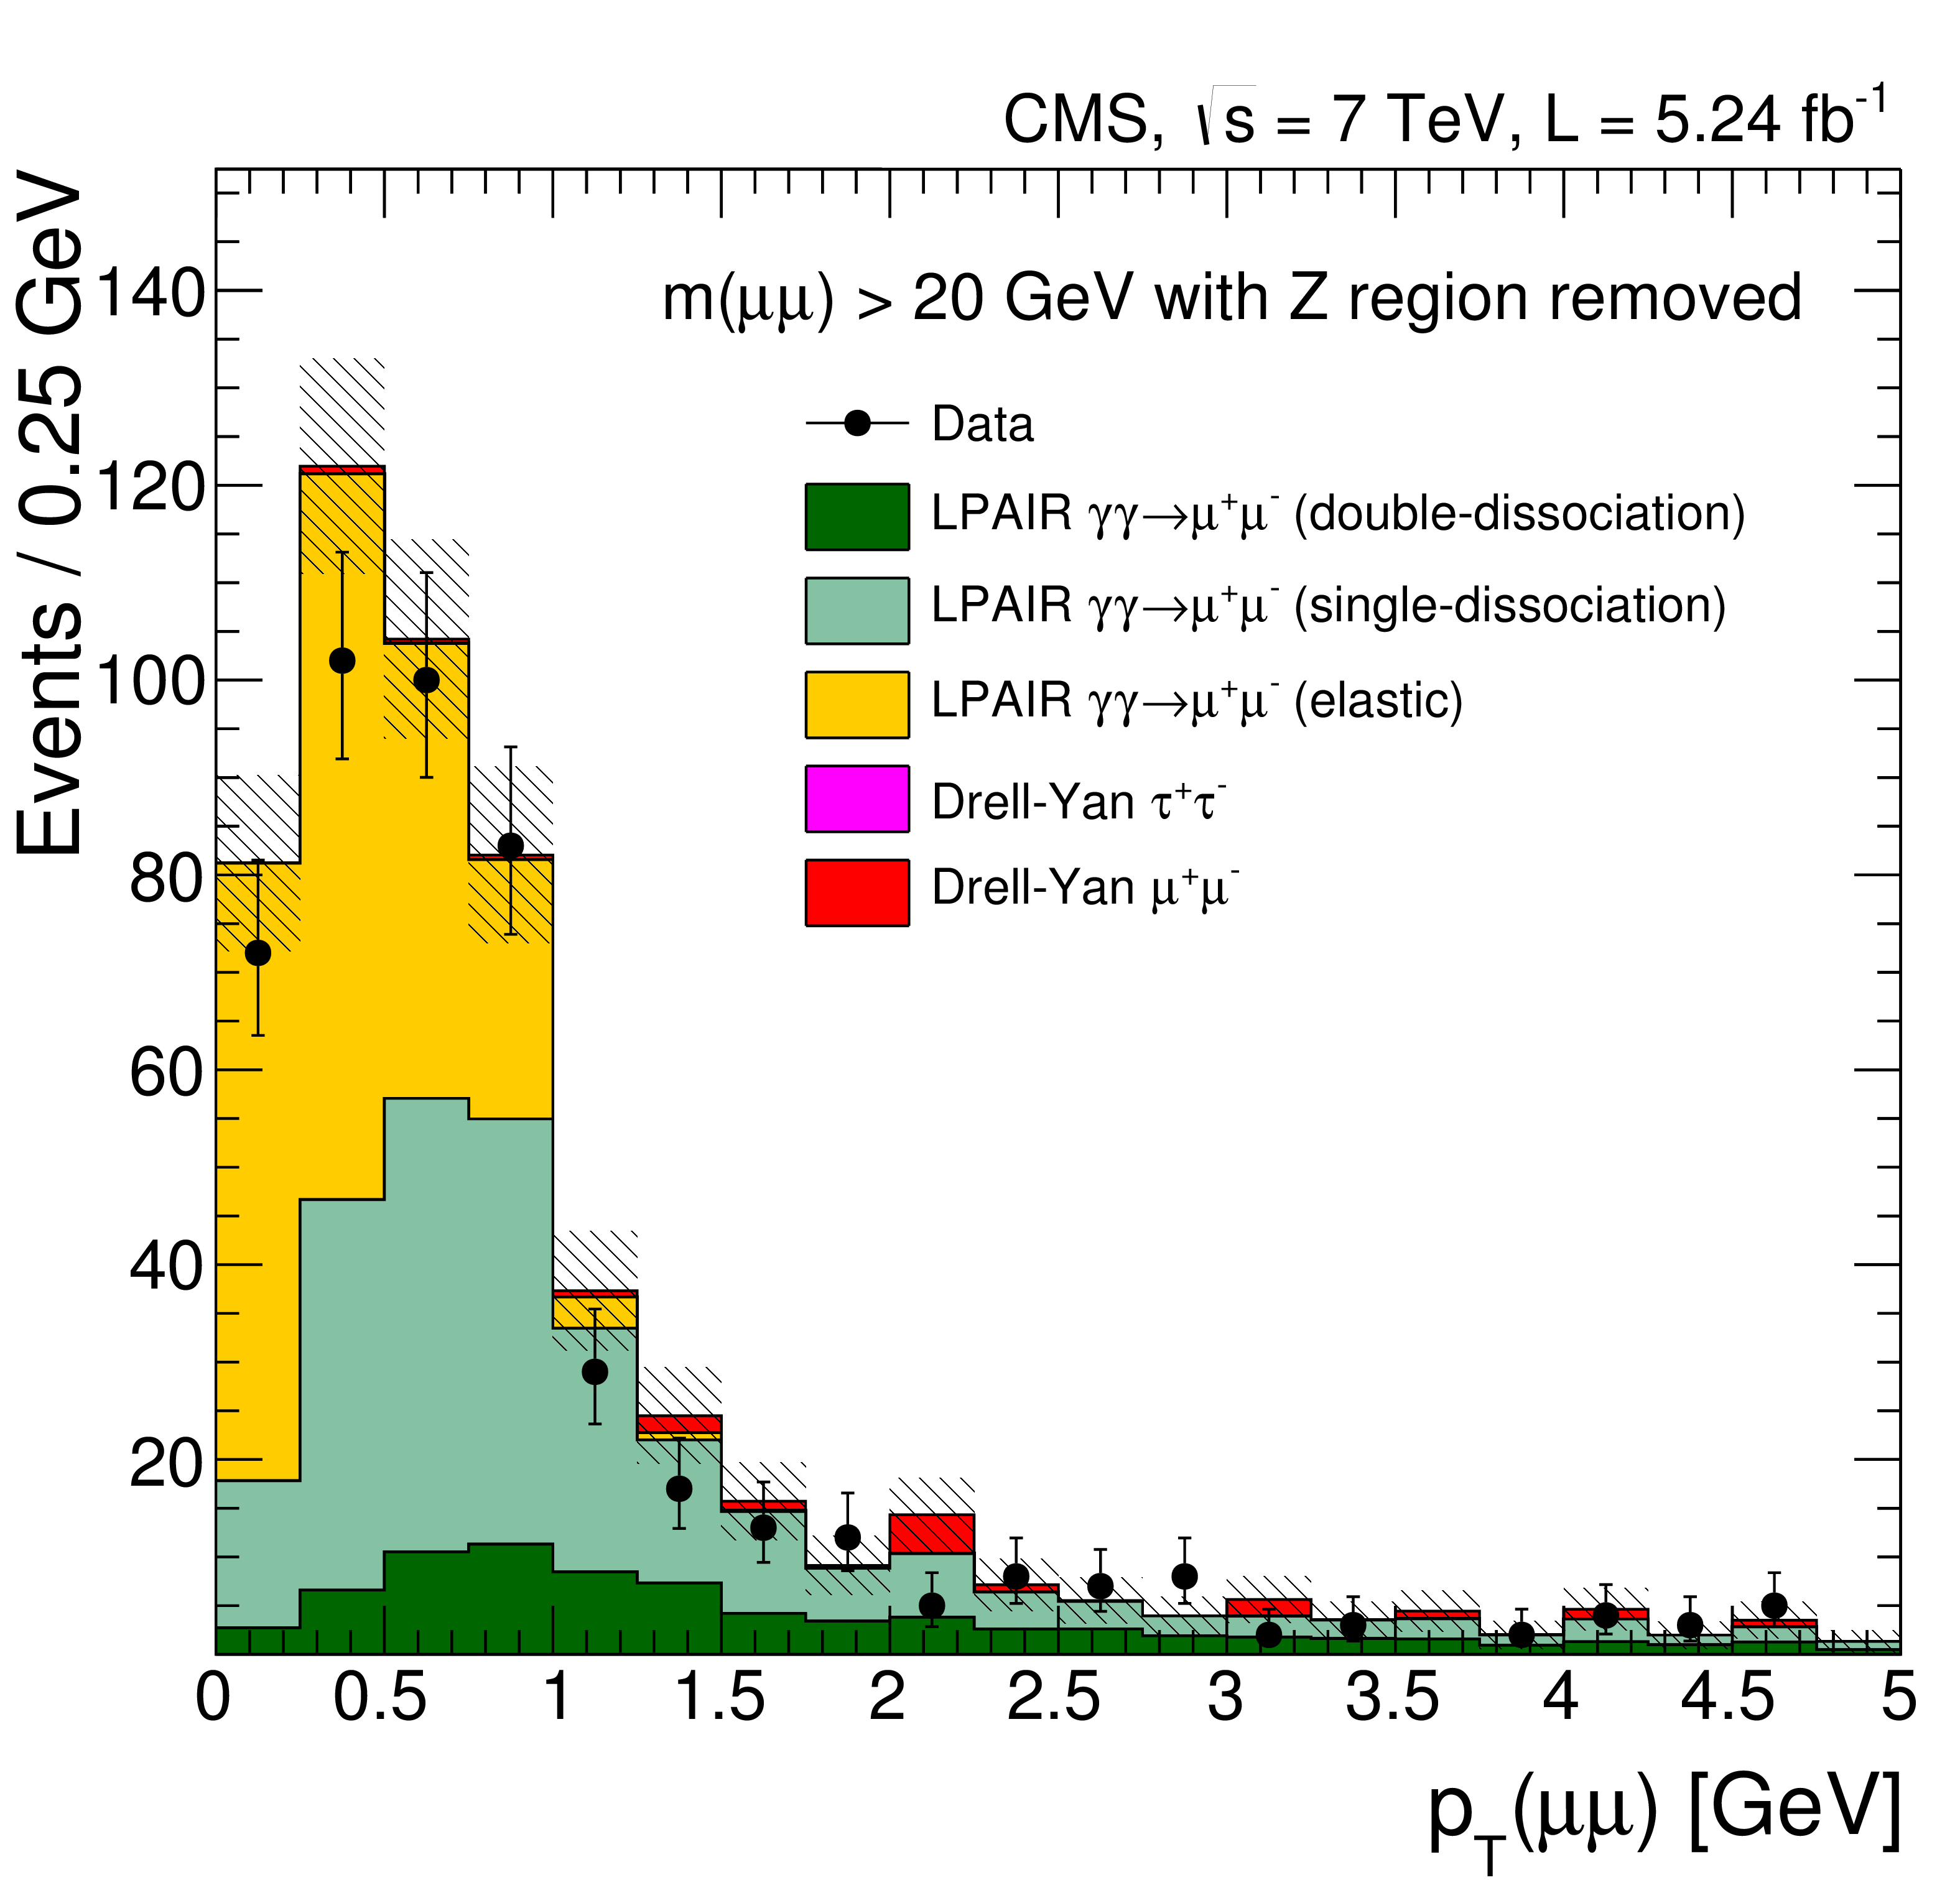
Figure 6-a:
Transverse momentum distribution for $\mu^+ \mu^- $ pairs with zero extra tracks passing the dissociation selection, for the $\mathrm{ Z } $ region only (left), and with the $\mathrm{ Z } $ region removed (right). The hatched bands indicate the statistical uncertainty in the simulation. |

png pdf |
Figure 6-b:
Transverse momentum distribution for $\mu^+ \mu^- $ pairs with zero extra tracks passing the dissociation selection, for the $\mathrm{ Z } $ region only (left), and with the $\mathrm{ Z } $ region removed (right). The hatched bands indicate the statistical uncertainty in the simulation. |

png pdf |
Figure 7-a:
Data compared to simulation in control region 1. The $\mu ^{\pm }\mathrm{ e } ^{\mp }$ invariant mass (above left) and acoplanarity (above right) are shown for events with 1-6 extra tracks on the $\mu ^{\pm }\mathrm{ e } ^{\mp }$ vertex and $ {p_{\mathrm {T}}} (\mu ^{\pm }\mathrm{ e } ^{\mp })> $ 30 GeV. The number of additional tracks on the electron-muon primary vertex is shown for events with $ {p_{\mathrm {T}}} (\mu ^{\pm }\mathrm{ e } ^{\mp })> $ 30 GeV (below). The shaded bands indicate the statistical uncertainty in the background estimation. The signal (open histogram) is shown stacked on top of the backgrounds. |

png pdf |
Figure 7-b:
Data compared to simulation in control region 1. The $\mu ^{\pm }\mathrm{ e } ^{\mp }$ invariant mass (above left) and acoplanarity (above right) are shown for events with 1-6 extra tracks on the $\mu ^{\pm }\mathrm{ e } ^{\mp }$ vertex and $ {p_{\mathrm {T}}} (\mu ^{\pm }\mathrm{ e } ^{\mp })> $ 30 GeV. The number of additional tracks on the electron-muon primary vertex is shown for events with $ {p_{\mathrm {T}}} (\mu ^{\pm }\mathrm{ e } ^{\mp })> $ 30 GeV (below). The shaded bands indicate the statistical uncertainty in the background estimation. The signal (open histogram) is shown stacked on top of the backgrounds. |

png pdf |
Figure 7-c:
Data compared to simulation in control region 1. The $\mu ^{\pm }\mathrm{ e } ^{\mp }$ invariant mass (above left) and acoplanarity (above right) are shown for events with 1-6 extra tracks on the $\mu ^{\pm }\mathrm{ e } ^{\mp }$ vertex and $ {p_{\mathrm {T}}} (\mu ^{\pm }\mathrm{ e } ^{\mp })> $ 30 GeV. The number of additional tracks on the electron-muon primary vertex is shown for events with $ {p_{\mathrm {T}}} (\mu ^{\pm }\mathrm{ e } ^{\mp })> $ 30 GeV (below). The shaded bands indicate the statistical uncertainty in the background estimation. The signal (open histogram) is shown stacked on top of the backgrounds. |

png pdf |
Figure 8-a:
Data compared to simulation in control region 2. The $\mu ^{\pm }\mathrm{ e } ^{\mp }$ invariant mass (above left) and acoplanarity (above right) are shown for events with 1-6 extra tracks on the $\mu ^{\pm }\mathrm{ e } ^{\mp }$ vertex and $ {p_{\mathrm {T}}} (\mu ^{\pm }\mathrm{ e } ^{\mp })< $ 30 GeV. The number of additional tracks on the electron-muon primary vertex is shown for events with $ {p_{\mathrm {T}}} (\mu ^{\pm }\mathrm{ e } ^{\mp })< $ 30 GeV (below). The shaded bands indicate the statistical uncertainty in the background estimation. The signal (open histogram) is shown stacked on top of the backgrounds. |

png pdf |
Figure 8-b:
Data compared to simulation in control region 2. The $\mu ^{\pm }\mathrm{ e } ^{\mp }$ invariant mass (above left) and acoplanarity (above right) are shown for events with 1-6 extra tracks on the $\mu ^{\pm }\mathrm{ e } ^{\mp }$ vertex and $ {p_{\mathrm {T}}} (\mu ^{\pm }\mathrm{ e } ^{\mp })< $ 30 GeV. The number of additional tracks on the electron-muon primary vertex is shown for events with $ {p_{\mathrm {T}}} (\mu ^{\pm }\mathrm{ e } ^{\mp })< $ 30 GeV (below). The shaded bands indicate the statistical uncertainty in the background estimation. The signal (open histogram) is shown stacked on top of the backgrounds. |

png pdf |
Figure 8-c:
Data compared to simulation in control region 2. The $\mu ^{\pm }\mathrm{ e } ^{\mp }$ invariant mass (above left) and acoplanarity (above right) are shown for events with 1-6 extra tracks on the $\mu ^{\pm }\mathrm{ e } ^{\mp }$ vertex and $ {p_{\mathrm {T}}} (\mu ^{\pm }\mathrm{ e } ^{\mp })< $ 30 GeV. The number of additional tracks on the electron-muon primary vertex is shown for events with $ {p_{\mathrm {T}}} (\mu ^{\pm }\mathrm{ e } ^{\mp })< $ 30 GeV (below). The shaded bands indicate the statistical uncertainty in the background estimation. The signal (open histogram) is shown stacked on top of the backgrounds. |

png pdf |
Figure 9-a:
Data compared to simulation for control region 3. The $\mu ^{\pm }\mathrm{ e } ^{\mp }$ invariant mass (left) and acoplanarity (right) are displayed for events with zero extra tracks on the $\mu ^{\pm }\mathrm{ e } ^{\mp }$ vertex and $ {p_{\mathrm {T}}} (\mu ^{\pm }\mathrm{ e } ^{\mp })< $ 30 GeV. The shaded bands indicate the statistical uncertainty in the background estimation. The signal (open histogram) is shown stacked on top of the backgrounds. |

png pdf |
Figure 9-b:
Data compared to simulation for control region 3. The $\mu ^{\pm }\mathrm{ e } ^{\mp }$ invariant mass (left) and acoplanarity (right) are displayed for events with zero extra tracks on the $\mu ^{\pm }\mathrm{ e } ^{\mp }$ vertex and $ {p_{\mathrm {T}}} (\mu ^{\pm }\mathrm{ e } ^{\mp })< $ 30 GeV. The shaded bands indicate the statistical uncertainty in the background estimation. The signal (open histogram) is shown stacked on top of the backgrounds. |

png pdf |
Figure 10-a:
The $\mu ^{\pm }\mathrm{ e } ^{\mp }$ invariant mass (top left), acoplanarity (top right), and missing transverse energy (bottom) distributions, for events in the signal region with zero extra tracks on the $\mu ^{\pm }\mathrm{ e } ^{\mp }$ vertex and $ {p_{\mathrm {T}}} (\mu ^{\pm }\mathrm{ e } ^{\mp })> $ 30 GeV. The backgrounds (solid histograms) are stacked with statistical uncertainties indicated by the shaded region, the signal (open histogram) is stacked on top of the backgrounds. |

png pdf |
Figure 10-b:
The $\mu ^{\pm }\mathrm{ e } ^{\mp }$ invariant mass (top left), acoplanarity (top right), and missing transverse energy (bottom) distributions, for events in the signal region with zero extra tracks on the $\mu ^{\pm }\mathrm{ e } ^{\mp }$ vertex and $ {p_{\mathrm {T}}} (\mu ^{\pm }\mathrm{ e } ^{\mp })> $ 30 GeV. The backgrounds (solid histograms) are stacked with statistical uncertainties indicated by the shaded region, the signal (open histogram) is stacked on top of the backgrounds. |

png pdf |
Figure 10-c:
The $\mu ^{\pm }\mathrm{ e } ^{\mp }$ invariant mass (top left), acoplanarity (top right), and missing transverse energy (bottom) distributions, for events in the signal region with zero extra tracks on the $\mu ^{\pm }\mathrm{ e } ^{\mp }$ vertex and $ {p_{\mathrm {T}}} (\mu ^{\pm }\mathrm{ e } ^{\mp })> $ 30 GeV. The backgrounds (solid histograms) are stacked with statistical uncertainties indicated by the shaded region, the signal (open histogram) is stacked on top of the backgrounds. |

png pdf |
Figure 11-a:
The $ {p_{\mathrm {T}}} (\mu ^{\pm }\mathrm{ e } ^{\mp })$ distribution for events with zero extra tracks (left) and multiplicity of extra tracks for events with $ {p_{\mathrm {T}}} (\mu ^{\pm }\mathrm{ e } ^{\mp })>$100 GeV (right). The backgrounds (solid histograms) are stacked with statistical uncertainties indicated by the shaded region, the signal (open histogram) is stacked on top of the backgrounds. The expected signal is shown for the SM $\gamma \gamma \rightarrow \mathrm{ W }^+ \mathrm{ W }^- $ signal (solid lines) and for two representative values of the anomalous couplings $a^{\mathrm{ W } }_{0}/\Lambda ^{2}$ and $a^{\mathrm{ W } }_{C}/\Lambda ^{2}$ (dotted and dashed lines). |
png pdf |
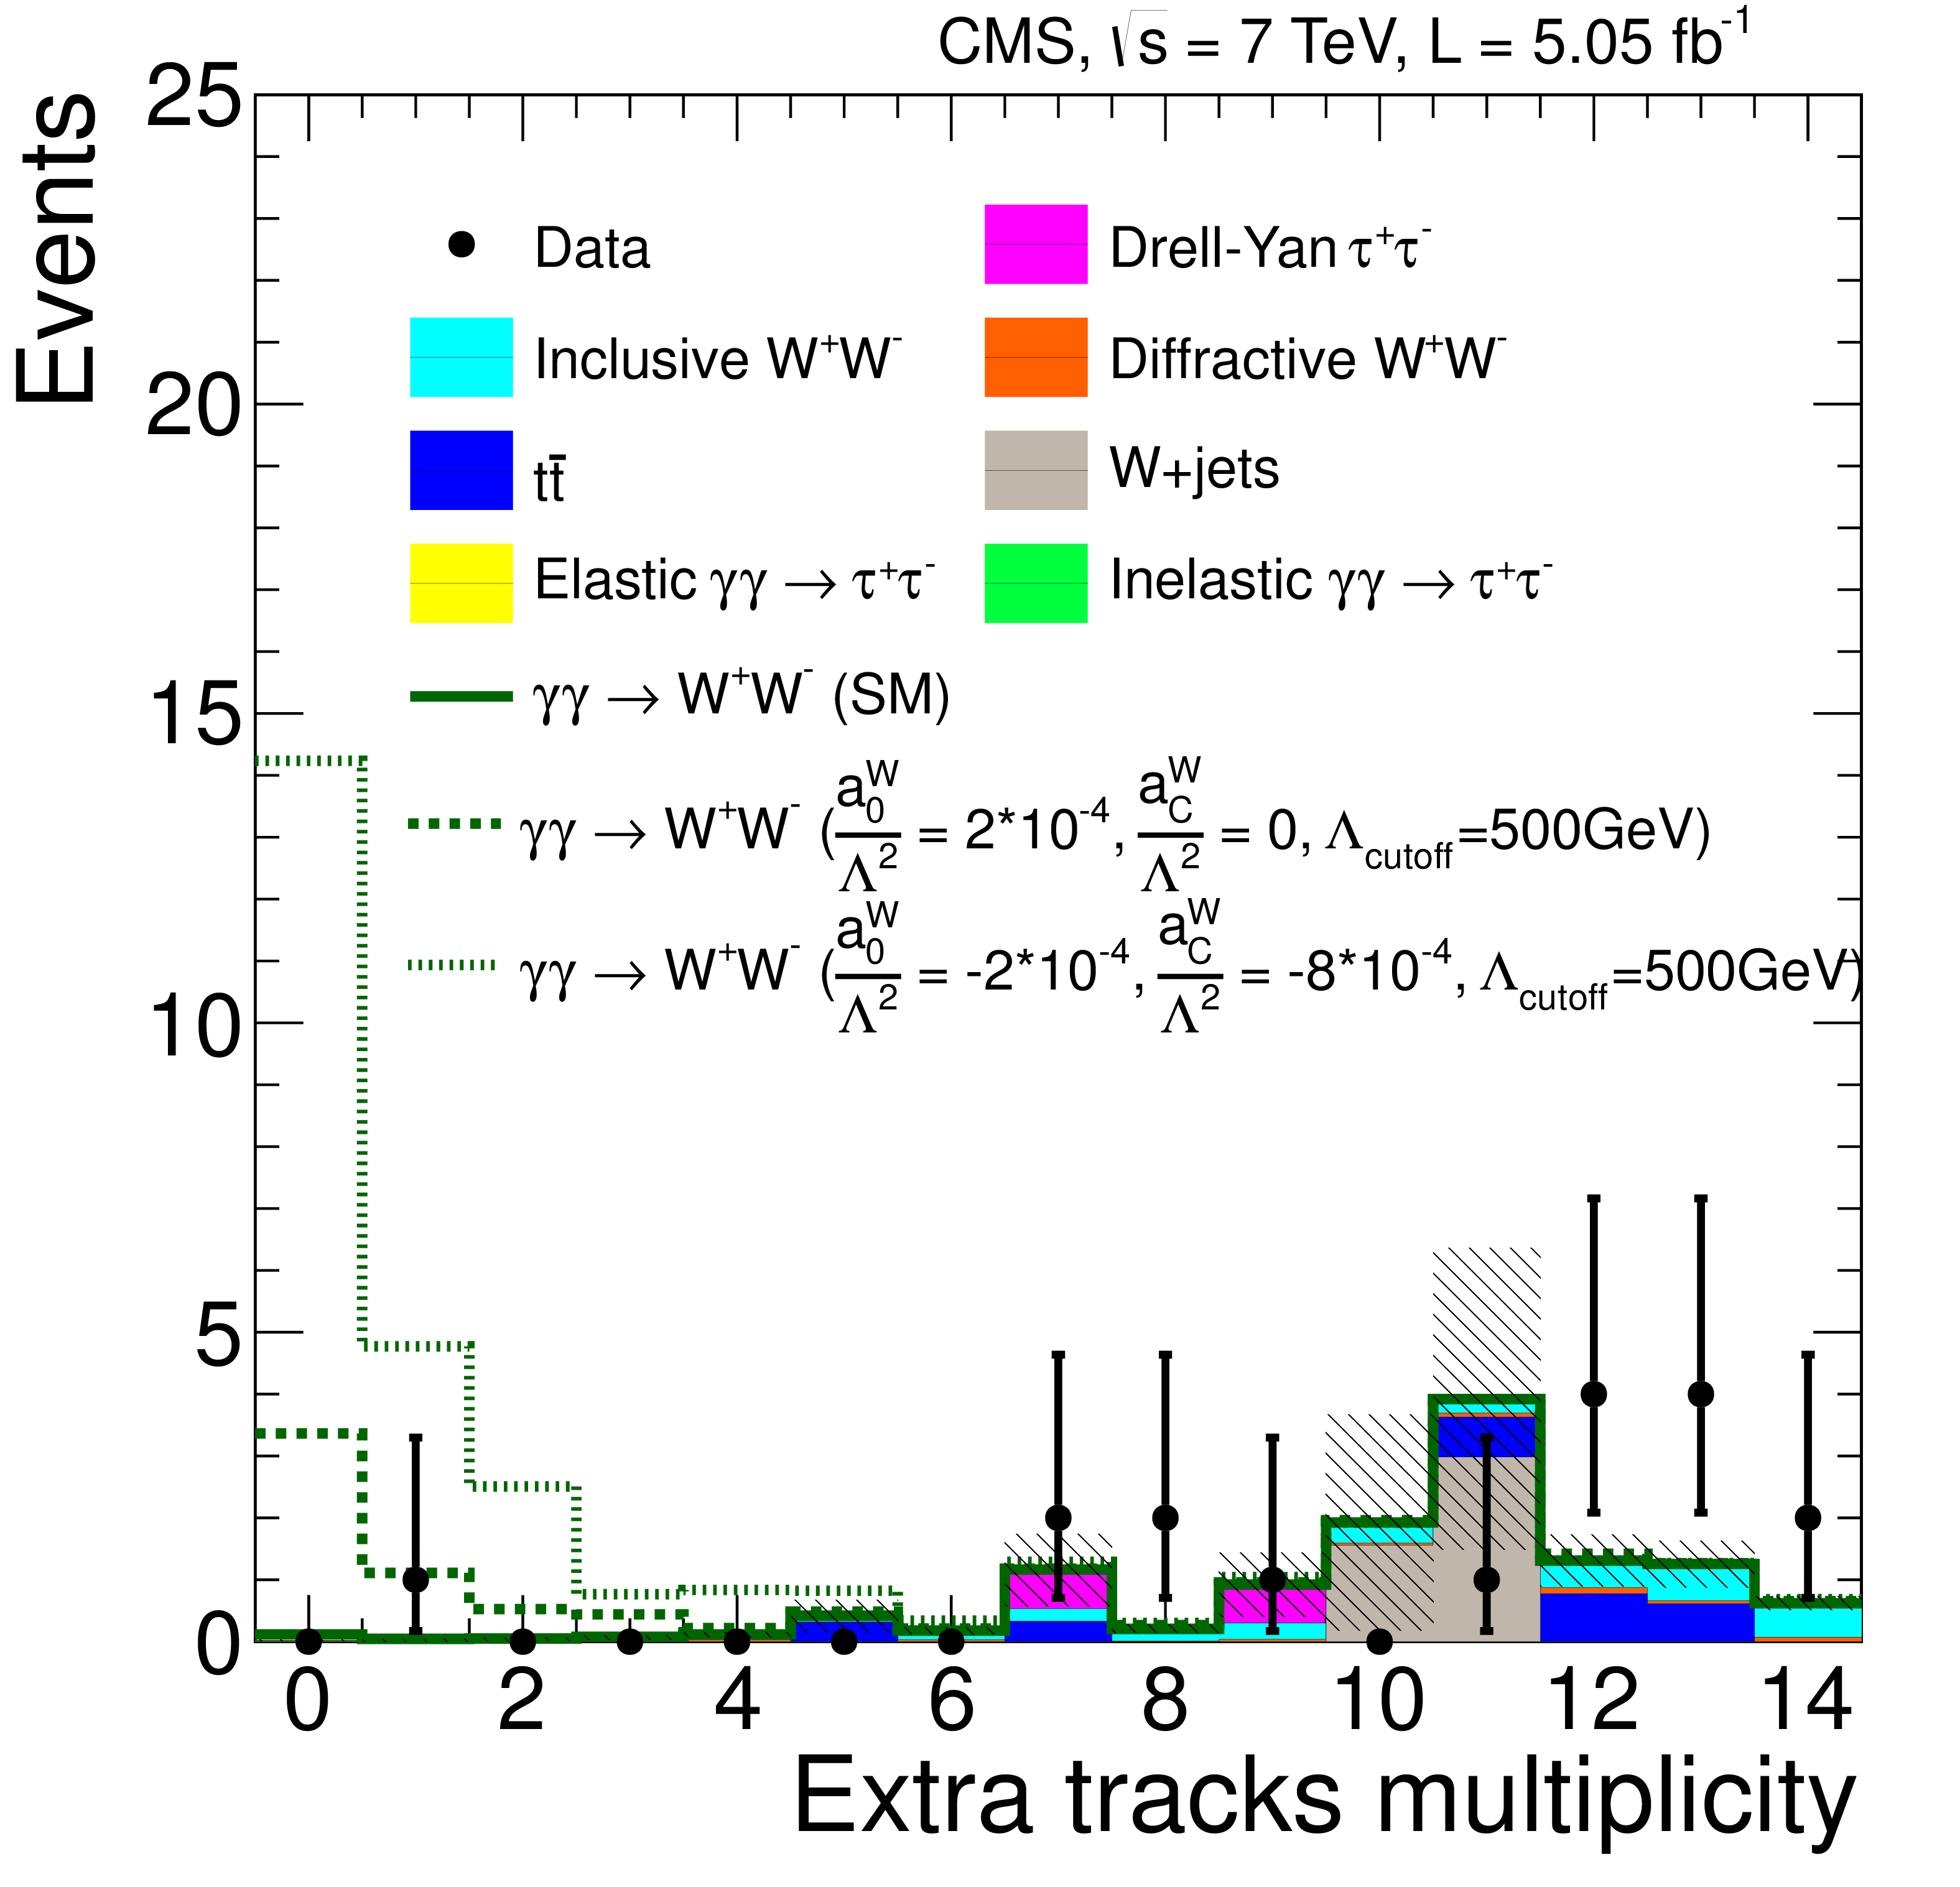
Figure 11-b:
The $ {p_{\mathrm {T}}} (\mu ^{\pm }\mathrm{ e } ^{\mp })$ distribution for events with zero extra tracks (left) and multiplicity of extra tracks for events with $ {p_{\mathrm {T}}} (\mu ^{\pm }\mathrm{ e } ^{\mp })>$100 GeV (right). The backgrounds (solid histograms) are stacked with statistical uncertainties indicated by the shaded region, the signal (open histogram) is stacked on top of the backgrounds. The expected signal is shown for the SM $\gamma \gamma \rightarrow \mathrm{ W }^+ \mathrm{ W }^- $ signal (solid lines) and for two representative values of the anomalous couplings $a^{\mathrm{ W } }_{0}/\Lambda ^{2}$ and $a^{\mathrm{ W } }_{C}/\Lambda ^{2}$ (dotted and dashed lines). |
png pdf |
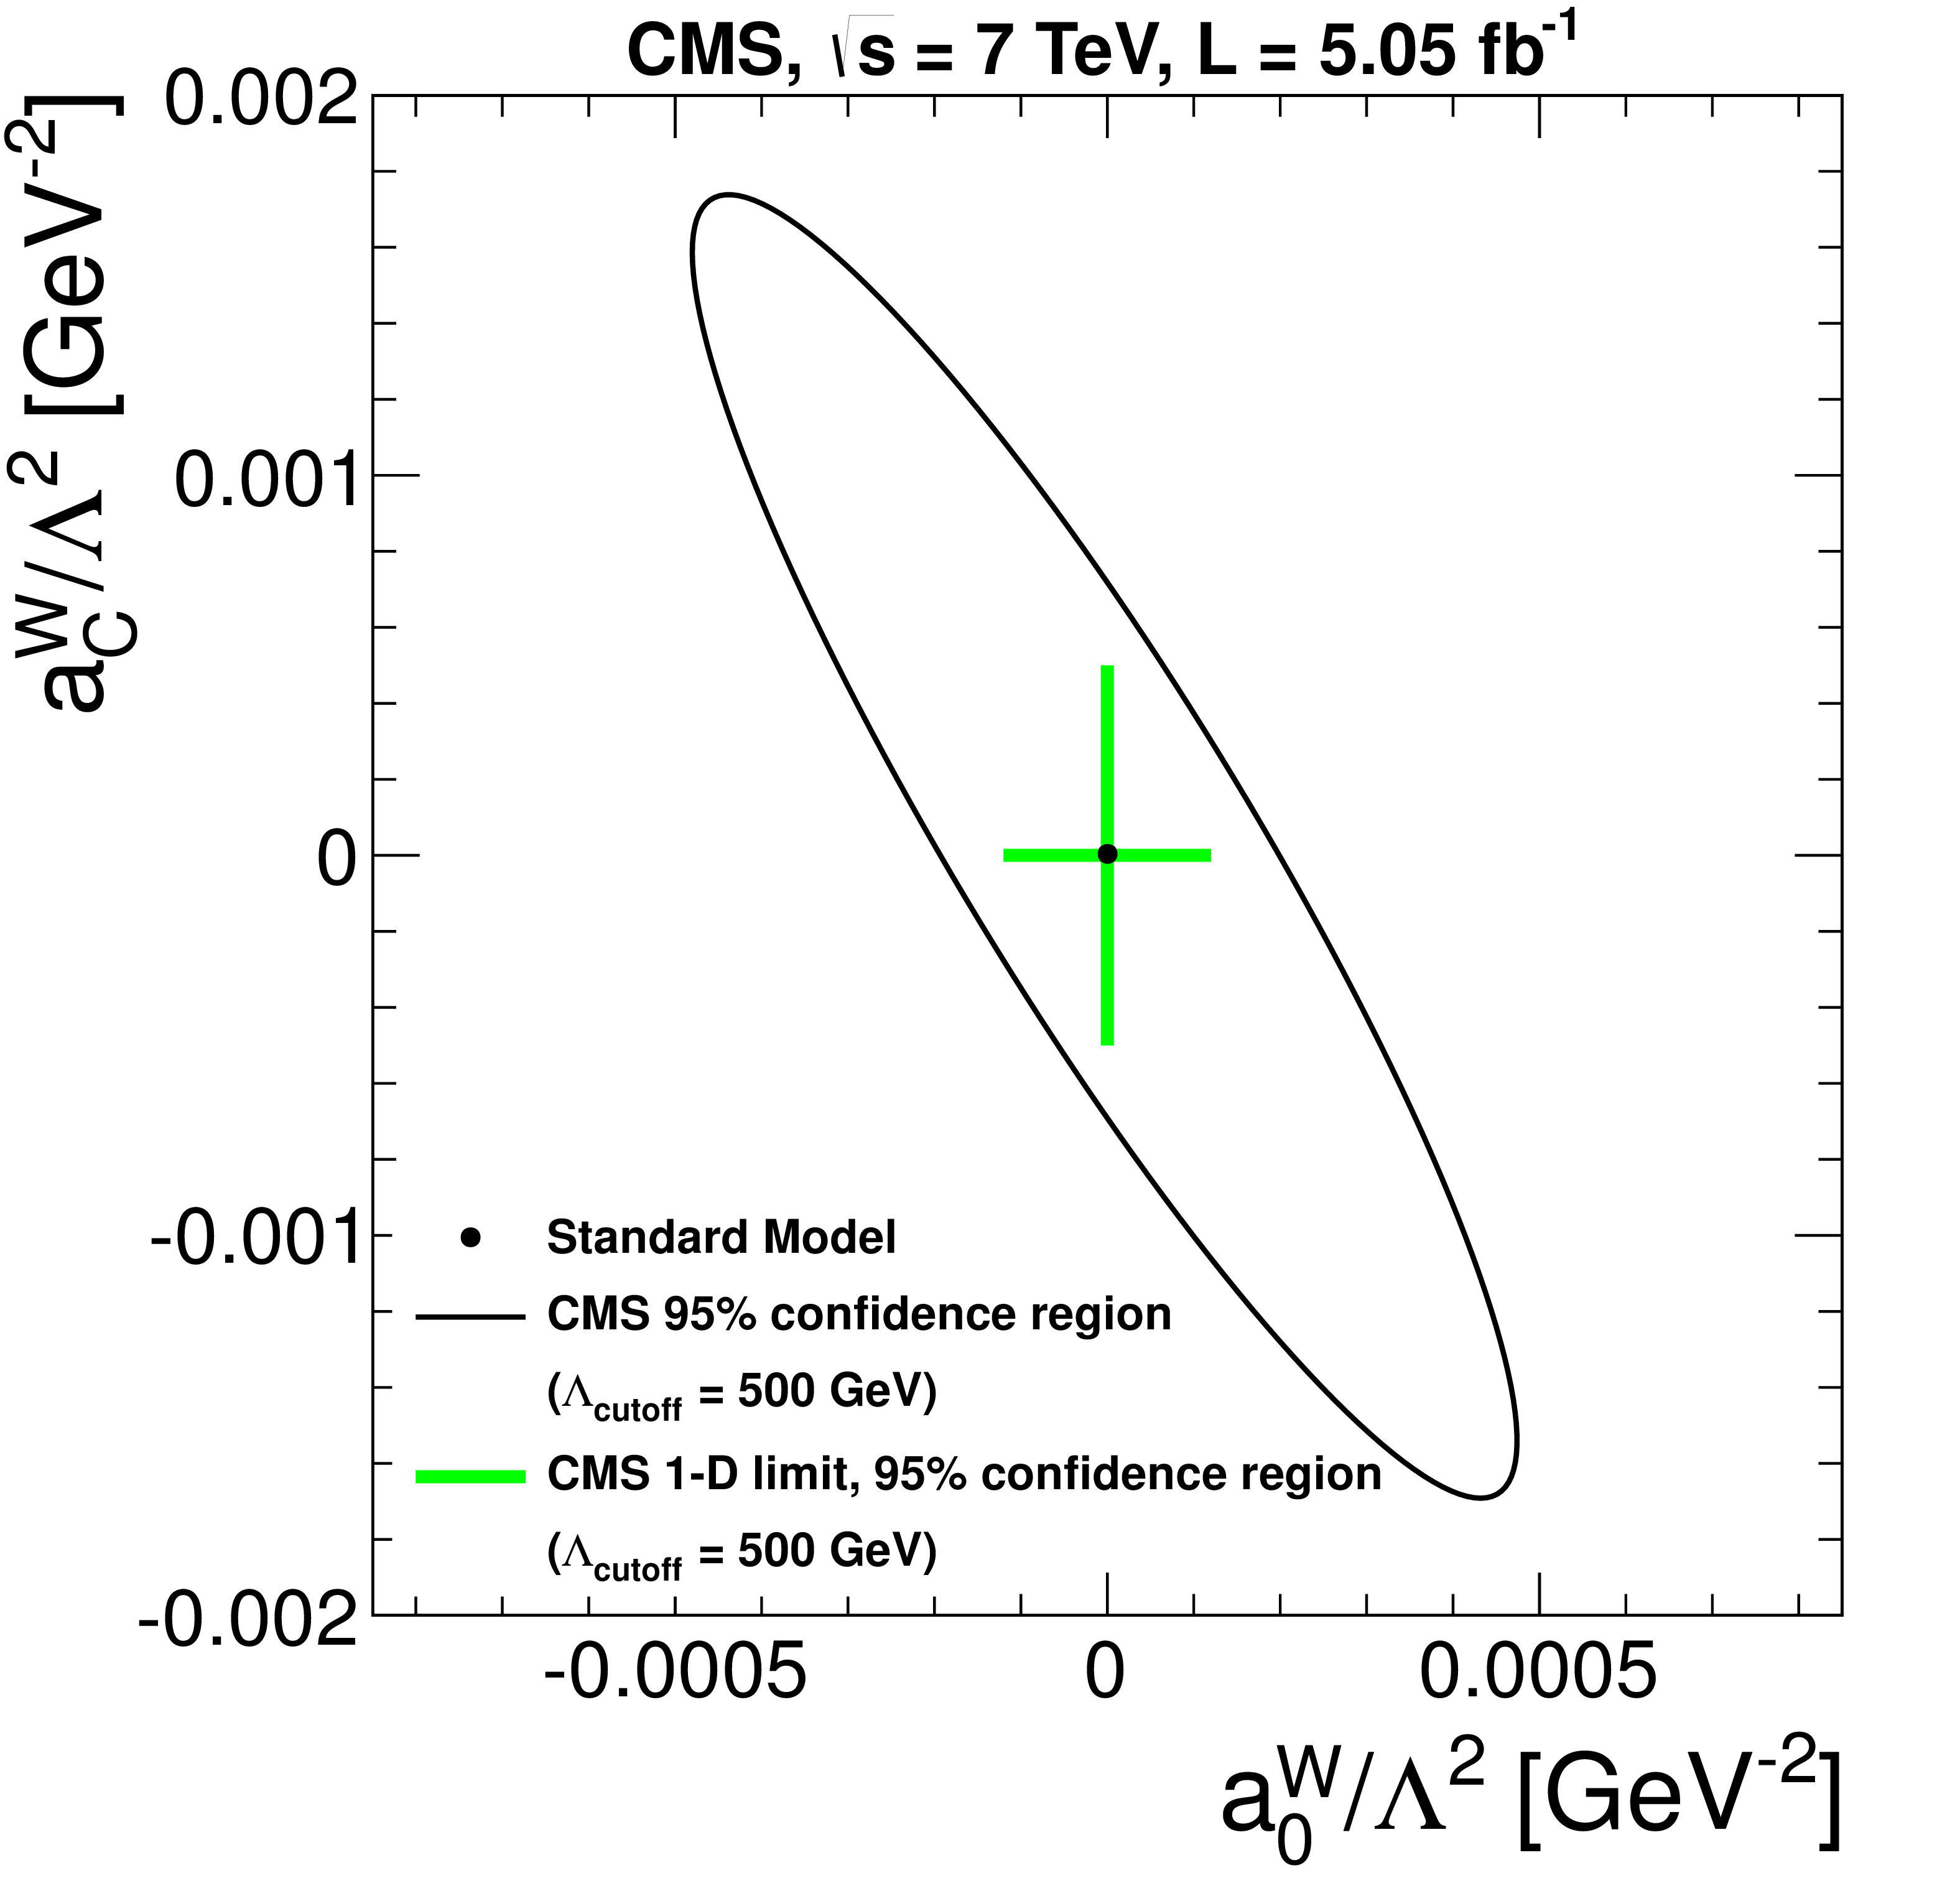
Figure 12:
Excluded values of the anomalous coupling parameters $a^{\mathrm{ W } }_{0}/\Lambda ^{2}$ and $a^{\mathrm{ W } }_{C}/\Lambda ^{2}$ with $\Lambda _{\text {cutoff}}= $ 500 GeV. The area outside the solid contour is excluded by this measurement at 95%CL, obtained for $ {p_{\mathrm {T}}} (\mu ,\mathrm{ e } )> $ 20 GeV, $ {| \eta (\mu ,\mathrm{ e } ) | }< $ 2.4 , $ {p_{\mathrm {T}}} (\mu ^{\pm }\mathrm{ e } ^{\mp })> $ 100 GeV. The predicted cross sections are rescaled to include the contribution from proton dissociation. |
| Tables | |

png pdf |
Table 1:
Total number of data events compared to the sum of all the background events expected in the two control regions, after trigger and preselection criteria. The uncertainties are statistical only. |

png pdf |
Table 2:
Product of the signal efficiency and the acceptance, visible cross section, and number of events selected in data at each stage of the selection. The preselection requires a reconstructed muon and electron of opposite charge, each having $ {p_{\mathrm {T}}} > $ 20 GeV and $ {| \eta | }< $ 2.4 , matched to a common primary vertex with fewer than 15 additional tracks. |

png pdf |
Table 3:
Definitions for the three independent control regions. |

png pdf |
Table 4:
Background event yields for the three independent control regions. |

png pdf |
Table 5:
Summary of systematic uncertainties. |

png pdf |
Table 6:
Signal efficiency of all trigger, reconstruction, and analysis selections, relative to the acceptance [$ {p_{\mathrm {T}}} (\mu ,\mathrm{ e } )> $ 20 GeV, $ {| \eta (\mu ,\mathrm{ e } ) | }< $ 2.4 , $ {p_{\mathrm {T}}} (\mu ^{\pm }\mathrm{ e } ^{\mp })> $ 100 GeV for the SM and for four representative values of the anomalous couplings $a^{\mathrm{ W } }_{0}/\Lambda ^{2}$ and $a^{\mathrm{ W } }_{C}/\Lambda ^{2}$, with and without form factors. |
| Summary |
|
A search for exclusive and quasi-exclusive two-photon production of $\mathrm{ W }^+\mathrm{ W }^-$ in the $\mu^{\pm}\mathrm{ e }^{\mp}$ channel, $\mathrm{ p }\mathrm{ p } \rightarrow\mathrm{ p }^{(*)}\mathrm{ W }^+\mathrm{ W }^-\mathrm{ p }^{(*)} \rightarrow\mathrm{ p }^{(*)}\mu^{\pm}\mathrm{ e }^{\mp}\mathrm{ p }^{(*)}$, has been performed using 5.05 fb$^{-1}$ of data collected at a center-of-mass energy of 7 TeV by the CMS detector in 2011. The efficiencies and theoretical predictions for the signal have been checked using $\gamma\gamma\rightarrow \mu^+\mu^-$ events, while the backgrounds are constrained from the data using control regions defined by the number of extra tracks and by the $p_\mathrm{T}$ of the $\mu^{\pm}\mathrm{ e }^{\mp}$ pair. In a region sensitive to SM $\gamma\gamma \rightarrow \mathrm{ W }^+\mathrm{ W }^-$ production with $p_{\mathrm{T}}(\mu^{\pm}\mathrm{ e }^{\mp})> $ 30 GeV, two events are observed, with a background expectation of 0.84$\pm$0.15. The signal expectation is 2.2$\pm$0.4 events, with the uncertainty on the theory reflecting the uncertainty on the proton dissociation contribution. The significance of the signal is $\sim$1$\sigma$, with a 95% CL upper limit on the SM cross section of 10.6 fb. In the region with $p_{\mathrm{T}}(\mu^{\pm}\mathrm{ e }^{\mp}) > $ 100 GeV, where the SM contribution is expected to be small, no events are observed. A limit is set on the partial cross section times branching fraction within the acceptance of $p_\mathrm{T}(\mu,\mathrm{ e })> $ 20 GeV, $|{\eta(\mu,\mathrm{ e })| }< $ 2.4 , $p_{\mathrm{T}}(\mu^{\pm}\mathrm{ e }^{\mp} > $ 100 GeV at 95% CL. |
|
|
Compact Muon Solenoid LHC, CERN |
|

|

|

|

|

|