

Compact Muon Solenoid
LHC, CERN
| CMS-FSQ-12-025 ; CERN-PH-EP-2015-176 | ||
| Measurement of the underlying event activity using charged-particle jets in proton-proton collisions at $\sqrt{s}=$ 2.76 TeV | ||
| CMS Collaboration | ||
| 26 July 2015 | ||
| J. High Energy Phys. 09 (2015) 137 | ||
| Abstract: A measurement of the underlying event (UE) activity in proton-proton collisions is performed using events with charged-particle jets produced in the central pseudorapidity region ($ |{\eta^{\text{jet}}} |$ < 2) and with transverse momentum $ 1 < p_{\mathrm{T}} ^{\text{jet}} < $ 100 GeV. The analysis uses a data sample collected at a centre-of-mass energy of 2.76 TeV with the CMS experiment at the LHC. The UE activity is measured as a function of $ p_{\mathrm{T}}^\text{jet} $ in terms of the average multiplicity and scalar sum of transverse momenta ($ p_{\mathrm{T}} $) of charged particles, with $ | {\eta} | < 2$ and $ p_{\mathrm{T}} > $ 0.5 GeV, in the azimuthal region transverse to the highest $ p_{\mathrm{T}} $ jet direction. By further dividing the transverse region into two regions of smaller and larger activity, various components of the UE activity are separated. The measurements are compared to previous results at 0.9 and 7 TeV, and to predictions of several Monte Carlo event generators, providing constraints on the modelling of the UE dynamics. | ||
| Links: e-print arXiv:1507.07229 [hep-ex] (PDF) ; CDS record ; inSPIRE record ; Rivet record ; HepData record ; CADI line (restricted) ; | ||
| Figures | |
png pdf |
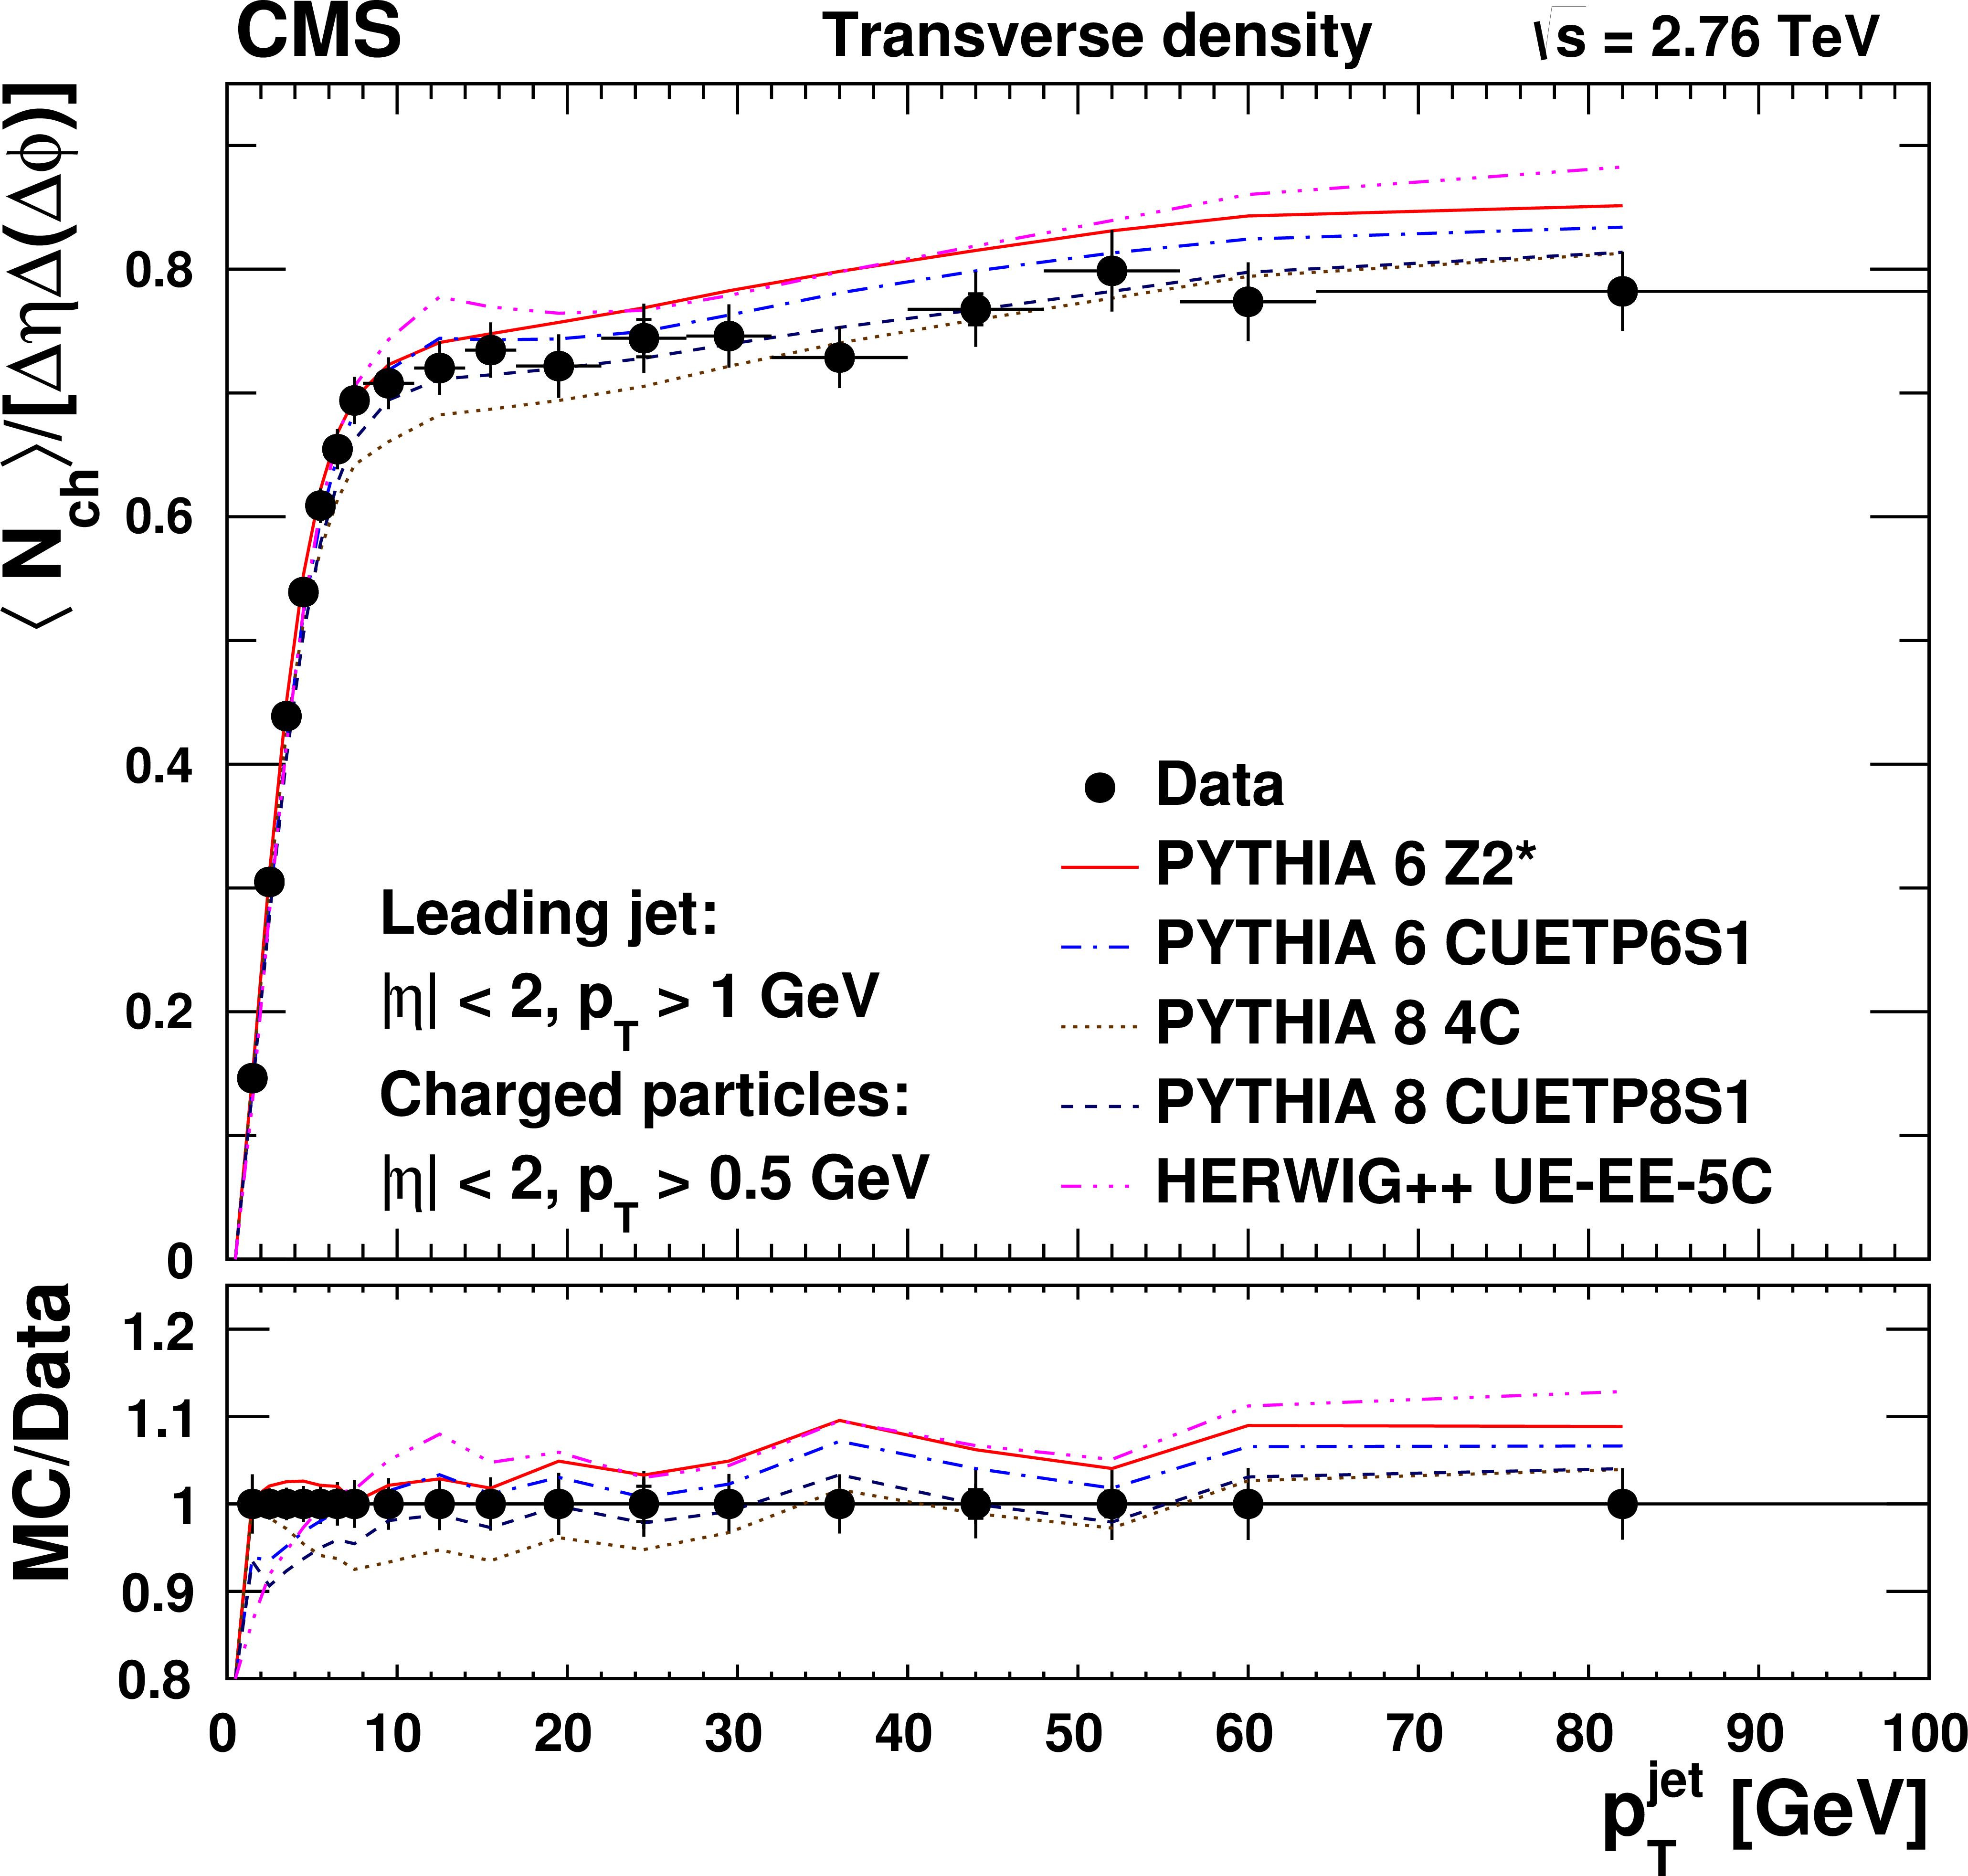
Figure 1-a:
Measured (a) particle density, and (b) $\Sigma {p_{\mathrm {T}}} $ density, in the transverse region relative to the leading charged-particle jet in the event ($ {| \eta | }<2$, $60 {^\circ }< {| \Delta \varphi | } < 120 {^\circ }$), as a function $ { {p_{\mathrm {T}}} ^{\text {jet}}} $. The data (symbols) are compared to various MC simulations (curves). The ratios of MC simulations to the measurements are shown in the bottom panels. The inner error bars correspond to the statistical uncertainties, and the outer error bars represent the statistical and systematic uncertainties added in quadrature. |
png pdf |
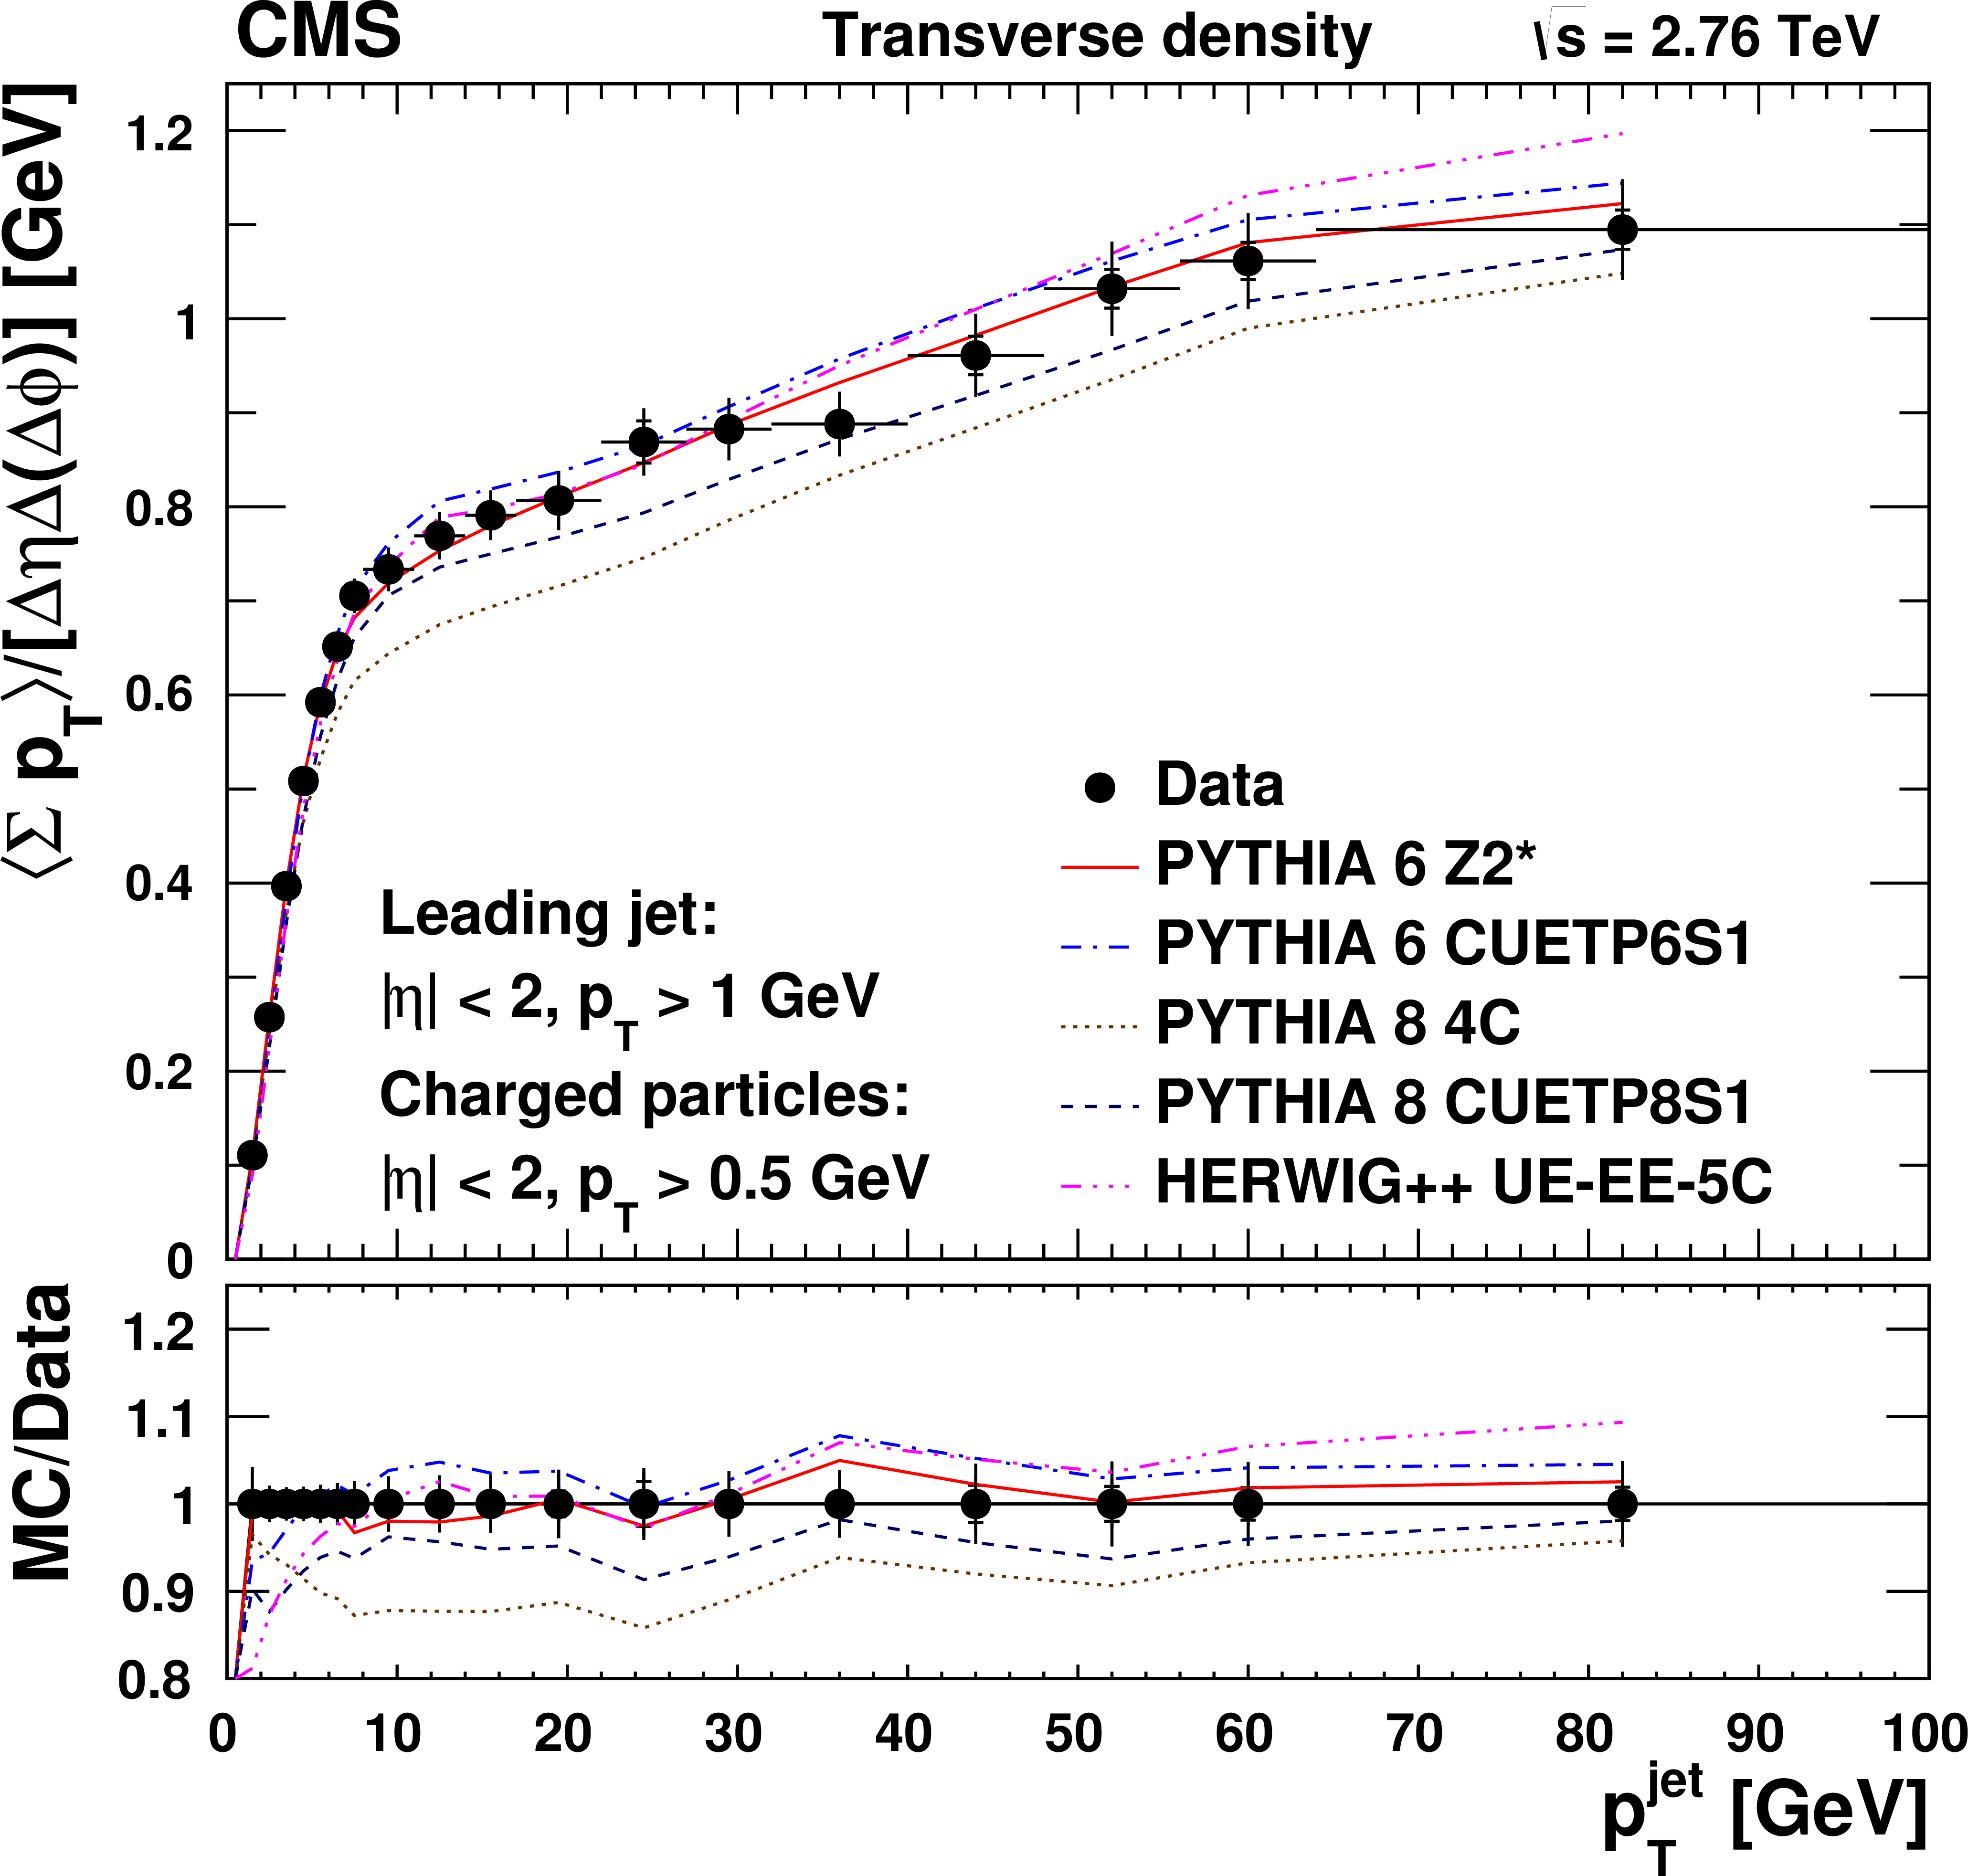
Figure 1-b:
Measured (a) particle density, and (b) $\Sigma {p_{\mathrm {T}}} $ density, in the transverse region relative to the leading charged-particle jet in the event ($ {| \eta | }<2$, $60 {^\circ }< {| \Delta \varphi | } < 120 {^\circ }$), as a function $ { {p_{\mathrm {T}}} ^{\text {jet}}} $. The data (symbols) are compared to various MC simulations (curves). The ratios of MC simulations to the measurements are shown in the bottom panels. The inner error bars correspond to the statistical uncertainties, and the outer error bars represent the statistical and systematic uncertainties added in quadrature. |
png pdf |
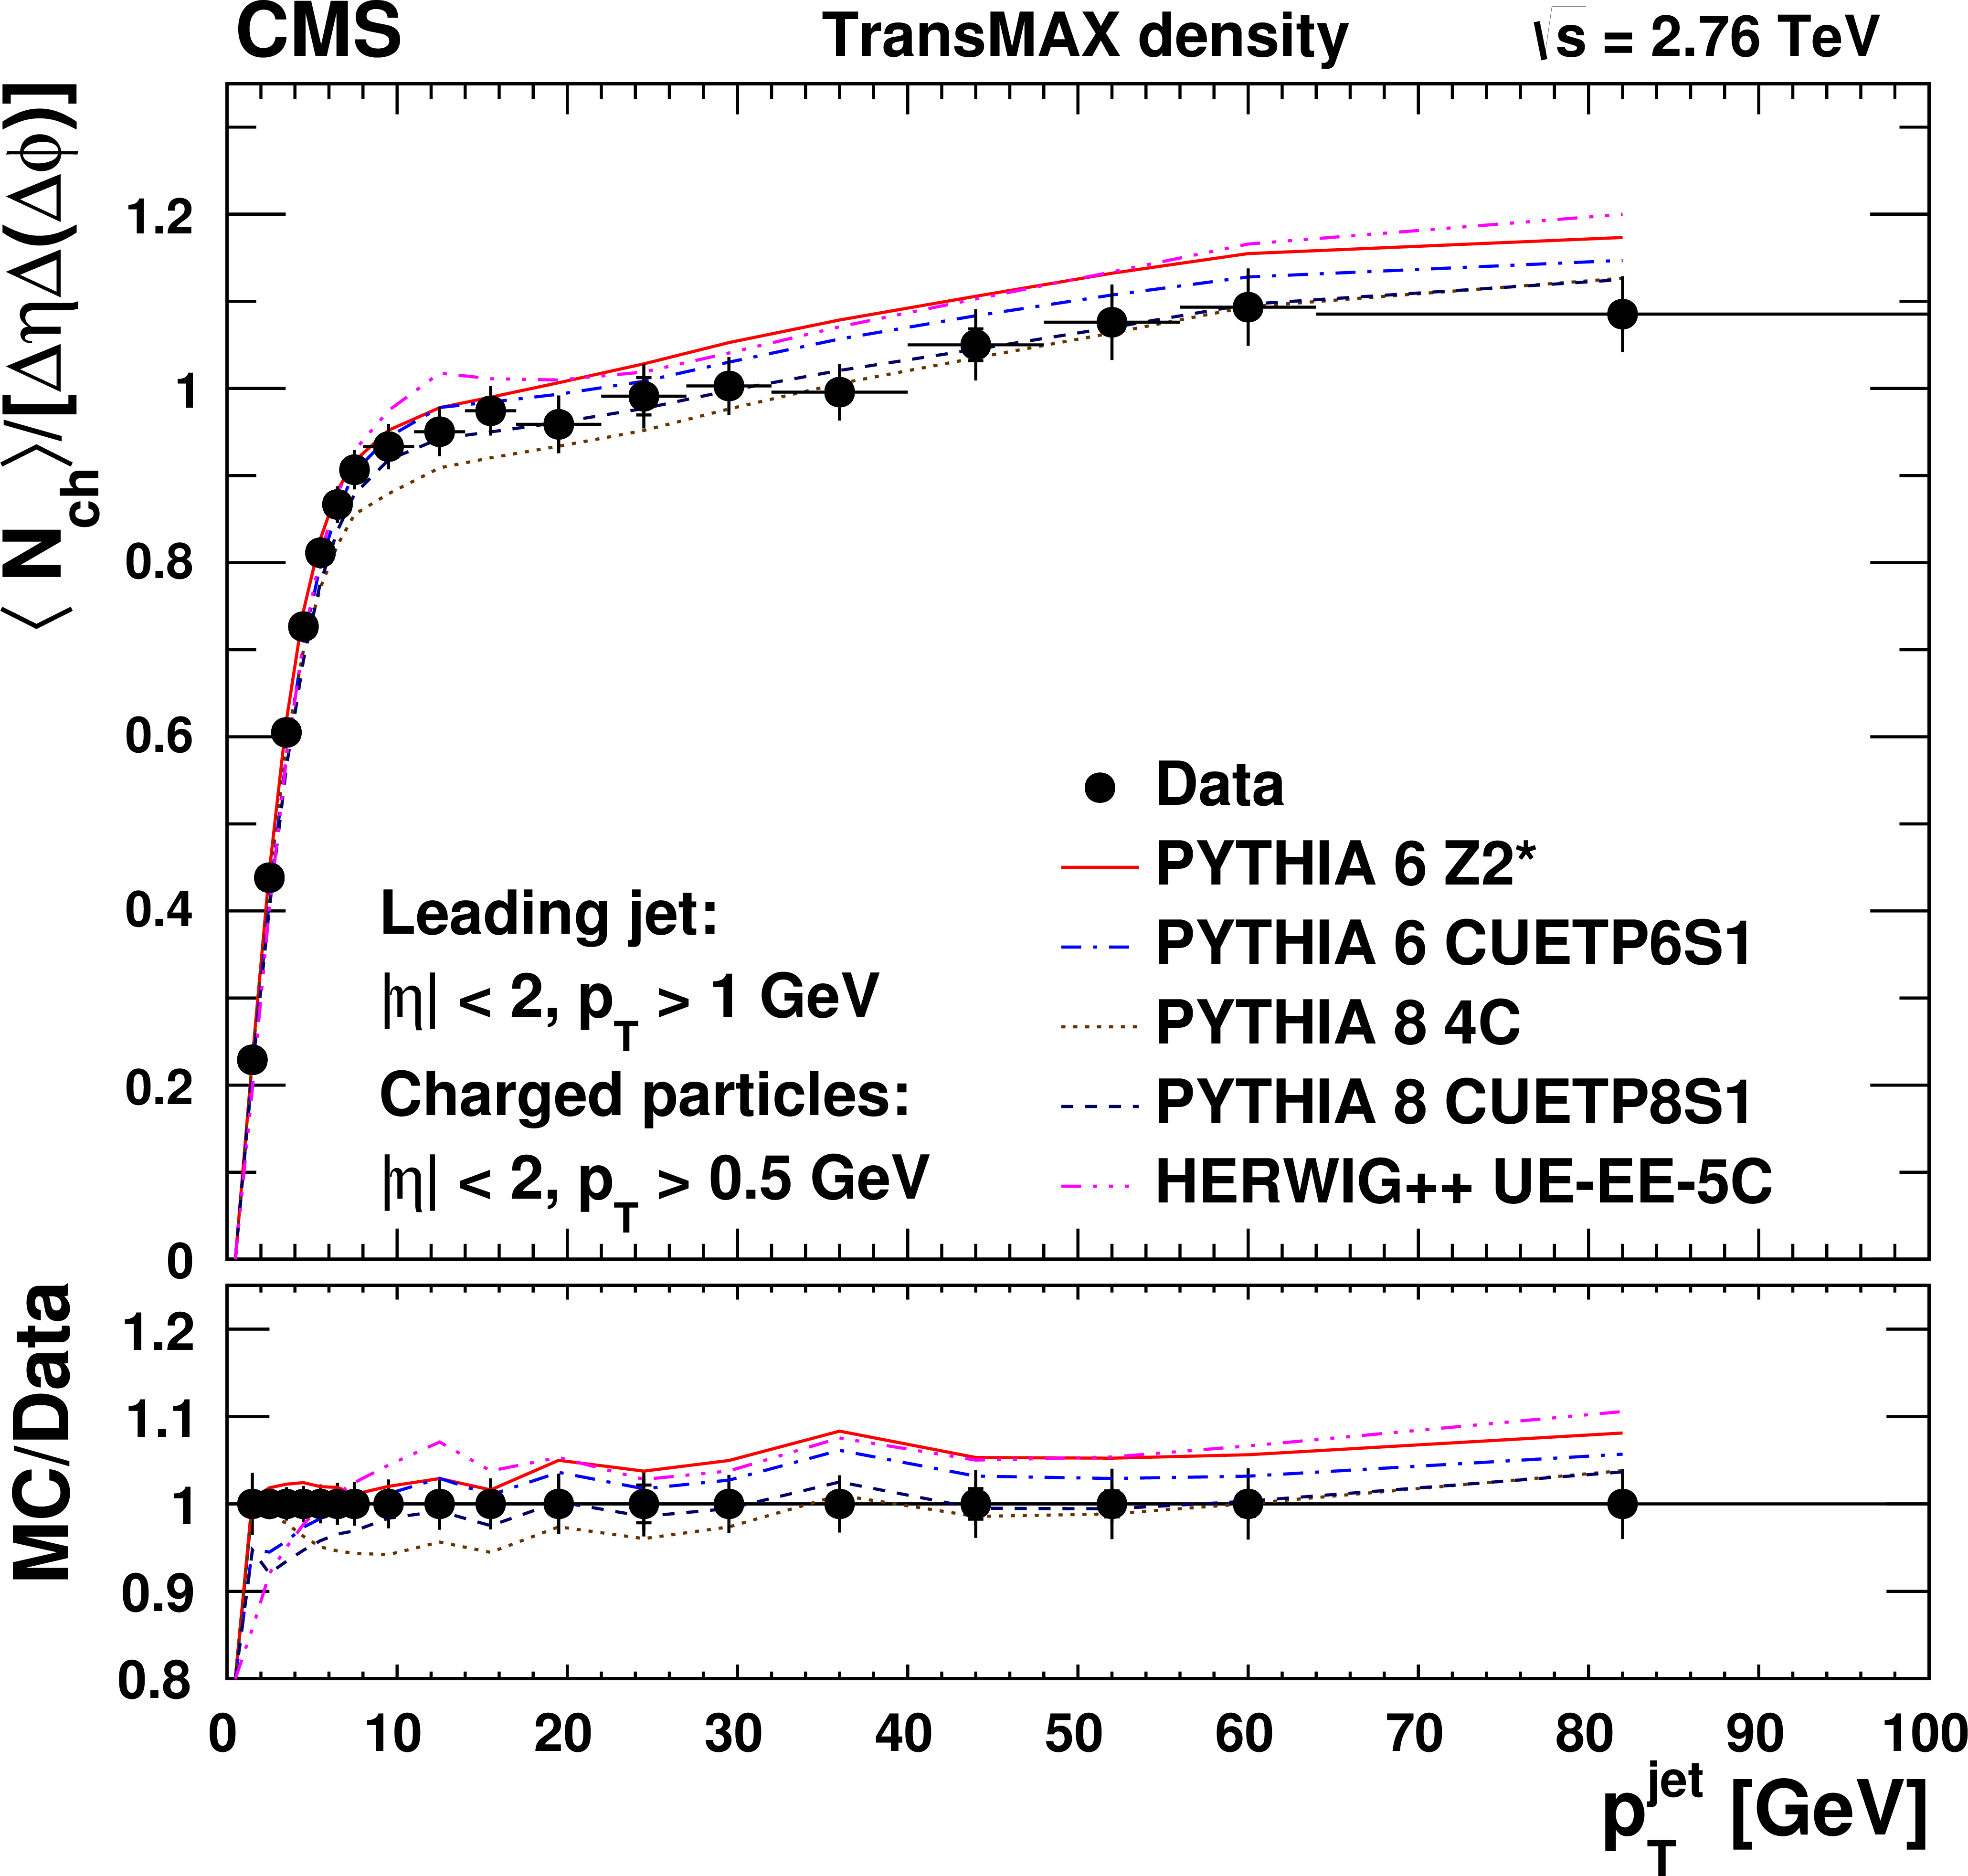
Figure 2-a:
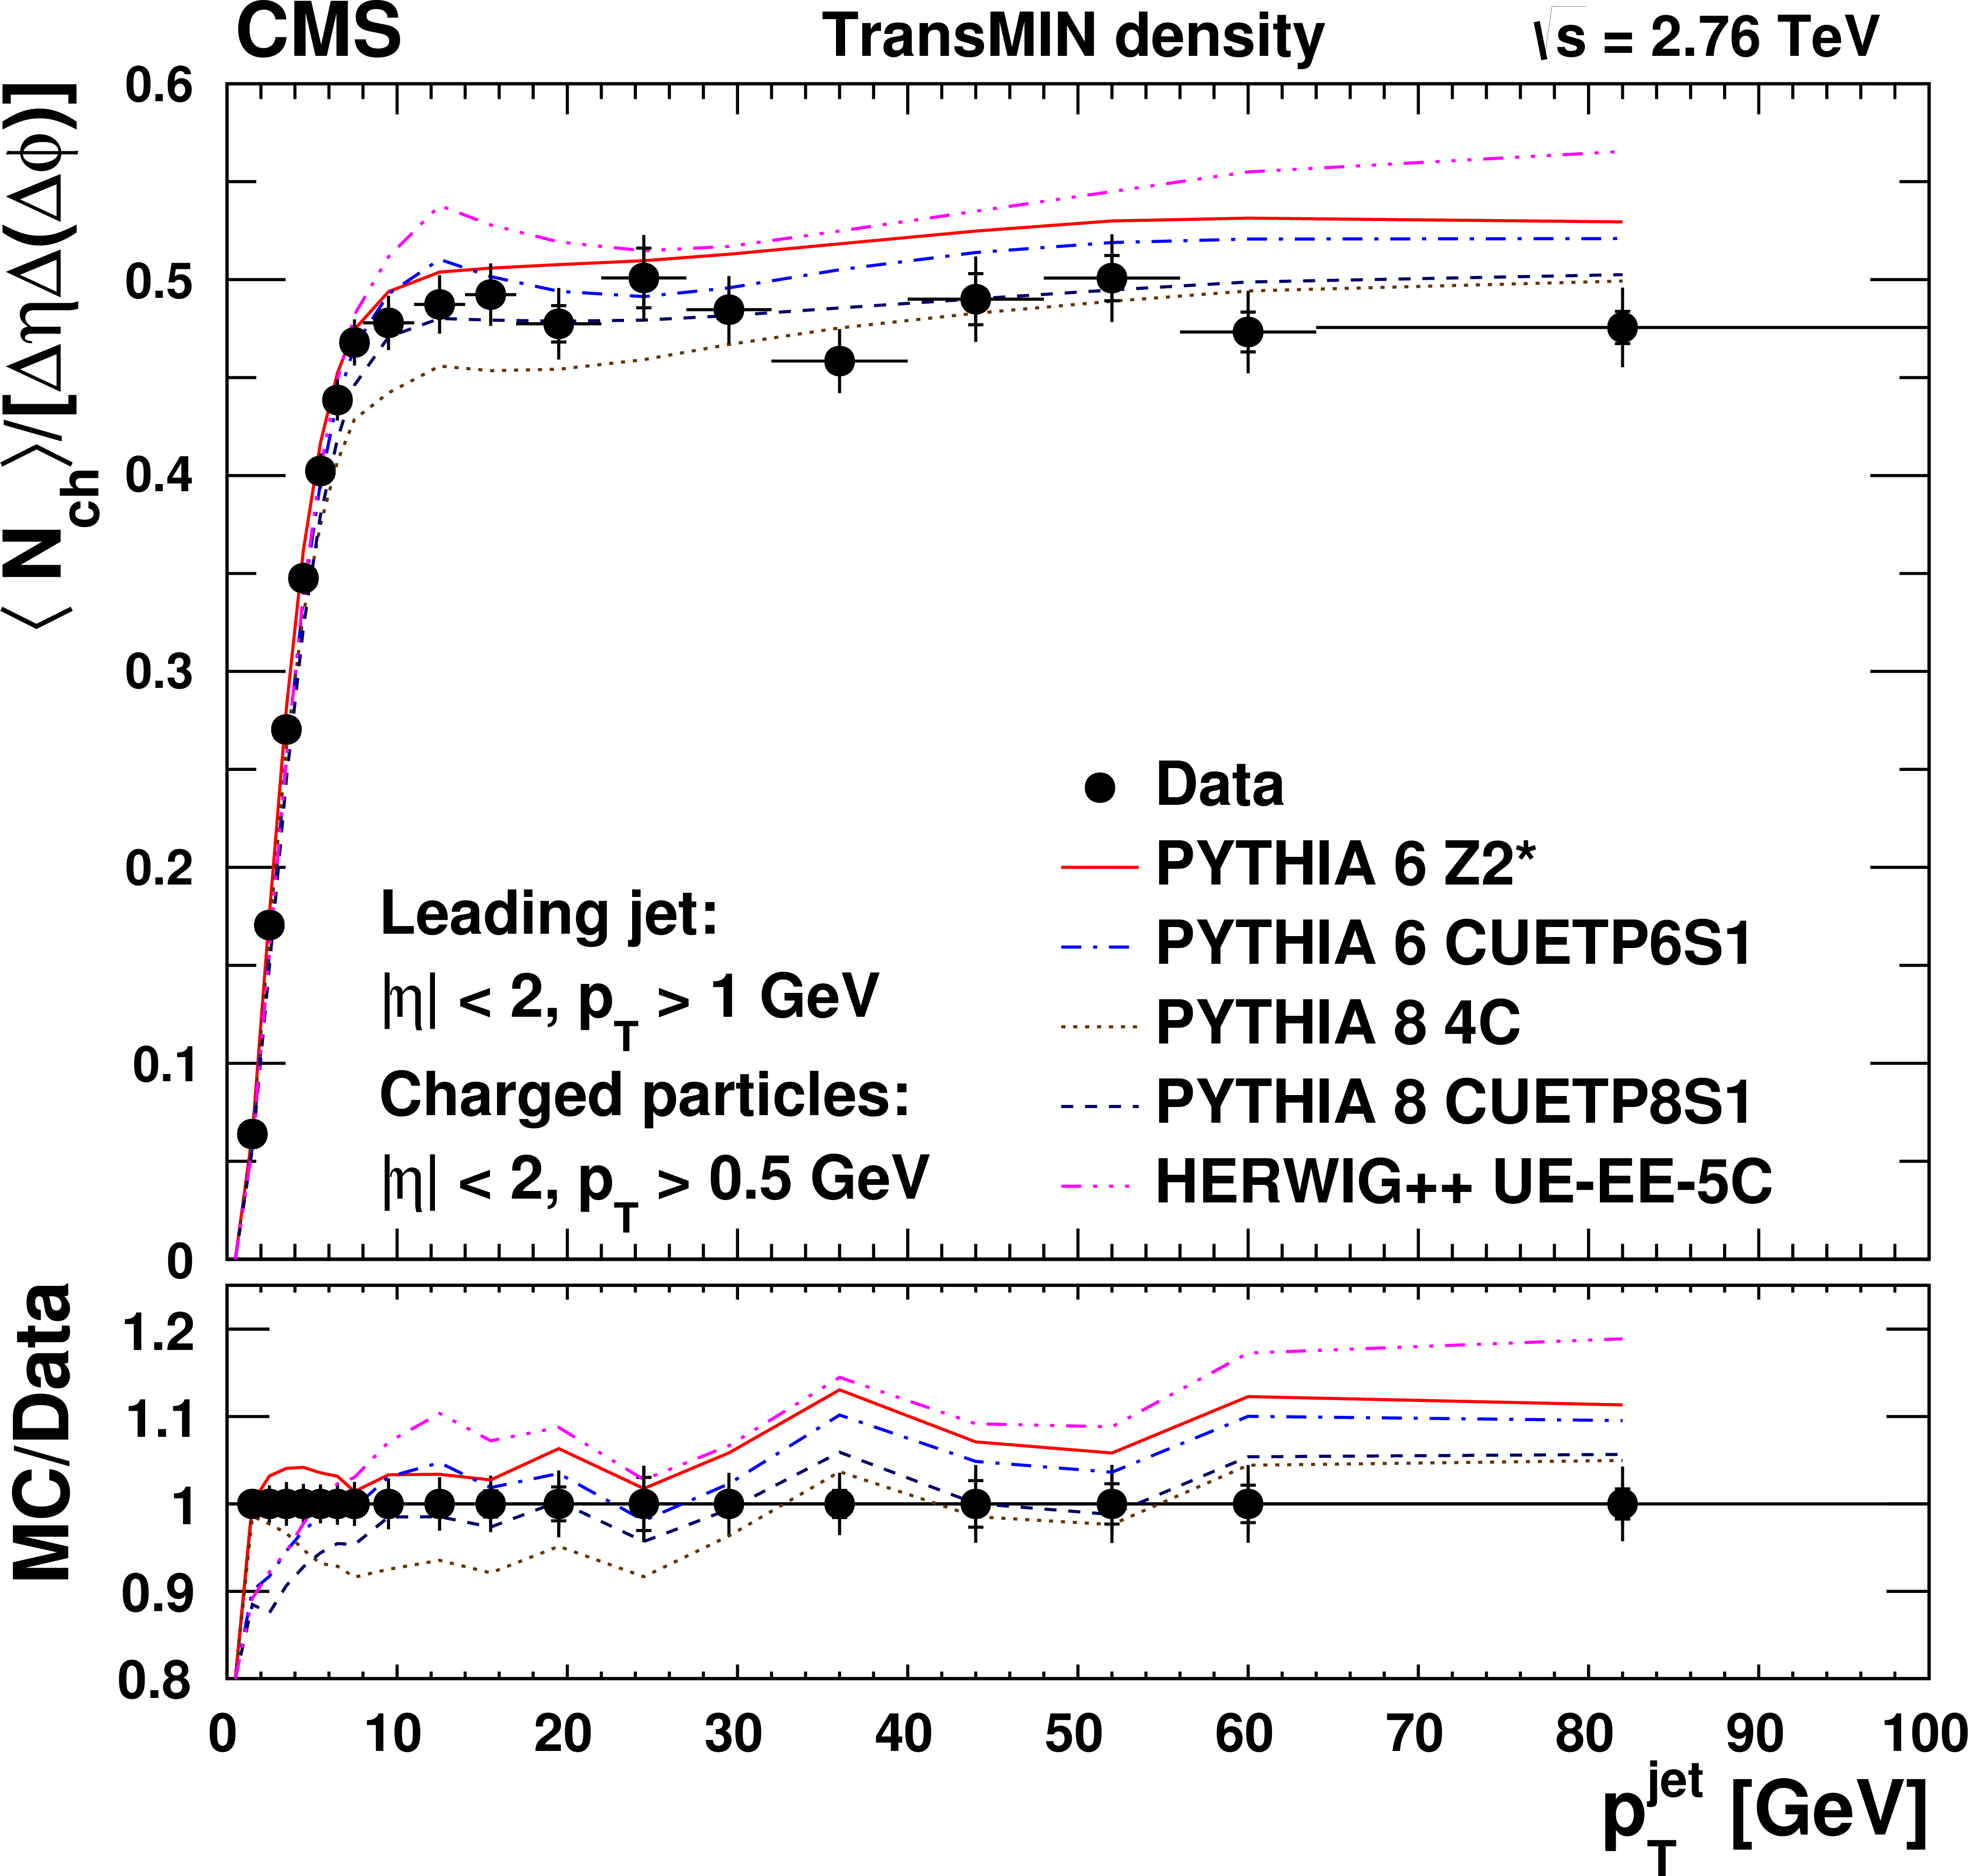
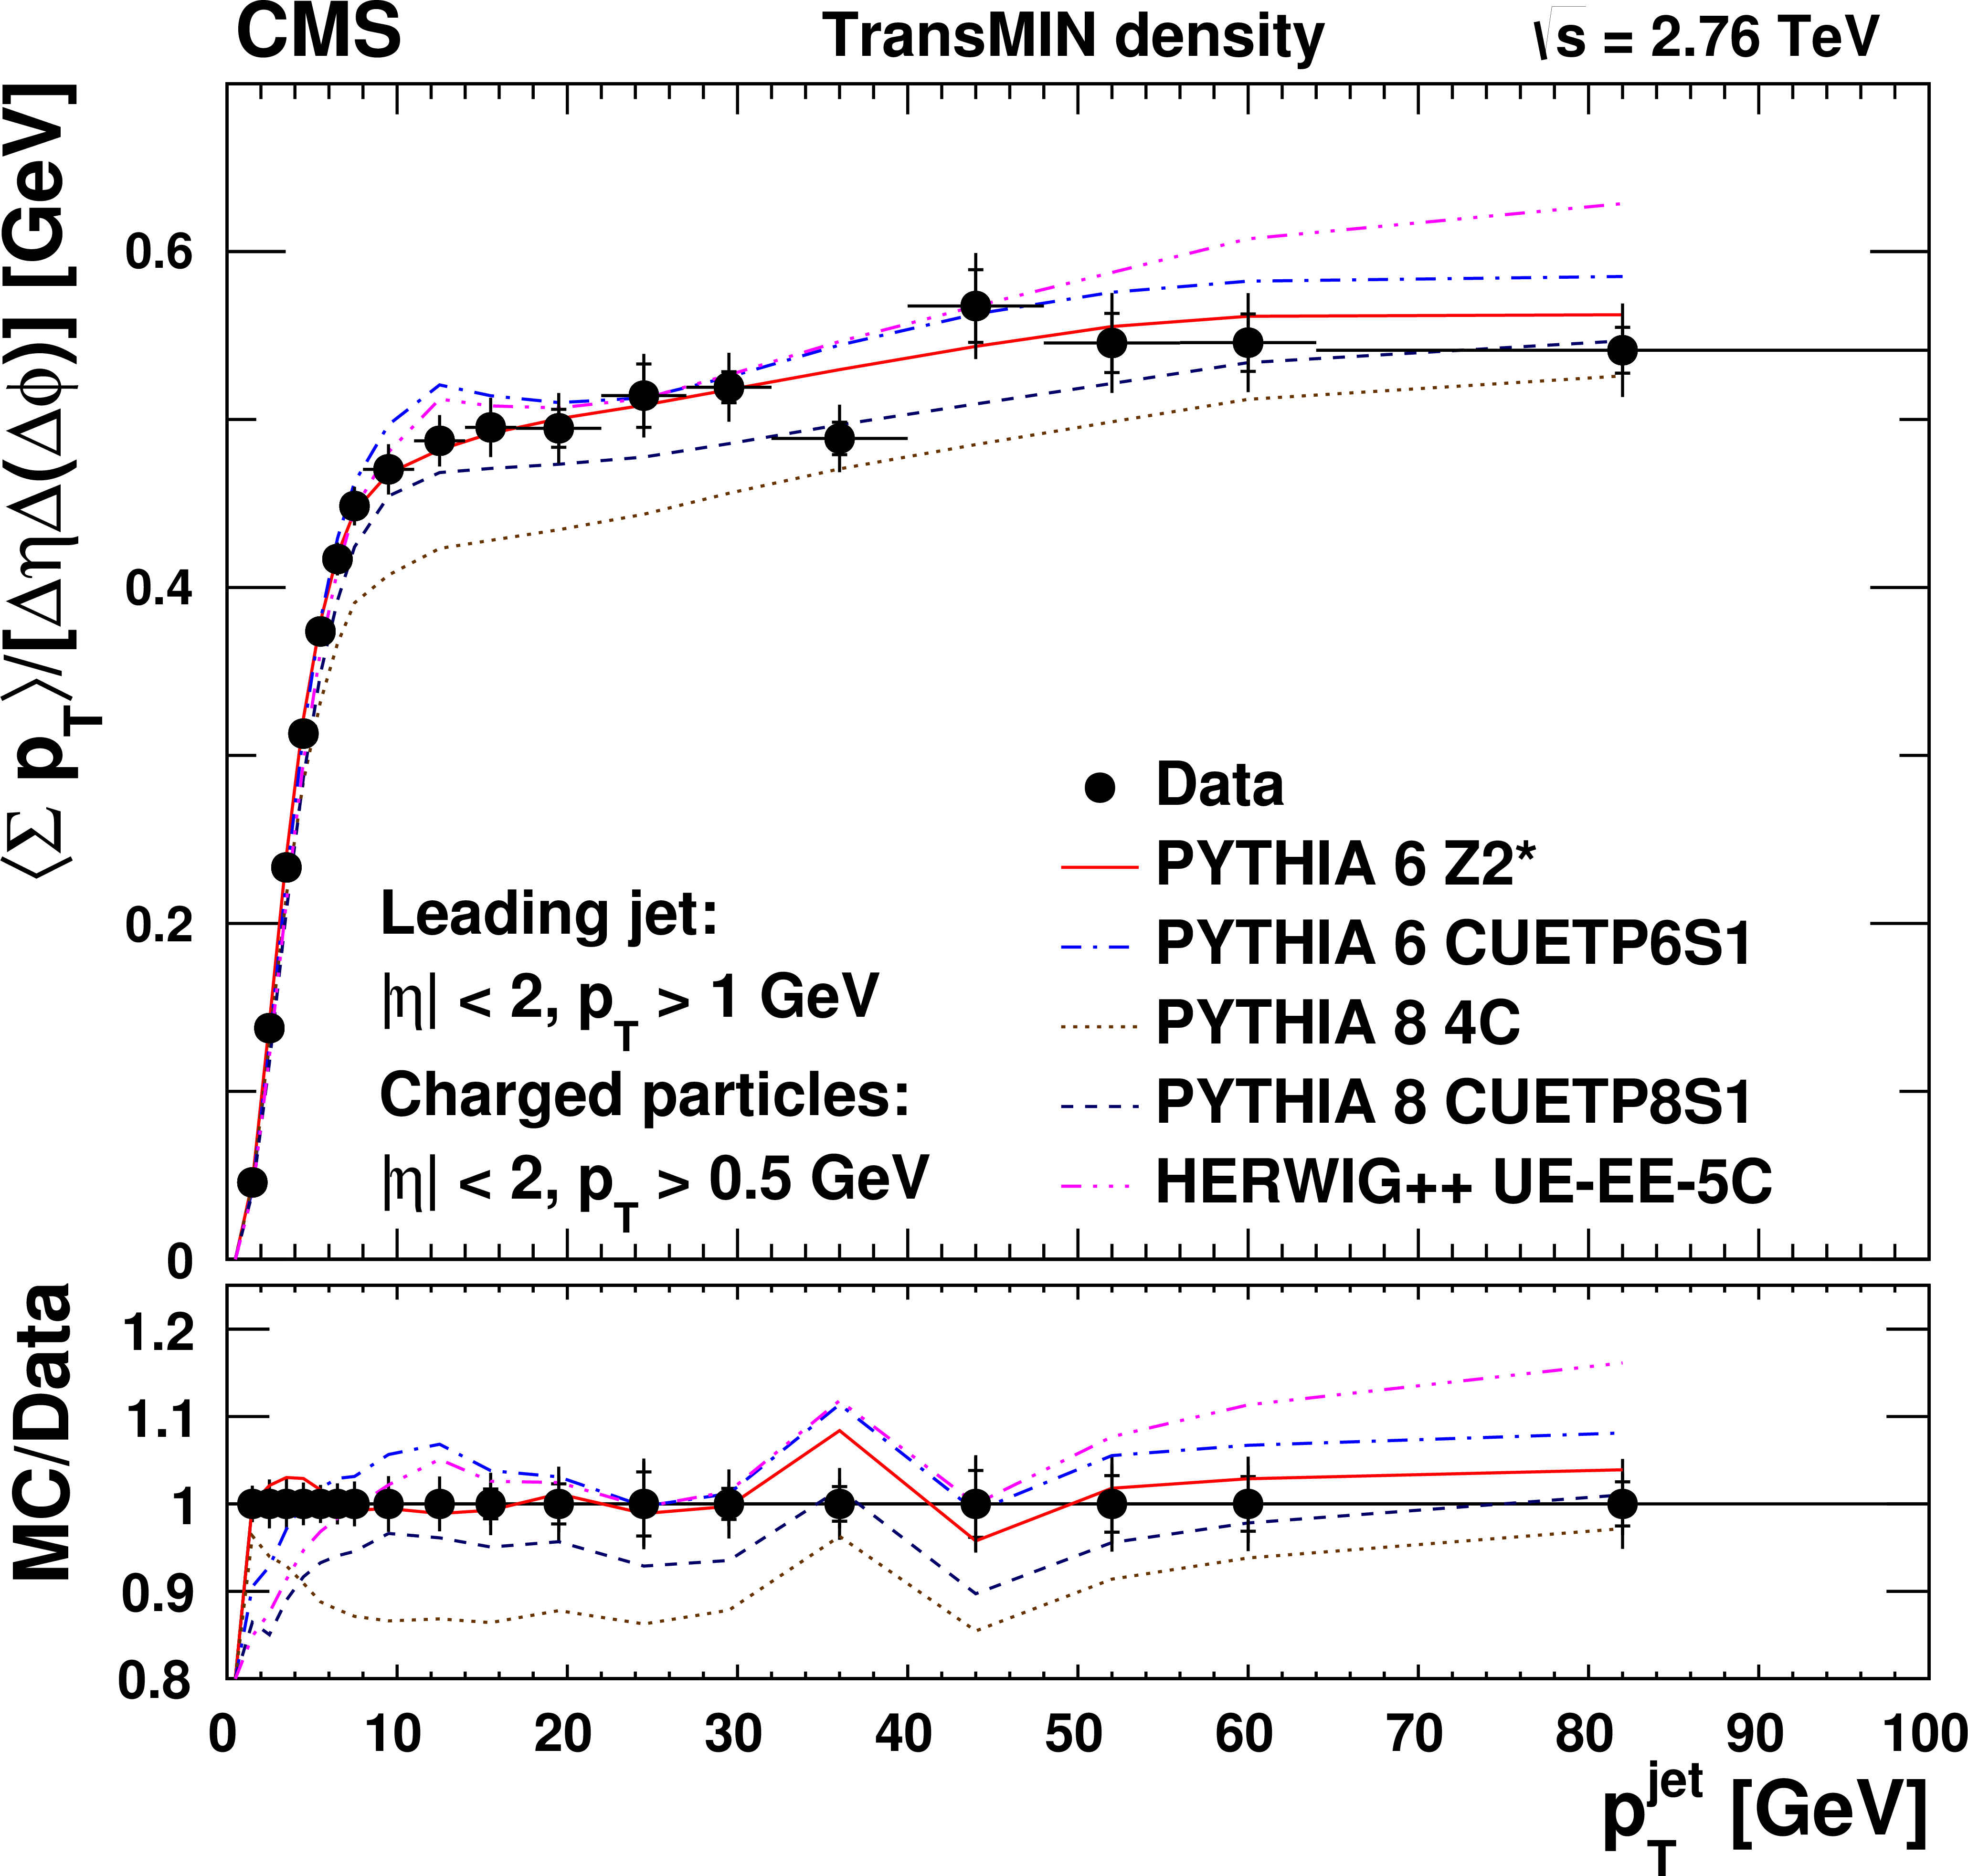
Measured (a, c) particle density, and (b, d) $\Sigma {p_{\mathrm {T}}} $ density, in the transMAX and transMIN regions ($60 {^\circ }< {| \Delta \varphi | } < 120 {^\circ }$, relative to the leading charged-particle jet in the event, with maximum/minimum UE activity), as a function of $ { {p_{\mathrm {T}}} ^{\text {jet}}} $. The definitions of the symbols and error bars are the same as for Fig. 1. |
png pdf |
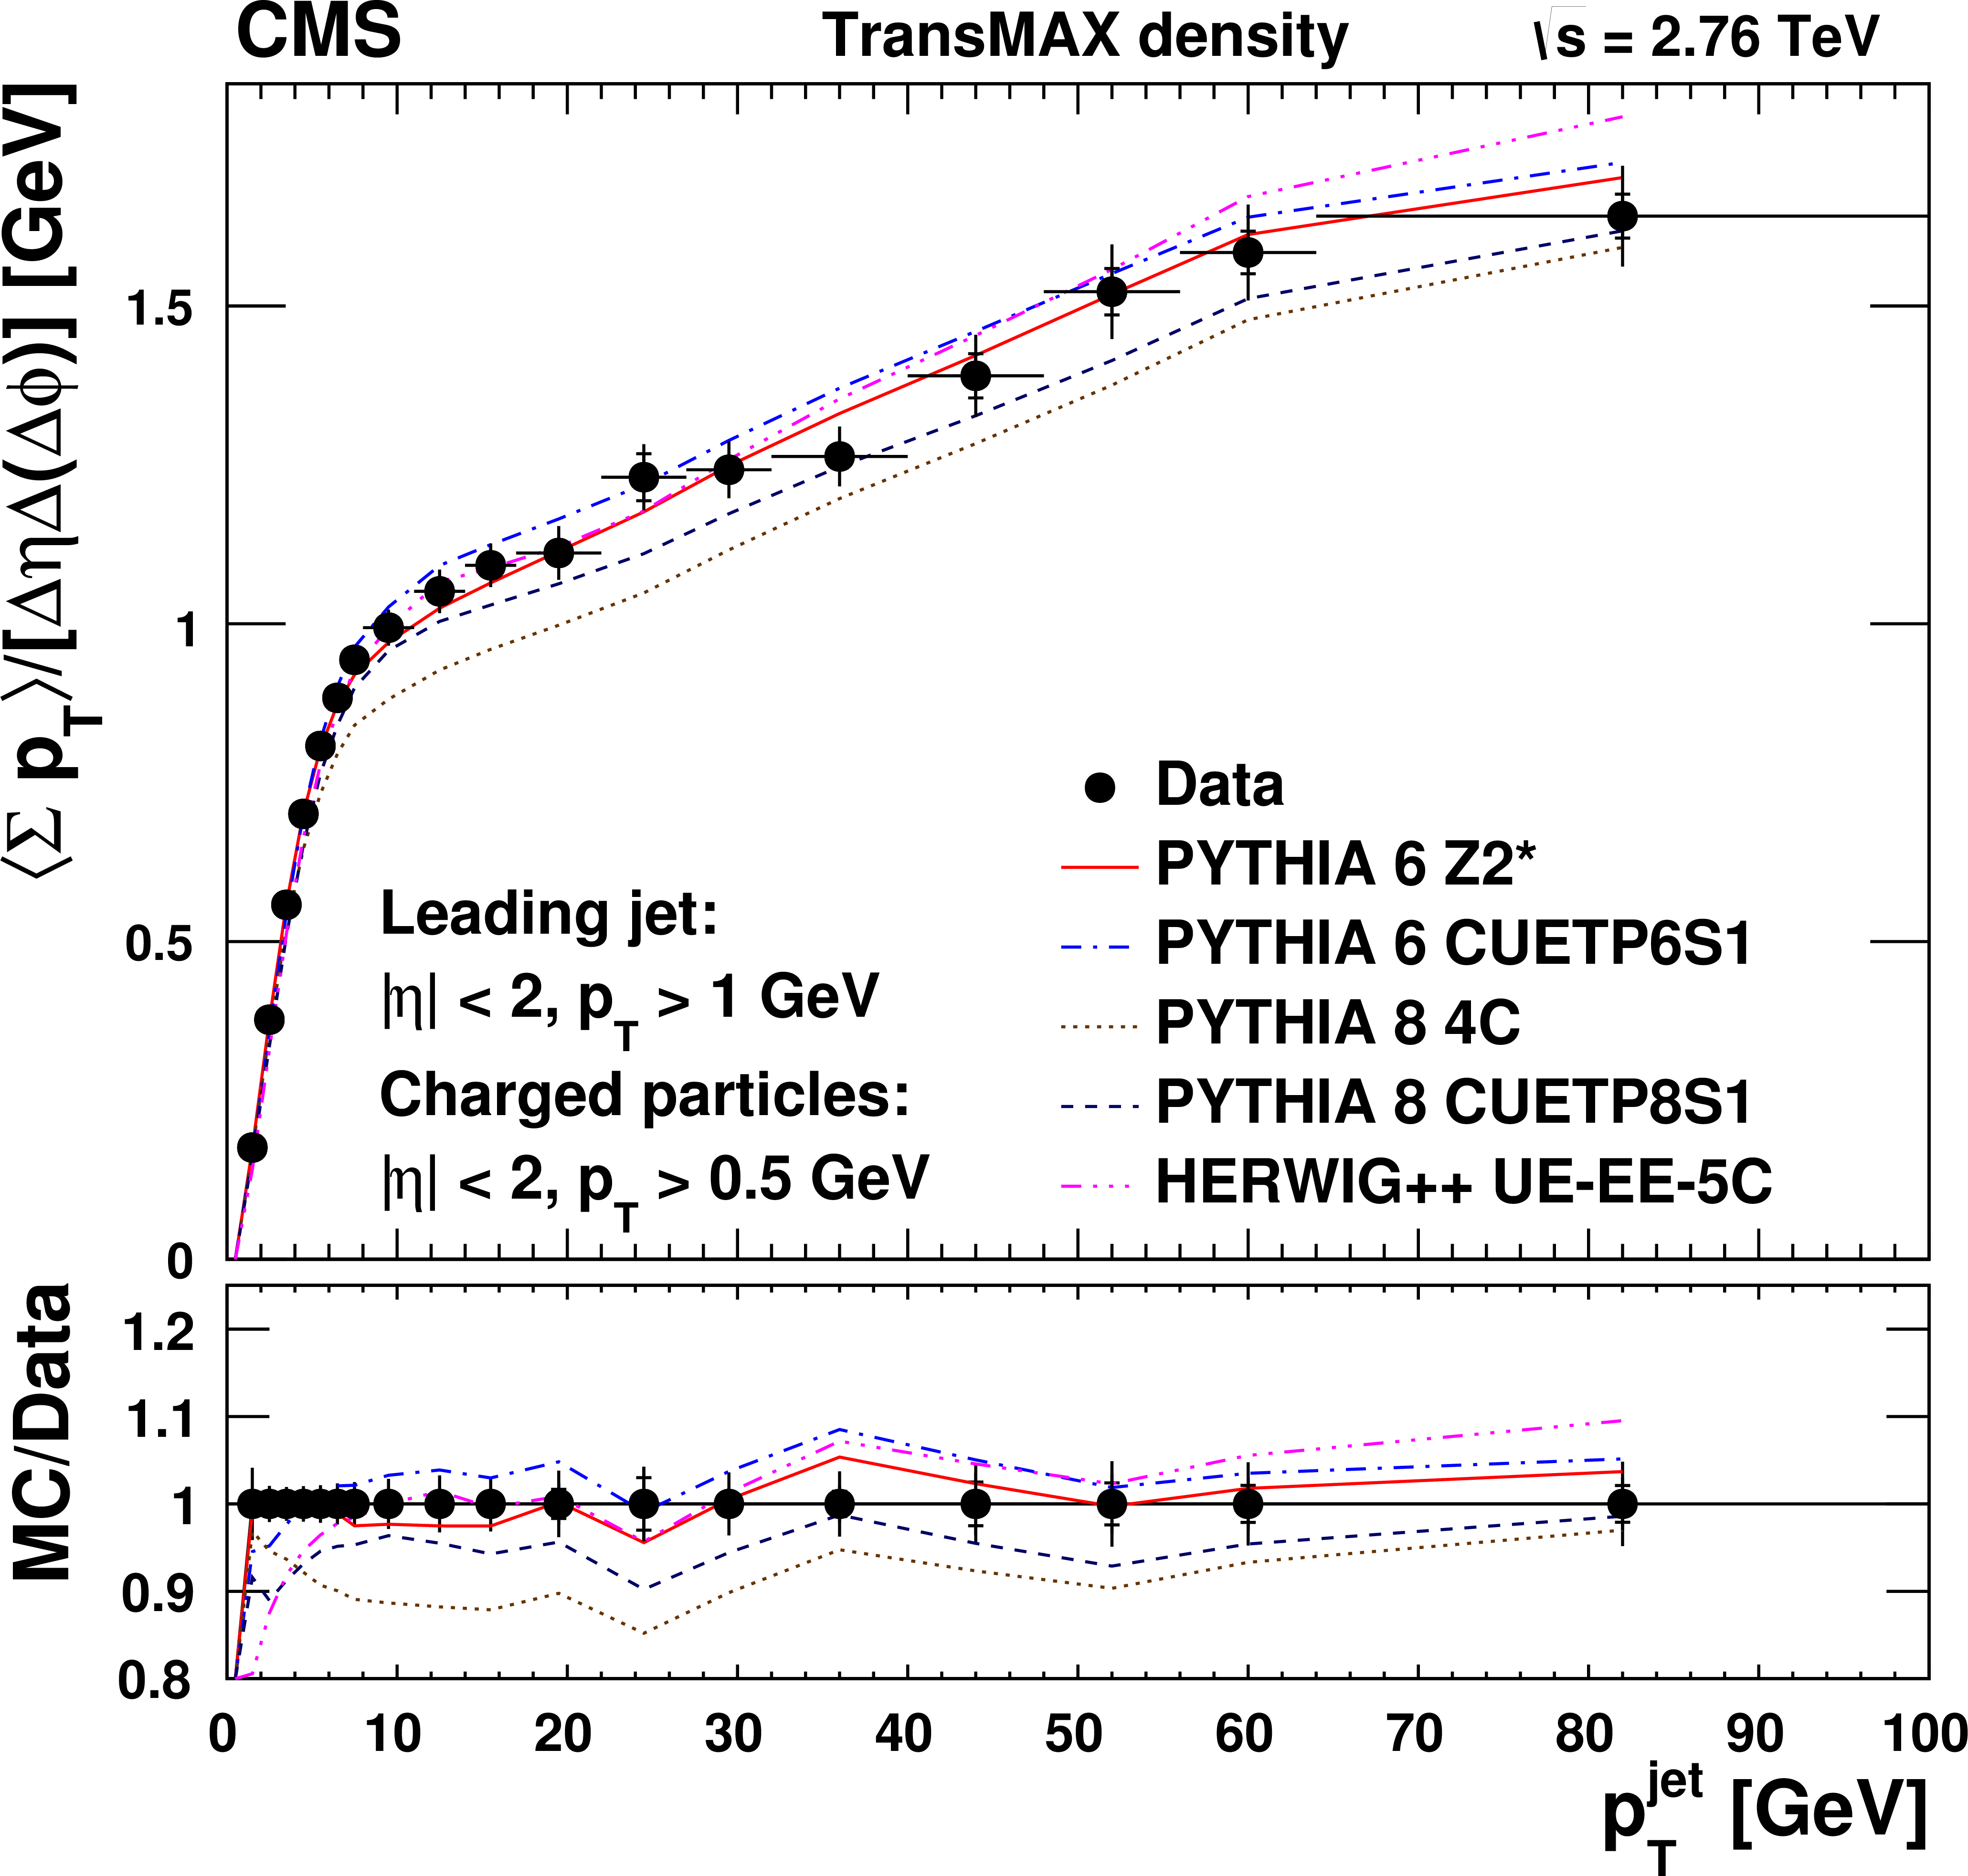
Figure 2-b:
Measured (a, c) particle density, and (b, d) $\Sigma {p_{\mathrm {T}}} $ density, in the transMAX and transMIN regions ($60 {^\circ }< {| \Delta \varphi | } < 120 {^\circ }$, relative to the leading charged-particle jet in the event, with maximum/minimum UE activity), as a function of $ { {p_{\mathrm {T}}} ^{\text {jet}}} $. The definitions of the symbols and error bars are the same as for Fig. 1. |
png pdf |
Figure 2-c:
Measured (a, c) particle density, and (b, d) $\Sigma {p_{\mathrm {T}}} $ density, in the transMAX and transMIN regions ($60 {^\circ }< {| \Delta \varphi | } < 120 {^\circ }$, relative to the leading charged-particle jet in the event, with maximum/minimum UE activity), as a function of $ { {p_{\mathrm {T}}} ^{\text {jet}}} $. The definitions of the symbols and error bars are the same as for Fig. 1. |
png pdf |
Figure 2-d:
Measured (a, c) particle density, and (b, d) $\Sigma {p_{\mathrm {T}}} $ density, in the transMAX and transMIN regions ($60 {^\circ }< {| \Delta \varphi | } < 120 {^\circ }$, relative to the leading charged-particle jet in the event, with maximum/minimum UE activity), as a function of $ { {p_{\mathrm {T}}} ^{\text {jet}}} $. The definitions of the symbols and error bars are the same as for Fig. 1. |
png pdf |
Figure 3-a:
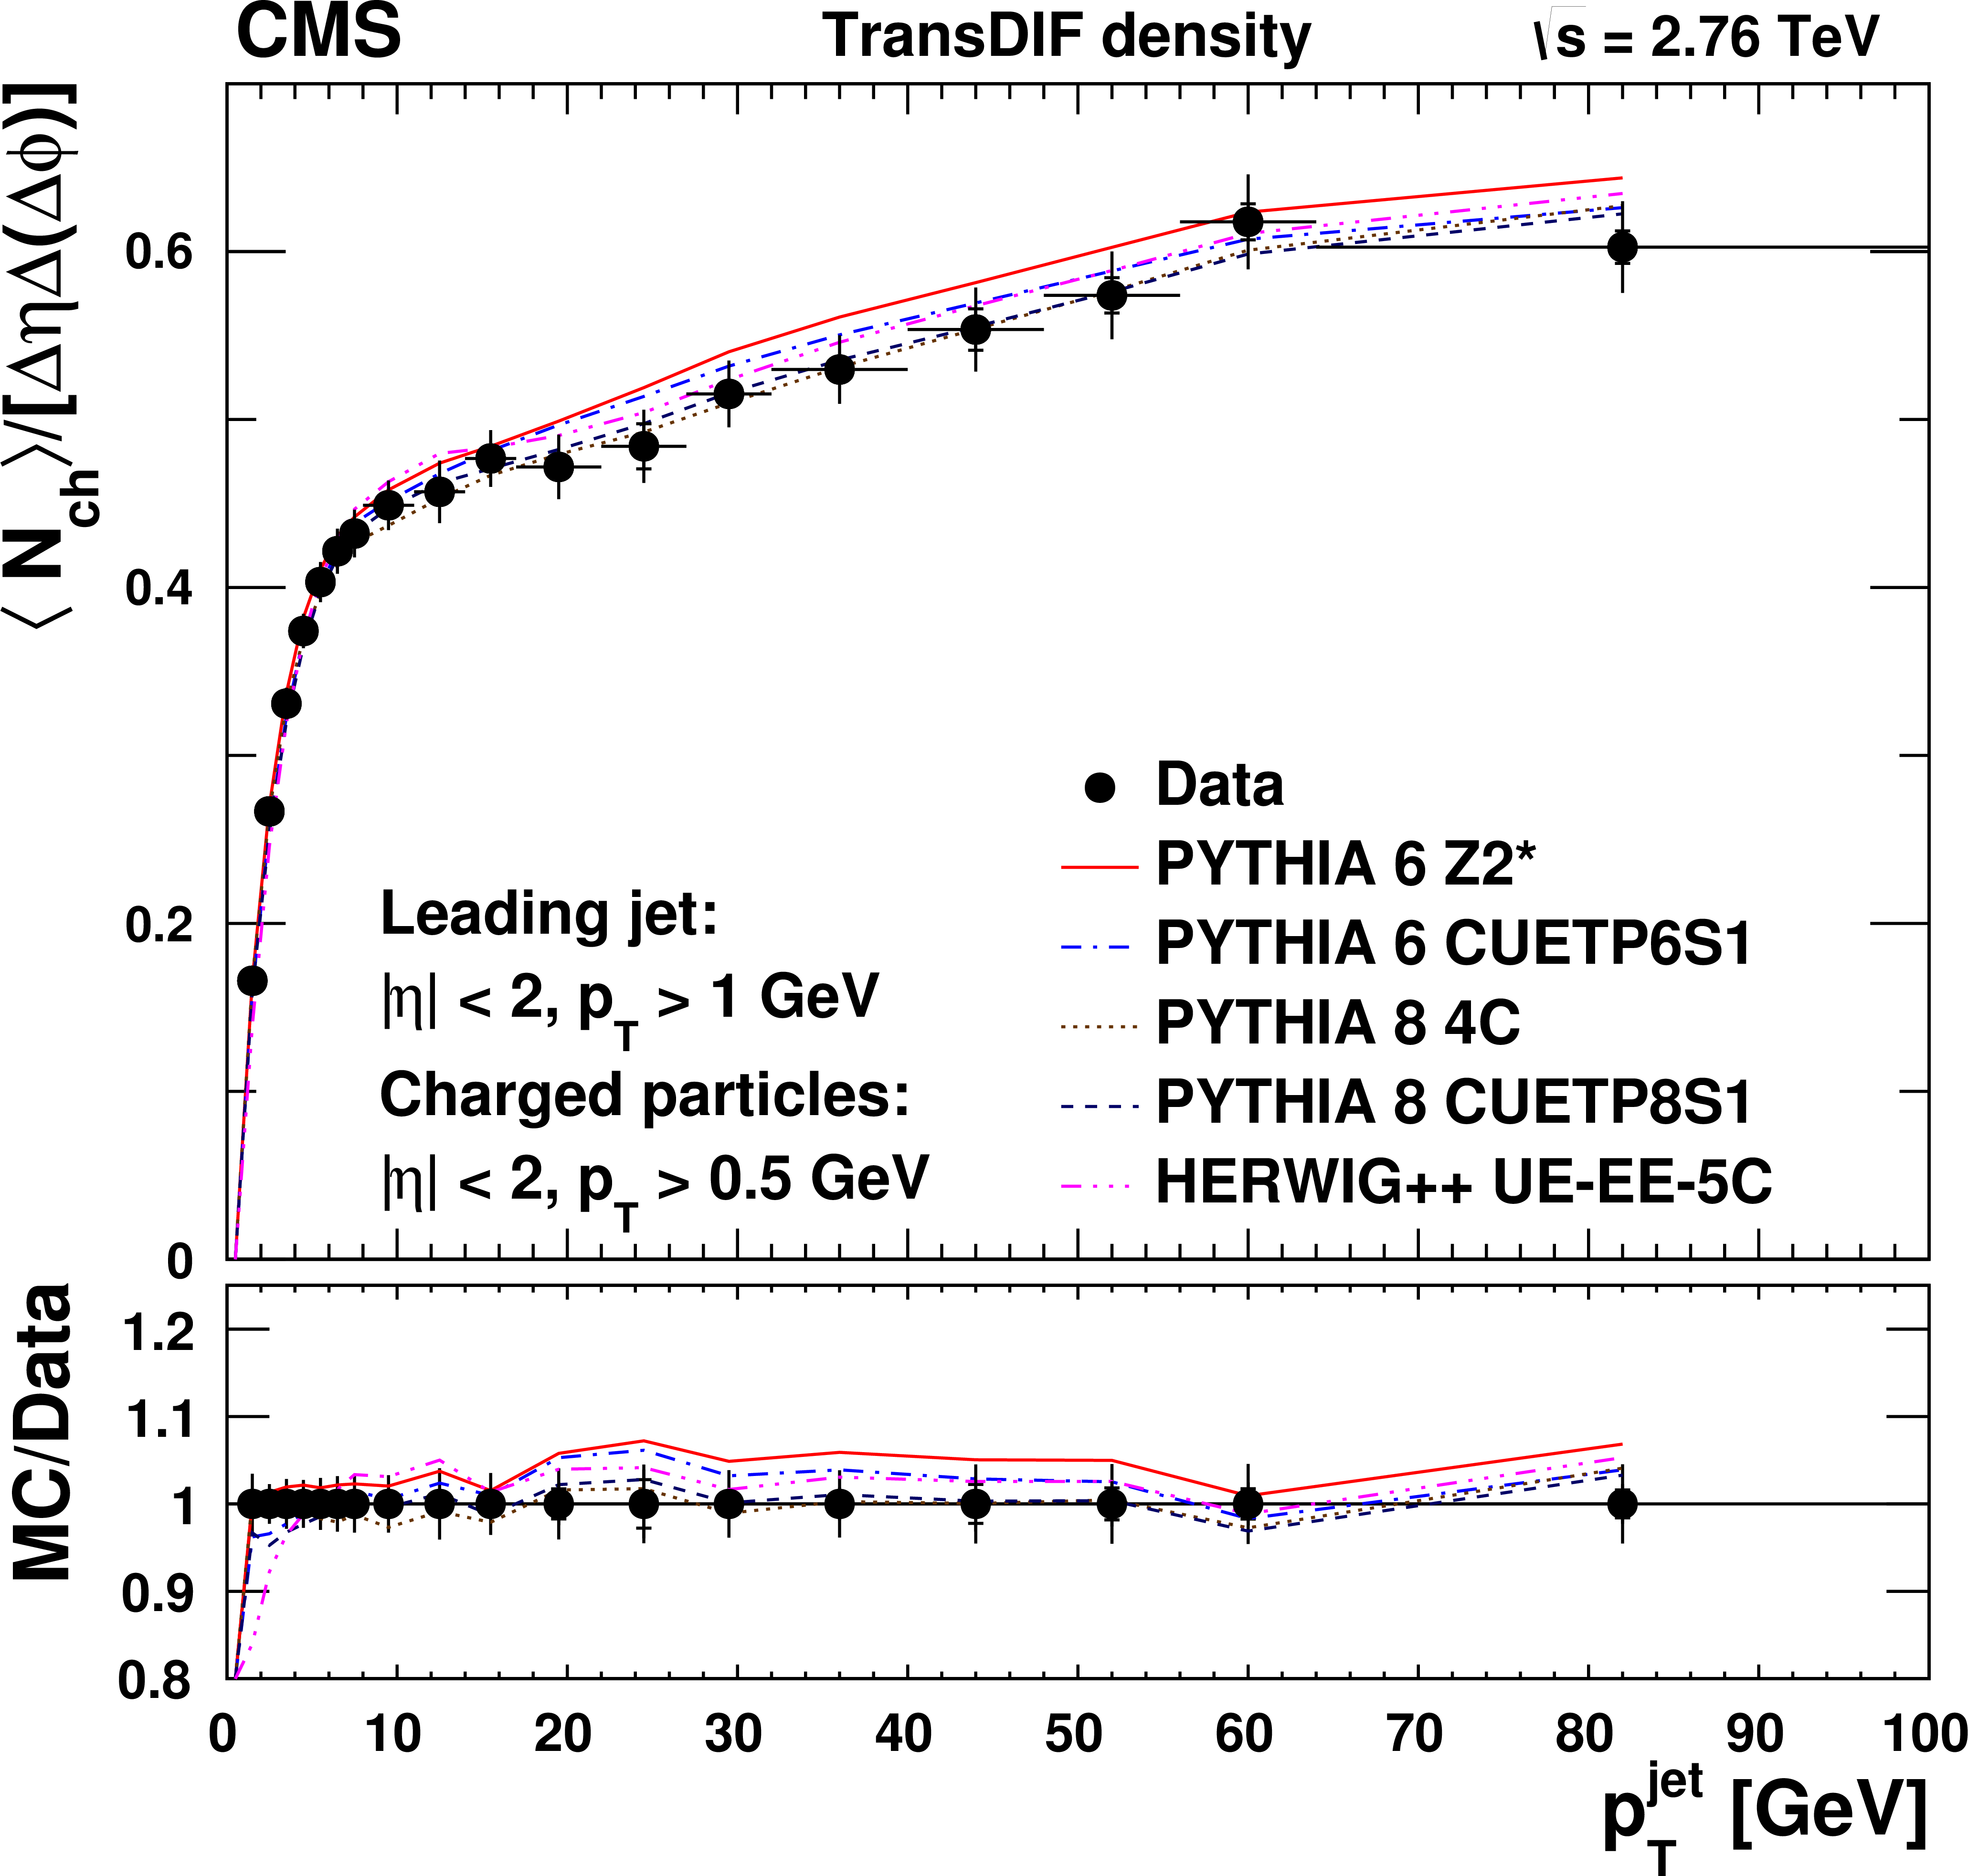
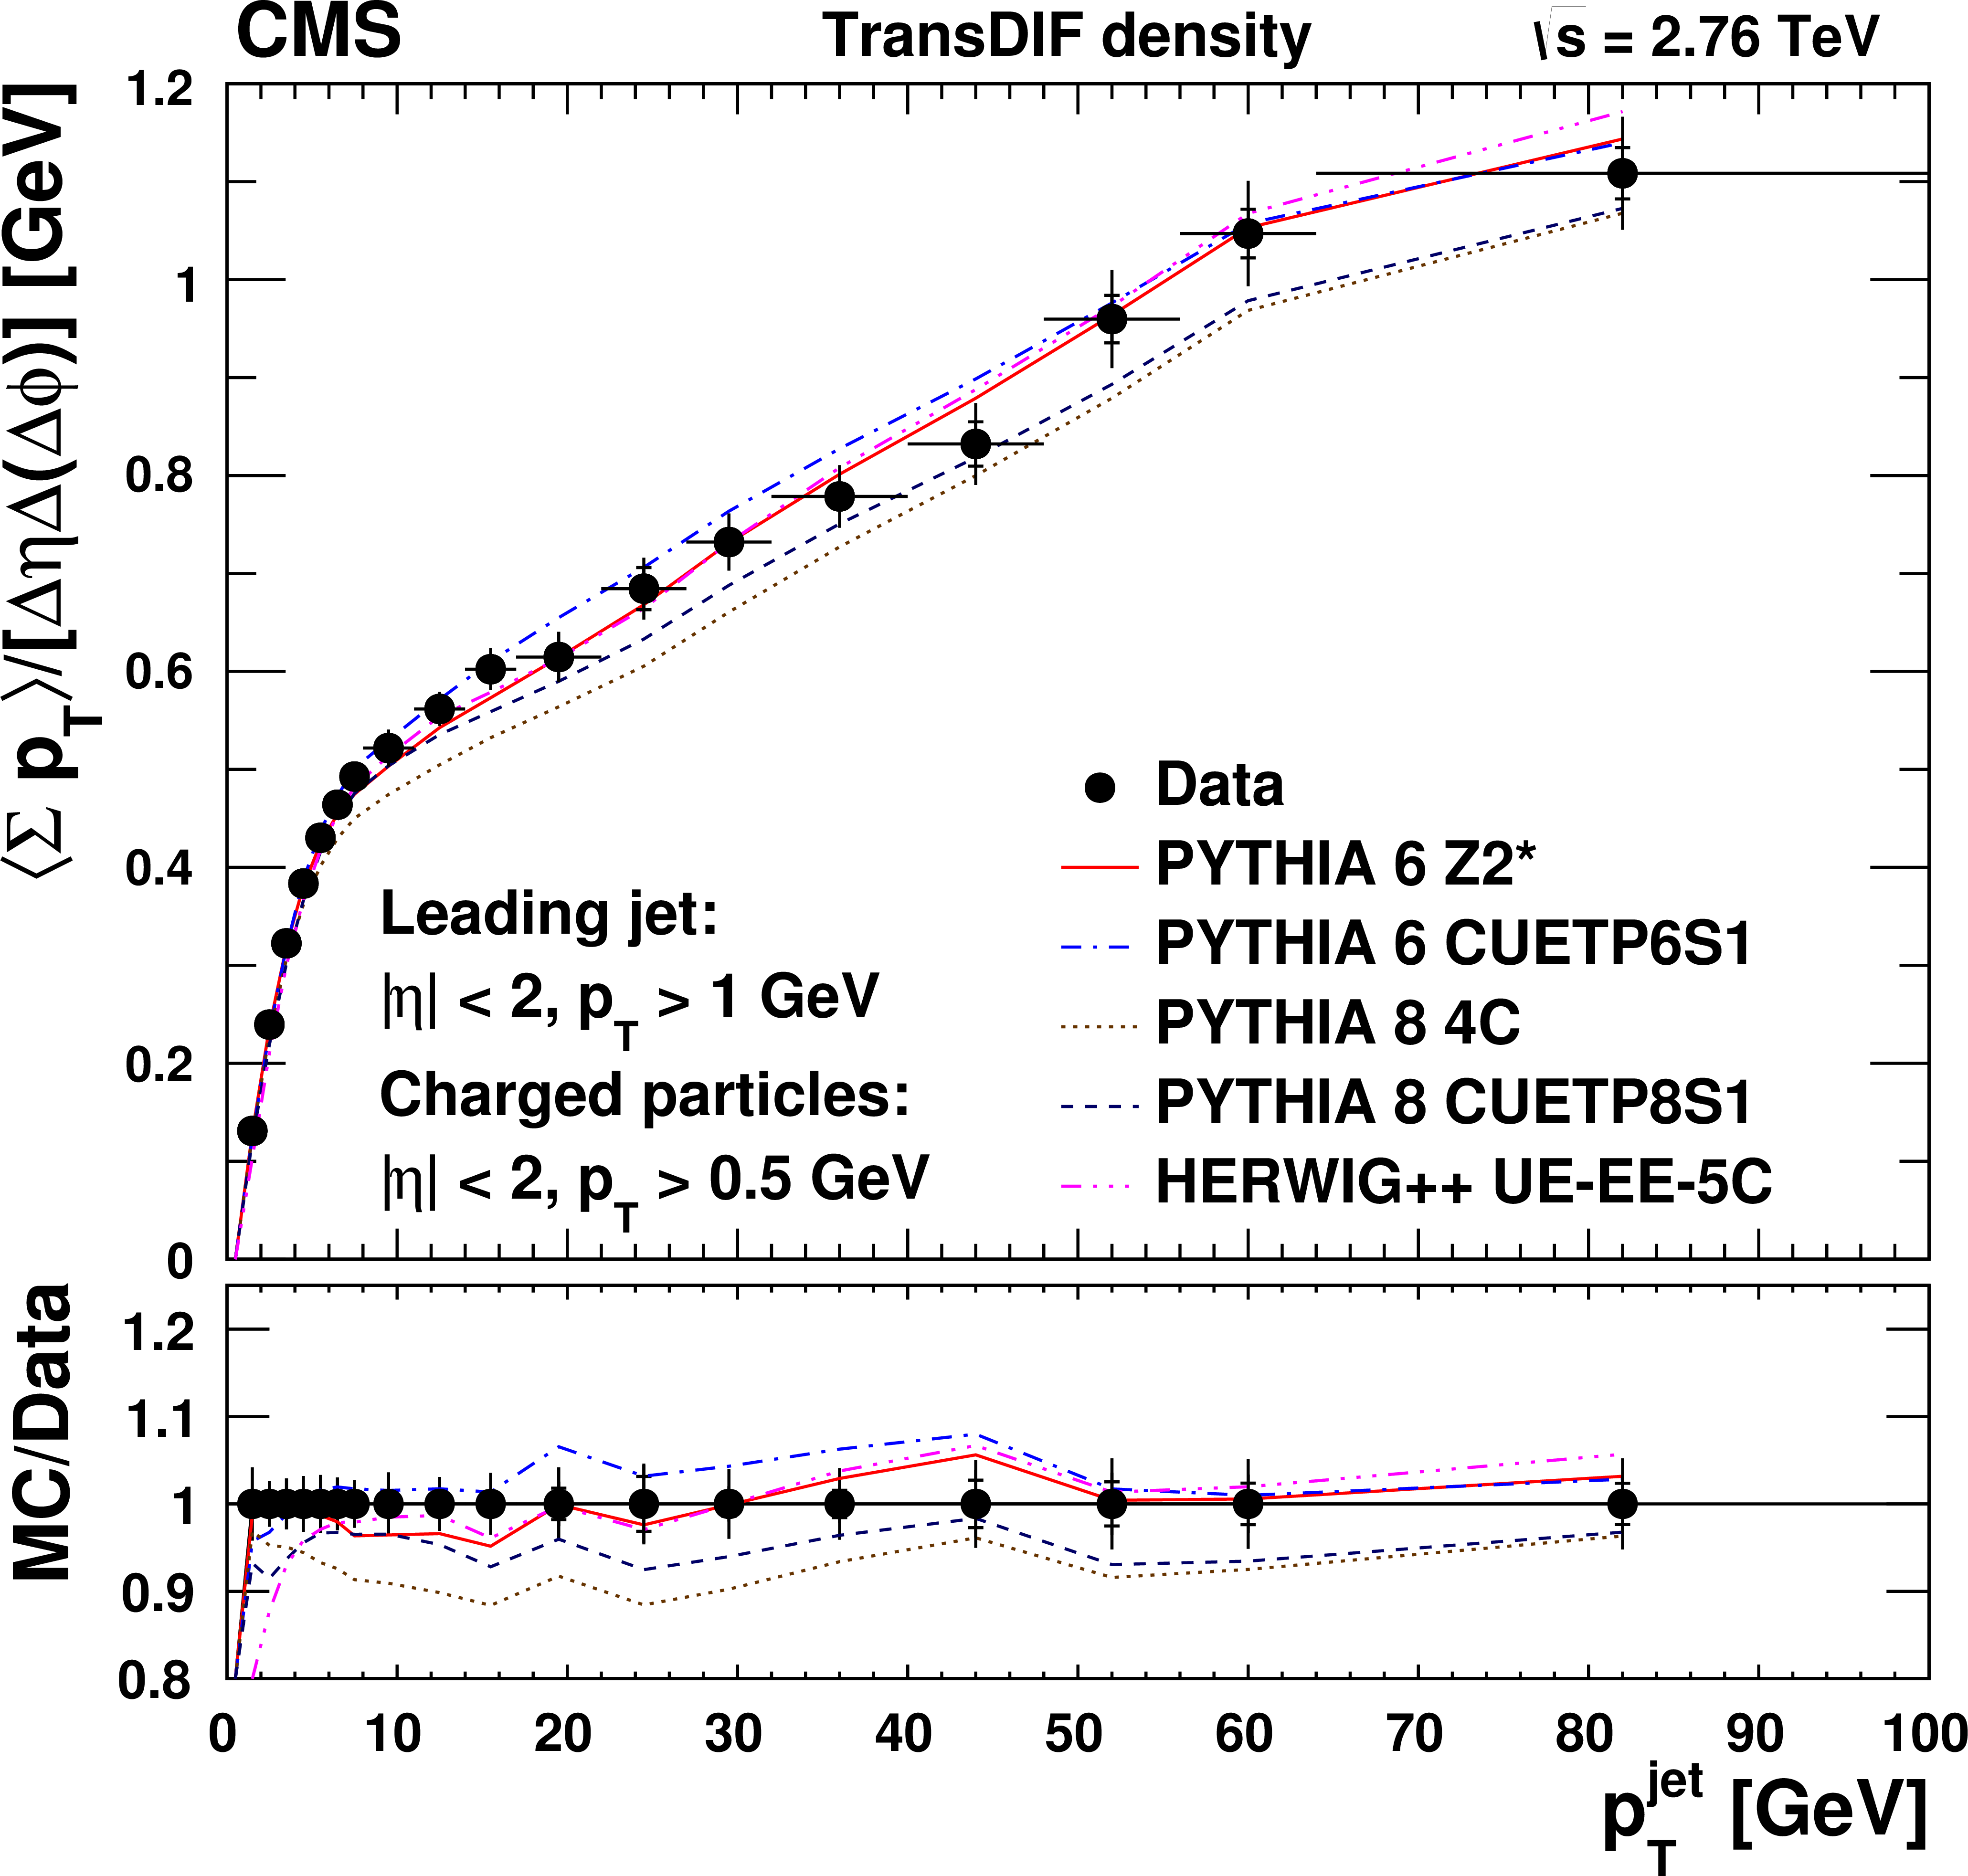
Measured transDIF activity (see text for its definition) for (a) particle density, and (b) $\Sigma {p_{\mathrm {T}}} $ density, as a function of $ { {p_{\mathrm {T}}} ^{\text {jet}}} $. The definitions of the symbols and error bars are the same as for Fig. 1. |
png pdf |
Figure 3-b:
Measured transDIF activity (see text for its definition) for (a) particle density, and (b) $\Sigma {p_{\mathrm {T}}} $ density, as a function of $ { {p_{\mathrm {T}}} ^{\text {jet}}} $. The definitions of the symbols and error bars are the same as for Fig. 1. |

png pdf |
Figure 4-a:
Comparison of UE activity at $\sqrt {s}= $ 0.9, 2.76, and 7 TeV for (a) particle density, and (b) $\Sigma {p_{\mathrm {T}}} $ density, as a function of $ { {p_{\mathrm {T}}} ^{\text {jet}}} $ [4, 5]. The data (symbols) are compared to various MC simulations (curves). The definition of the error bars is the same as for Fig. 1. |
png pdf |
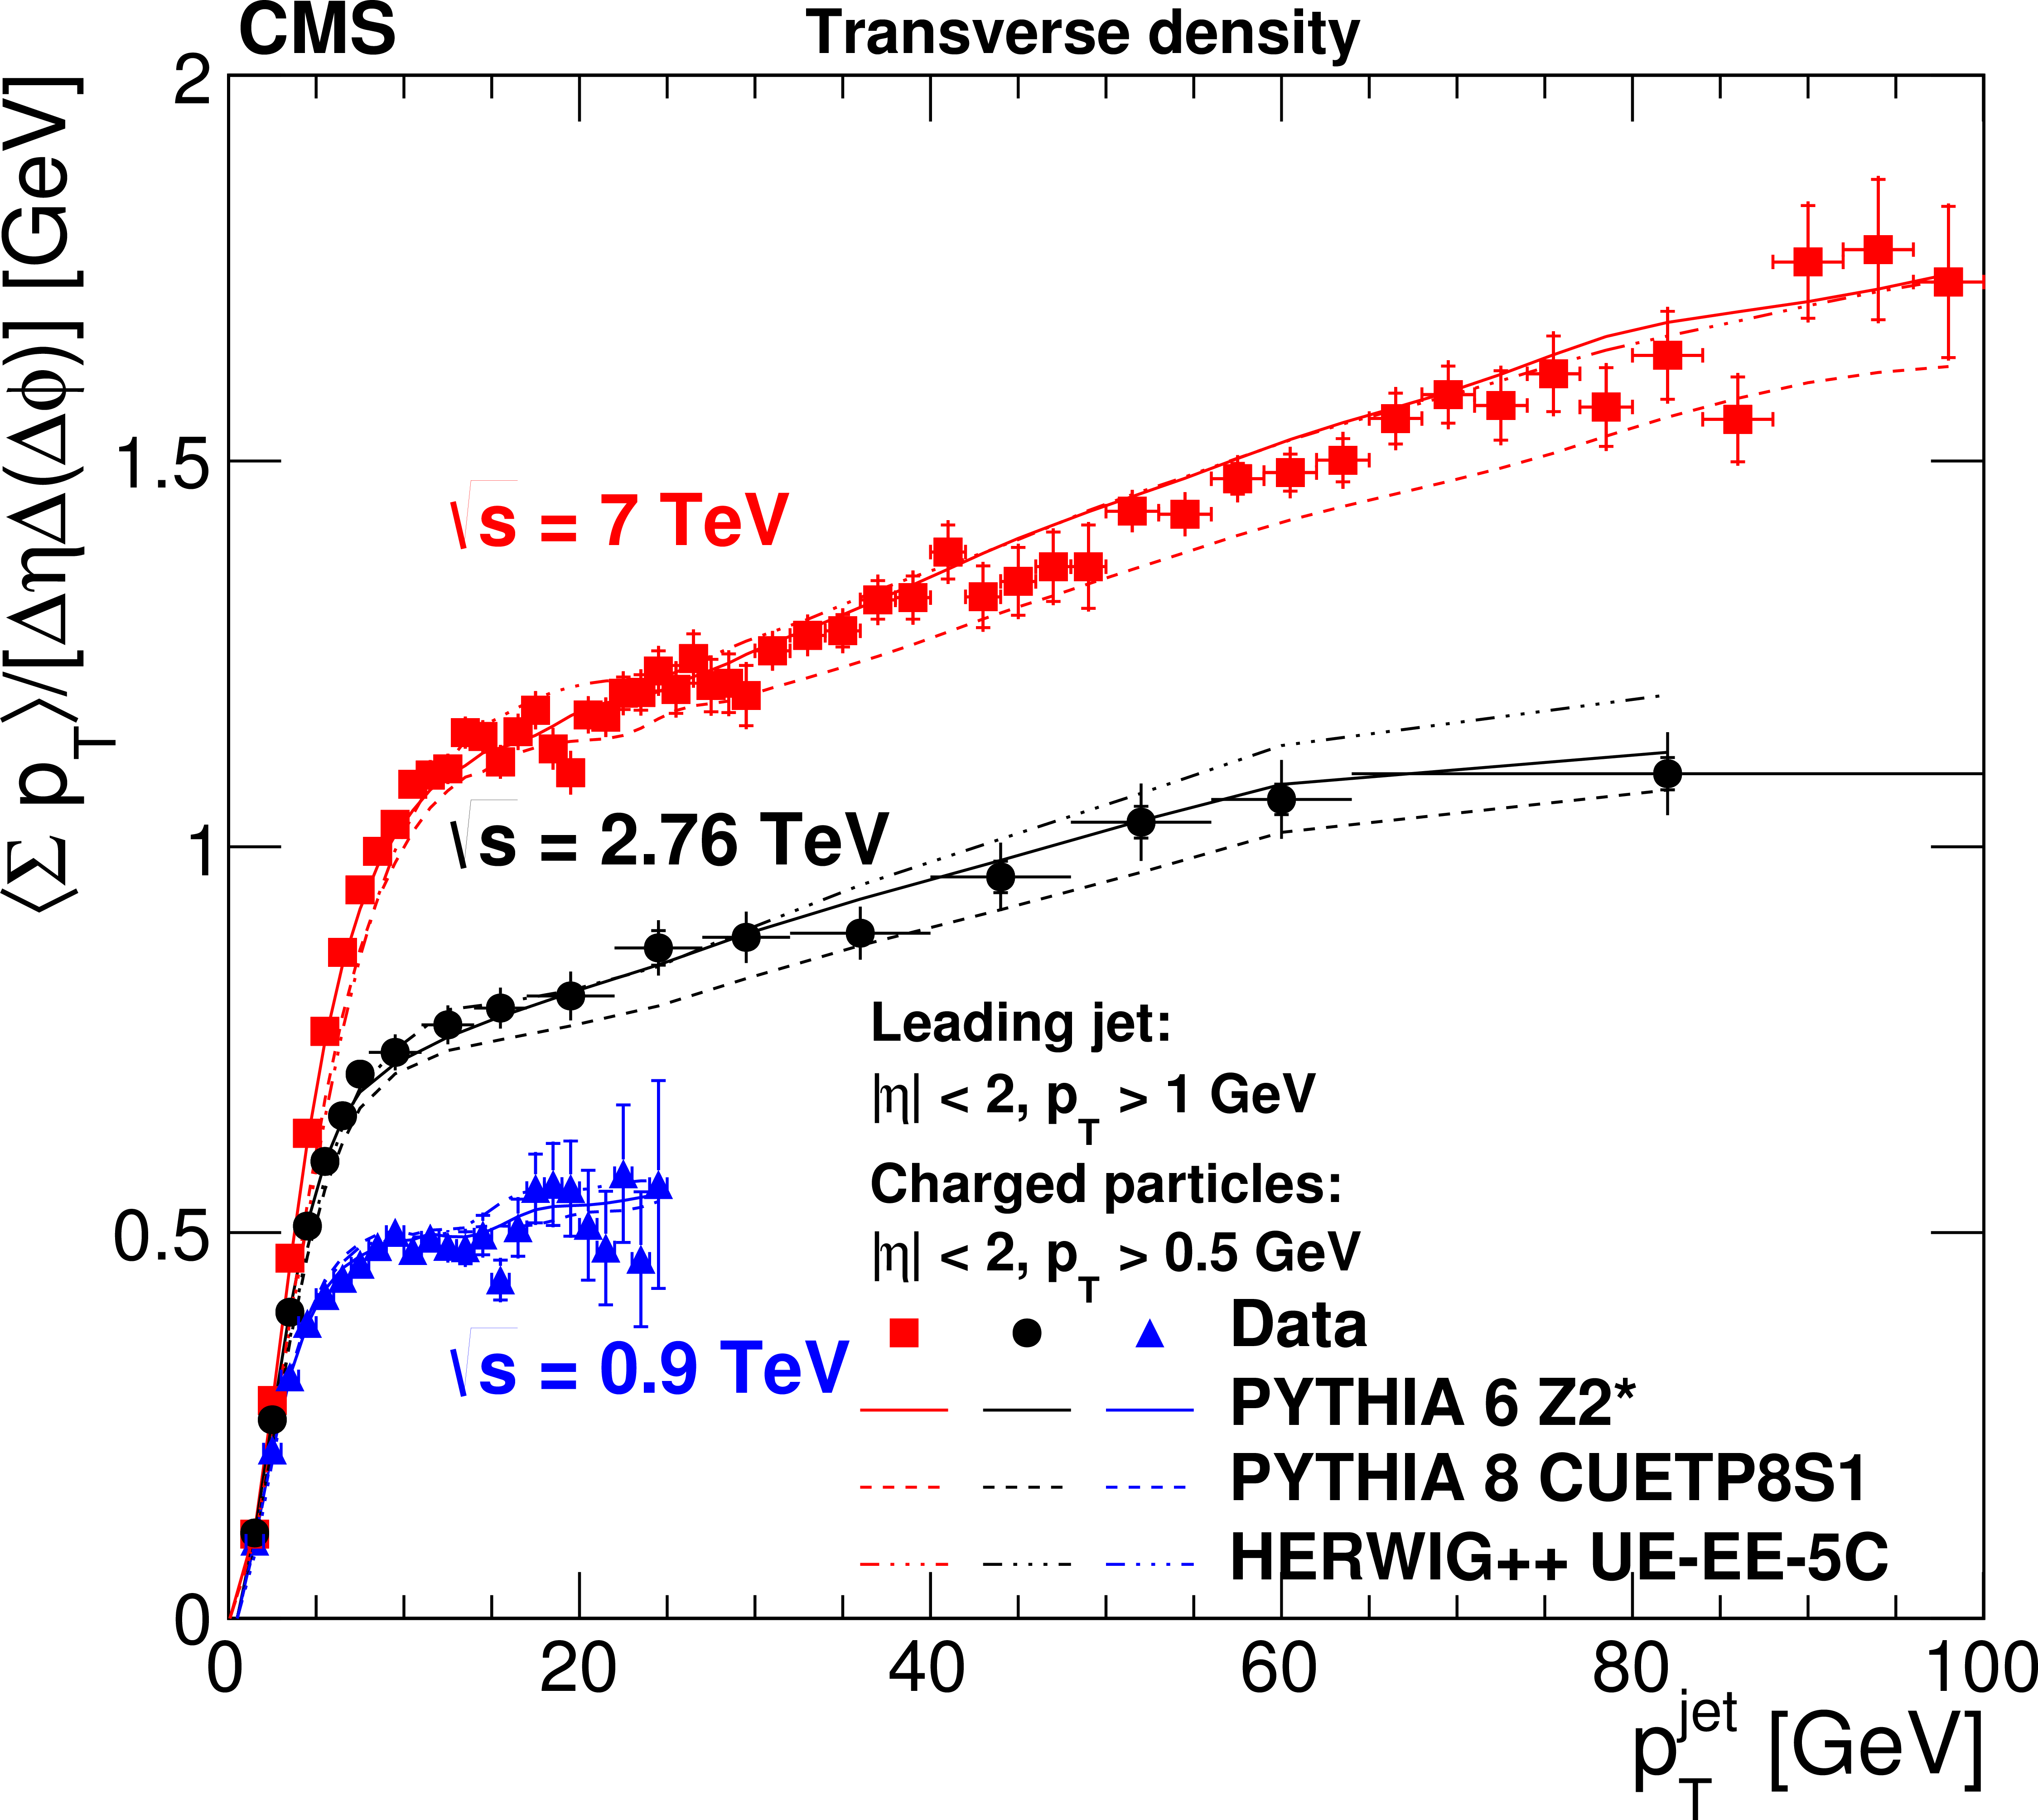
Figure 4-b:
Comparison of UE activity at $\sqrt {s}= $ 0.9, 2.76, and 7 TeV for (a) particle density, and (b) $\Sigma {p_{\mathrm {T}}} $ density, as a function of $ { {p_{\mathrm {T}}} ^{\text {jet}}} $ [4, 5]. The data (symbols) are compared to various MC simulations (curves). The definition of the error bars is the same as for Fig. 1. |
| Tables | |
png pdf |
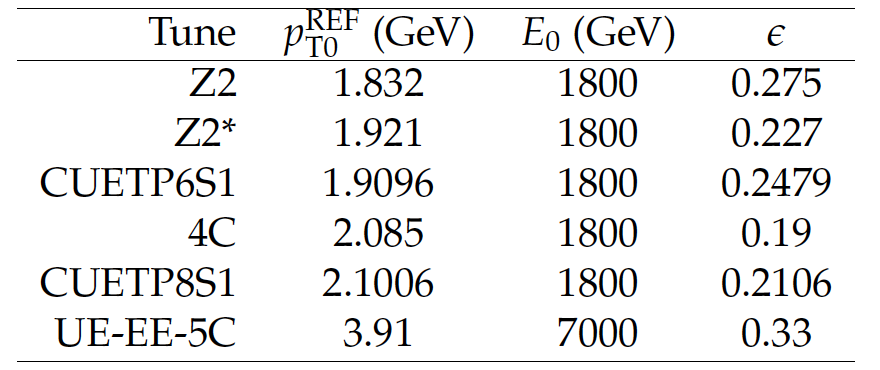
Table 1:
Summary of the parameters of the Monte Carlo generator tunes. |
png pdf |
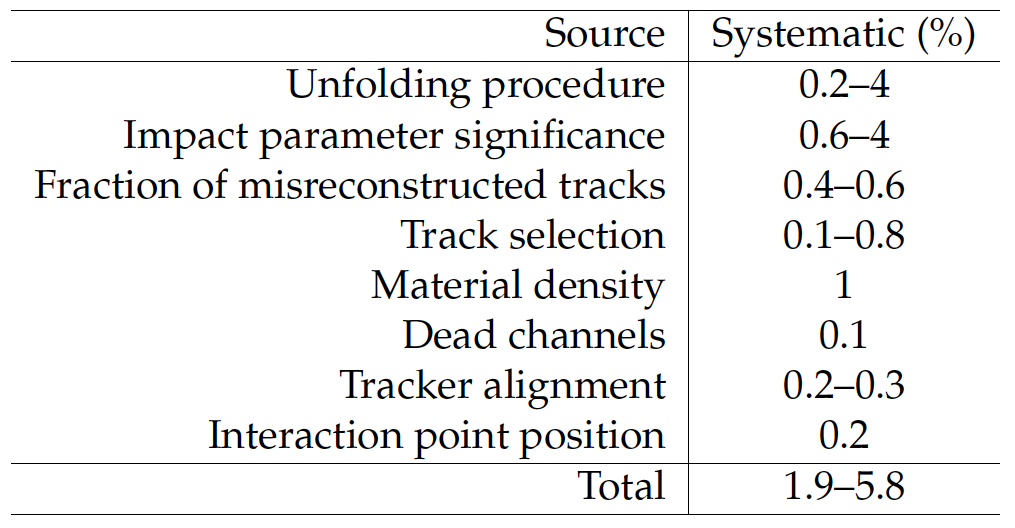
Table 2:
Summary of the systematic uncertainties (in percentage) due to various sources. The values range from the minimum to maximum from all regions, observables, and across different $ { {p_{\mathrm {T}}} ^{\text {jet}}} $ values. |
| Summary |
|
The measurement of the underlying event (UE) activity in proton-proton collisions at $\sqrt{s} =$ 2.76 TeV has been presented using events with a charged-particle jet produced at central pseudorapidity ($| \eta^{\text{jet}} | <$ 2) with transverse momenta $ p_{\mathrm{T}}^{\text{jet}} < $ 100 GeV. This analysis complements the results of previous similar measurements at $\sqrt{s} = $ 0.9 and 7 TeV. The UE activity is measured in the transverse region and further studied in terms of the transMAX, transMIN and transDIF activities. A steep rise of the underlying activity in the transverse region is seen with increasing leading jet $ p_{\mathrm{T}}$. This fast rise is followed by a leveling above $ p_{\mathrm{T}}^{\text{jet}} \approx $ 8 GeV, with nearly constant particle density and small $ \Sigma p_{\mathrm{T}}$ density increase. Such a distinct pattern (fast rise followed by a leveling of the UE hadronic activity) is clearly seen for all the observables in the various regions, and is compatible with the impact parameter picture of pp collisions featuring an increasing number of MPI for increasing overlap followed by a saturation of hadron production once the hardest most-central collisions are reached. The transDIF density distributions show an increase of the activity as a function of $ p_{\mathrm{T}}^{\text{jet}} $ corroborating the hypothesis of more intense ISR and FSR from the increasingly harder parton-parton scatter. The results are compared to recent tunes of PYTHIA and HERWIG++ Monte Carlo event generators. The PYTHIA6, PYTHIA8, and HERWIG++ tunes describe the data within 5 to 10%. All MC tunes predict a collision energy dependence of the hadronic activity similar to that observed in the data. The ability of the latest Monte Carlo generator tunes to describe the data confirms the validity of the tunes and lends confidence to the predictions of UE activity for higher collision energies. |
|
|
Compact Muon Solenoid LHC, CERN |
|

|

|

|

|

|