

Compact Muon Solenoid
LHC, CERN
| CMS-FSQ-12-032 ; CERN-PH-EP-2015-135 | ||
| Production of leading charged particles and leading charged-particle jets at small transverse momenta in pp collisions at $\sqrt{s} =$ 8 TeV | ||
| CMS Collaboration | ||
| 30 June 2015 | ||
| Phys. Rev. D 92 (2015) 112001 | ||
| Abstract: The per-event yield of the highest transverse momentum charged particle and charged-particle jet, integrated above a given $p_{\mathrm{T}}^{\mathrm{min}}$ threshold starting at $p_{\mathrm{T}}^{\mathrm{min}} = $ 0.8 and 1 GeV, respectively, is studied in pp collisions at $\sqrt{s} =$ 8 TeV. The particles and the jets are measured in the pseudorapidity ranges $| \eta | <$ 2.4 and 1.9, respectively. The data are sensitive to the momentum scale at which parton densities saturate in the proton, to multiple partonic interactions, and other key aspects of the transition between the soft and hard QCD regimes in hadronic collisions. | ||
| Links: e-print arXiv:1507.00233 [hep-ex] (PDF) ; CDS record ; inSPIRE record ; HepData record ; CADI line (restricted) ; | ||
| Figures | |

png pdf |
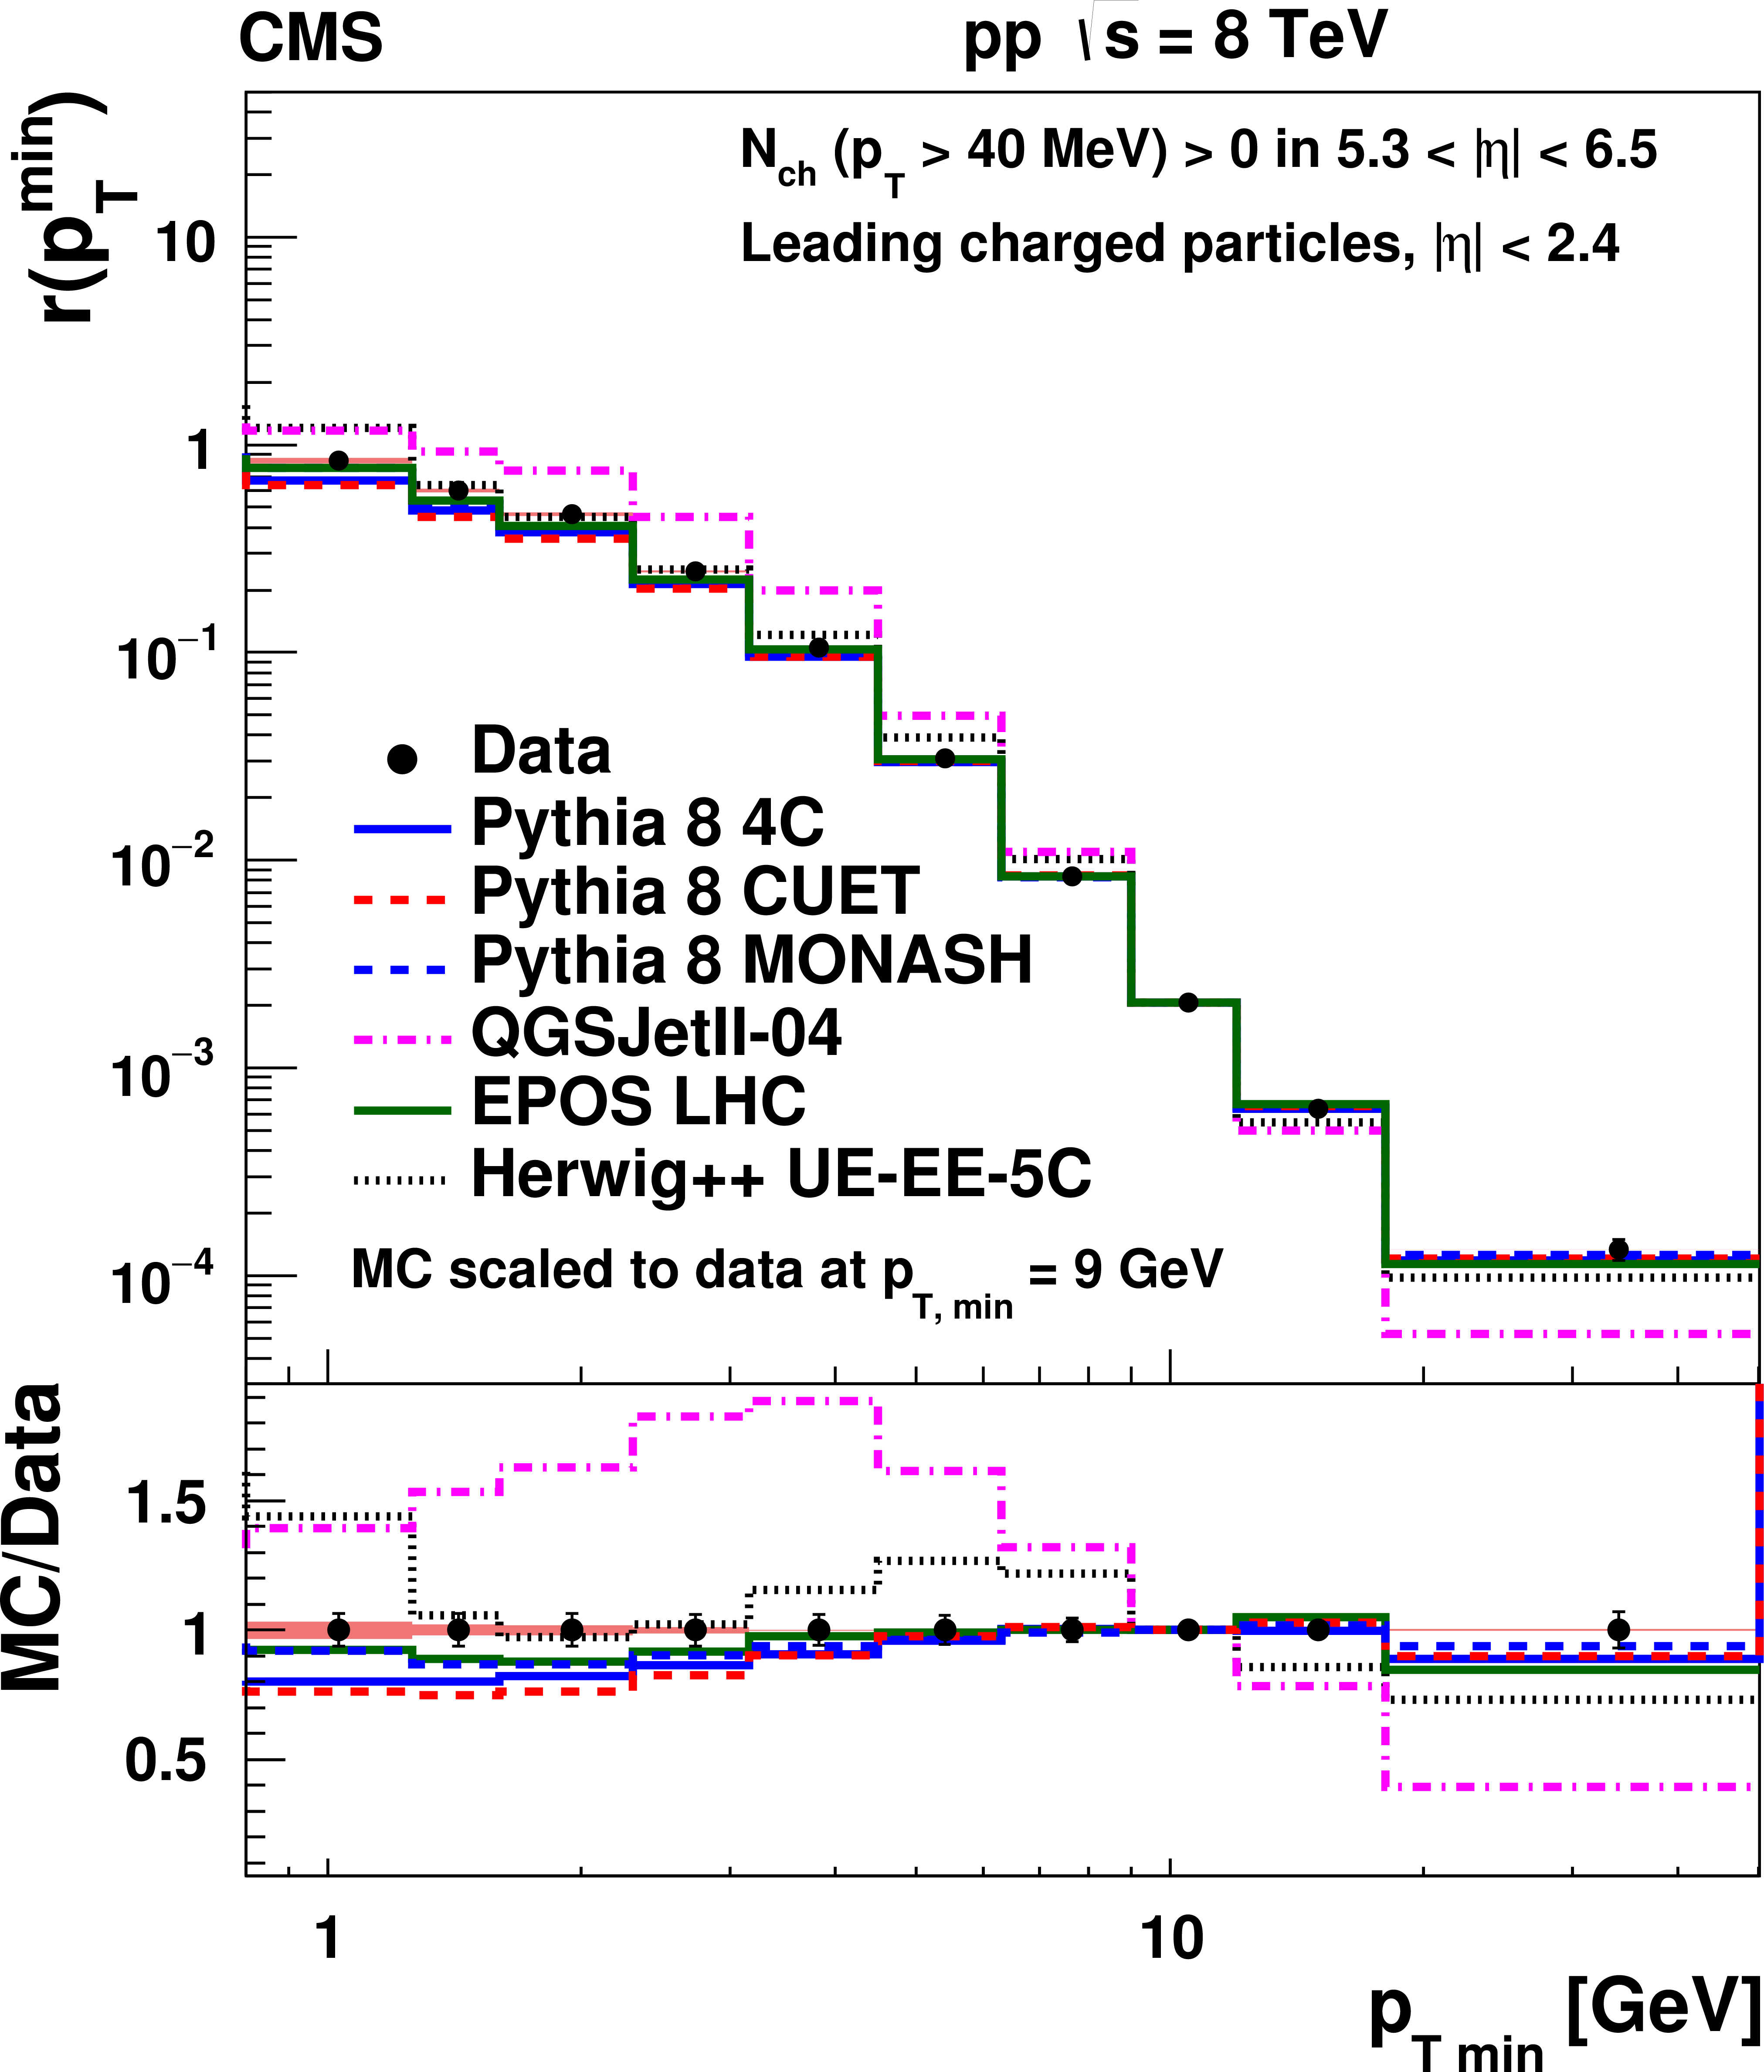
Figure 1-a:
The integrated yield, $r( {p^{\mathrm {min}}_{\mathrm {T}}} )$, of events with a leading charged particle within $ {| \eta | } < 2.4$ (a, b) and with a leading jet within $ {| \eta | } < 1.9$ (c, d), as a function of $ {p^{\mathrm {min}}_{\mathrm {T}}} $. The data are compared to predictions from several PYTHIA 6 tunes (a, c) and various other event generators (b, d). The lower panels show the ratios of the MC and the data yields (MC/Data). The error bars indicate the statistical uncertainty and the red shaded area (only visible in the ratio plots) represents the systematic uncertainty. The predictions are scaled to the measured value of $r( {p^{\mathrm {lead}}_{\mathrm {T}}} >$ 9.0 GeV) (a, b) and 14.3 GeV (c, d). The prediction from PYTHIA 6 with MPI off and no parton saturation is not shown in the MC/data ratio plot (a, c) because of the large disagreement with the data. |
png pdf |
Figure 1-b:
The integrated yield, $r( {p^{\mathrm {min}}_{\mathrm {T}}} )$, of events with a leading charged particle within $ {| \eta | } < 2.4$ (a, b) and with a leading jet within $ {| \eta | } < 1.9$ (c, d), as a function of $ {p^{\mathrm {min}}_{\mathrm {T}}} $. The data are compared to predictions from several PYTHIA 6 tunes (a, c) and various other event generators (b, d). The lower panels show the ratios of the MC and the data yields (MC/Data). The error bars indicate the statistical uncertainty and the red shaded area (only visible in the ratio plots) represents the systematic uncertainty. The predictions are scaled to the measured value of $r( {p^{\mathrm {lead}}_{\mathrm {T}}} >$ 9.0 GeV) (a, b) and 14.3 GeV (c, d). The prediction from PYTHIA 6 with MPI off and no parton saturation is not shown in the MC/data ratio plot (a, c) because of the large disagreement with the data. |

png pdf |
Figure 1-c:
The integrated yield, $r( {p^{\mathrm {min}}_{\mathrm {T}}} )$, of events with a leading charged particle within $ {| \eta | } < 2.4$ (a, b) and with a leading jet within $ {| \eta | } < 1.9$ (c, d), as a function of $ {p^{\mathrm {min}}_{\mathrm {T}}} $. The data are compared to predictions from several PYTHIA 6 tunes (a, c) and various other event generators (b, d). The lower panels show the ratios of the MC and the data yields (MC/Data). The error bars indicate the statistical uncertainty and the red shaded area (only visible in the ratio plots) represents the systematic uncertainty. The predictions are scaled to the measured value of $r( {p^{\mathrm {lead}}_{\mathrm {T}}} >$ 9.0 GeV) (a, b) and 14.3 GeV (c, d). The prediction from PYTHIA 6 with MPI off and no parton saturation is not shown in the MC/data ratio plot (a, c) because of the large disagreement with the data. |

png pdf |
Figure 1-d:
The integrated yield, $r( {p^{\mathrm {min}}_{\mathrm {T}}} )$, of events with a leading charged particle within $ {| \eta | } < 2.4$ (a, b) and with a leading jet within $ {| \eta | } < 1.9$ (c, d), as a function of $ {p^{\mathrm {min}}_{\mathrm {T}}} $. The data are compared to predictions from several PYTHIA 6 tunes (a, c) and various other event generators (b, d). The lower panels show the ratios of the MC and the data yields (MC/Data). The error bars indicate the statistical uncertainty and the red shaded area (only visible in the ratio plots) represents the systematic uncertainty. The predictions are scaled to the measured value of $r( {p^{\mathrm {lead}}_{\mathrm {T}}} >$ 9.0 GeV) (a, b) and 14.3 GeV (c, d). The prediction from PYTHIA 6 with MPI off and no parton saturation is not shown in the MC/data ratio plot (a, c) because of the large disagreement with the data. |
| Summary |
| The integrated yields of events with a leading charged particle or a leading charged-particle jet with $p_{\mathrm {T}}$ above a given $p^{\mathrm {min}}_{\mathrm {T}}$ threshold, starting at $p^{\mathrm {min}}_{\mathrm {T}} = $ 0.8 and 1 GeV, respectively, have been measured in pp collisions at $\sqrt{s} =$ 8 TeV in a data sample corresponding to an integrated luminosity of 45 mb$^{-1}$. The particles and jets are measured in the pseudorapidity ranges $| \eta | <$ 2.4 and 1.9, respectively. The yields are found to be relatively flat in the $p^{\mathrm {min}}_{\mathrm {T}}$ region around 1 GeV -- where the fixed order perturbative parton-parton cross section diverges in the absence of any mechanism that saturates or unitarises the pQCD scattering -- followed by a steep decrease for $p^{\mathrm {min}}_{\mathrm {T}} >$ 10 GeV. The flattening behaviour observed at very low $p^{\mathrm {min}}_{\mathrm {T}}$ is best described by EPOS, which deviates by at most 10% from the data. The comparison of the data with different phenomenological predictions of hadronic interaction models may help to improve the description of the transition between the perturbative and non-perturbative QCD regimes, which is dominated by the effects of parton density saturation and multiple partonic interactions. |
|
|
Compact Muon Solenoid LHC, CERN |
|

|

|

|

|

|