

Compact Muon Solenoid
LHC, CERN
| CMS-HIG-13-007 ; CERN-PH-EP-2014-243 | ||
| Search for a standard model-like Higgs boson in the $\mu^+ \mu^-$ and $\mathrm{e}^+ \mathrm{e}^-$ decay channels at the LHC | ||
| CMS Collaboration | ||
| 24 October 2014 | ||
| Phys. Lett. B 744 (2015) 184 | ||
| Abstract: A search is presented for a standard model-like Higgs boson decaying to muon pair or electron pair final states based on proton-proton collisions recorded by the CMS experiment at the CERN LHC. The data correspond to integrated luminosities of 5.0 fb$^{-1}$ at a centre-of-mass energy of 7 TeV and 19.7 fb$^{-1}$ at 8 TeV for the muon search, and of 19.7 fb$^{-1}$ at 8 TeV for the electron search. Upper limits on the production cross section times branching fraction at the 95% confidence level are reported for Higgs boson masses in the range from 120 to 150 GeV. For a Higgs boson with a mass of 125 GeV decaying to muons, the observed (expected) upper limit on the production rate is found to be 7.4 (6.5$^{+2.8}_{-1.9}$) times the standard model value. This corresponds to an upper limit on the branching fraction of 0.0016. Similarly, for electrons, an upper limit of 0.0019 is placed on the branching fraction, which is about 3.7 10$^5 $ times the standard model value. These results, together with recent evidence of the 125 GeV boson coupling to tau-leptons with a larger branching fraction consistent with the standard model, confirm that the leptonic couplings of the new boson are not flavour-universal. | ||
| Links: e-print arXiv:1410.6679 [hep-ex] (PDF) ; CDS record ; inSPIRE record ; Public twiki page ; CADI line (restricted) ; | ||
| Figures | |
png pdf |
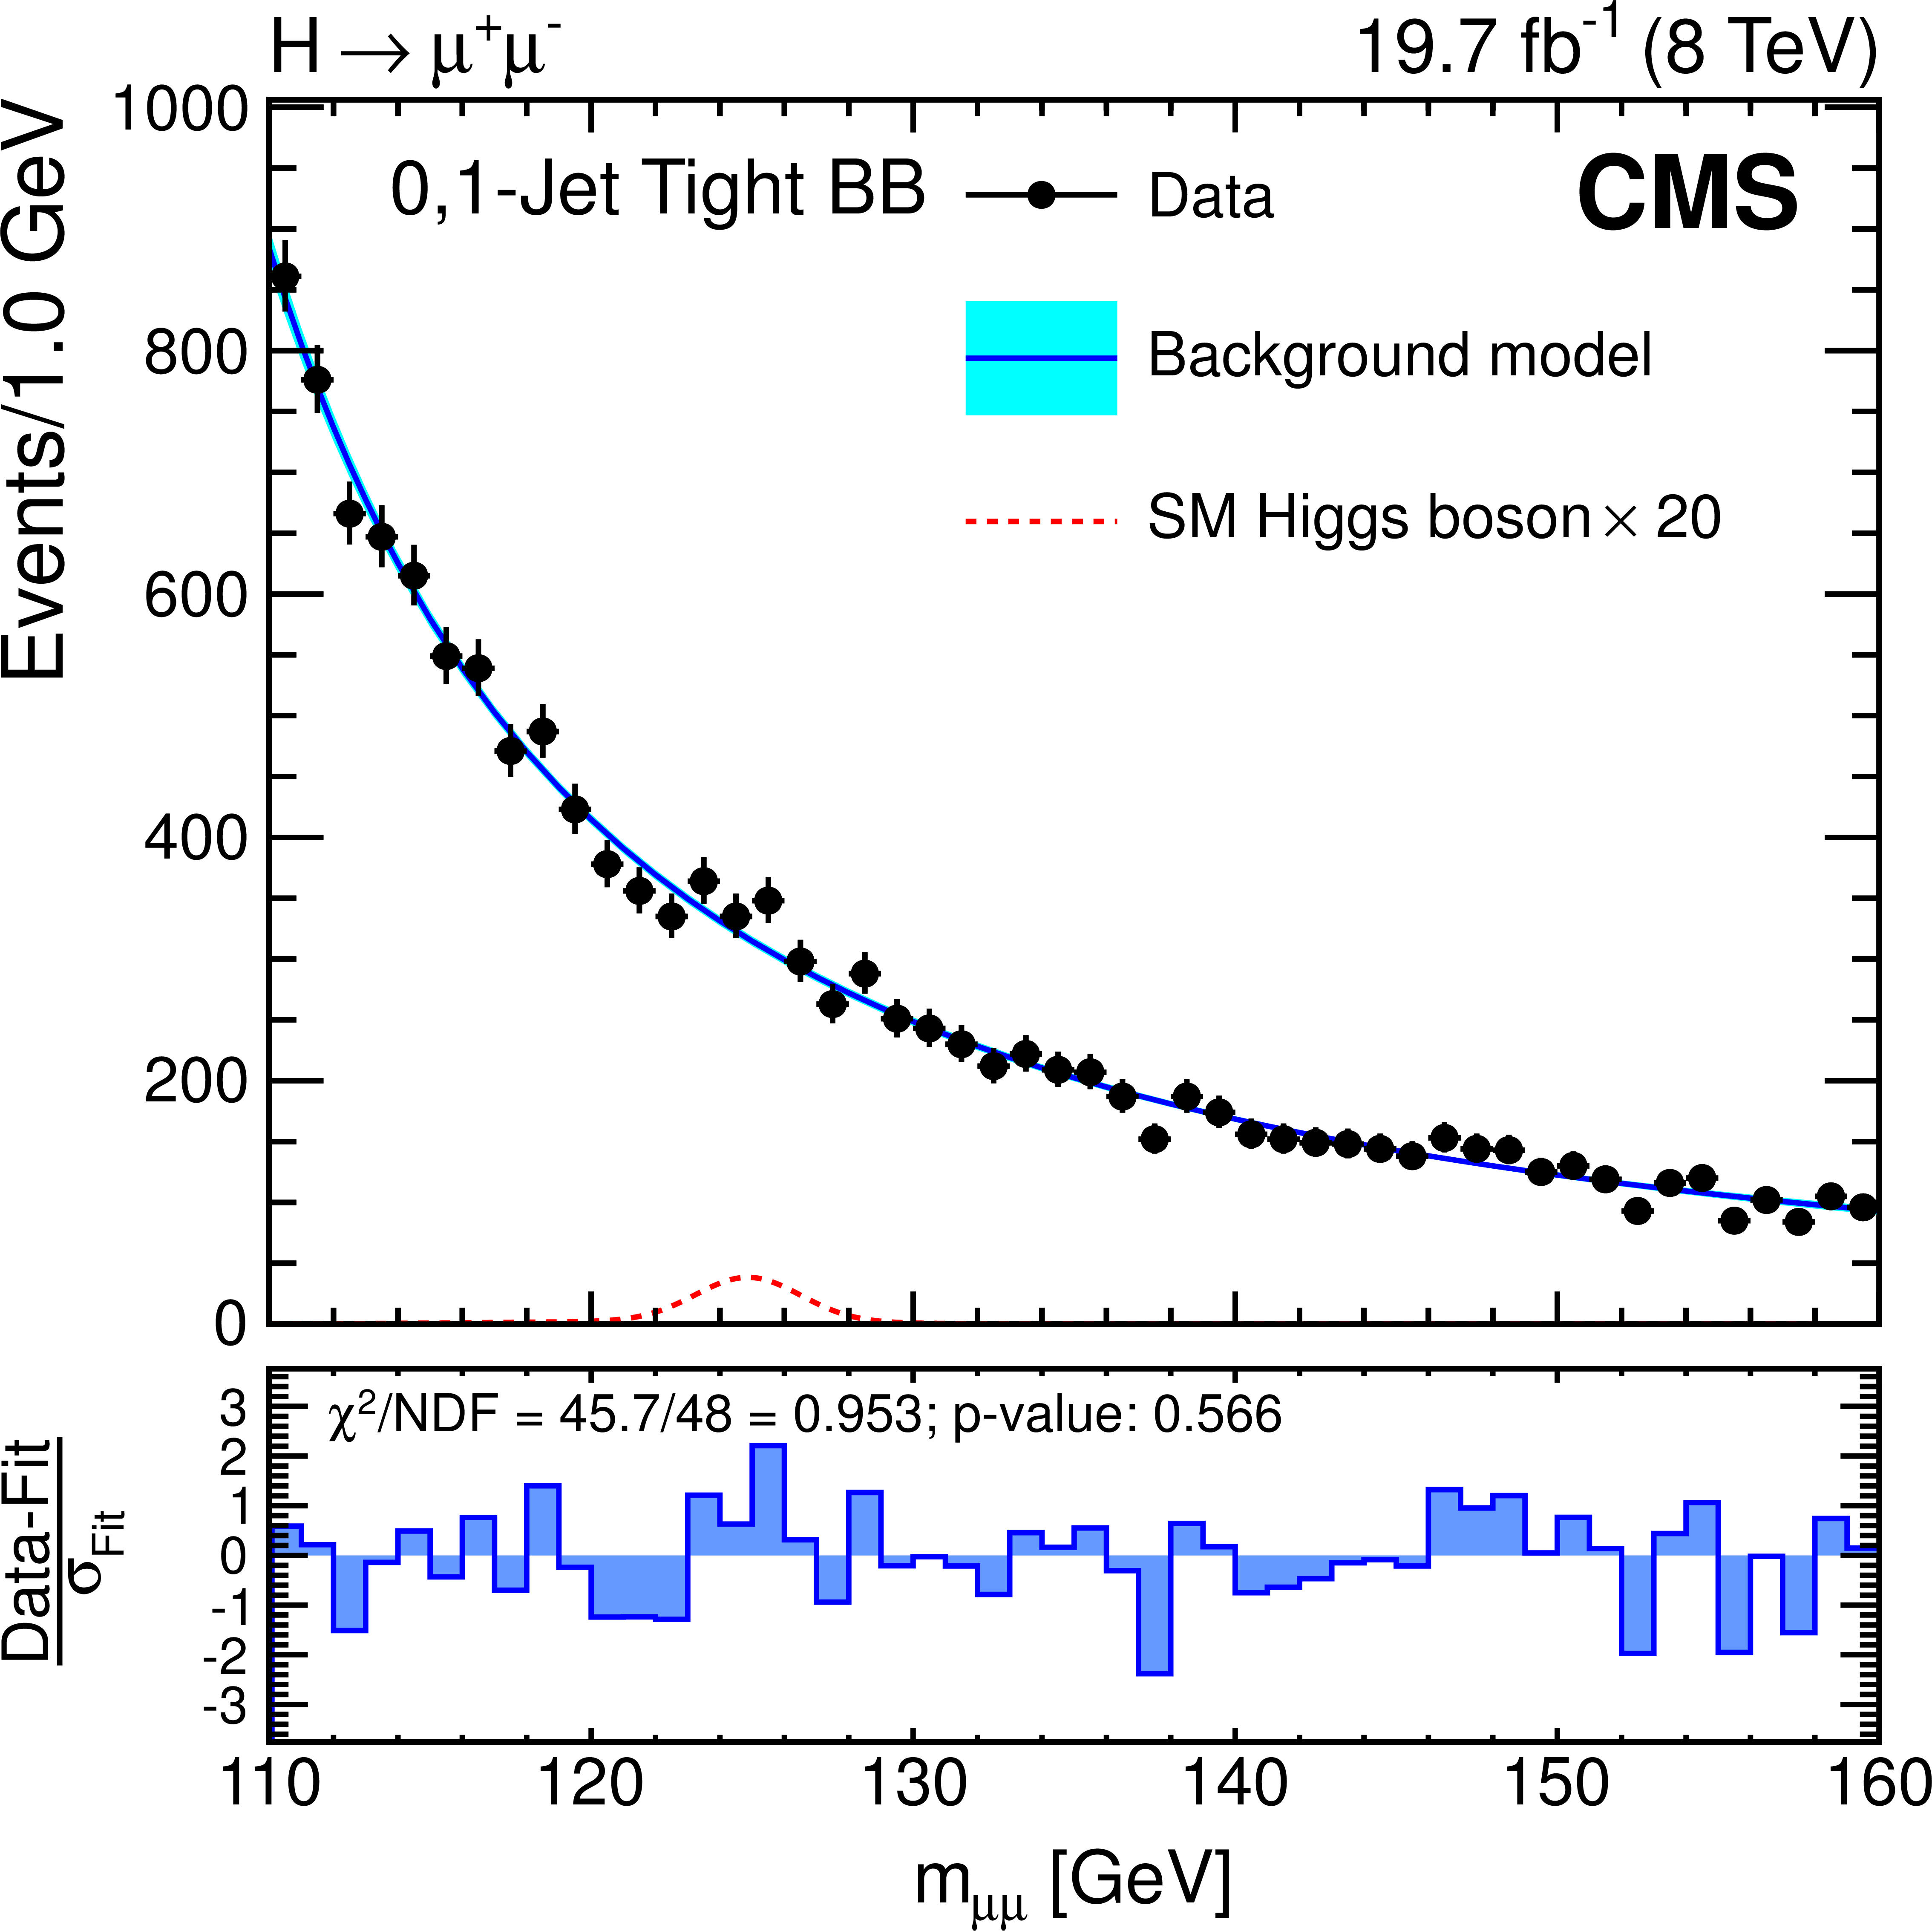
Figure 1-a:
The dimuon invariant mass at 8 TeV and the background model are shown for the 0,1-jet Tight category when both muons are reconstructed in the barrel (a) and the 2-jet VBF Tight category (b). A best fit of the background model (see text) is shown by a solid line, while its fit uncertainty is represented by a lighter band. The dotted line illustrates the expected SM Higgs boson signal enhanced by a factor of 20, for $ {m_ {\mathrm {H}} }$ =125 GeV. The lower histograms show the residual for each bin (Data-Fit) normalized by the Poisson statistical uncertainty of the background model ($\sigma _\mathrm {Fit}$). Also given are the sum of squares of the normalized residuals ($\chi ^2$) divided by the number of degrees of freedom (NDF) and the corresponding $p$-value assuming the sum follows the $\chi ^2$ distribution. |
png pdf |
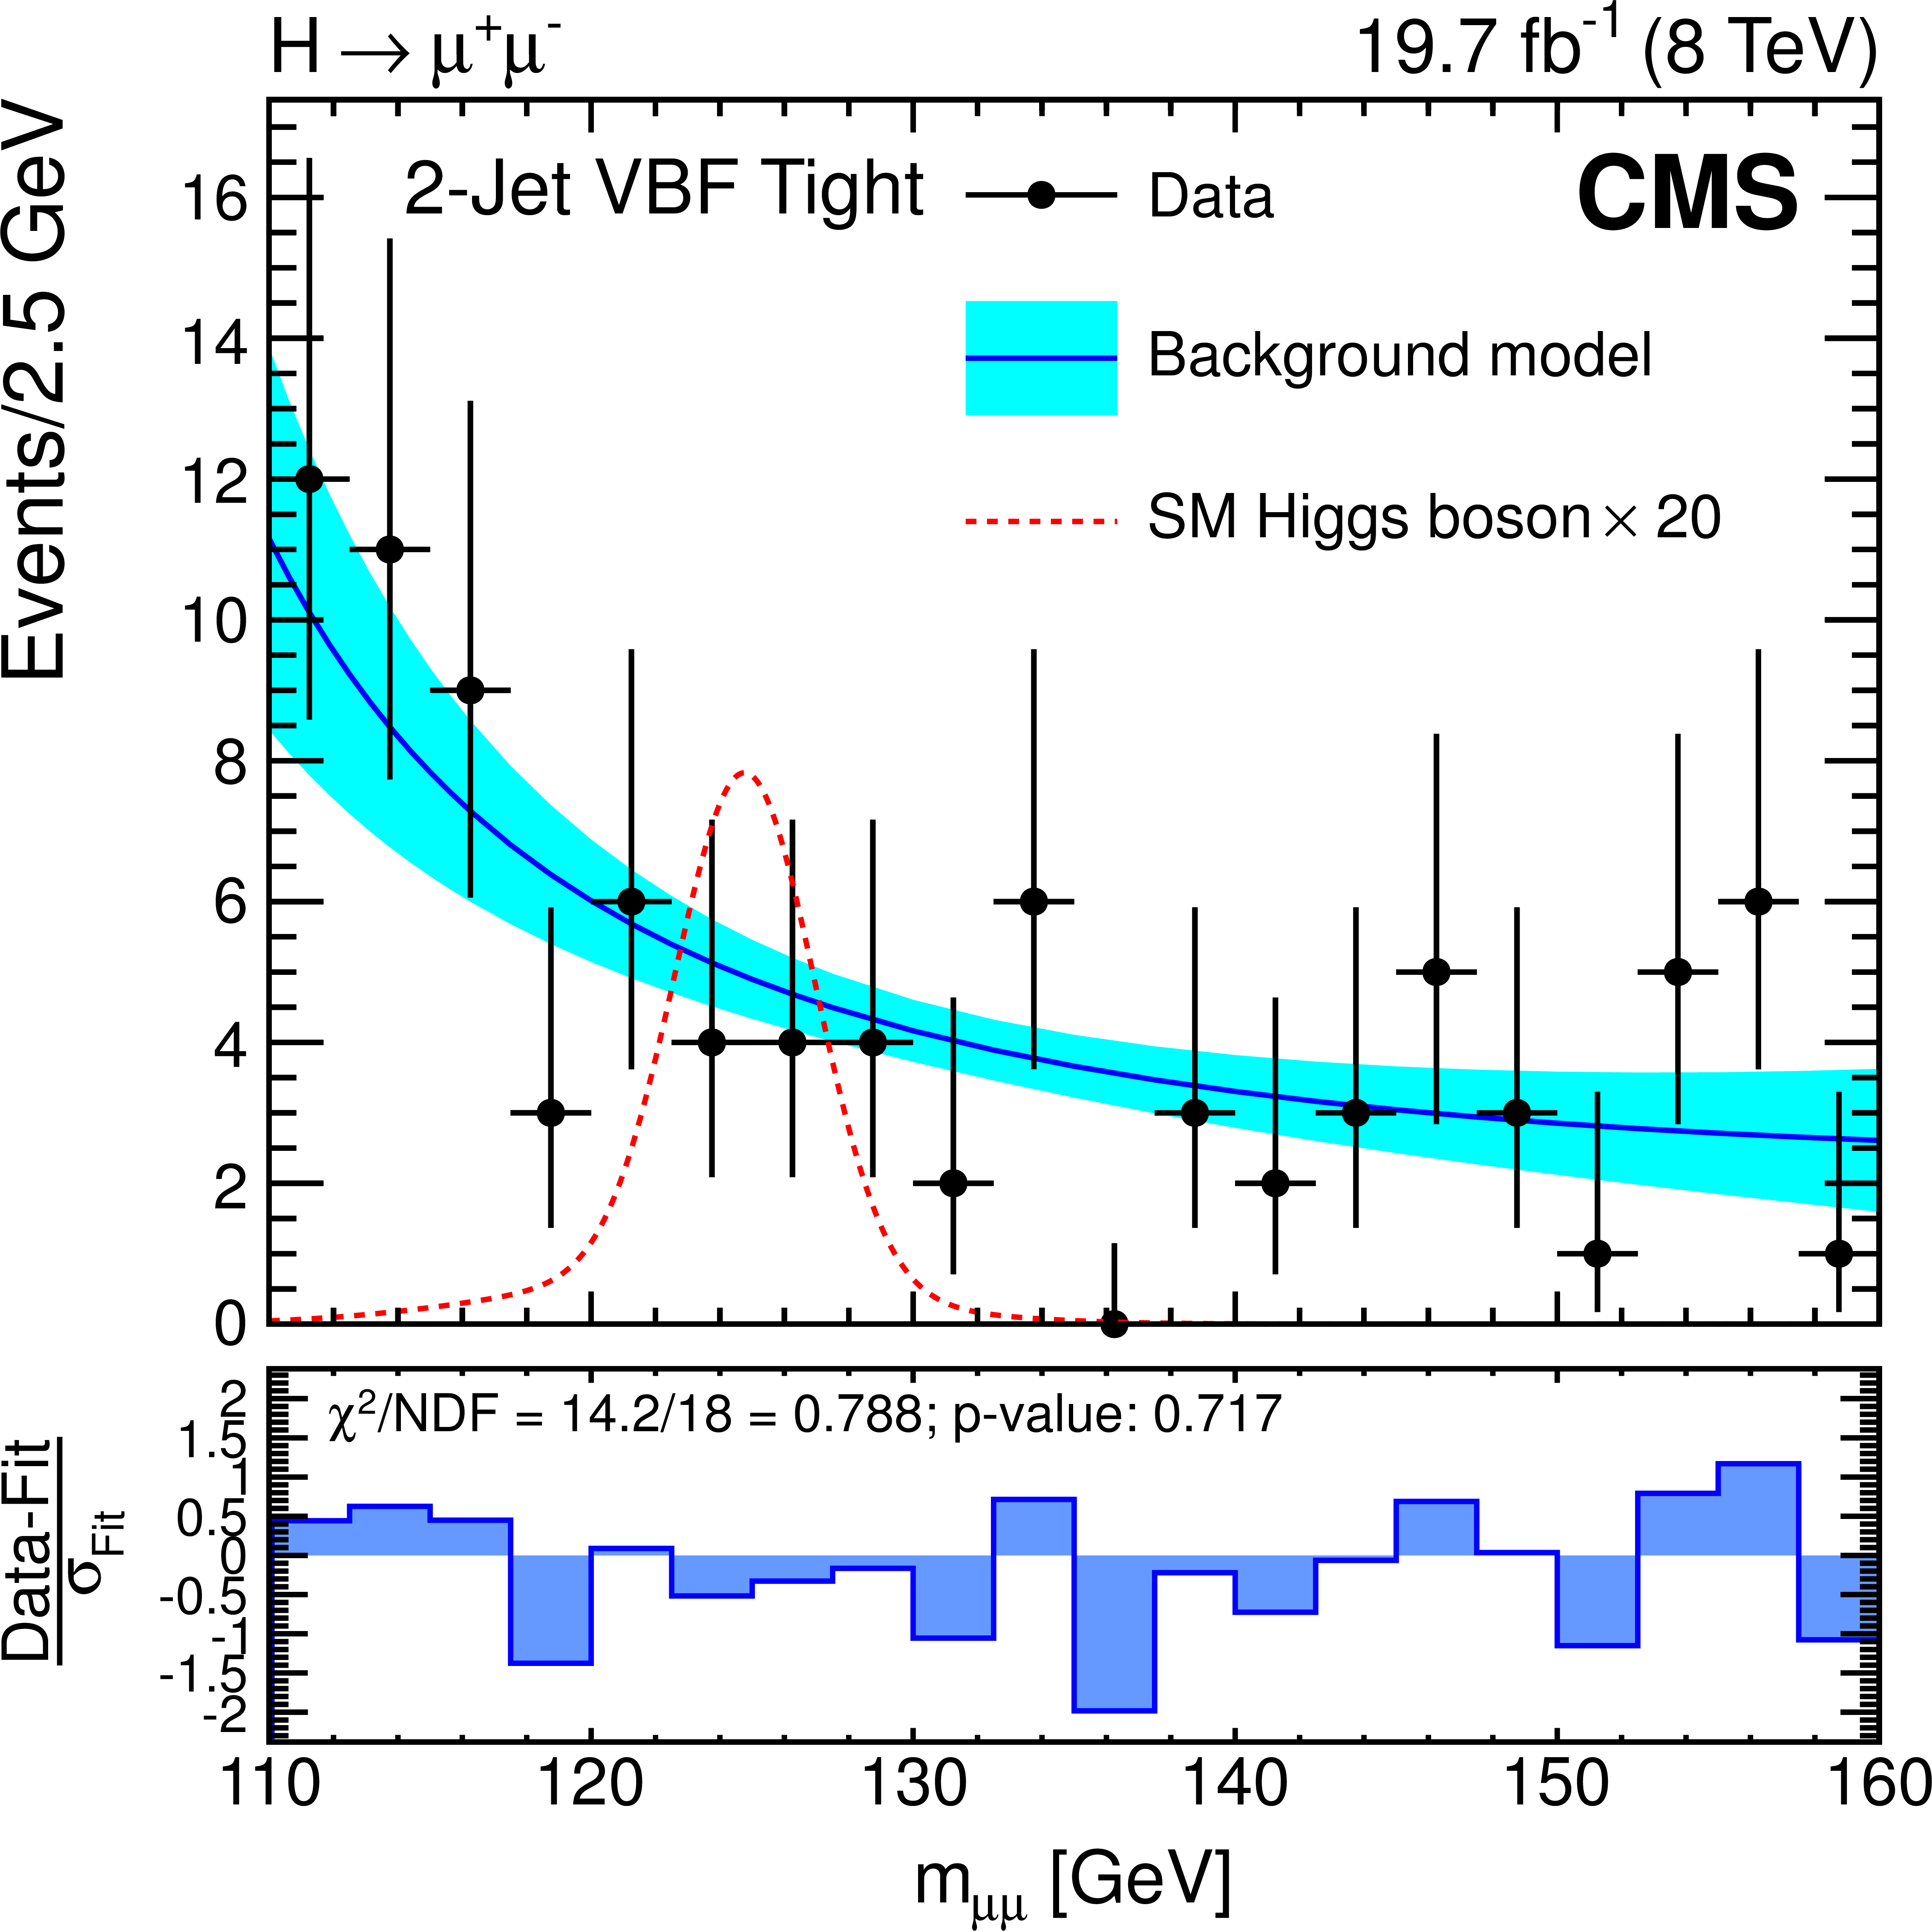
Figure 1-b:
The dimuon invariant mass at 8 TeV and the background model are shown for the 0,1-jet Tight category when both muons are reconstructed in the barrel (a) and the 2-jet VBF Tight category (b). A best fit of the background model (see text) is shown by a solid line, while its fit uncertainty is represented by a lighter band. The dotted line illustrates the expected SM Higgs boson signal enhanced by a factor of 20, for $ {m_ {\mathrm {H}} }$ =125 GeV. The lower histograms show the residual for each bin (Data-Fit) normalized by the Poisson statistical uncertainty of the background model ($\sigma _\mathrm {Fit}$). Also given are the sum of squares of the normalized residuals ($\chi ^2$) divided by the number of degrees of freedom (NDF) and the corresponding $p$-value assuming the sum follows the $\chi ^2$ distribution. |
png pdf |
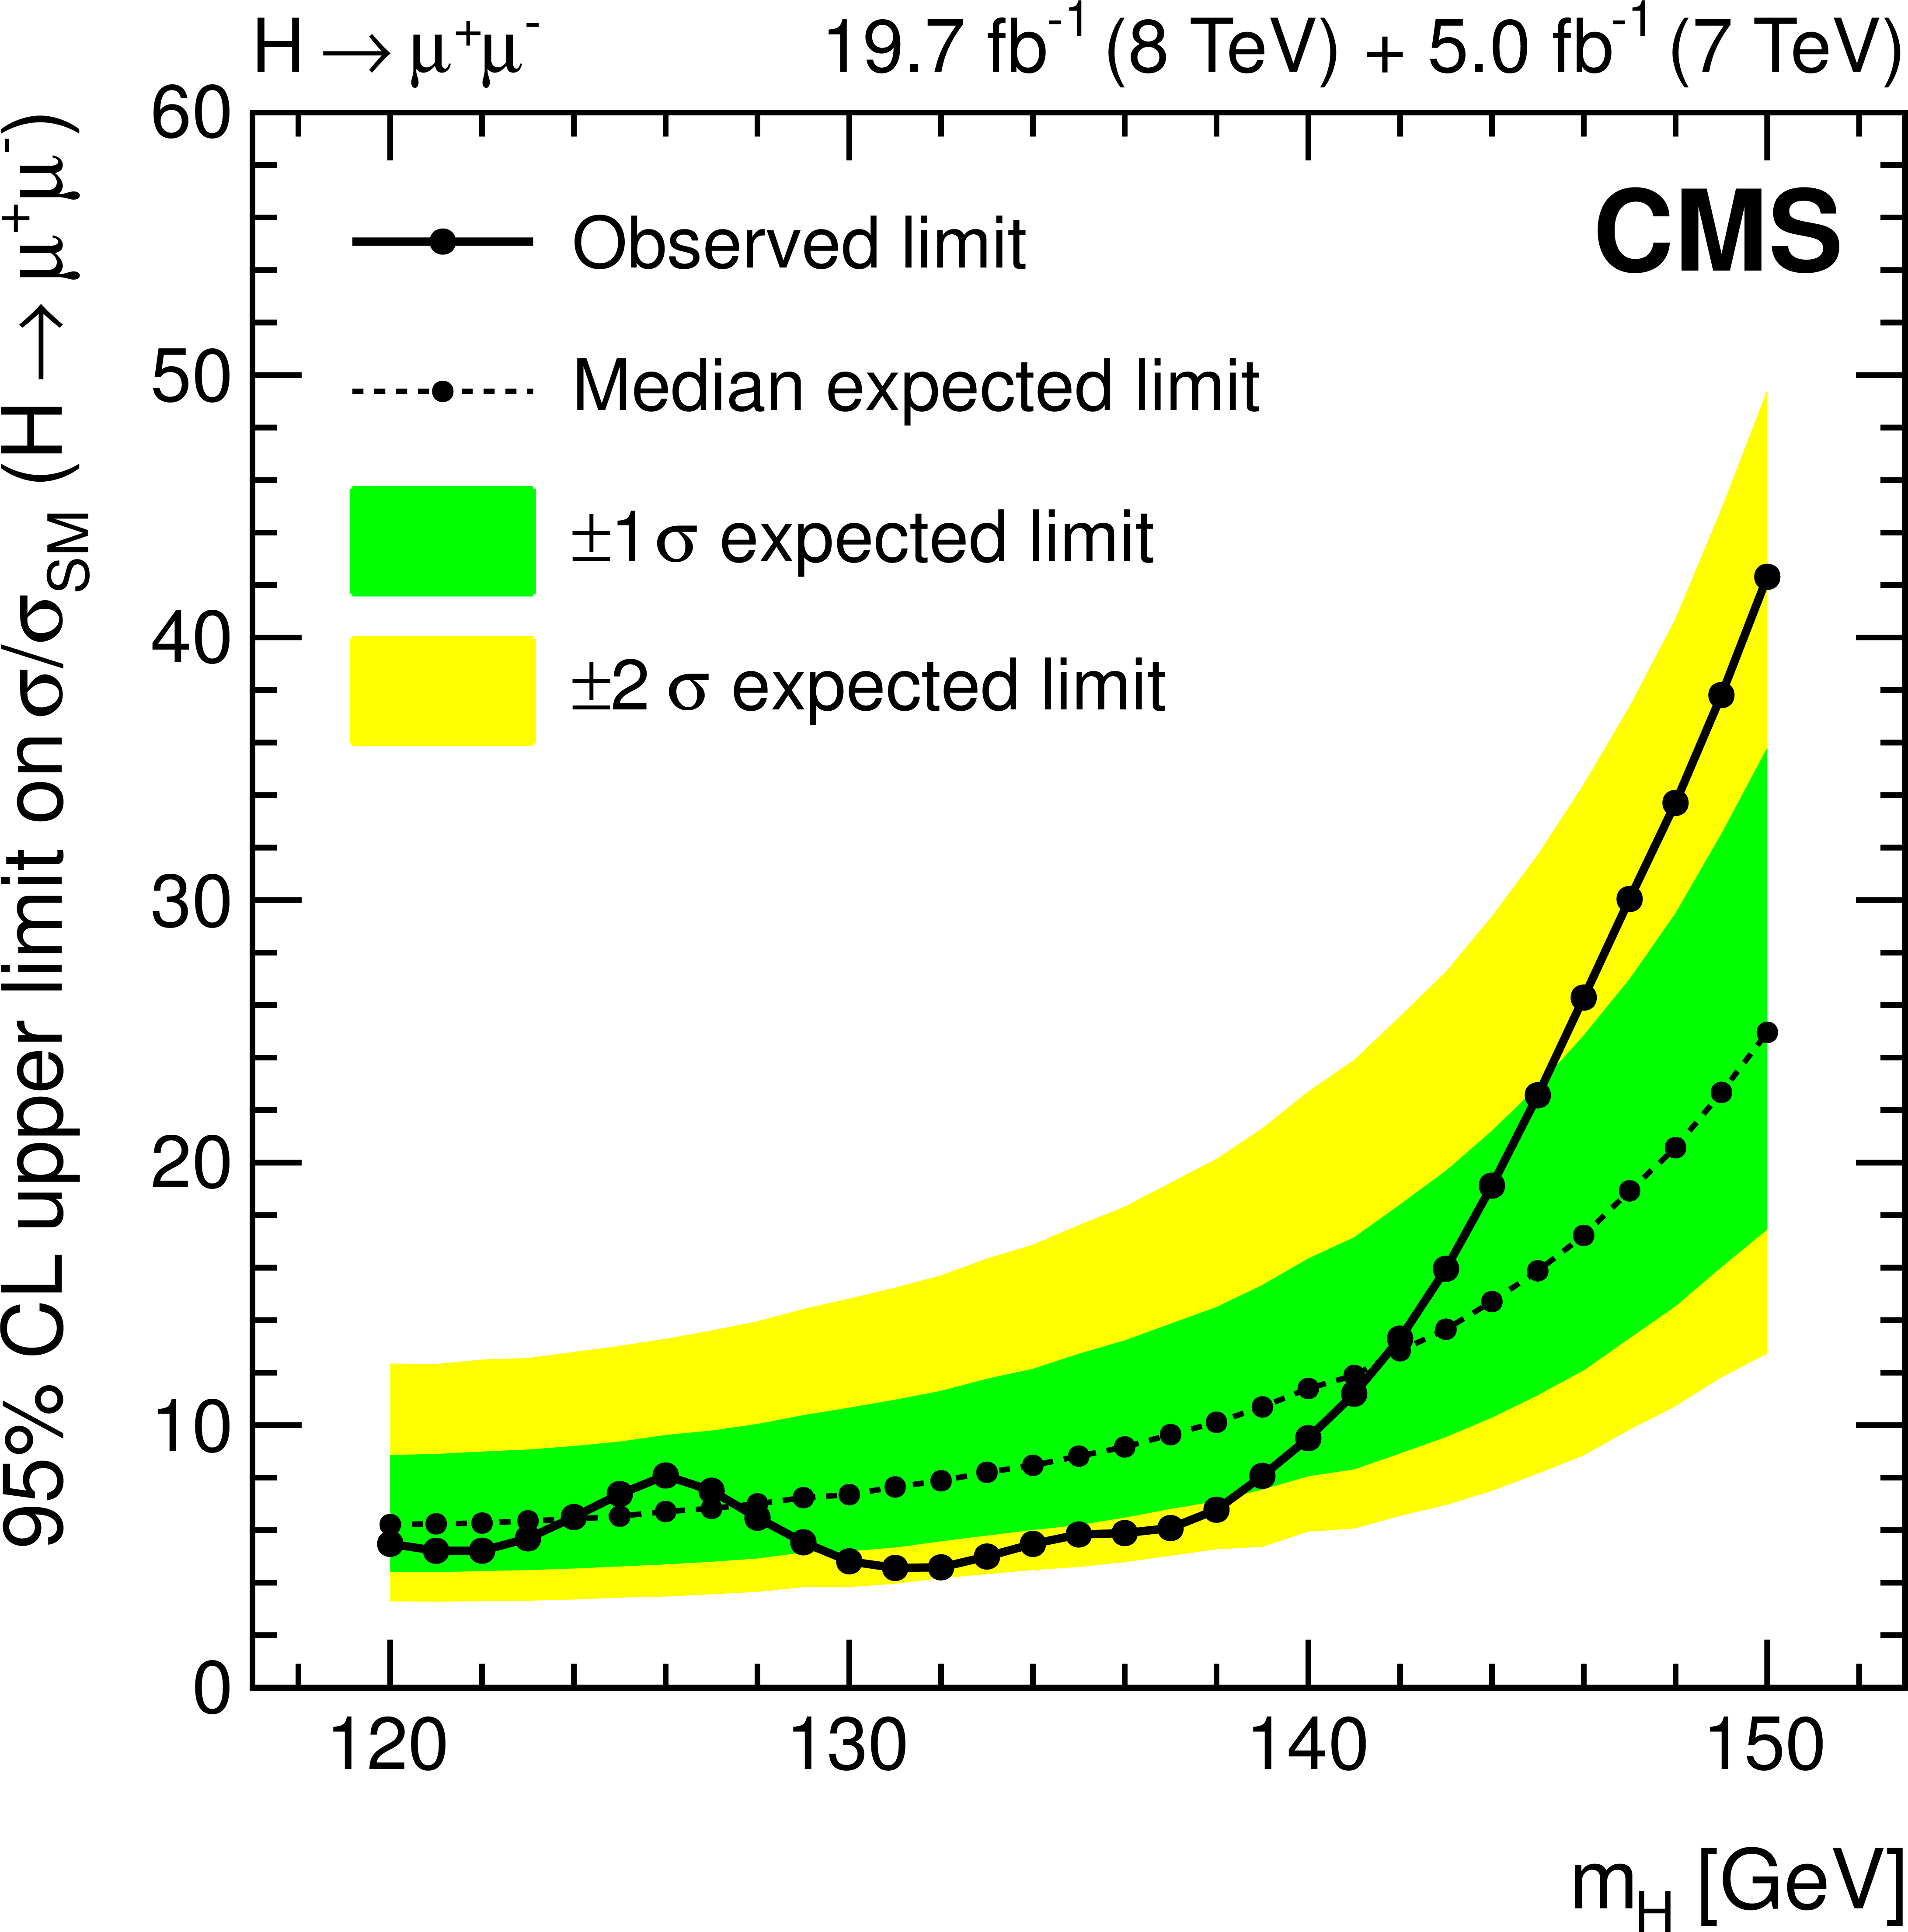
Figure 2:
Mass scan for the background-only expected and observed combined exclusion limits. |
png pdf |
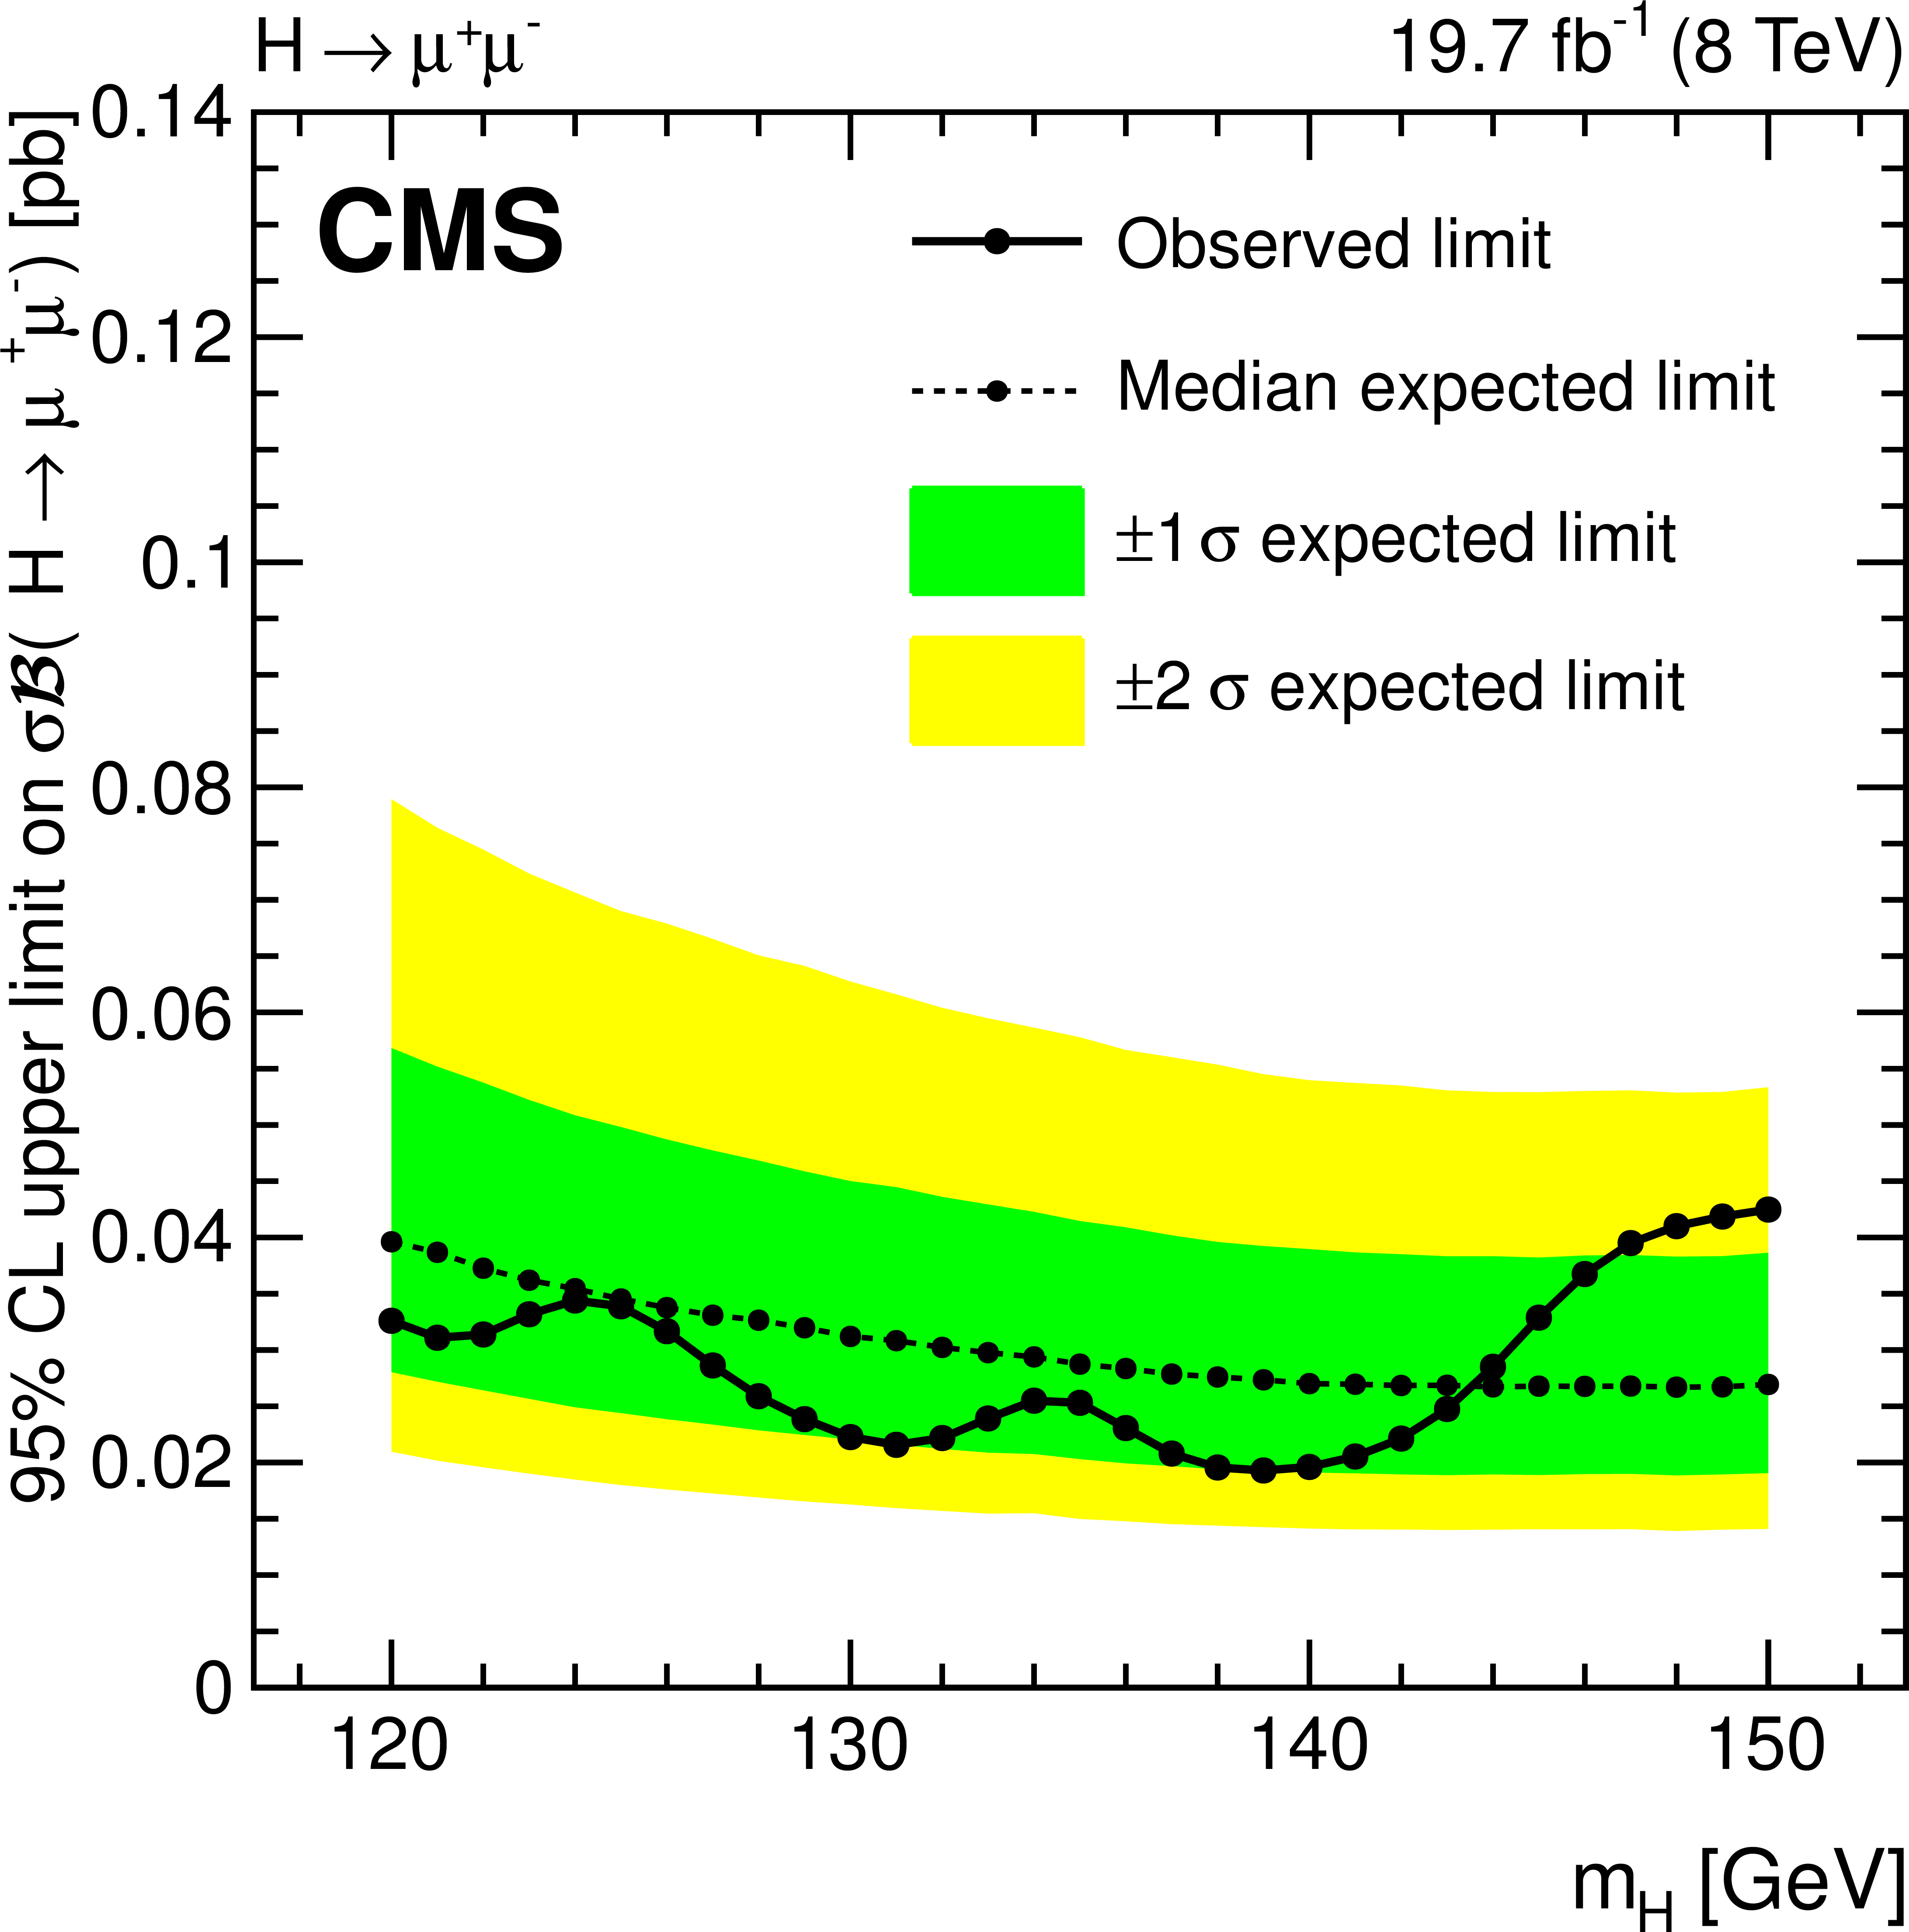
Figure 3-a:
Exclusion limits on $\sigma {\mathcal {B}} $ are shown for $ {\mathrm {H}} \to { {{\mu ^+}} {{\mu ^-}}} $ (a ), and for $ {\mathrm {H}} \to { {\mathrm {e}^+} {\mathrm {e}^-}} $ (b), both for 8 TeV. Theoretical uncertainties on the cross sections and branching fraction are omitted, and the relative contributions of GF, VBF, and VH are as predicted in the SM. |
png pdf |
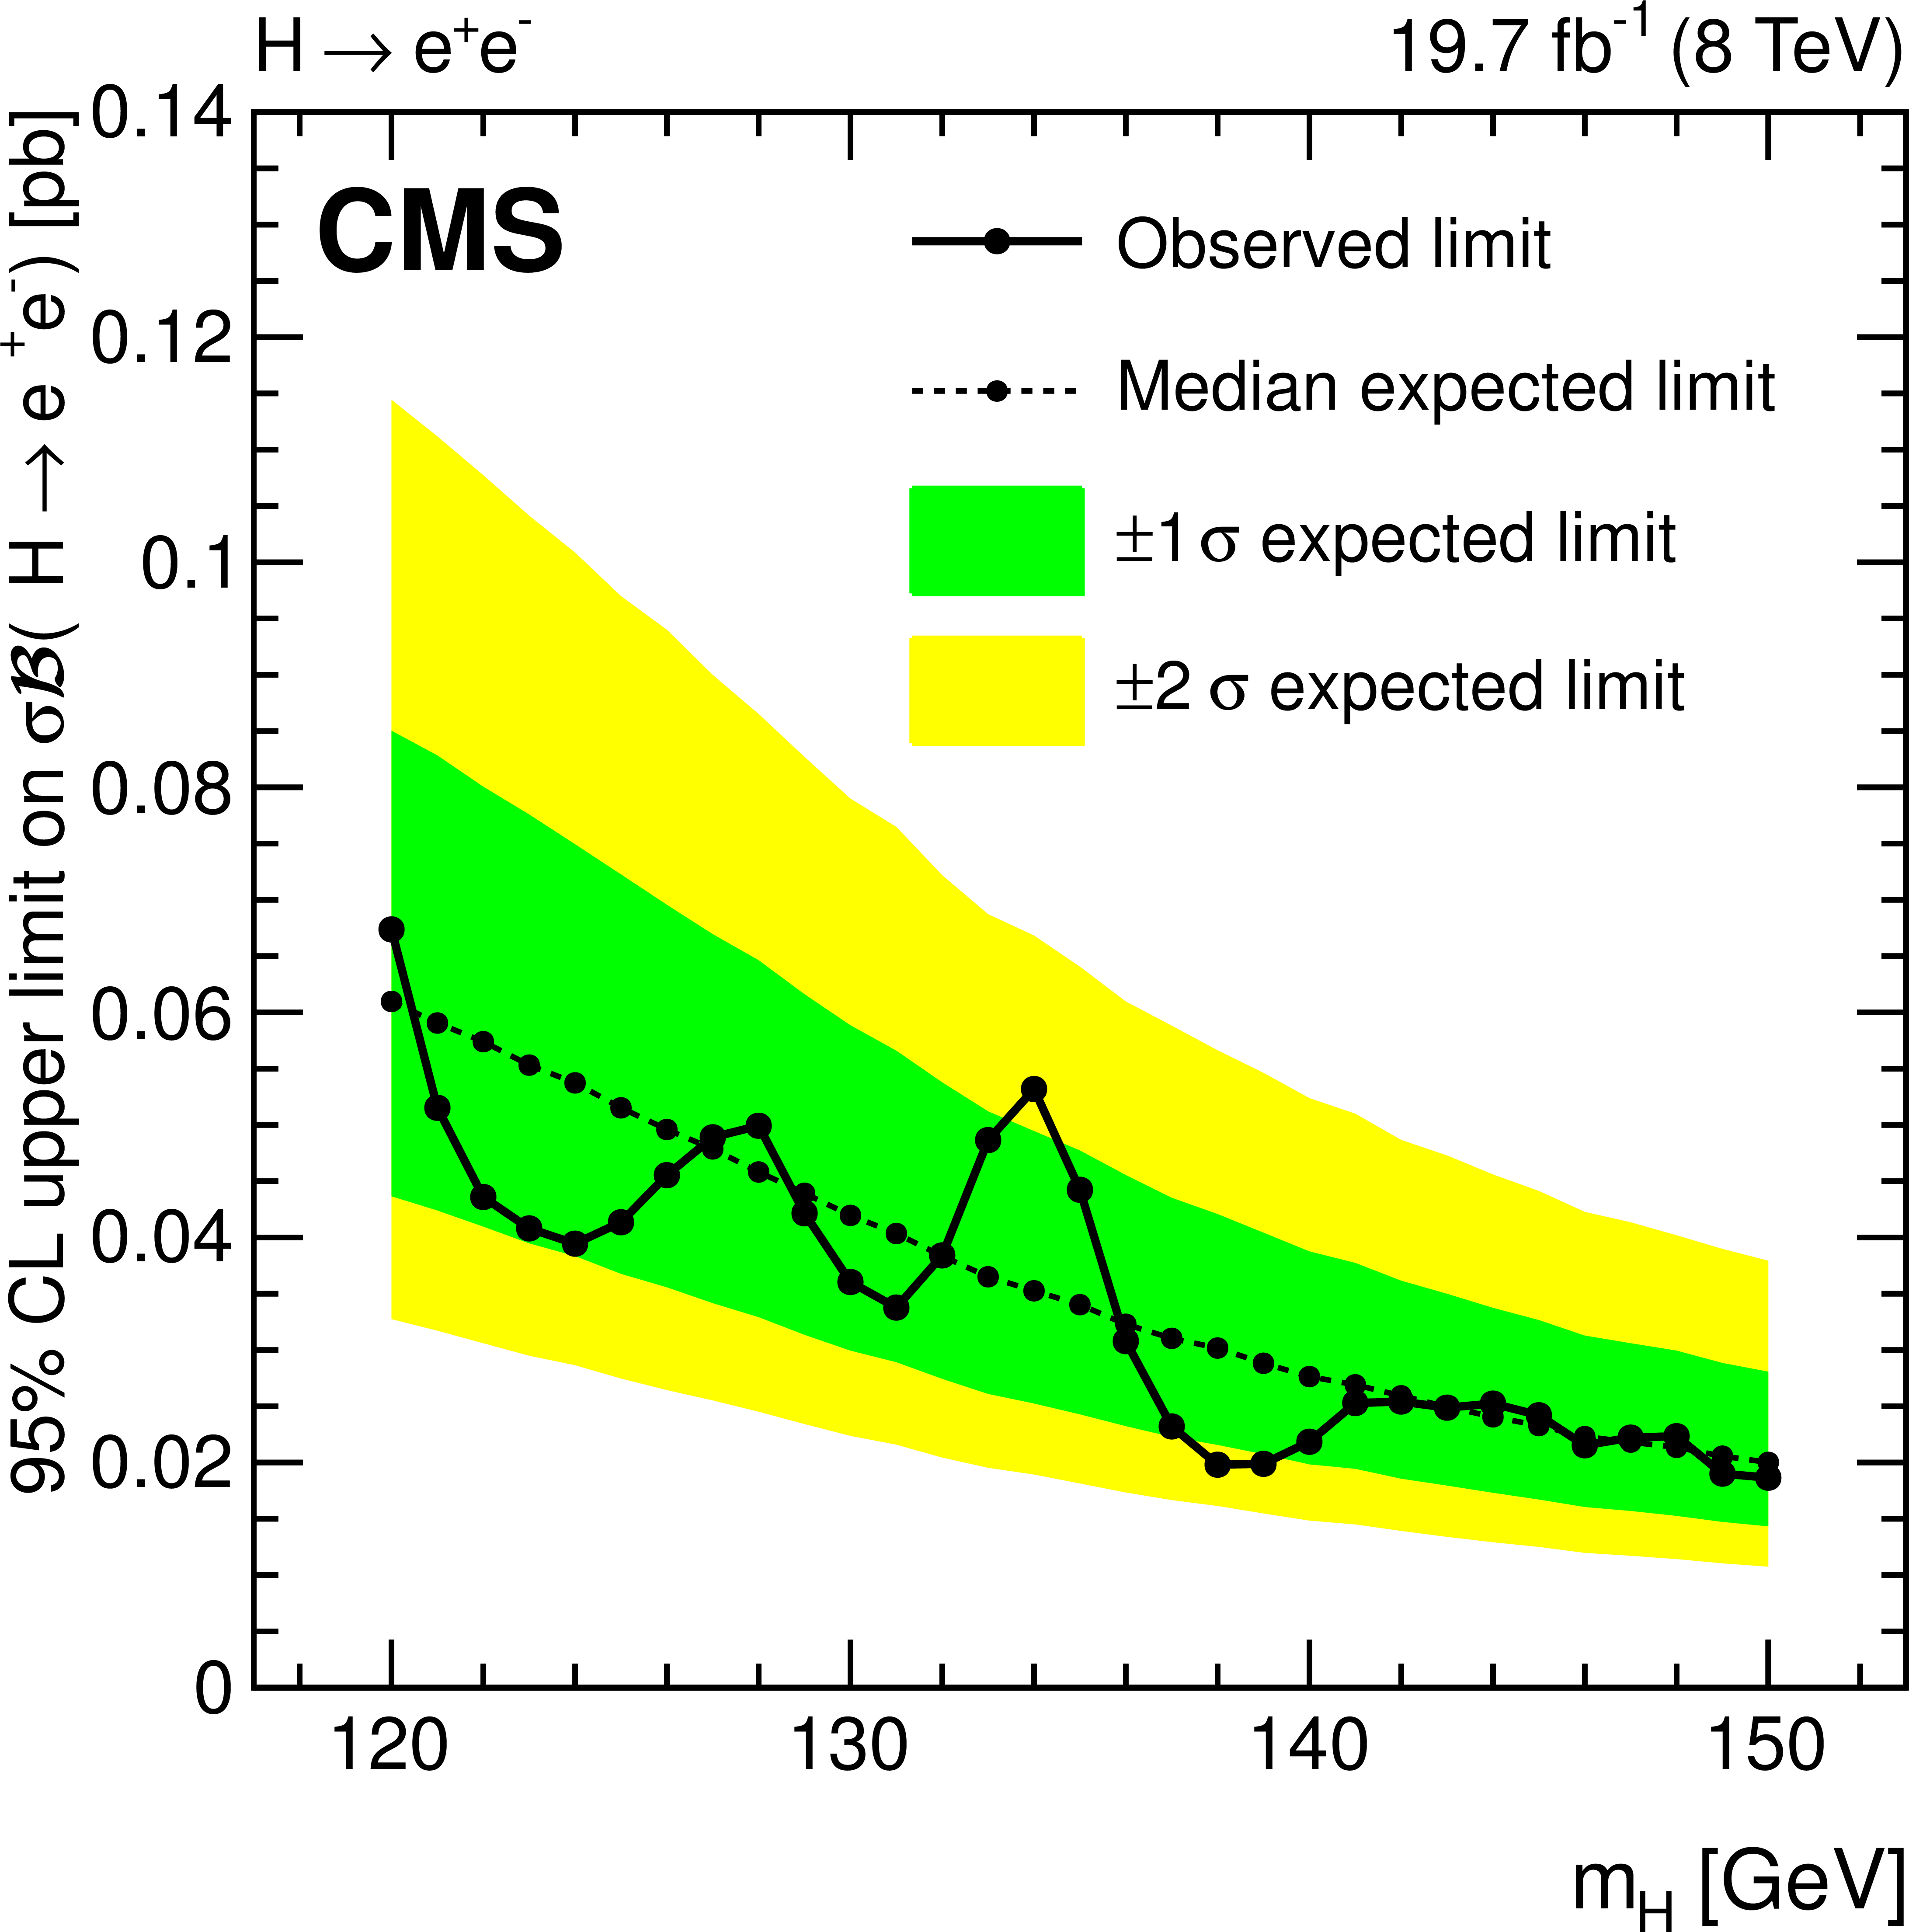
Figure 3-b:
Exclusion limits on $\sigma {\mathcal {B}} $ are shown for $ {\mathrm {H}} \to { {{\mu ^+}} {{\mu ^-}}} $ (a ), and for $ {\mathrm {H}} \to { {\mathrm {e}^+} {\mathrm {e}^-}} $ (b), both for 8 TeV. Theoretical uncertainties on the cross sections and branching fraction are omitted, and the relative contributions of GF, VBF, and VH are as predicted in the SM. |
png pdf |
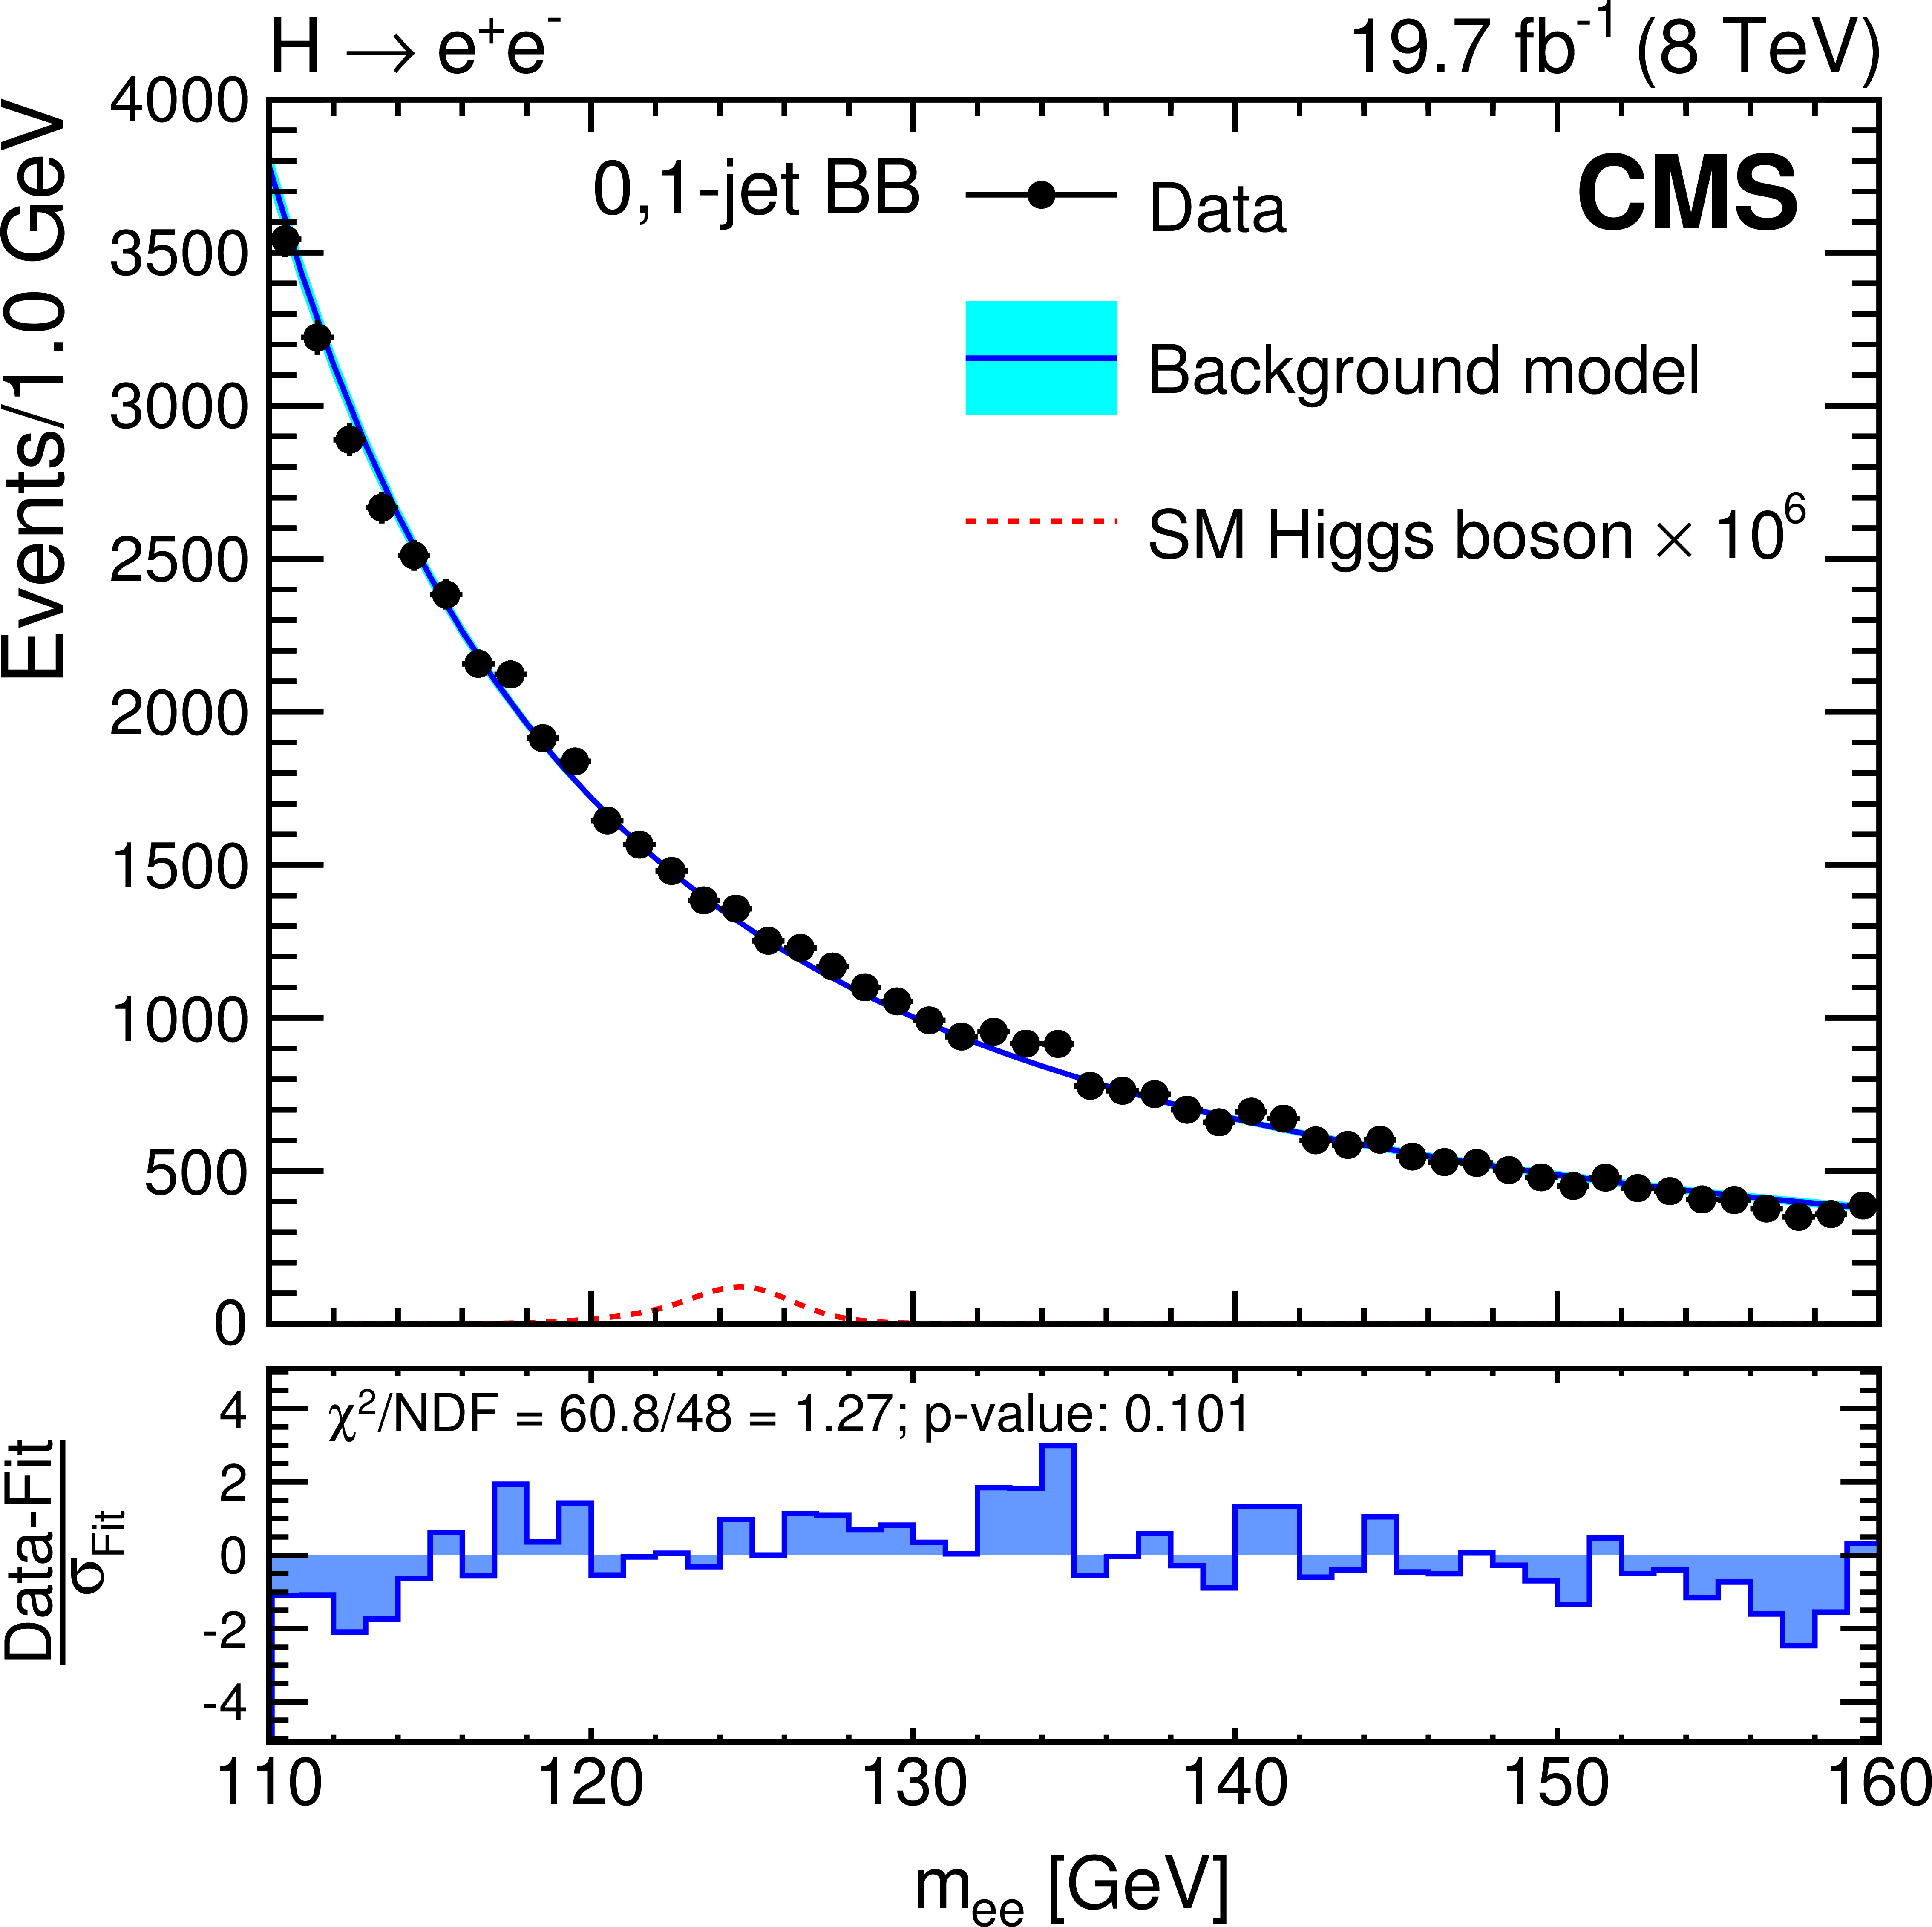
Figure 4-a:
The dielectron invariant mass at 8 TeV and the background model are shown for the 0,1-jet BB (a) and 2-jet Tight (b) categories. A best fit of the background model is shown by a solid line, while its fit uncertainty is represented by a lighter band. The dotted line illustrates the expected SM Higgs boson signal enhanced by a factor of $10^6$, for $ {m_ {\mathrm {H}} }$ = 125 GeV. The lower histograms show the residual for each bin (Data-Fit) normalized by the Poisson statistical uncertainty of the background model ($\sigma _\mathrm {Fit}$). Also given are the sum of squares of the normalized residuals ($\chi ^2$) divided by the number of degrees of freedom (NDF) and the corresponding $p$-value assuming the sum follows the $\chi ^2$ distribution. |
png pdf |
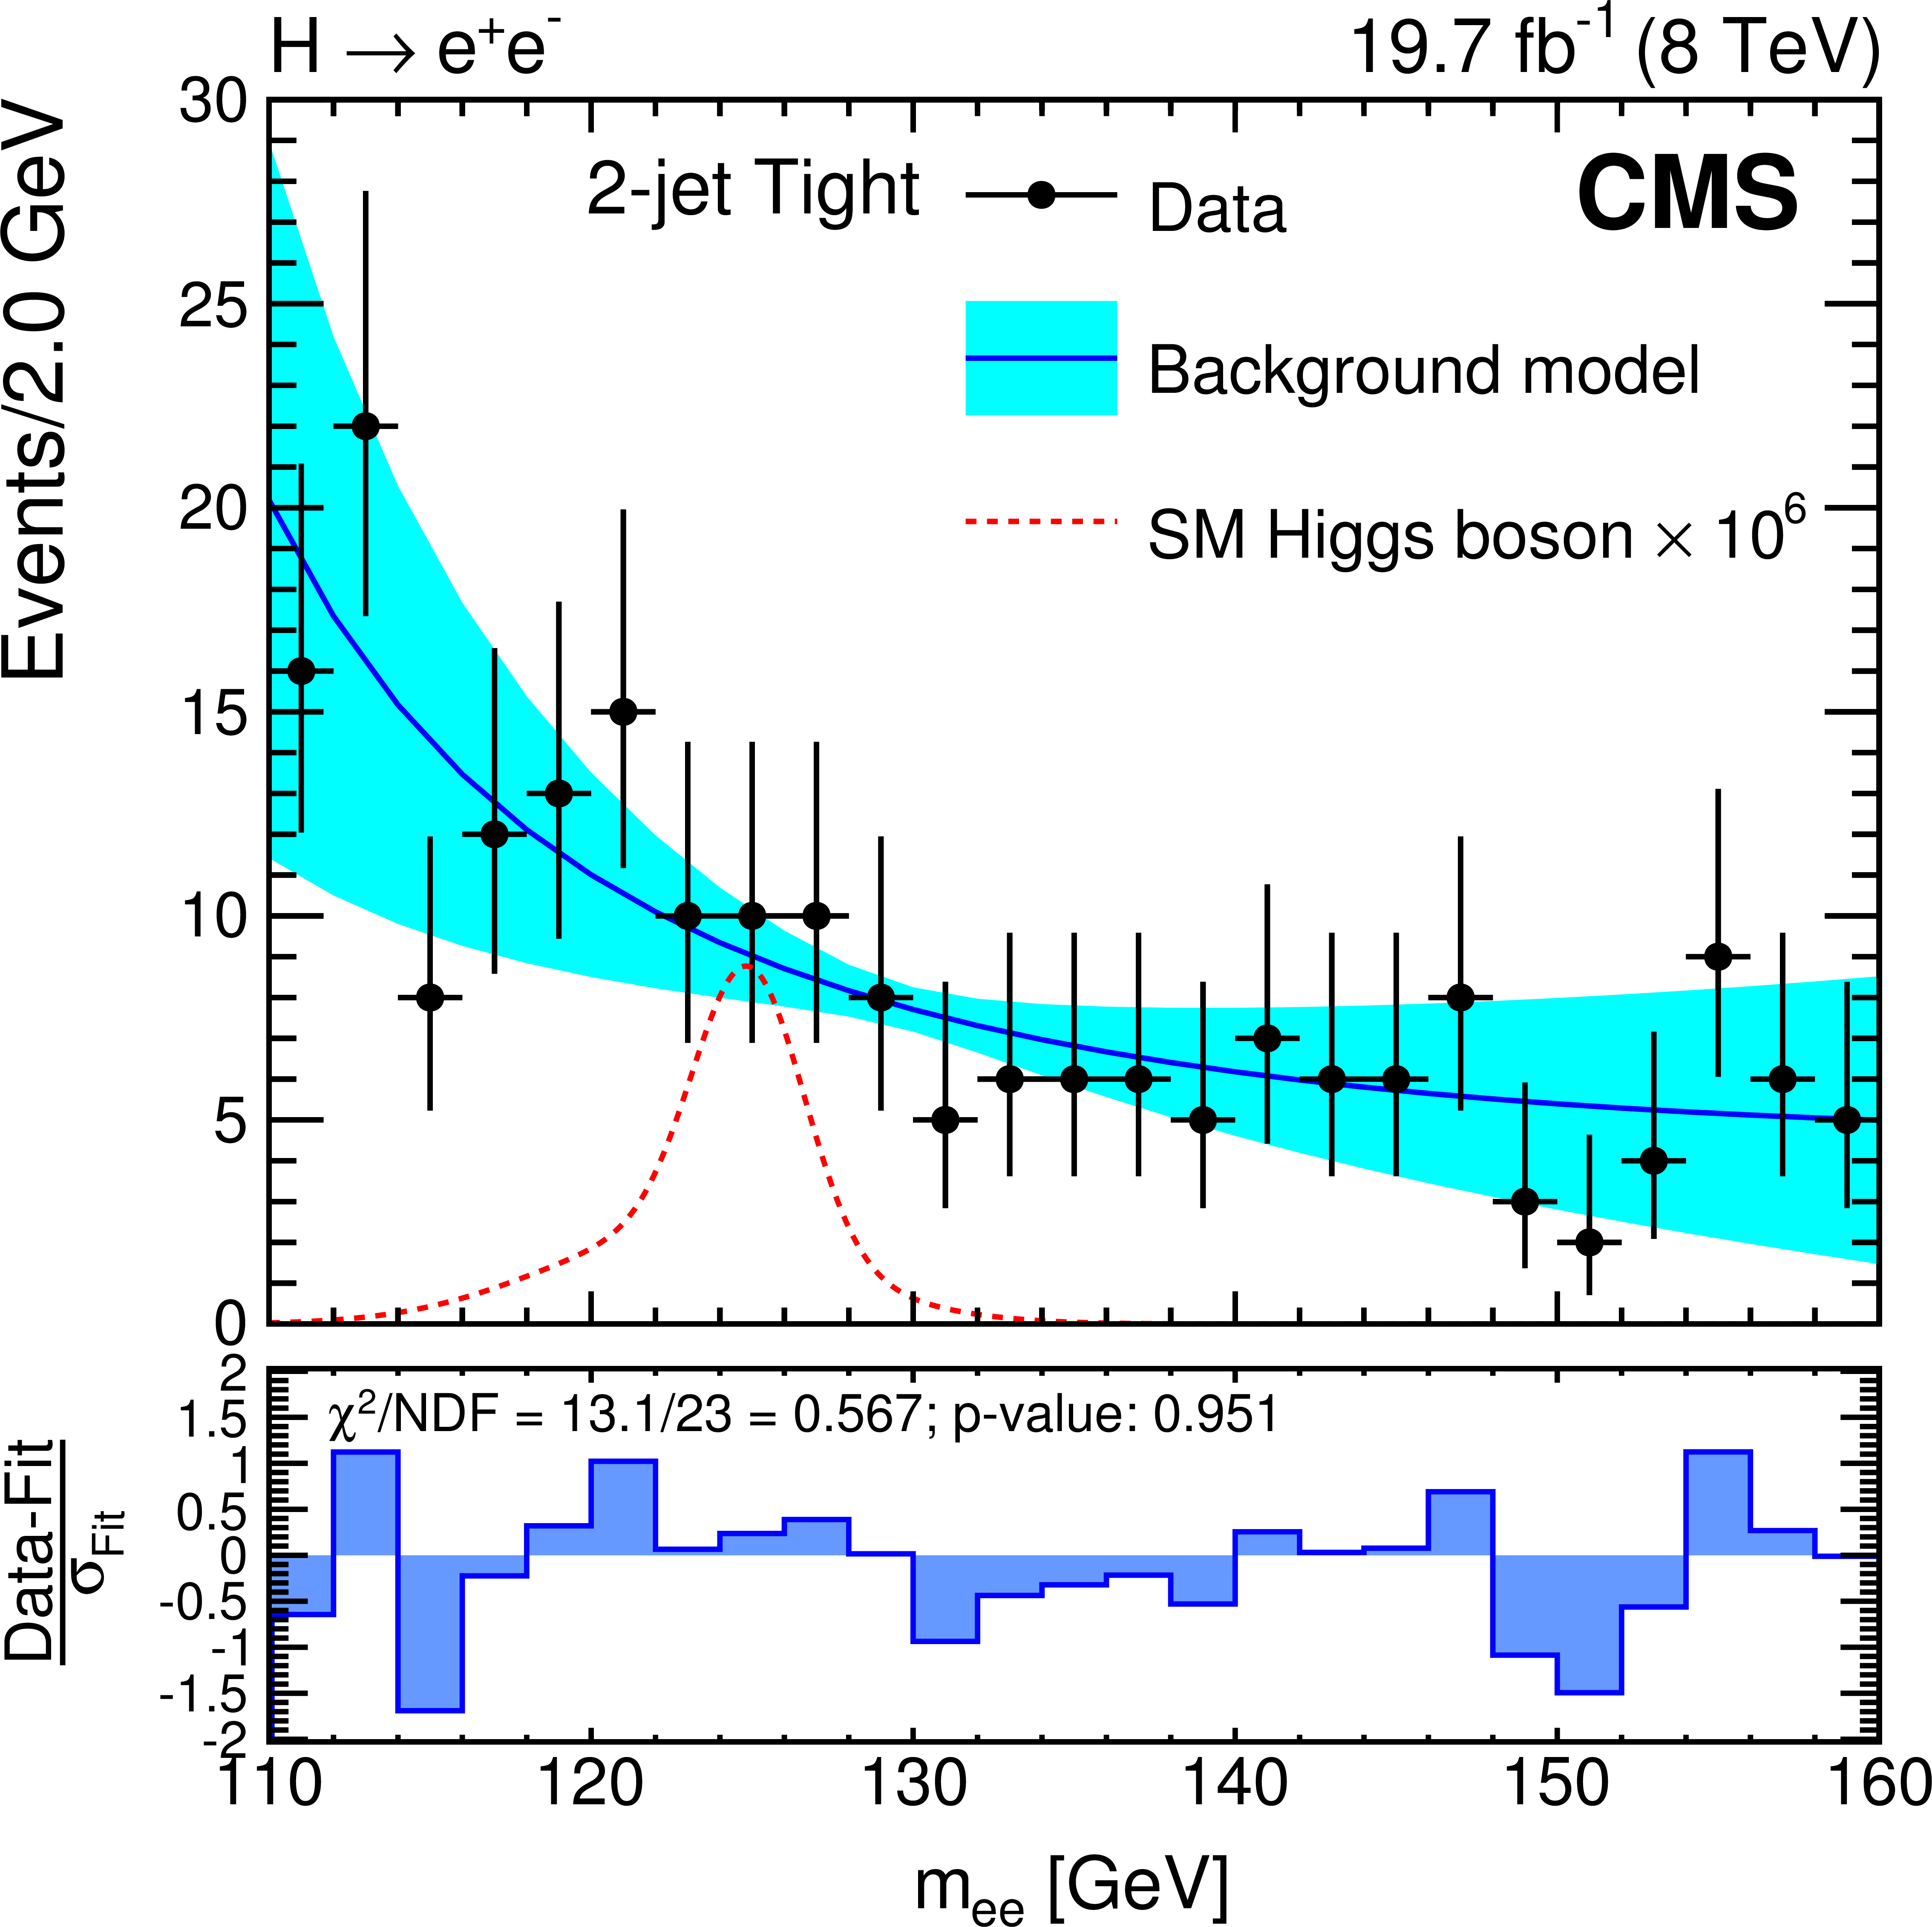
Figure 4-b:
The dielectron invariant mass at 8 TeV and the background model are shown for the 0,1-jet BB (a) and 2-jet Tight (b) categories. A best fit of the background model is shown by a solid line, while its fit uncertainty is represented by a lighter band. The dotted line illustrates the expected SM Higgs boson signal enhanced by a factor of $10^6$, for $ {m_ {\mathrm {H}} }$ = 125 GeV. The lower histograms show the residual for each bin (Data-Fit) normalized by the Poisson statistical uncertainty of the background model ($\sigma _\mathrm {Fit}$). Also given are the sum of squares of the normalized residuals ($\chi ^2$) divided by the number of degrees of freedom (NDF) and the corresponding $p$-value assuming the sum follows the $\chi ^2$ distribution. |
|
|
Compact Muon Solenoid LHC, CERN |
|

|

|

|

|

|