

Compact Muon Solenoid
LHC, CERN
| CMS-HIG-14-003 ; CERN-PH-EP-2015-137 | ||
| Search for a Higgs boson decaying into $\gamma^*\gamma\to\ell\ell\gamma$ with low dilepton mass in pp collisions at $\sqrt{s} =$ 8 TeV | ||
| CMS Collaboration | ||
| 10 July 2015 | ||
| Phys. Lett. B 753 (2016) 341 | ||
| Abstract: A search is described for a Higgs boson decaying into two photons, one of which has an internal conversion to a muon or an electron pair ($ \ell \ell \gamma$). The analysis is performed using proton-proton collision data recorded with the CMS detector at the LHC at a centre-of-mass energy of 8 TeV, corresponding to an integrated luminosity of 19.7 fb$^{-1}$. The events selected have an opposite-sign muon or electron pair and a high transverse momentum photon. No excess above background has been found in the three-body invariant mass range 120 $< m_{ \ell \ell \gamma} <$ 150 GeV, and limits have been derived for the Higgs boson production cross section times branching fraction for the decay $\mathrm{H} \to \gamma^* \gamma \to \ell \ell \gamma$, where the dilepton invariant mass is less than 20 GeV. For a Higgs boson with $m_{\mathrm{H}} =$ 125 GeV, a 95% confidence level (CL) exclusion observed (expected) limit is 6.7 (5.9$^{+2.8}_{-1.8}$) times the standard model prediction. Additionally, an upper limit at 95% CL on the branching fraction of $\mathrm{H} \to (\mathrm{J} / \psi ) \gamma$ for the 125 GeV Higgs boson is set at 1.5x10$^{-3}$. | ||
| Links: e-print arXiv:1507.03031 [hep-ex] (PDF) ; CDS record ; inSPIRE record ; HepData record ; CADI line (restricted) ; | ||
| Figures | |
png pdf |
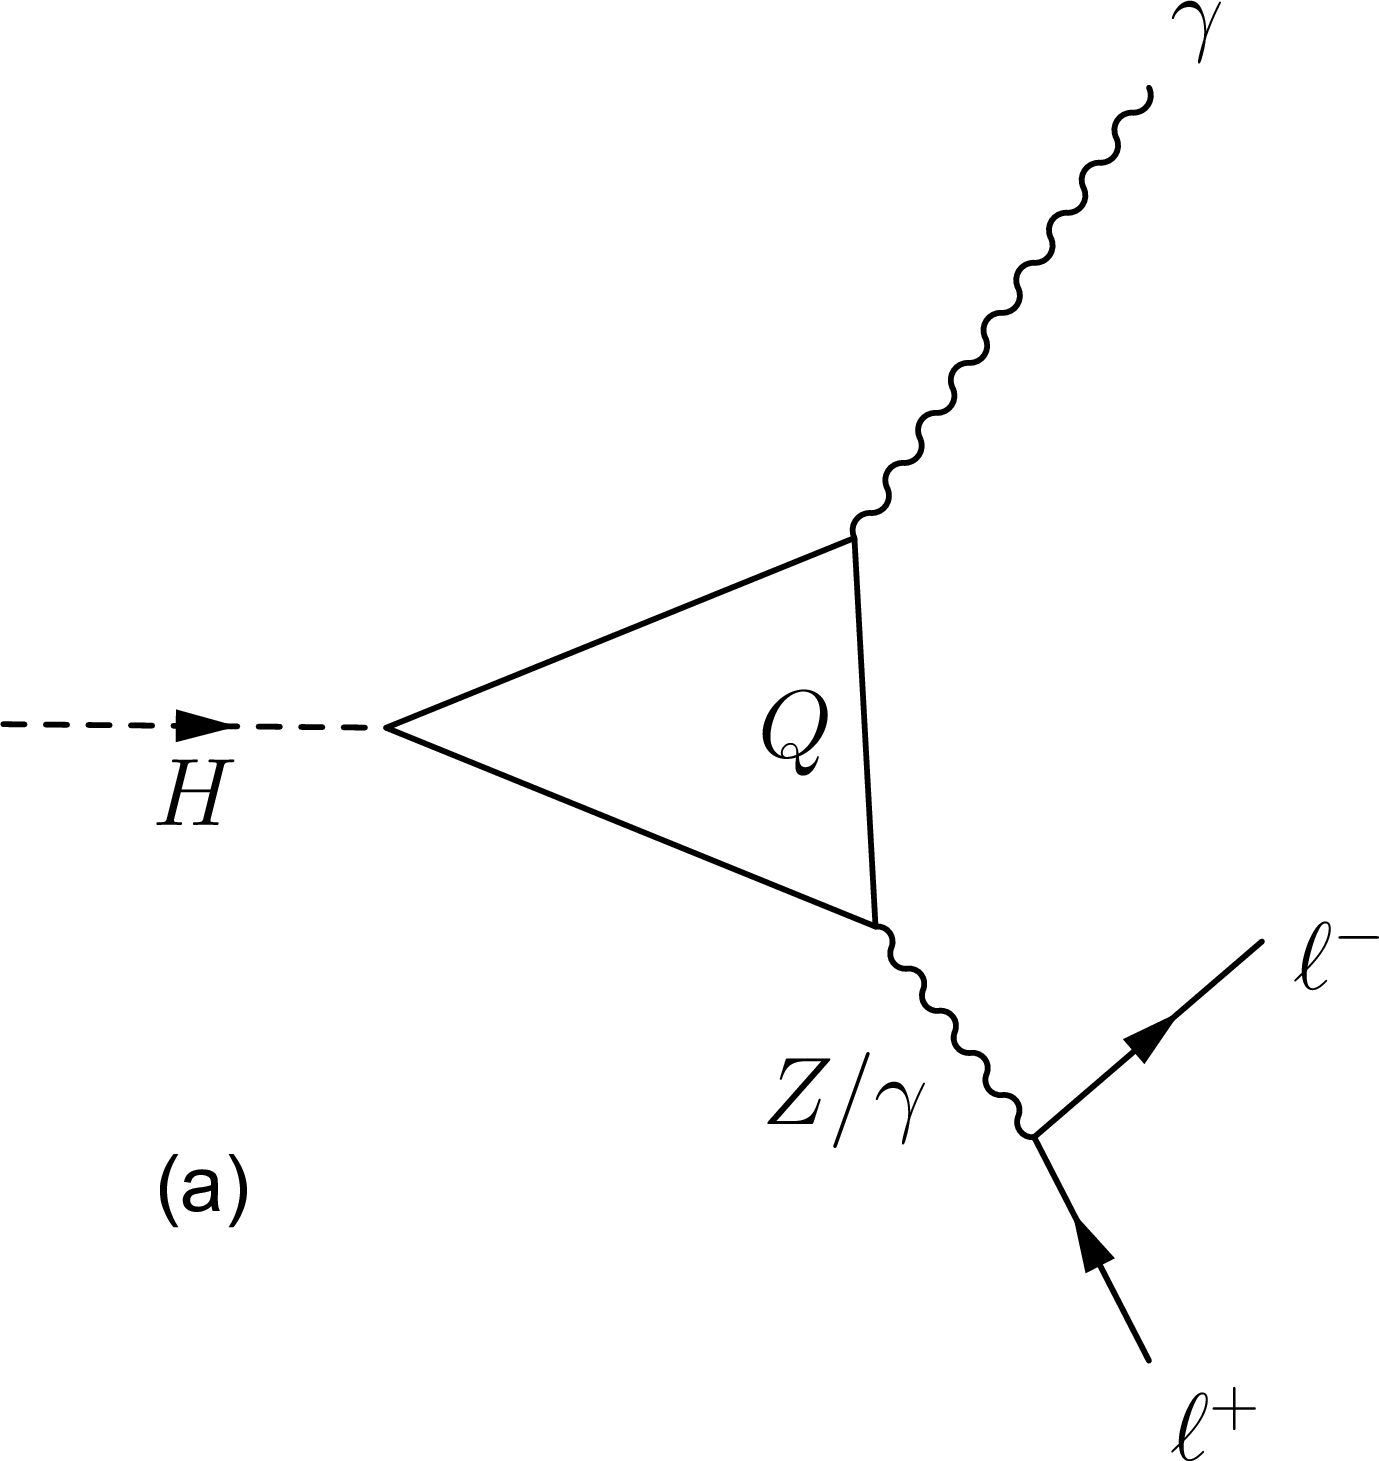
Figure 1-a:
Diagrams contributing to $\mathrm{H} \to \ell \ell \gamma $. The contributions from diagrams (a), (b), and (c) dominate. The final-state radiation of $\mathrm{H} \to \mu \mu $ decay, shown in diagram (d), is important at high dilepton invariant mass. Higher order contributions from diagrams (e), (f) and (g) are negligible. |
png pdf |
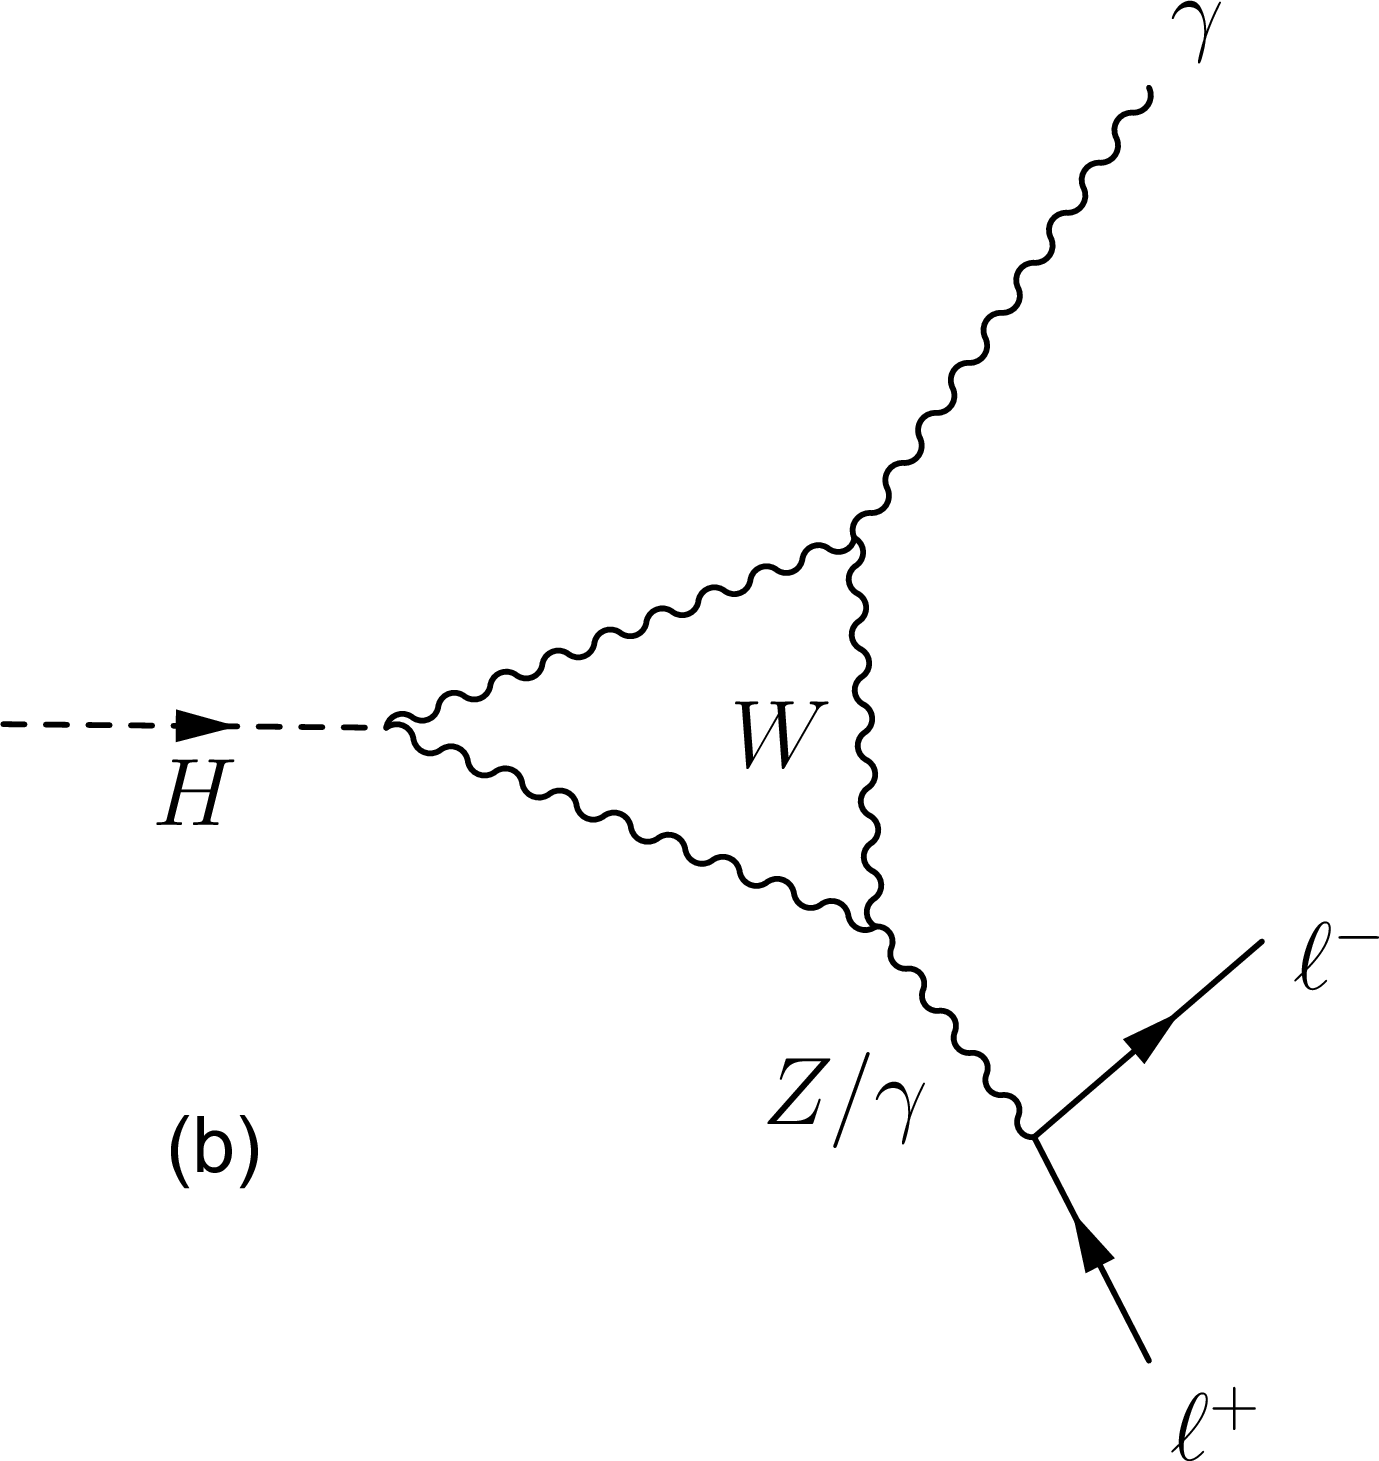
Figure 1-b:
Diagrams contributing to $\mathrm{H} \to \ell \ell \gamma $. The contributions from diagrams (a), (b), and (c) dominate. The final-state radiation of $\mathrm{H} \to \mu \mu $ decay, shown in diagram (d), is important at high dilepton invariant mass. Higher order contributions from diagrams (e), (f) and (g) are negligible. |
png pdf |
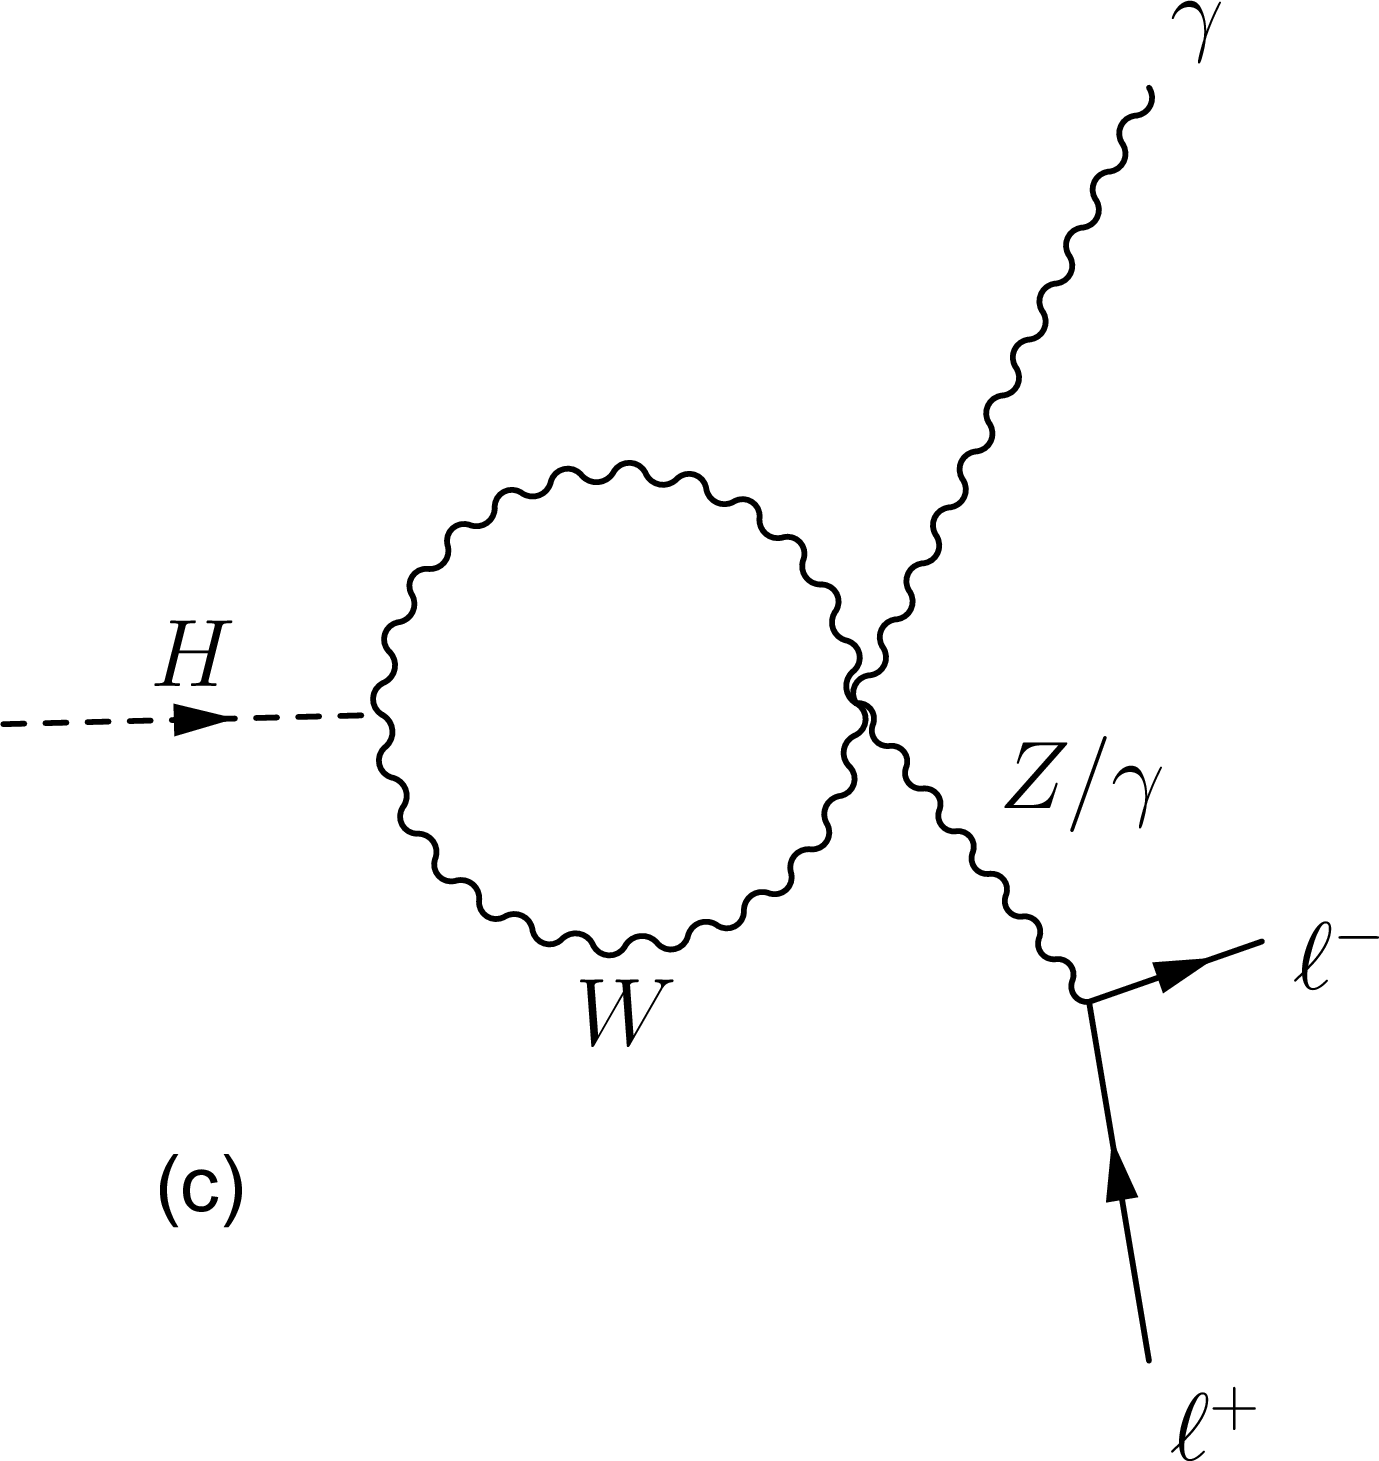
Figure 1-c:
Diagrams contributing to $\mathrm{H} \to \ell \ell \gamma $. The contributions from diagrams (a), (b), and (c) dominate. The final-state radiation of $\mathrm{H} \to \mu \mu $ decay, shown in diagram (d), is important at high dilepton invariant mass. Higher order contributions from diagrams (e), (f) and (g) are negligible. |
png pdf |
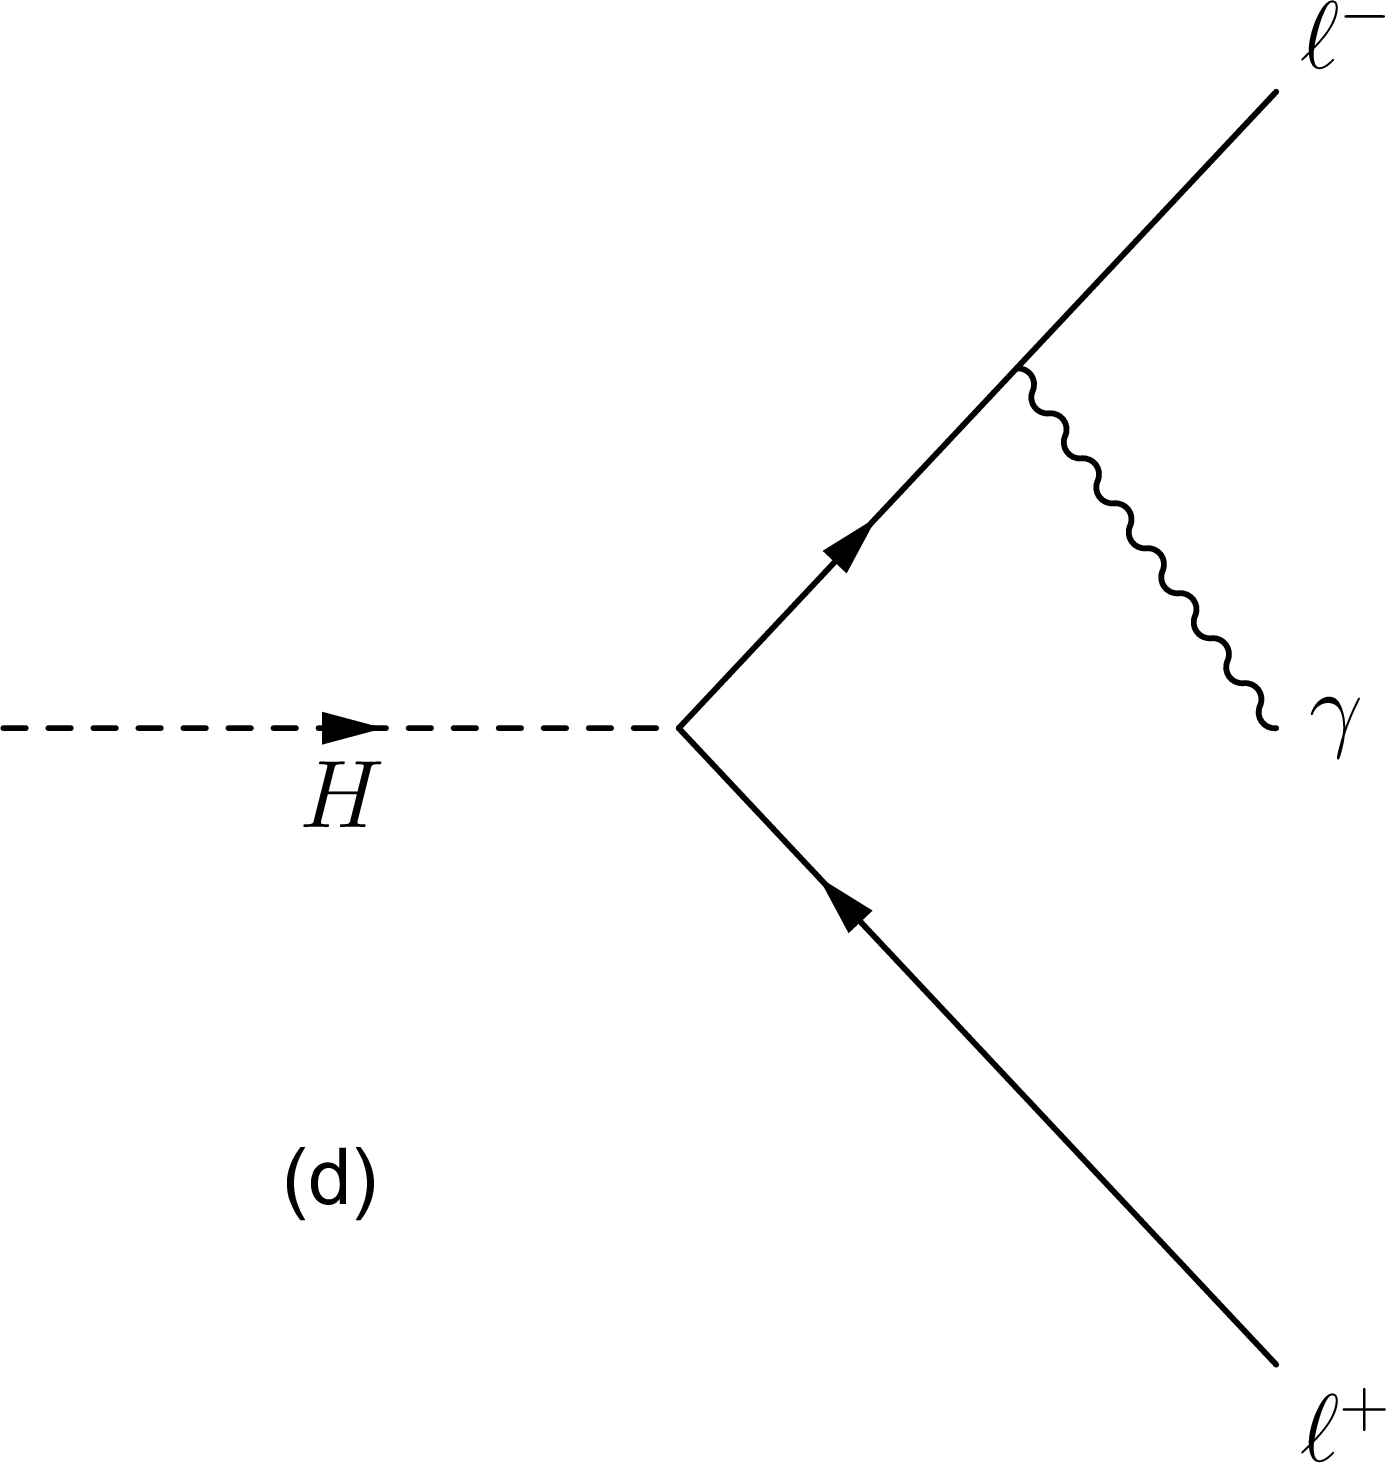
Figure 1-d:
Diagrams contributing to $\mathrm{H} \to \ell \ell \gamma $. The contributions from diagrams (a), (b), and (c) dominate. The final-state radiation of $\mathrm{H} \to \mu \mu $ decay, shown in diagram (d), is important at high dilepton invariant mass. Higher order contributions from diagrams (e), (f) and (g) are negligible. |

png pdf |
Figure 1-e:
Diagrams contributing to $\mathrm{H} \to \ell \ell \gamma $. The contributions from diagrams (a), (b), and (c) dominate. The final-state radiation of $\mathrm{H} \to \mu \mu $ decay, shown in diagram (d), is important at high dilepton invariant mass. Higher order contributions from diagrams (e), (f) and (g) are negligible. |
png pdf |
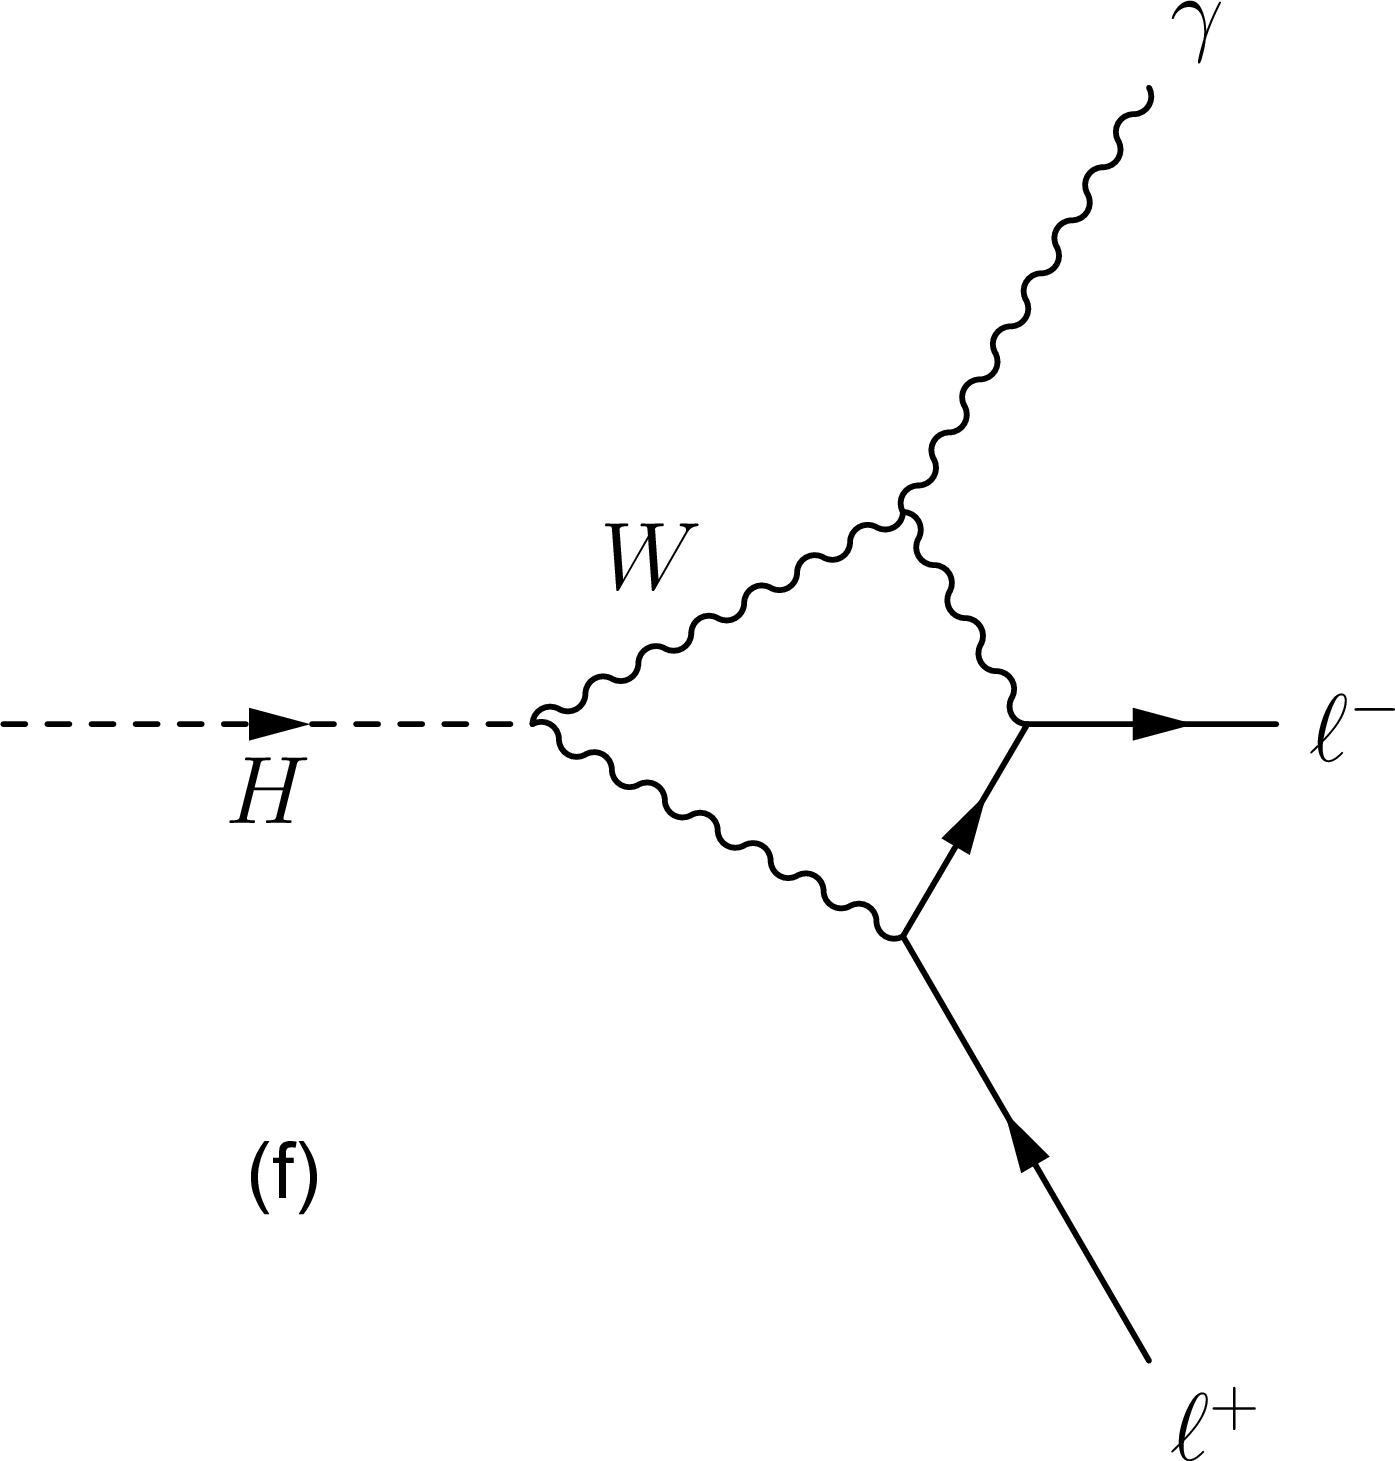
Figure 1-f:
Diagrams contributing to $\mathrm{H} \to \ell \ell \gamma $. The contributions from diagrams (a), (b), and (c) dominate. The final-state radiation of $\mathrm{H} \to \mu \mu $ decay, shown in diagram (d), is important at high dilepton invariant mass. Higher order contributions from diagrams (e), (f) and (g) are negligible. |

png pdf |
Figure 1-g:
Diagrams contributing to $\mathrm{H} \to \ell \ell \gamma $. The contributions from diagrams (a), (b), and (c) dominate. The final-state radiation of $\mathrm{H} \to \mu \mu $ decay, shown in diagram (d), is important at high dilepton invariant mass. Higher order contributions from diagrams (e), (f) and (g) are negligible. |
png pdf |
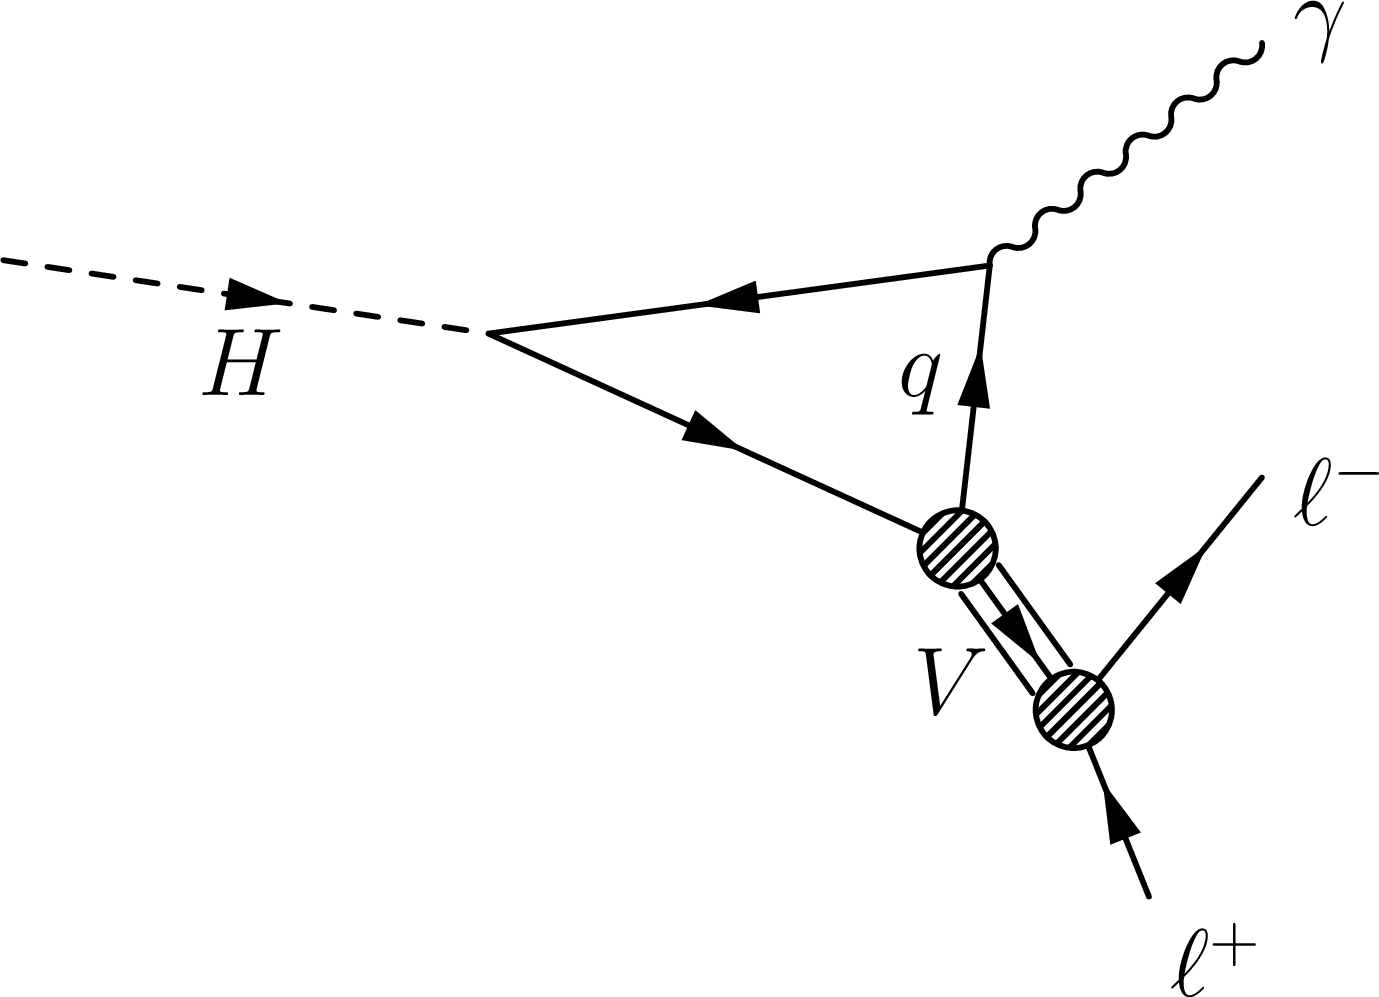
Figure 2-a:
Diagrams contributing to $\mathrm{H} \to \mathrm{V}\gamma \to \ell \ell \gamma $ decay. |
png pdf |
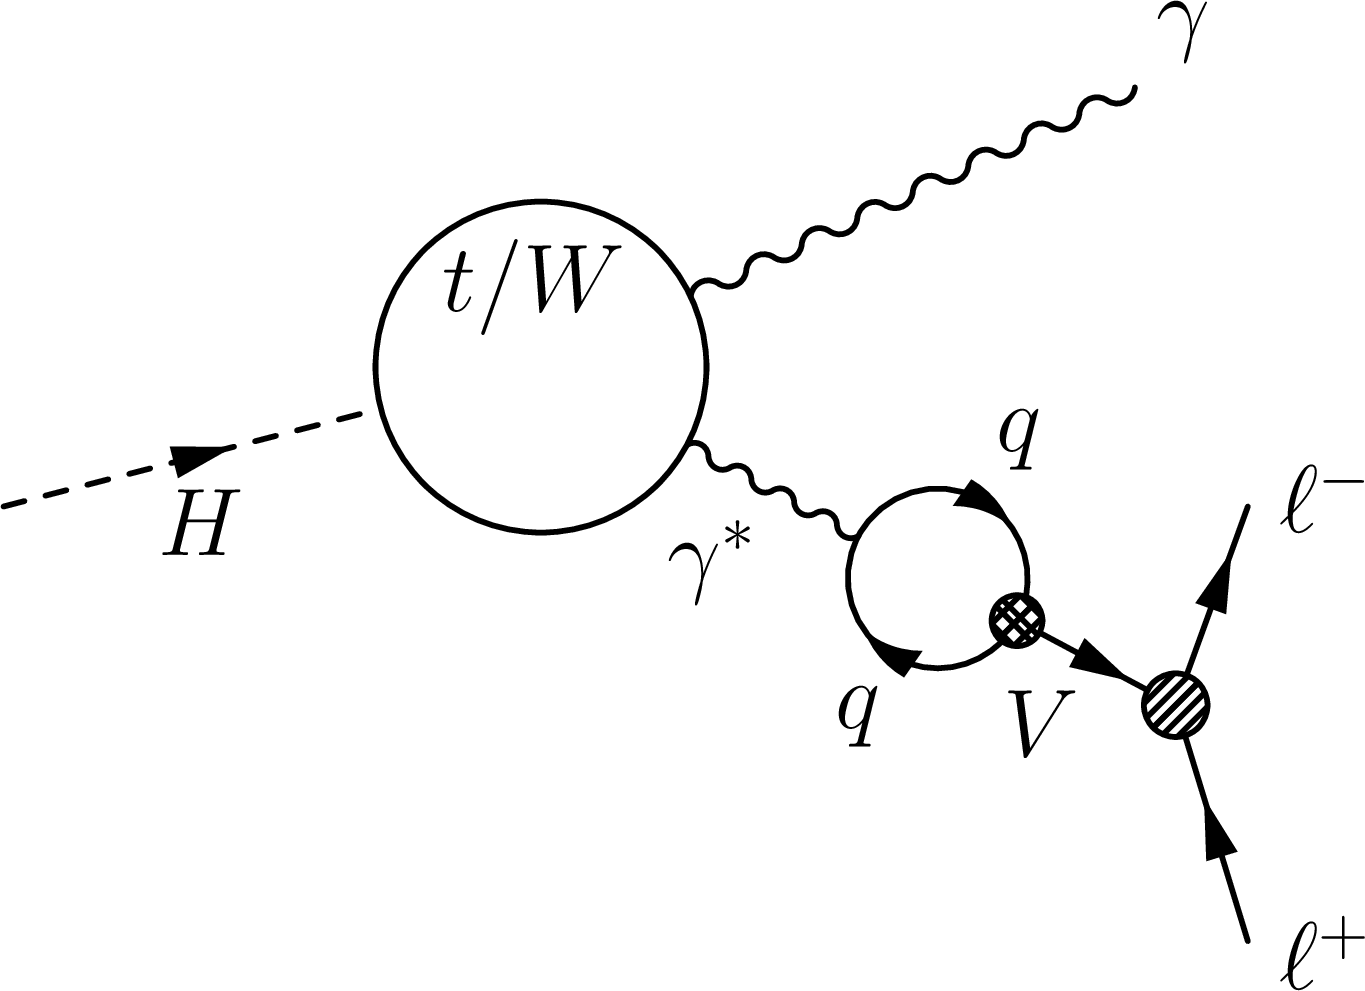
Figure 2-b:
Diagrams contributing to $\mathrm{H} \to \mathrm{V}\gamma \to \ell \ell \gamma $ decay. |
png pdf |
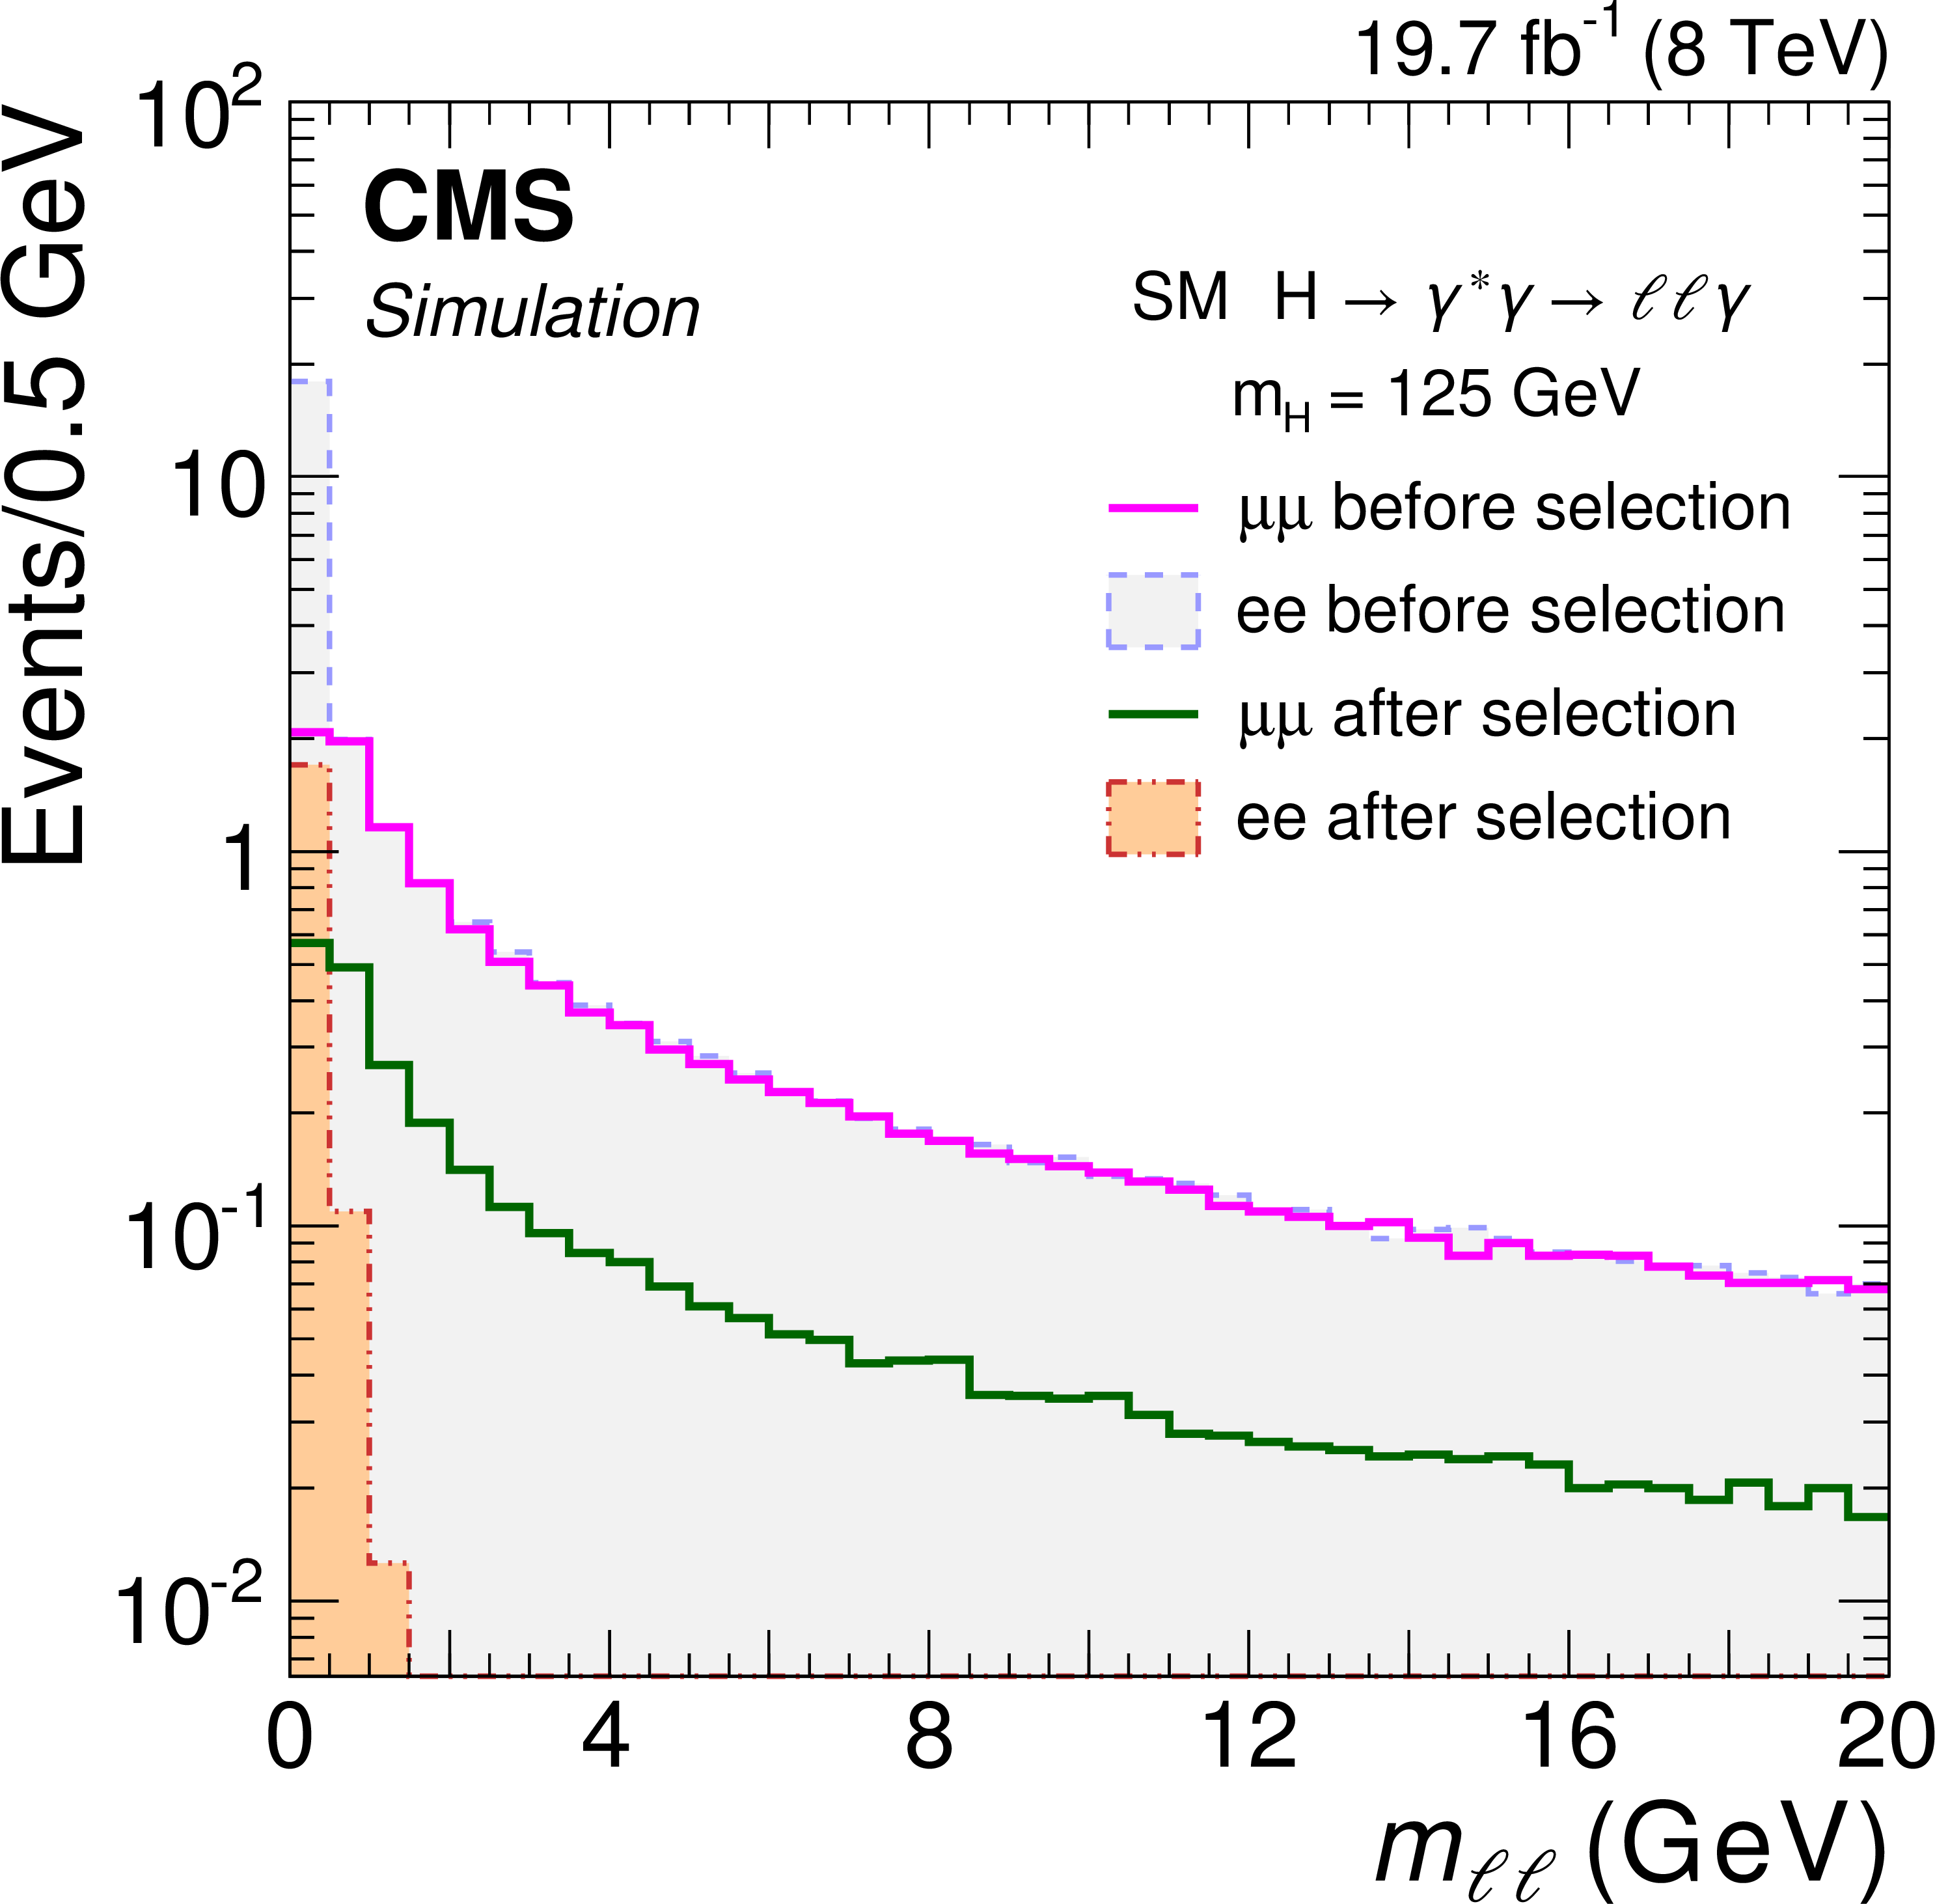
Figure 3:
The invariant mass of the dilepton system in signal simulation for $m_\mathrm{H} =$ 125 GeV. Distributions are shown for muon and electron channels, before and after selection. The invariant mass before selection is obtained from the leptons at the generator level, while after selection the reconstructed invariant mass is used. |

png pdf |
Figure 4-a:
The $m_{\mu \mu \gamma }$ (a) and $m_{\mathrm{e} \mathrm{e} \gamma }$ (right) spectra for 8 TeV data (points with error bars), together with the result of a background-only fit to the data. The 1$\sigma $ and 2$\sigma $ uncertainty bands represent the uncertainty in the parameters of the fitted function. The expected contribution from the SM Higgs boson signal with $m_\mathrm{H} =$ 125 GeV, scaled up by a factor of 10, is shown as a histogram. |

png pdf |
Figure 4-b:
The $m_{\mu \mu \gamma }$ (a) and $m_{\mathrm{e} \mathrm{e} \gamma }$ (right) spectra for 8 TeV data (points with error bars), together with the result of a background-only fit to the data. The 1$\sigma $ and 2$\sigma $ uncertainty bands represent the uncertainty in the parameters of the fitted function. The expected contribution from the SM Higgs boson signal with $m_\mathrm{H} =$ 125 GeV, scaled up by a factor of 10, is shown as a histogram. |

png pdf |
Figure 5:
The $m_{\mu \mu \gamma }$ distribution for events with 2.9 $< m_{\mu \mu } <$ 3.3 GeV for 8 TeV data (points with error bars), together with the result of a background-only fit to the data. The 1$\sigma $ and 2$\sigma $ uncertainty bands represent the uncertainty in the parameters of the fitted function. The expected contribution from the $\mathrm{H} \to ({\mathrm{J}/\psi } )\gamma \to \mu \mu \gamma $ process of the SM H with $m_\mathrm{H} =$ 125 GeV, scaled up by a factor of 500, is shown as a histogram. |
png pdf |
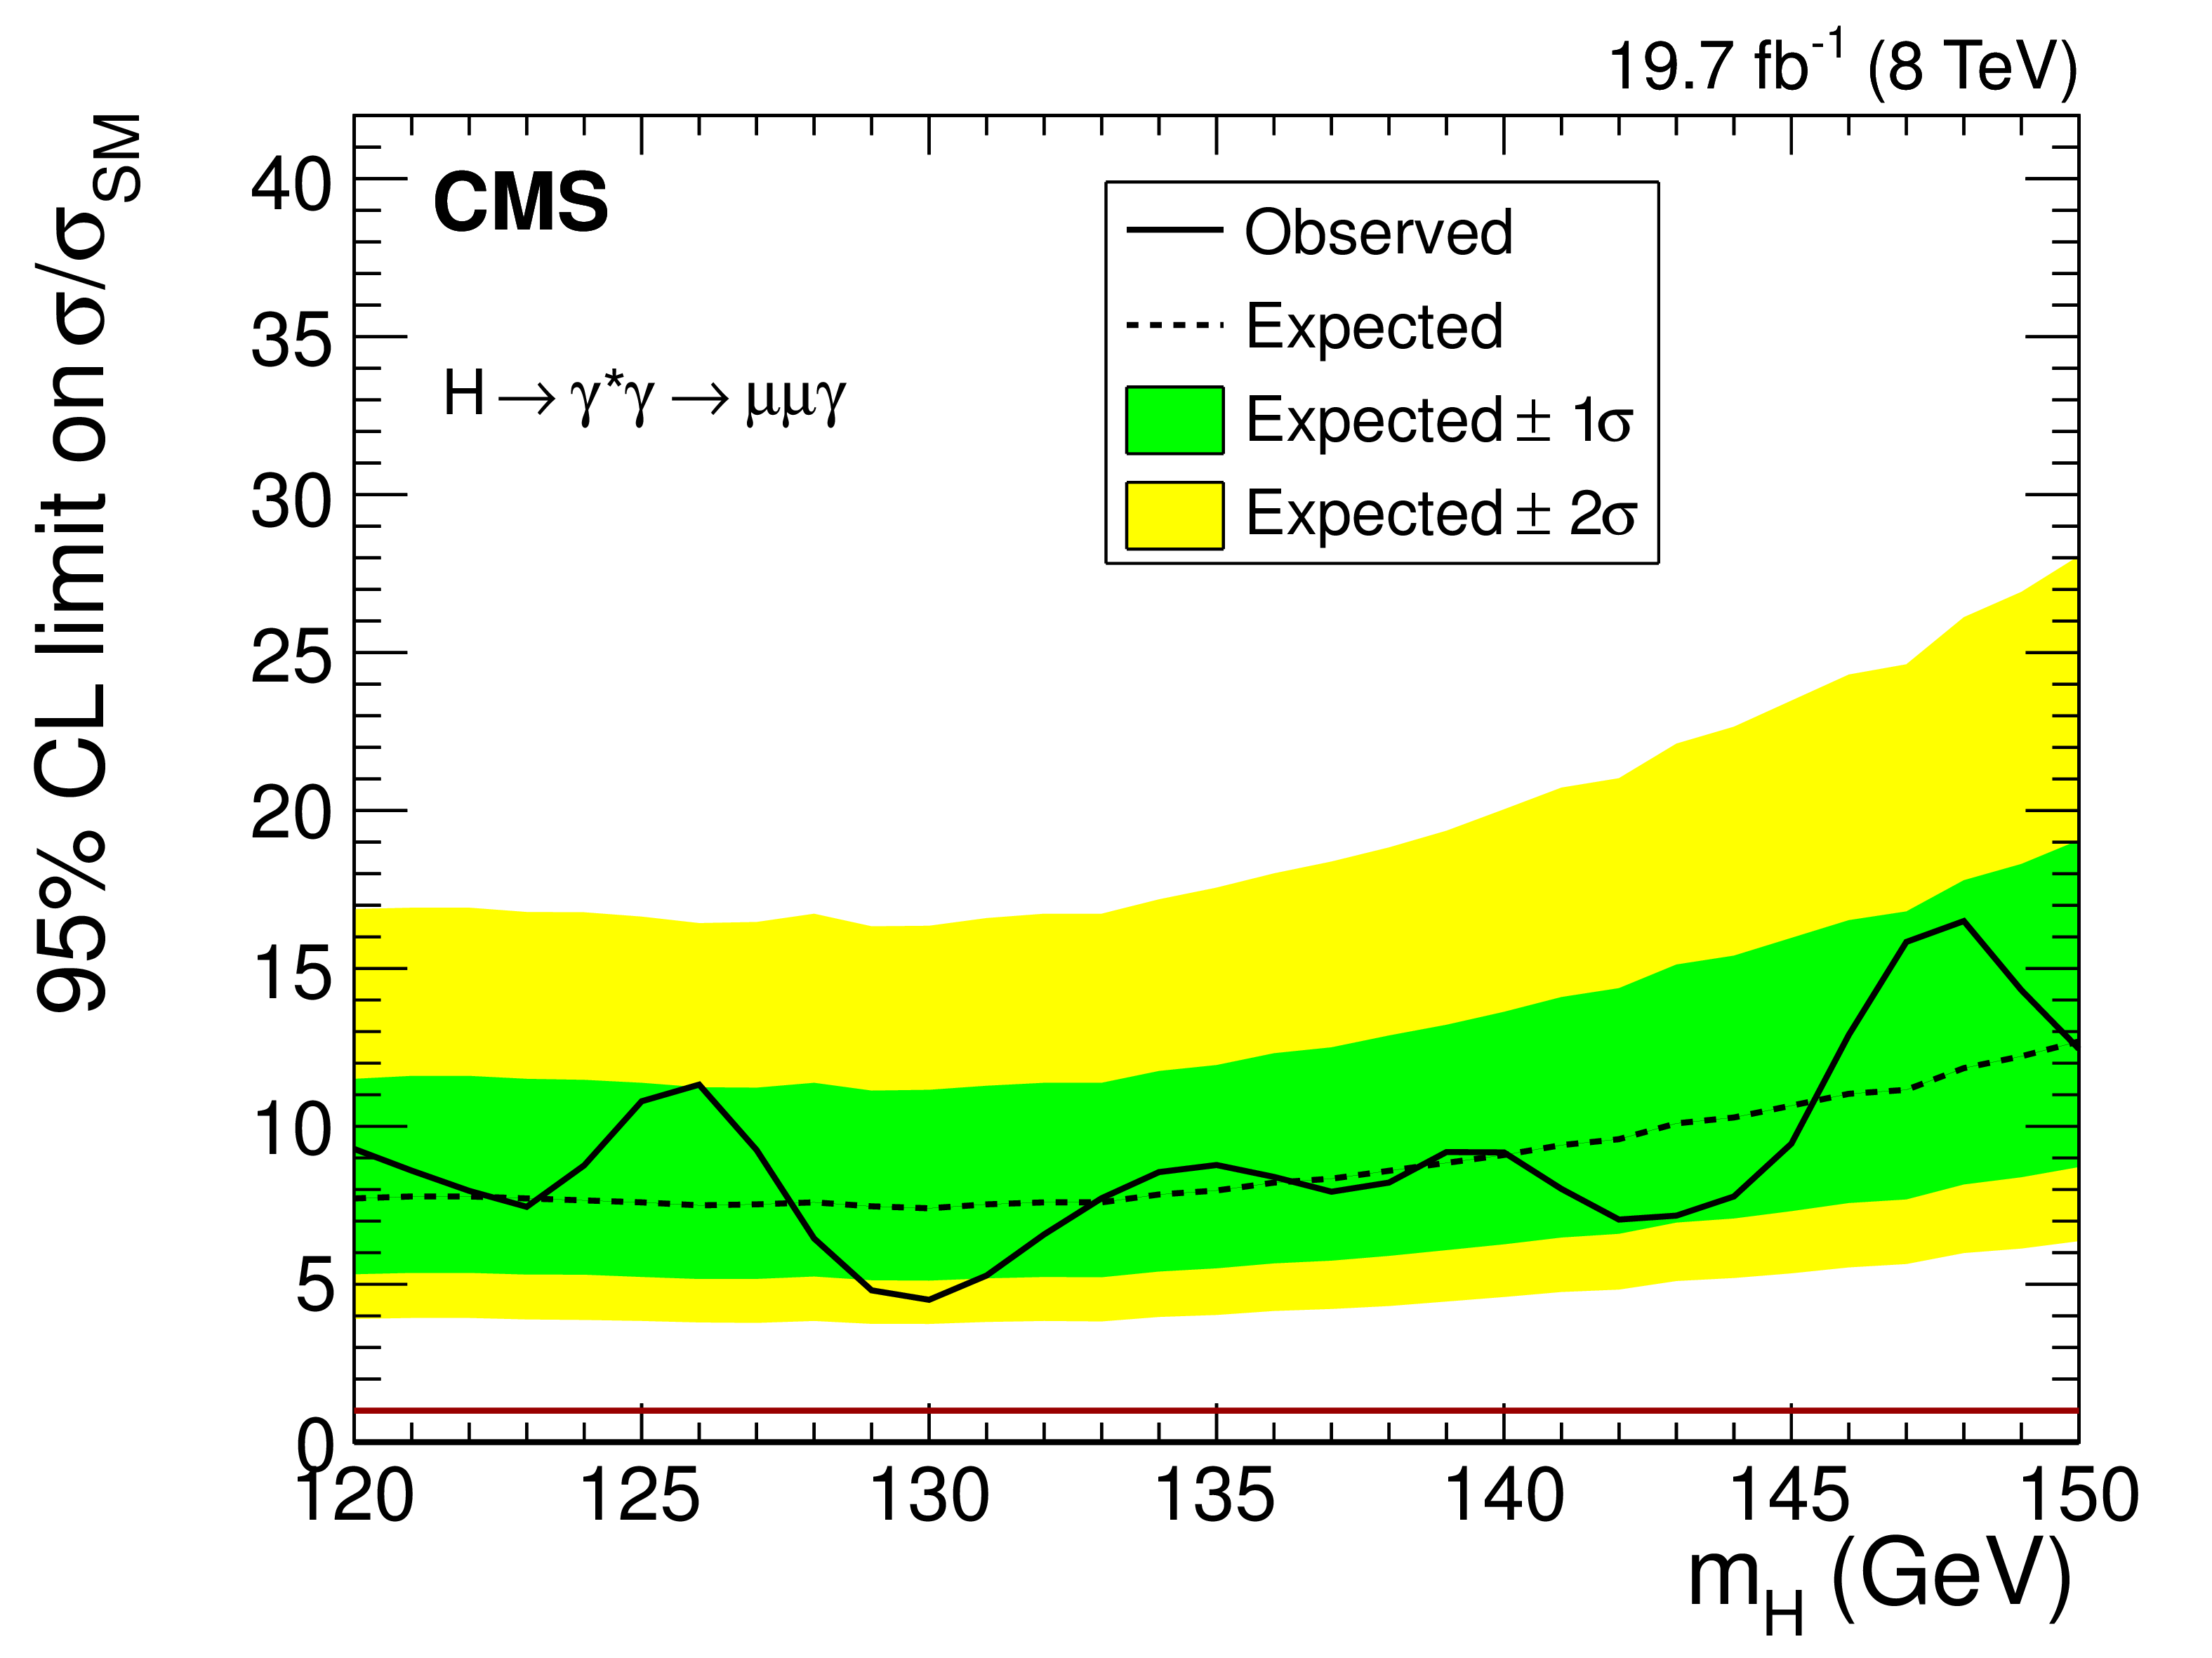
Figure 6-a:
The 95% CL exclusion limit, as a function of the mass hypothesis, $m_\mathrm{H} $, on $\sigma /\sigma _{\text{SM}}$, the cross section times the branching fraction of a Higgs boson decaying into a photon and a lepton pair with $m_{\ell \ell } <$ 20 GeV, divided by the SM value. (a) muon, (b) electron channels, (c) statistical combination of the results in the two channels |
png pdf |
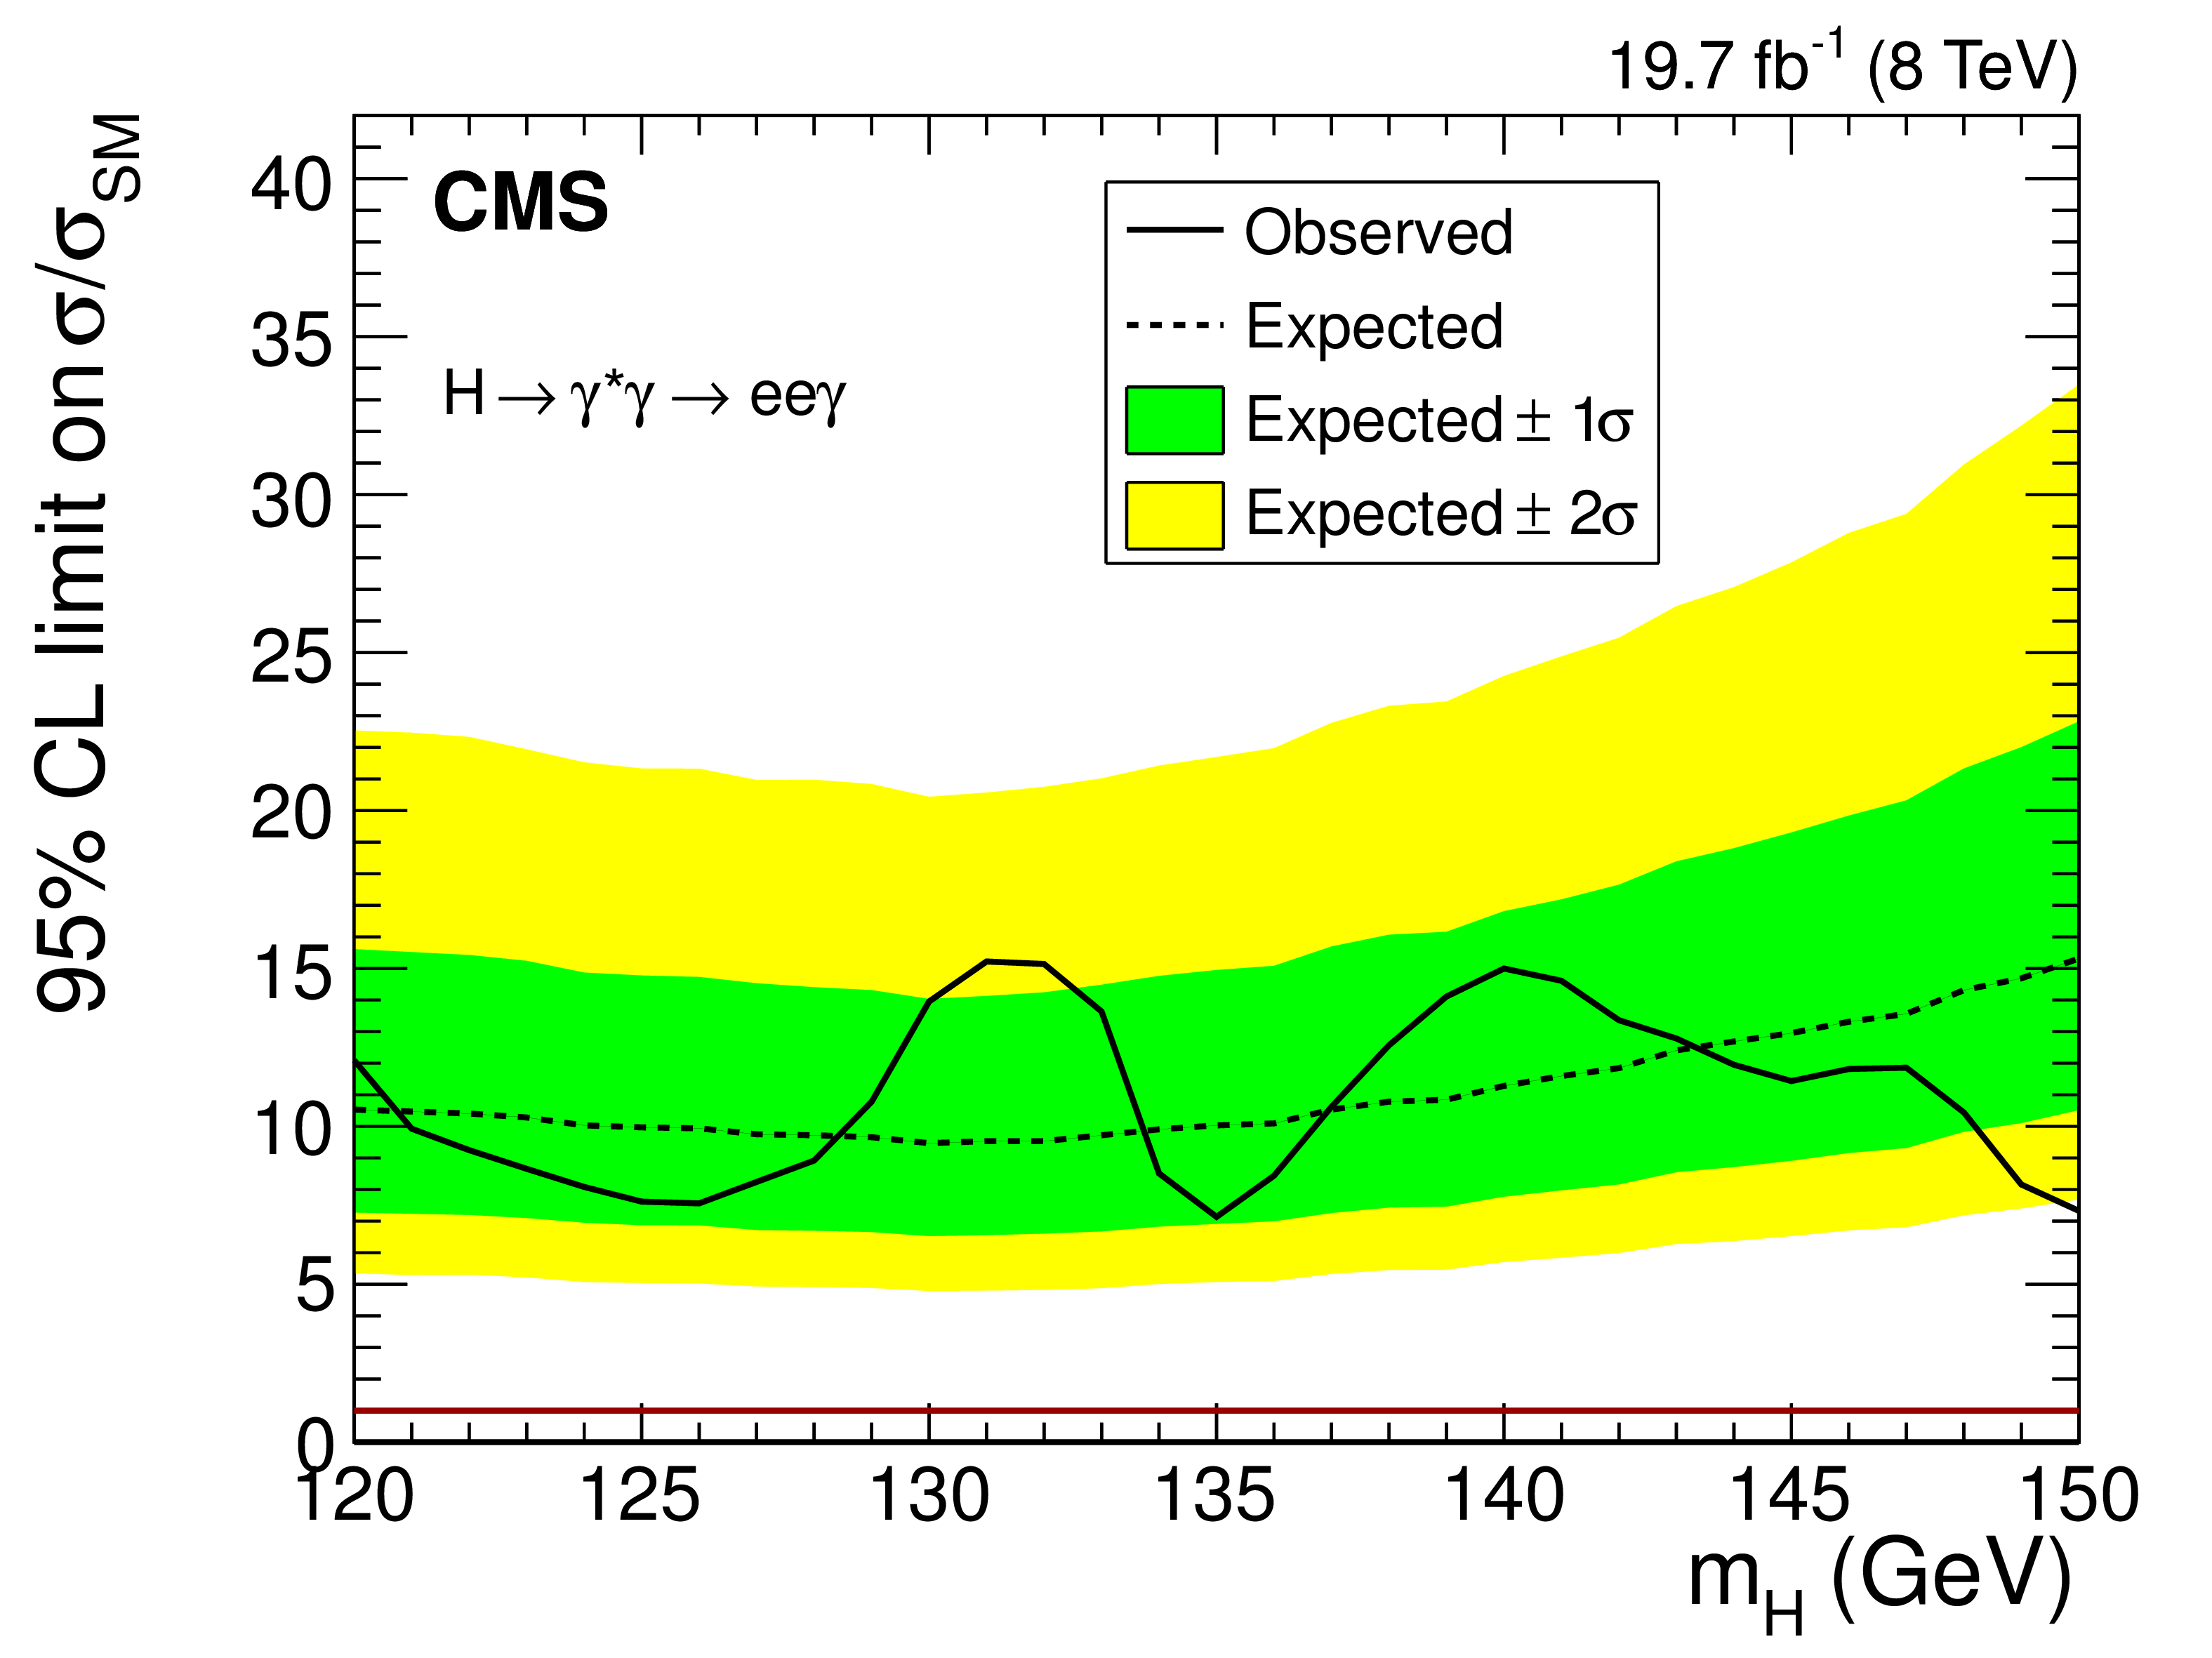
Figure 6-b:
The 95% CL exclusion limit, as a function of the mass hypothesis, $m_\mathrm{H} $, on $\sigma /\sigma _{\text{SM}}$, the cross section times the branching fraction of a Higgs boson decaying into a photon and a lepton pair with $m_{\ell \ell } <$ 20 GeV, divided by the SM value. (a) muon, (b) electron channels, (c) statistical combination of the results in the two channels |
png pdf |
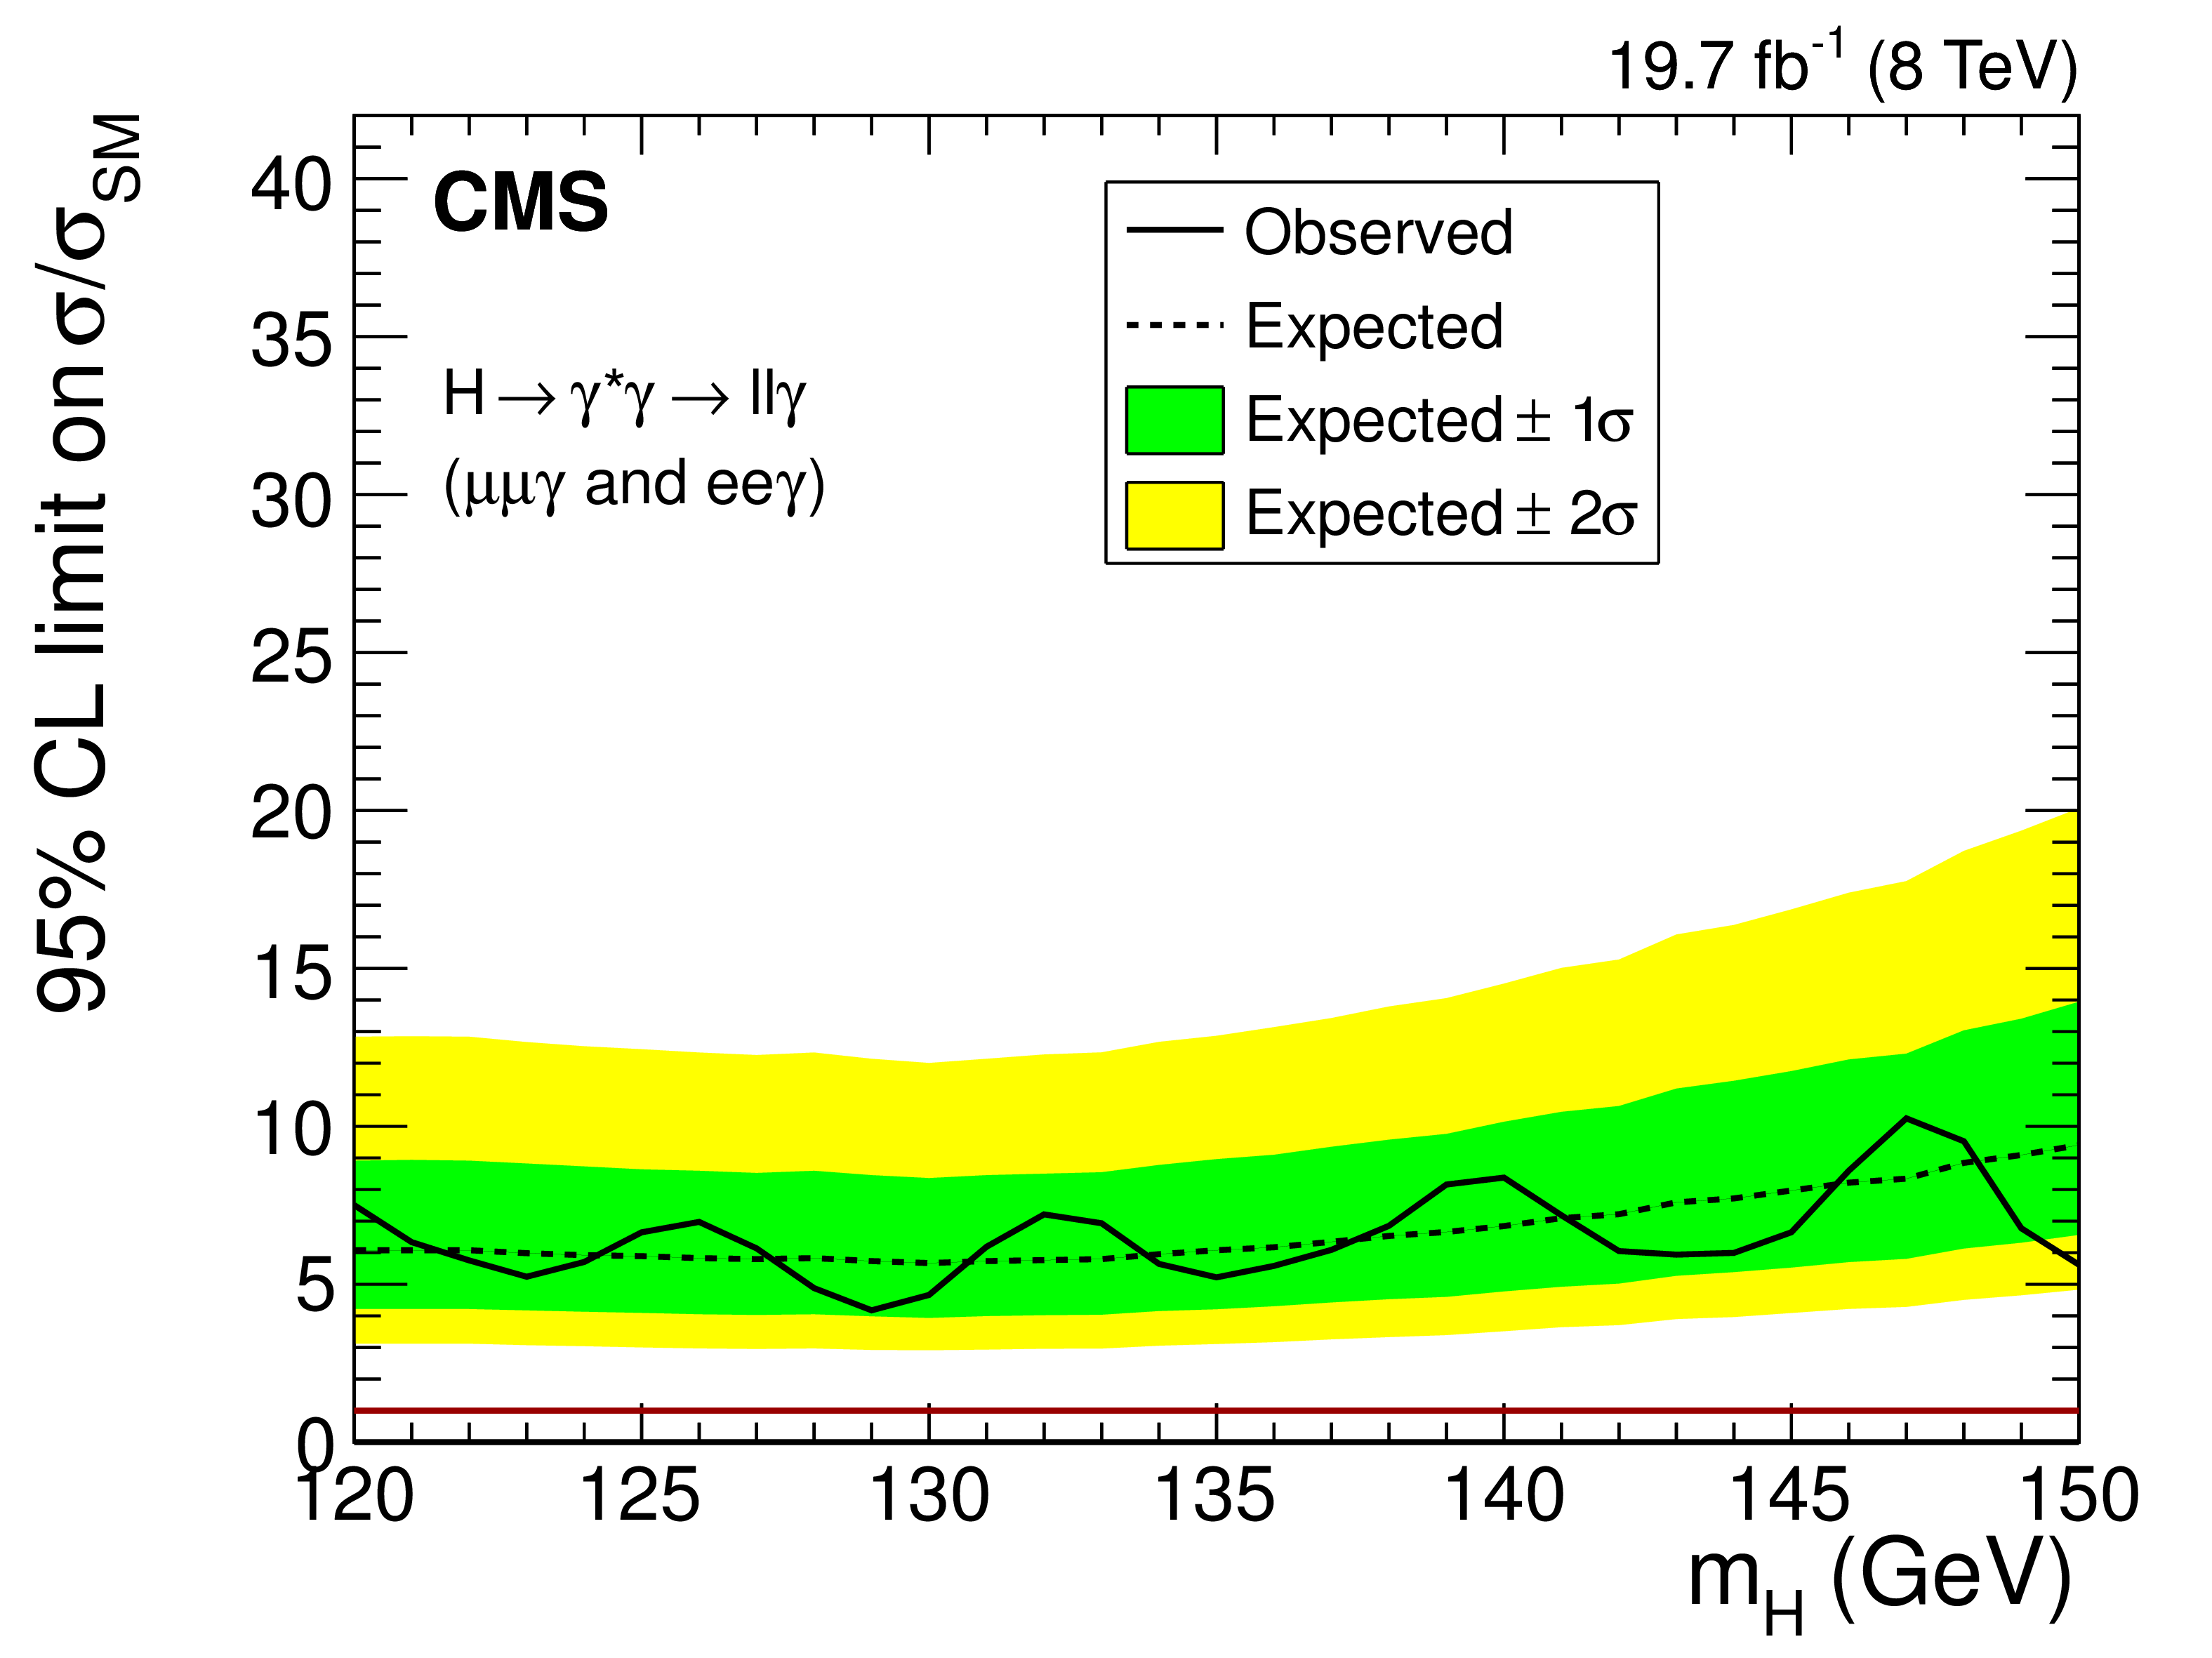
Figure 6-c:
The 95% CL exclusion limit, as a function of the mass hypothesis, $m_\mathrm{H} $, on $\sigma /\sigma _{\text{SM}}$, the cross section times the branching fraction of a Higgs boson decaying into a photon and a lepton pair with $m_{\ell \ell } <$ 20 GeV, divided by the SM value. (a) muon, (b) electron channels, (c) statistical combination of the results in the two channels |
png pdf |
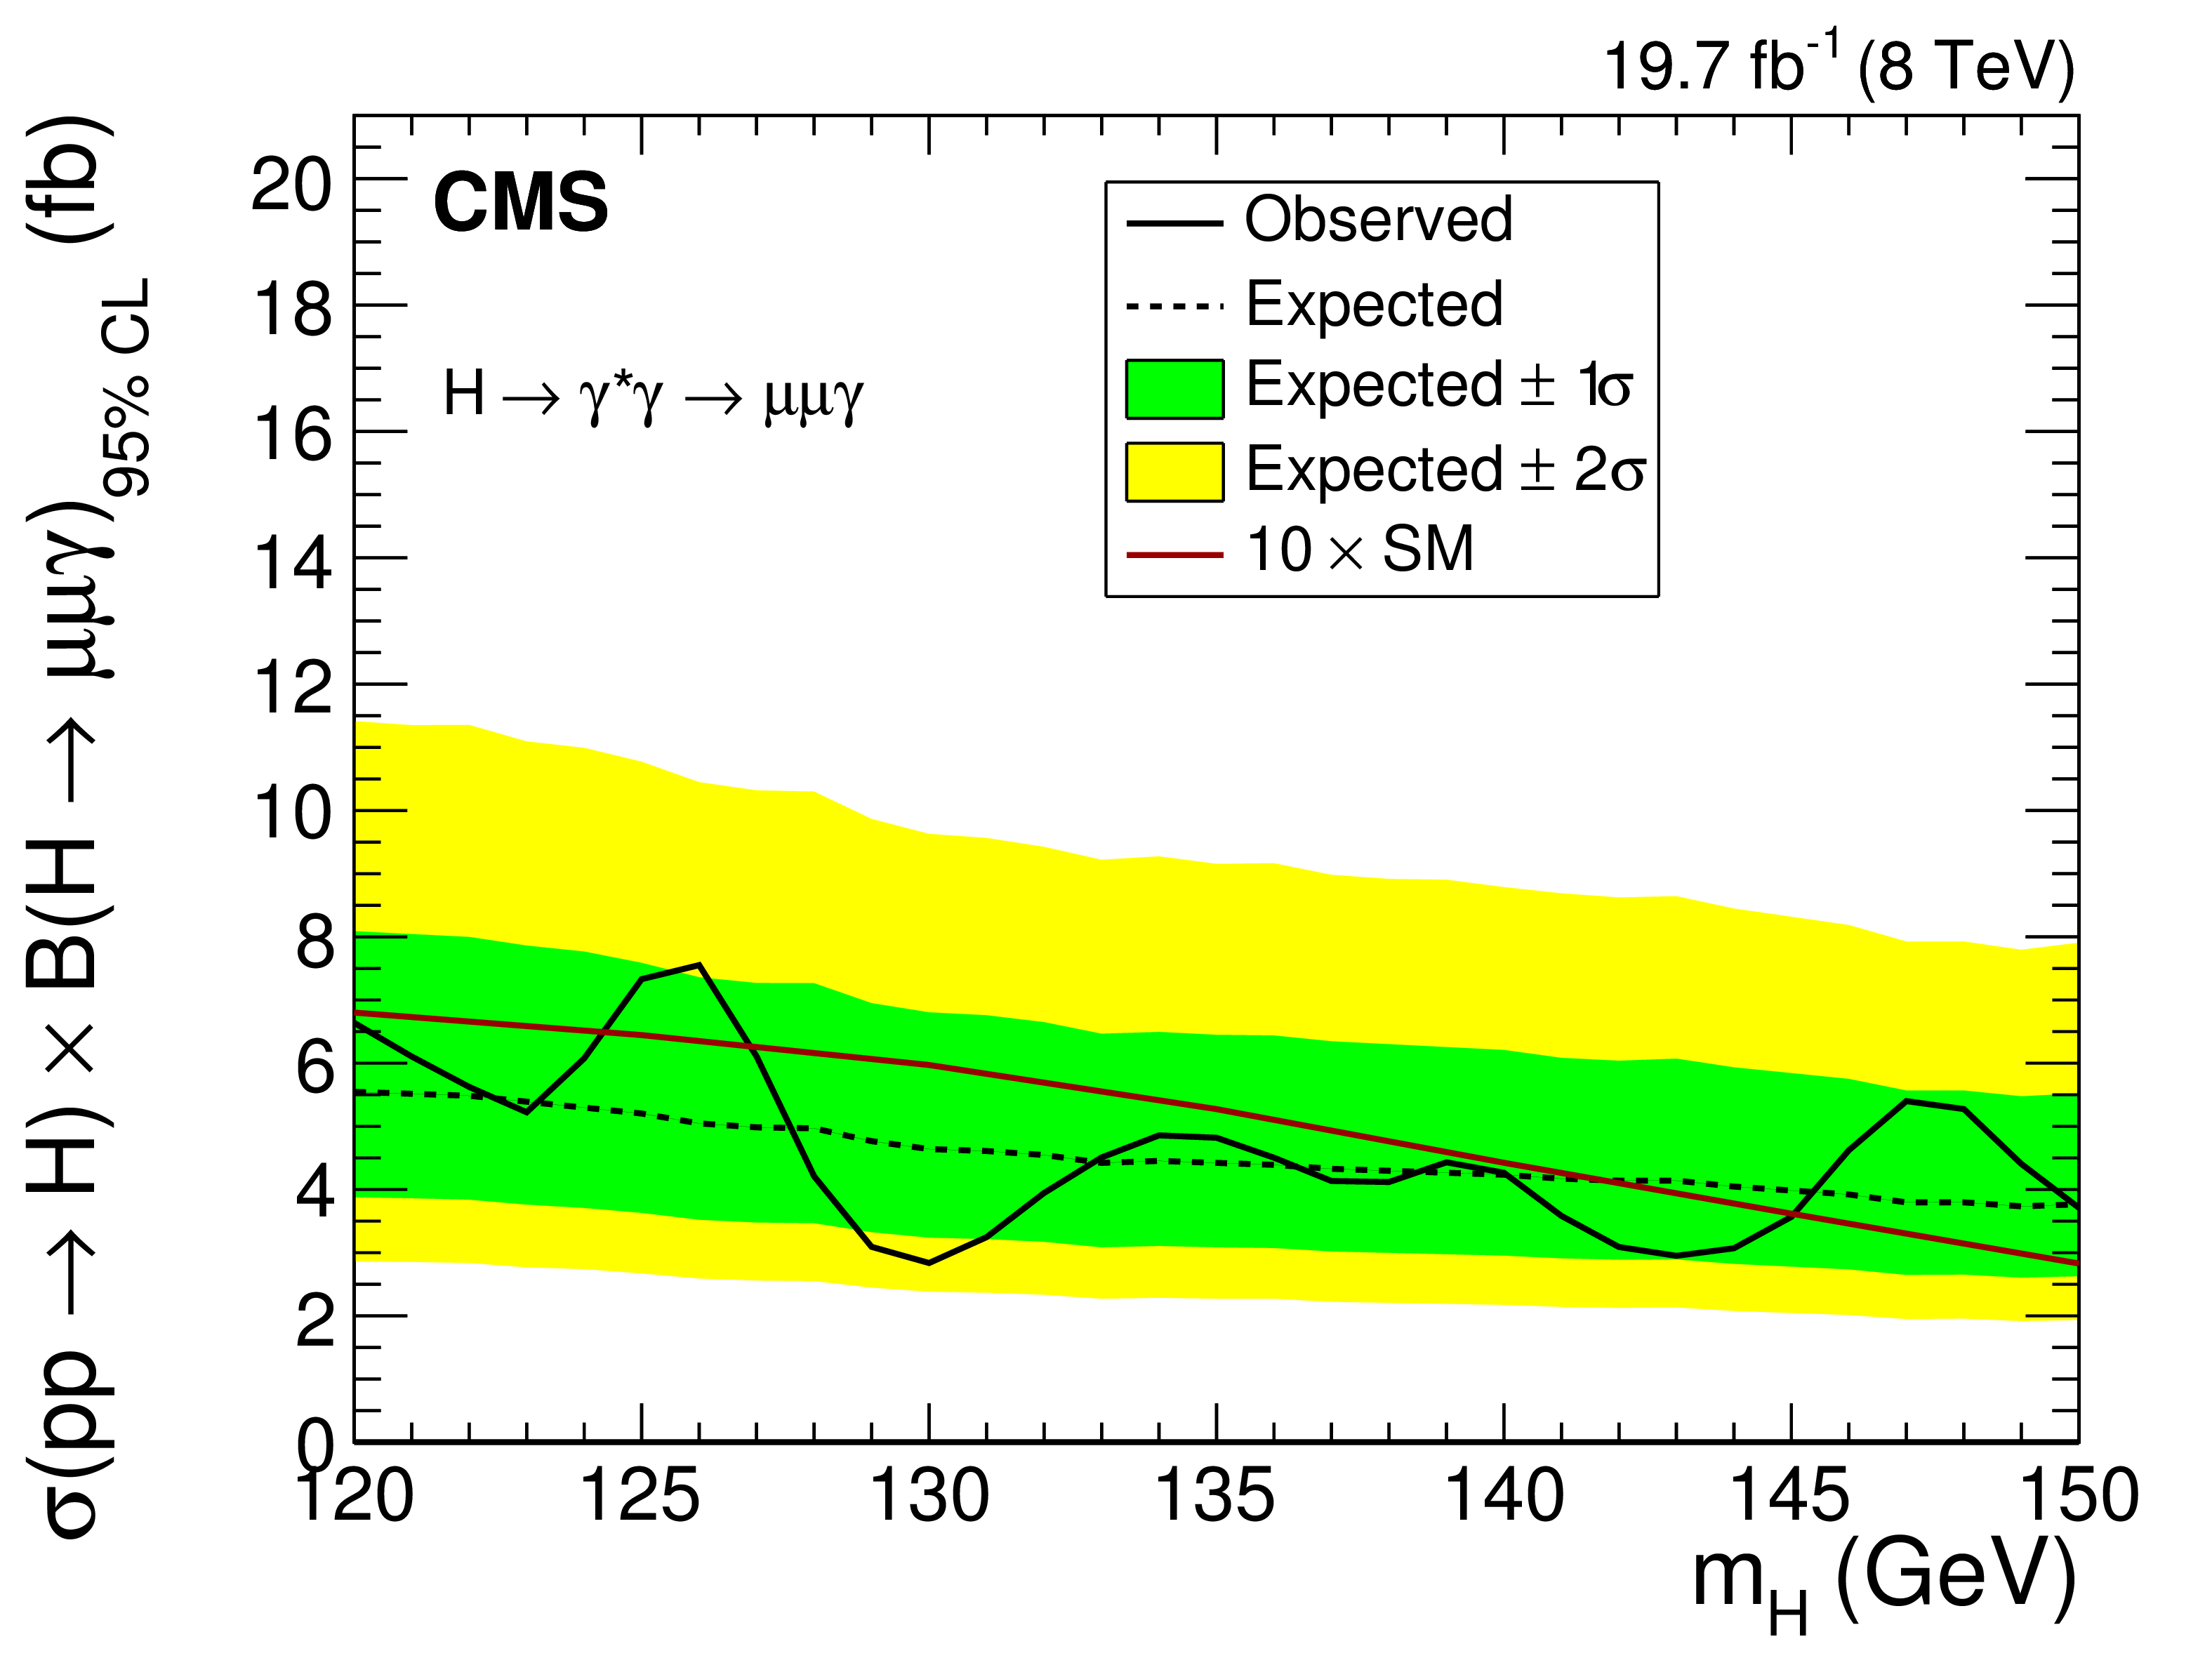
Figure 7:
The 95% CL exclusion limit on $\sigma ( \mathrm{pp} \to \mathrm{H} ) \mathcal {B}(\mathrm{H} \to \mu \mu \gamma )$, with $m_{\mu \mu } <$ 20 GeV, for a Higgs-like particle, as a function of the mass hypothesis, $m_\mathrm{H} $. |
| Tables | |
png pdf |
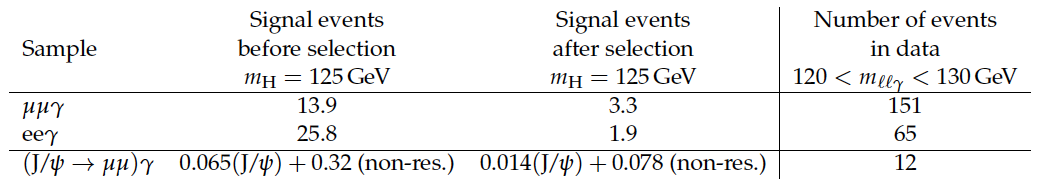
Table 1:
The expected signal yield and the number of events in data, for an integrated luminosity of 19.7 fb$^{-1}$. Signal events are presented before and after applying the full selection criteria described in the text. In the $( \mathrm{J}/\psi )\gamma $ sub-category only the $ \mathrm{J}/\psi \to \mu \mu $ decay is considered, and the signal yield is a sum of two contributions: $ \mathrm{H} \to ( \mathrm{J}/\psi )\gamma \to \mu \mu \gamma $ and $ \mathrm{H} \to \gamma ^*\gamma \to \mu \mu \gamma $, where the dimuon mass distribution is non-resonant. |
png pdf |
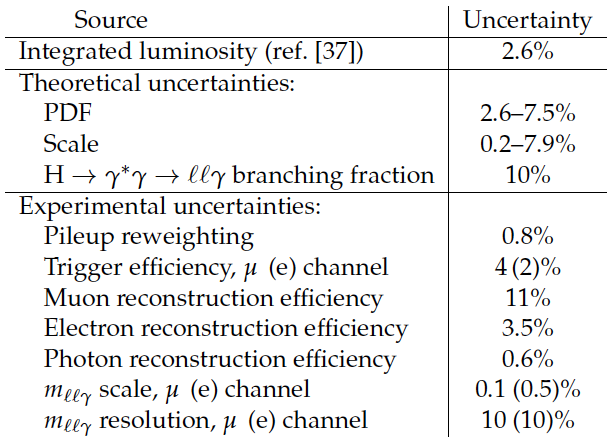
Table 2:
Systematic uncertainties affecting the signal. |
| Summary |
| A search for a Higgs boson decay $\mathrm{H} \to \gamma^* \gamma \to \ell \ell \gamma $ is presented. No excess above the background predictions has been found in the three-body invariant mass range 120 $< m_{\ell \ell \gamma} <$ 150 GeV. Limits on the Higgs boson production cross section times the $\mathrm{H} \to \gamma^* \gamma \to \ell \ell \gamma $ branching fraction divided by the SM values have been derived. The observed limit for $m_{\mathrm{H}} =$ 125 GeV is about 6.7 times the SM prediction. Limits at 95% CL on $\mathrm{ \sigma( pp \to H) \mathcal{B}(H \to \mu \mu \gamma)}$ for a narrow resonance are also obtained in the muon channel. The observed limit for $m_{\mathrm{H}} =$ 125 GeV is 7.3 fb. Events consistent with the $\mathrm{ J/\psi }$ in dimuon invariant mass are used to set a 95% CL limit on the branching fraction $\mathcal{B}(\mathrm{ H \to (J/\psi)\gamma}) < 1.5\, 10^{-3}$, that is, 540 times the SM prediction for $m_{\mathrm{H}} =$ 125 GeV. |
|
|
Compact Muon Solenoid LHC, CERN |
|

|

|

|

|

|