

Compact Muon Solenoid
LHC, CERN
| CMS-HIG-14-016 ; CERN-PH-EP-2015-195 | ||
| Measurement of differential cross sections for Higgs boson production in the diphoton decay channel in pp collisions at $\sqrt{s}= $ 8 TeV | ||
| CMS Collaboration | ||
| 29 August 2015 | ||
| Eur. Phys. J. C 76 (2016) 13 | ||
| Abstract: A measurement is presented of differential cross sections for the Higgs boson (H) production in pp collisions at $\sqrt{s}=$ 8 TeV. The analysis exploits the $\mathrm{H} \to \gamma \gamma $ decay in data corresponding to an integrated luminosity of 19.7 fb$^{-1}$ collected by the CMS experiment at the LHC. The cross section is measured as a function of the kinematic properties of the diphoton system and of the associated jets. Results corrected for detector effects are compared with predictions at next-to-leading order and next-to-next-to-leading order in perturbative quantum chromodynamics, as well as with predictions beyond the standard model.For isolated photons with pseudorapidities $ | \eta | < $ 2.5, and with the photon of largest and next-to-largest transverse momentum ($p_{\mathrm{T}}^{\gamma}$) divided by the diphoton mass $m_{\gamma\gamma}$ satisfying the respective conditions of $p_{\mathrm{T}}^{\gamma}/m_{\gamma\gamma}>$ 1/3 and $>$ 1/4, the total fiducial cross section is 32 $\pm$ 10 fb. | ||
| Links: e-print arXiv:1508.07819 [hep-ex] (PDF) ; CDS record ; inSPIRE record ; HepData record ; CADI line (restricted) ; | ||
| Figures | |
png pdf |
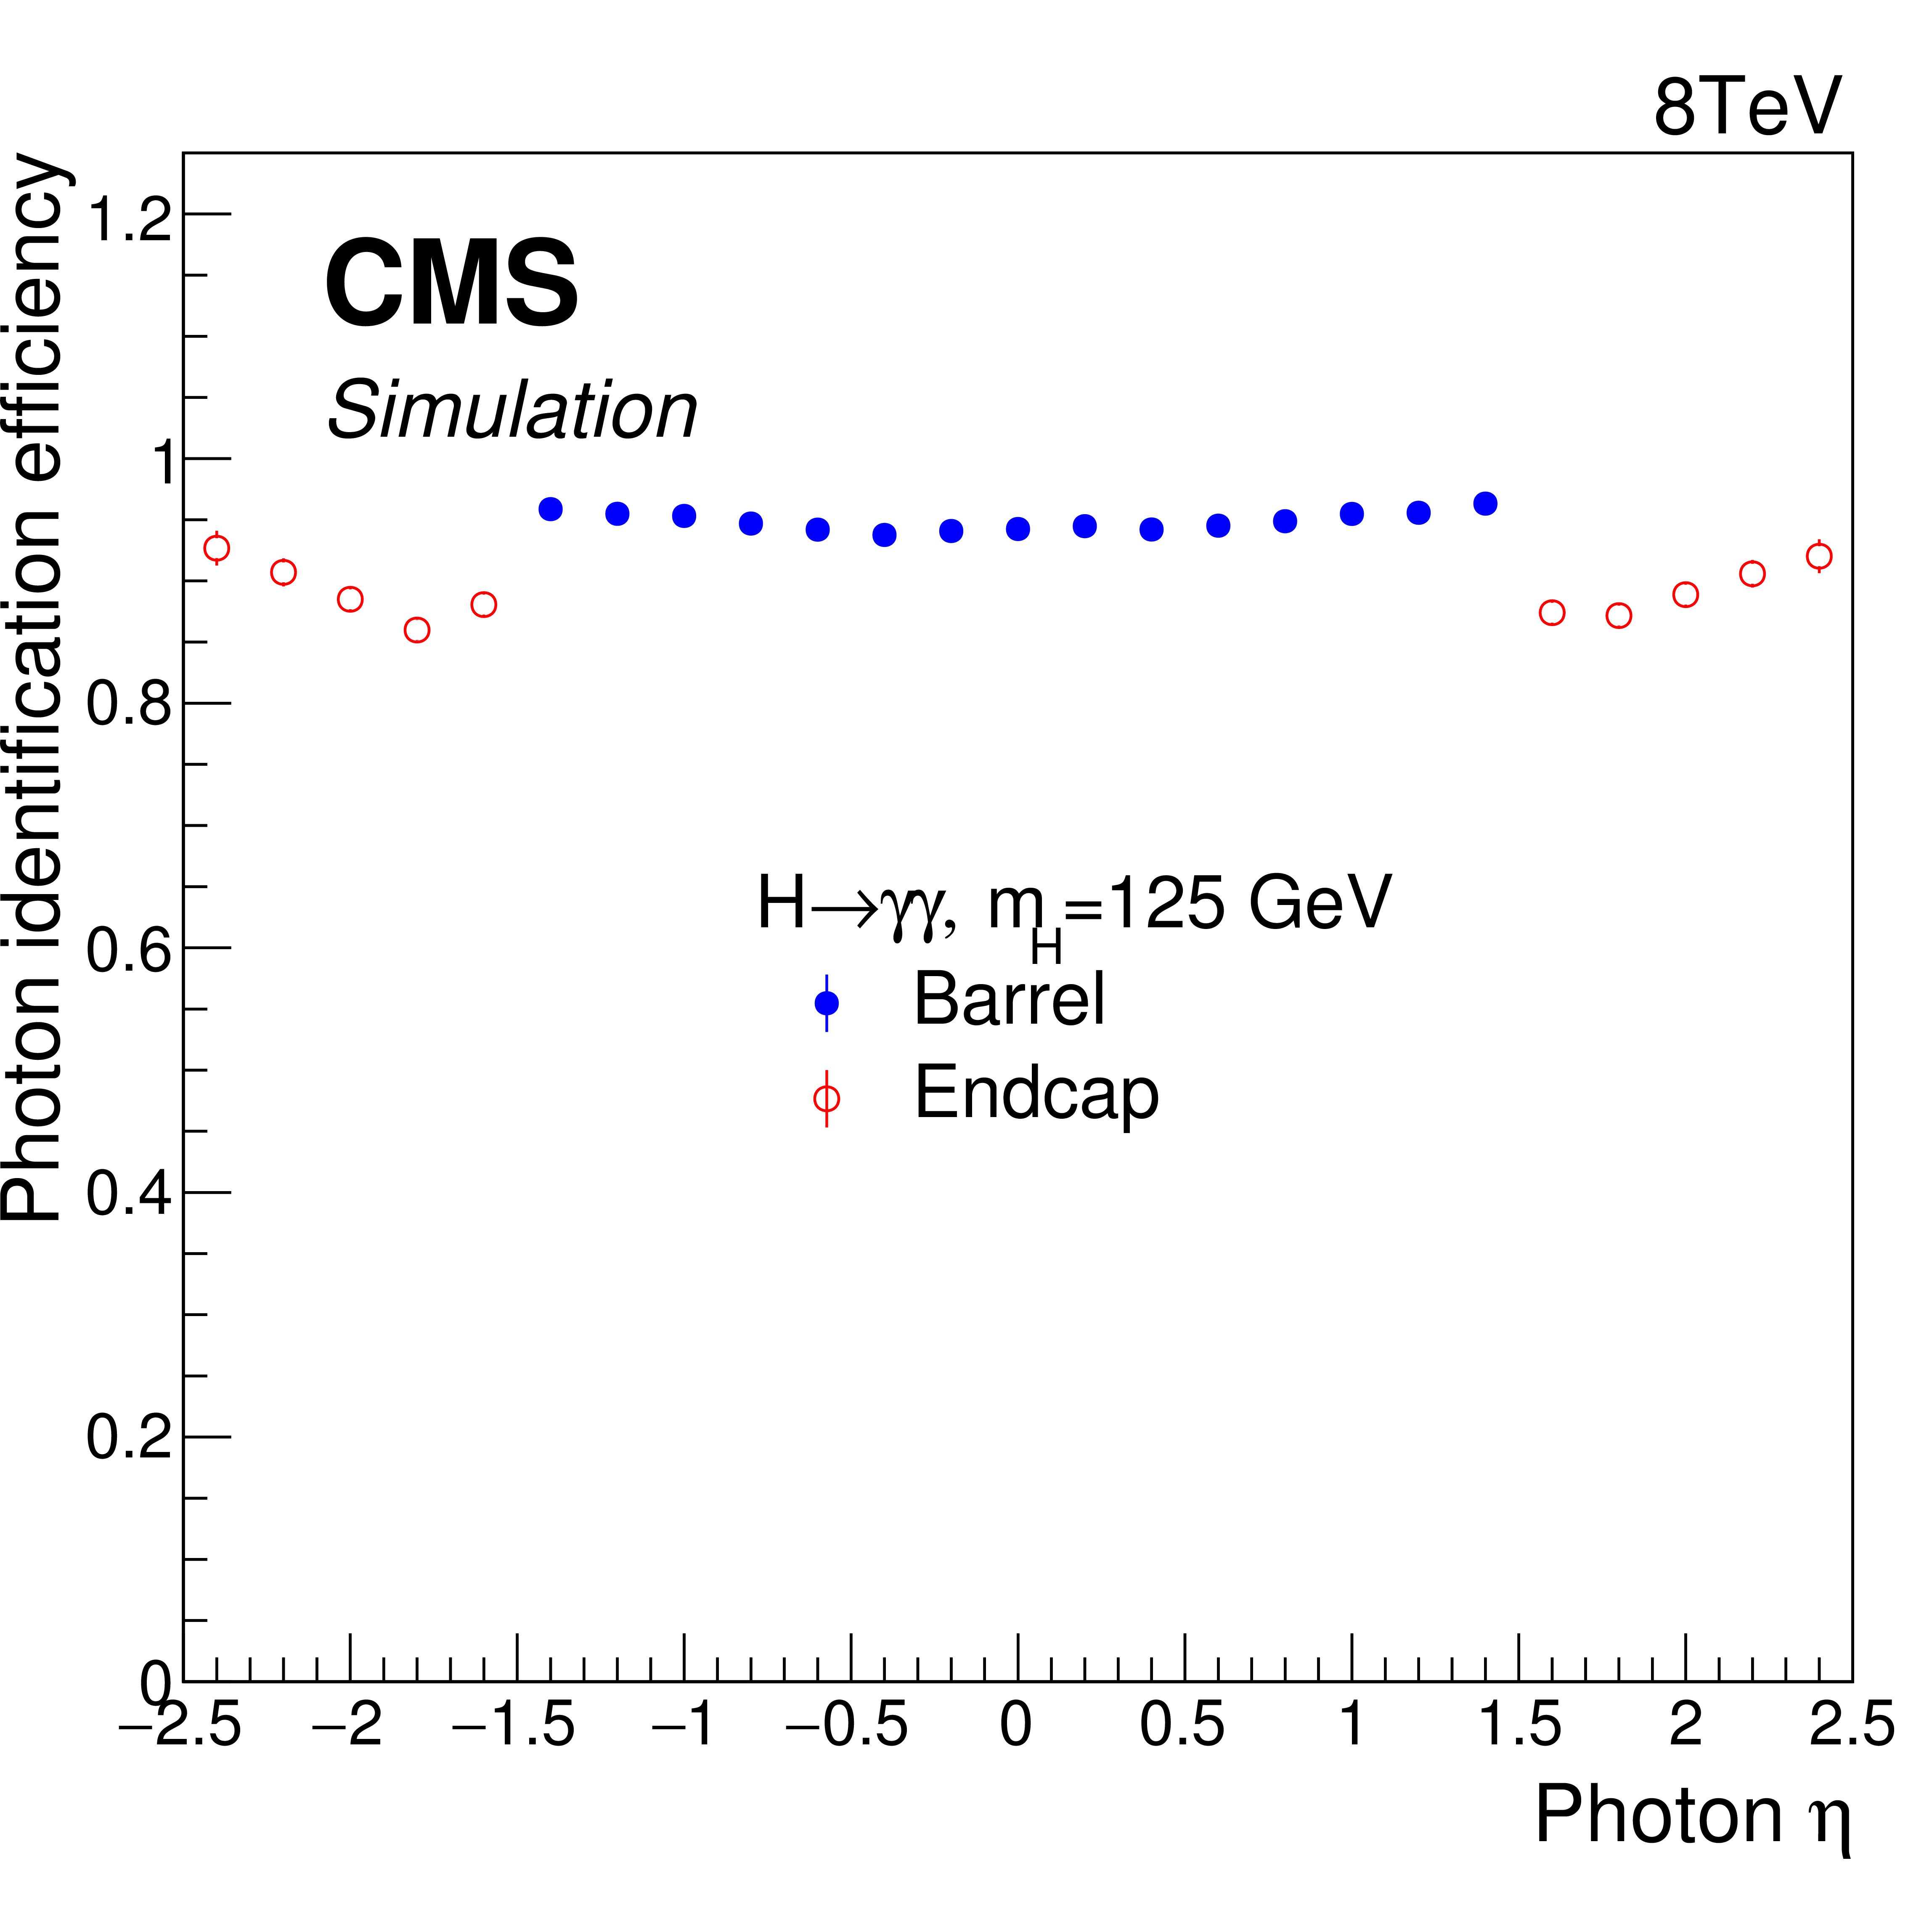
Figure 1-a:
Photon identification efficiencies for a Higgs boson with $ {m_{ {\mathrm {H}} }} =$ 125 GeV , as a function of photon pseudorapidity (a), and photon transverse momentum (b). |
png pdf |
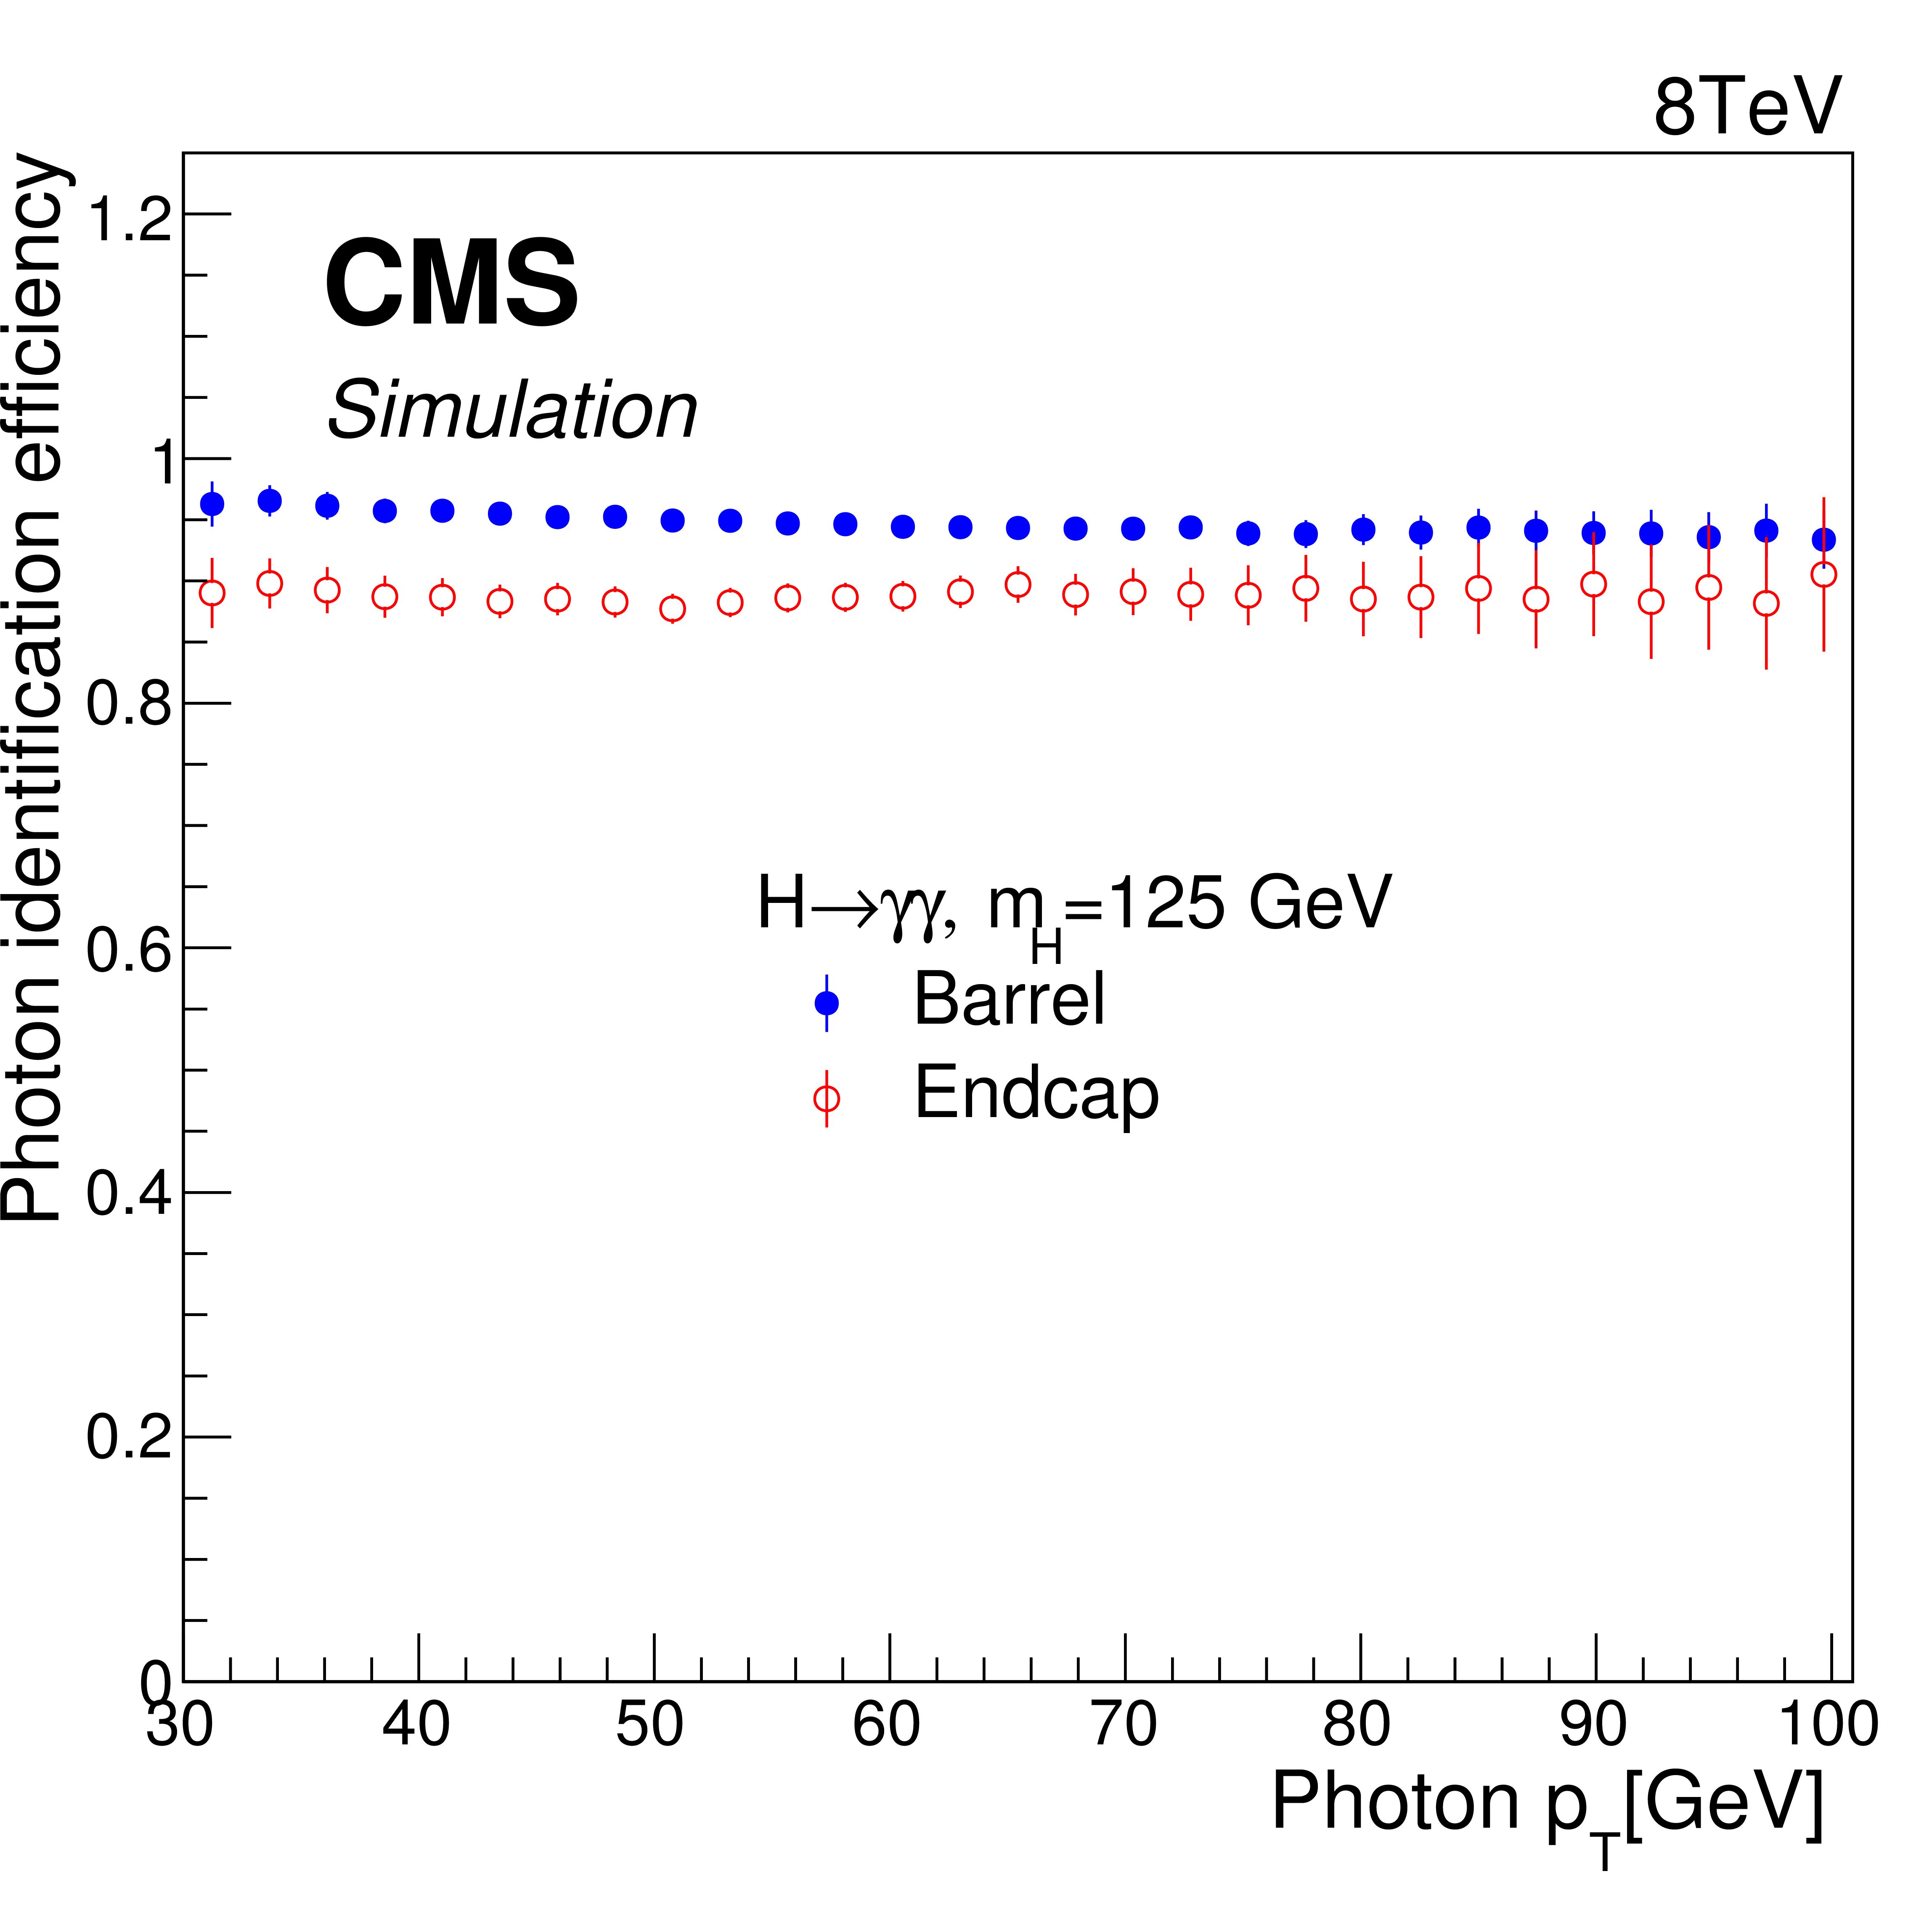
Figure 1-b:
Photon identification efficiencies for a Higgs boson with $ {m_{ {\mathrm {H}} }} =$ 125 GeV , as a function of photon pseudorapidity (a), and photon transverse momentum (b). |
png pdf |
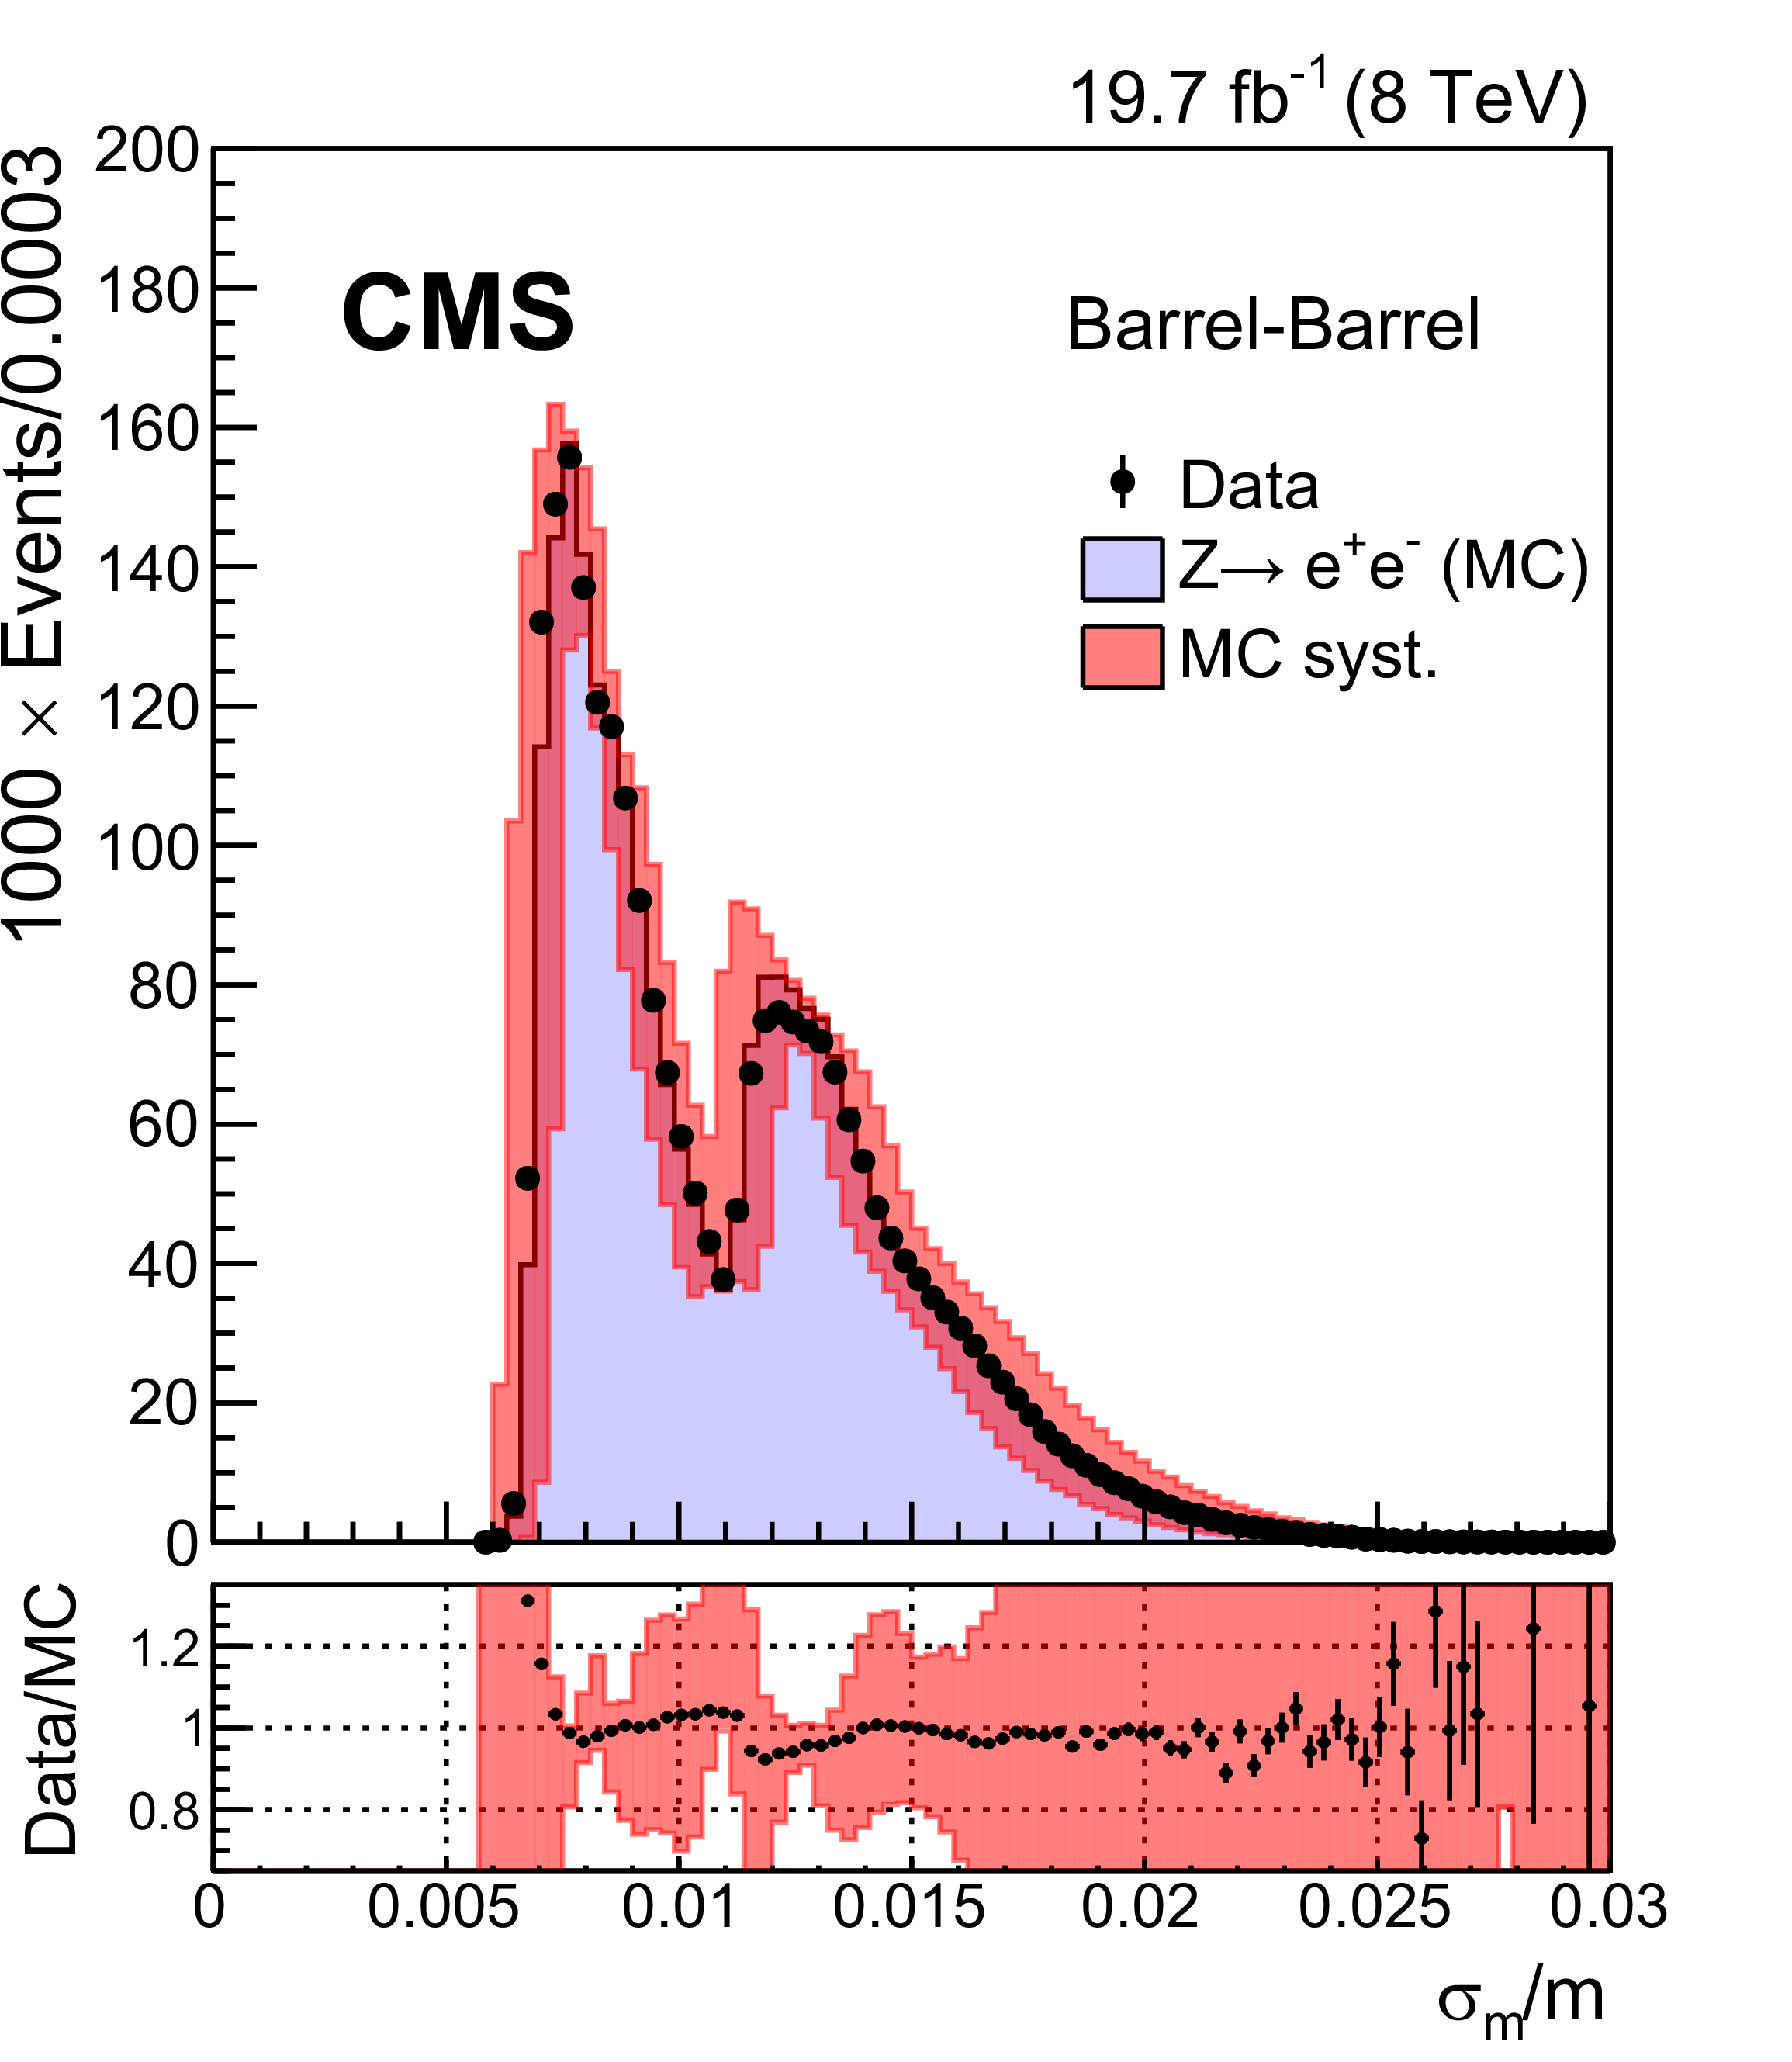
Figure 2-a:
Mass resolution estimator $\sigma _m/ {m_{\gamma \gamma }} $ after the decorrelation procedure, in ${ {\mathrm {Z}}\to {\mathrm {e}^+} {\mathrm {e}^-}} $ events in data (dots) and simulated events (histogram) with their systematic uncertainties (shaded bands) for barrel-barrel events (a), all the other events (b). The ratio of data to MC predictions are shown below each panel, and the error bars on each point represent the statistical uncertainties of the data. |
png pdf |
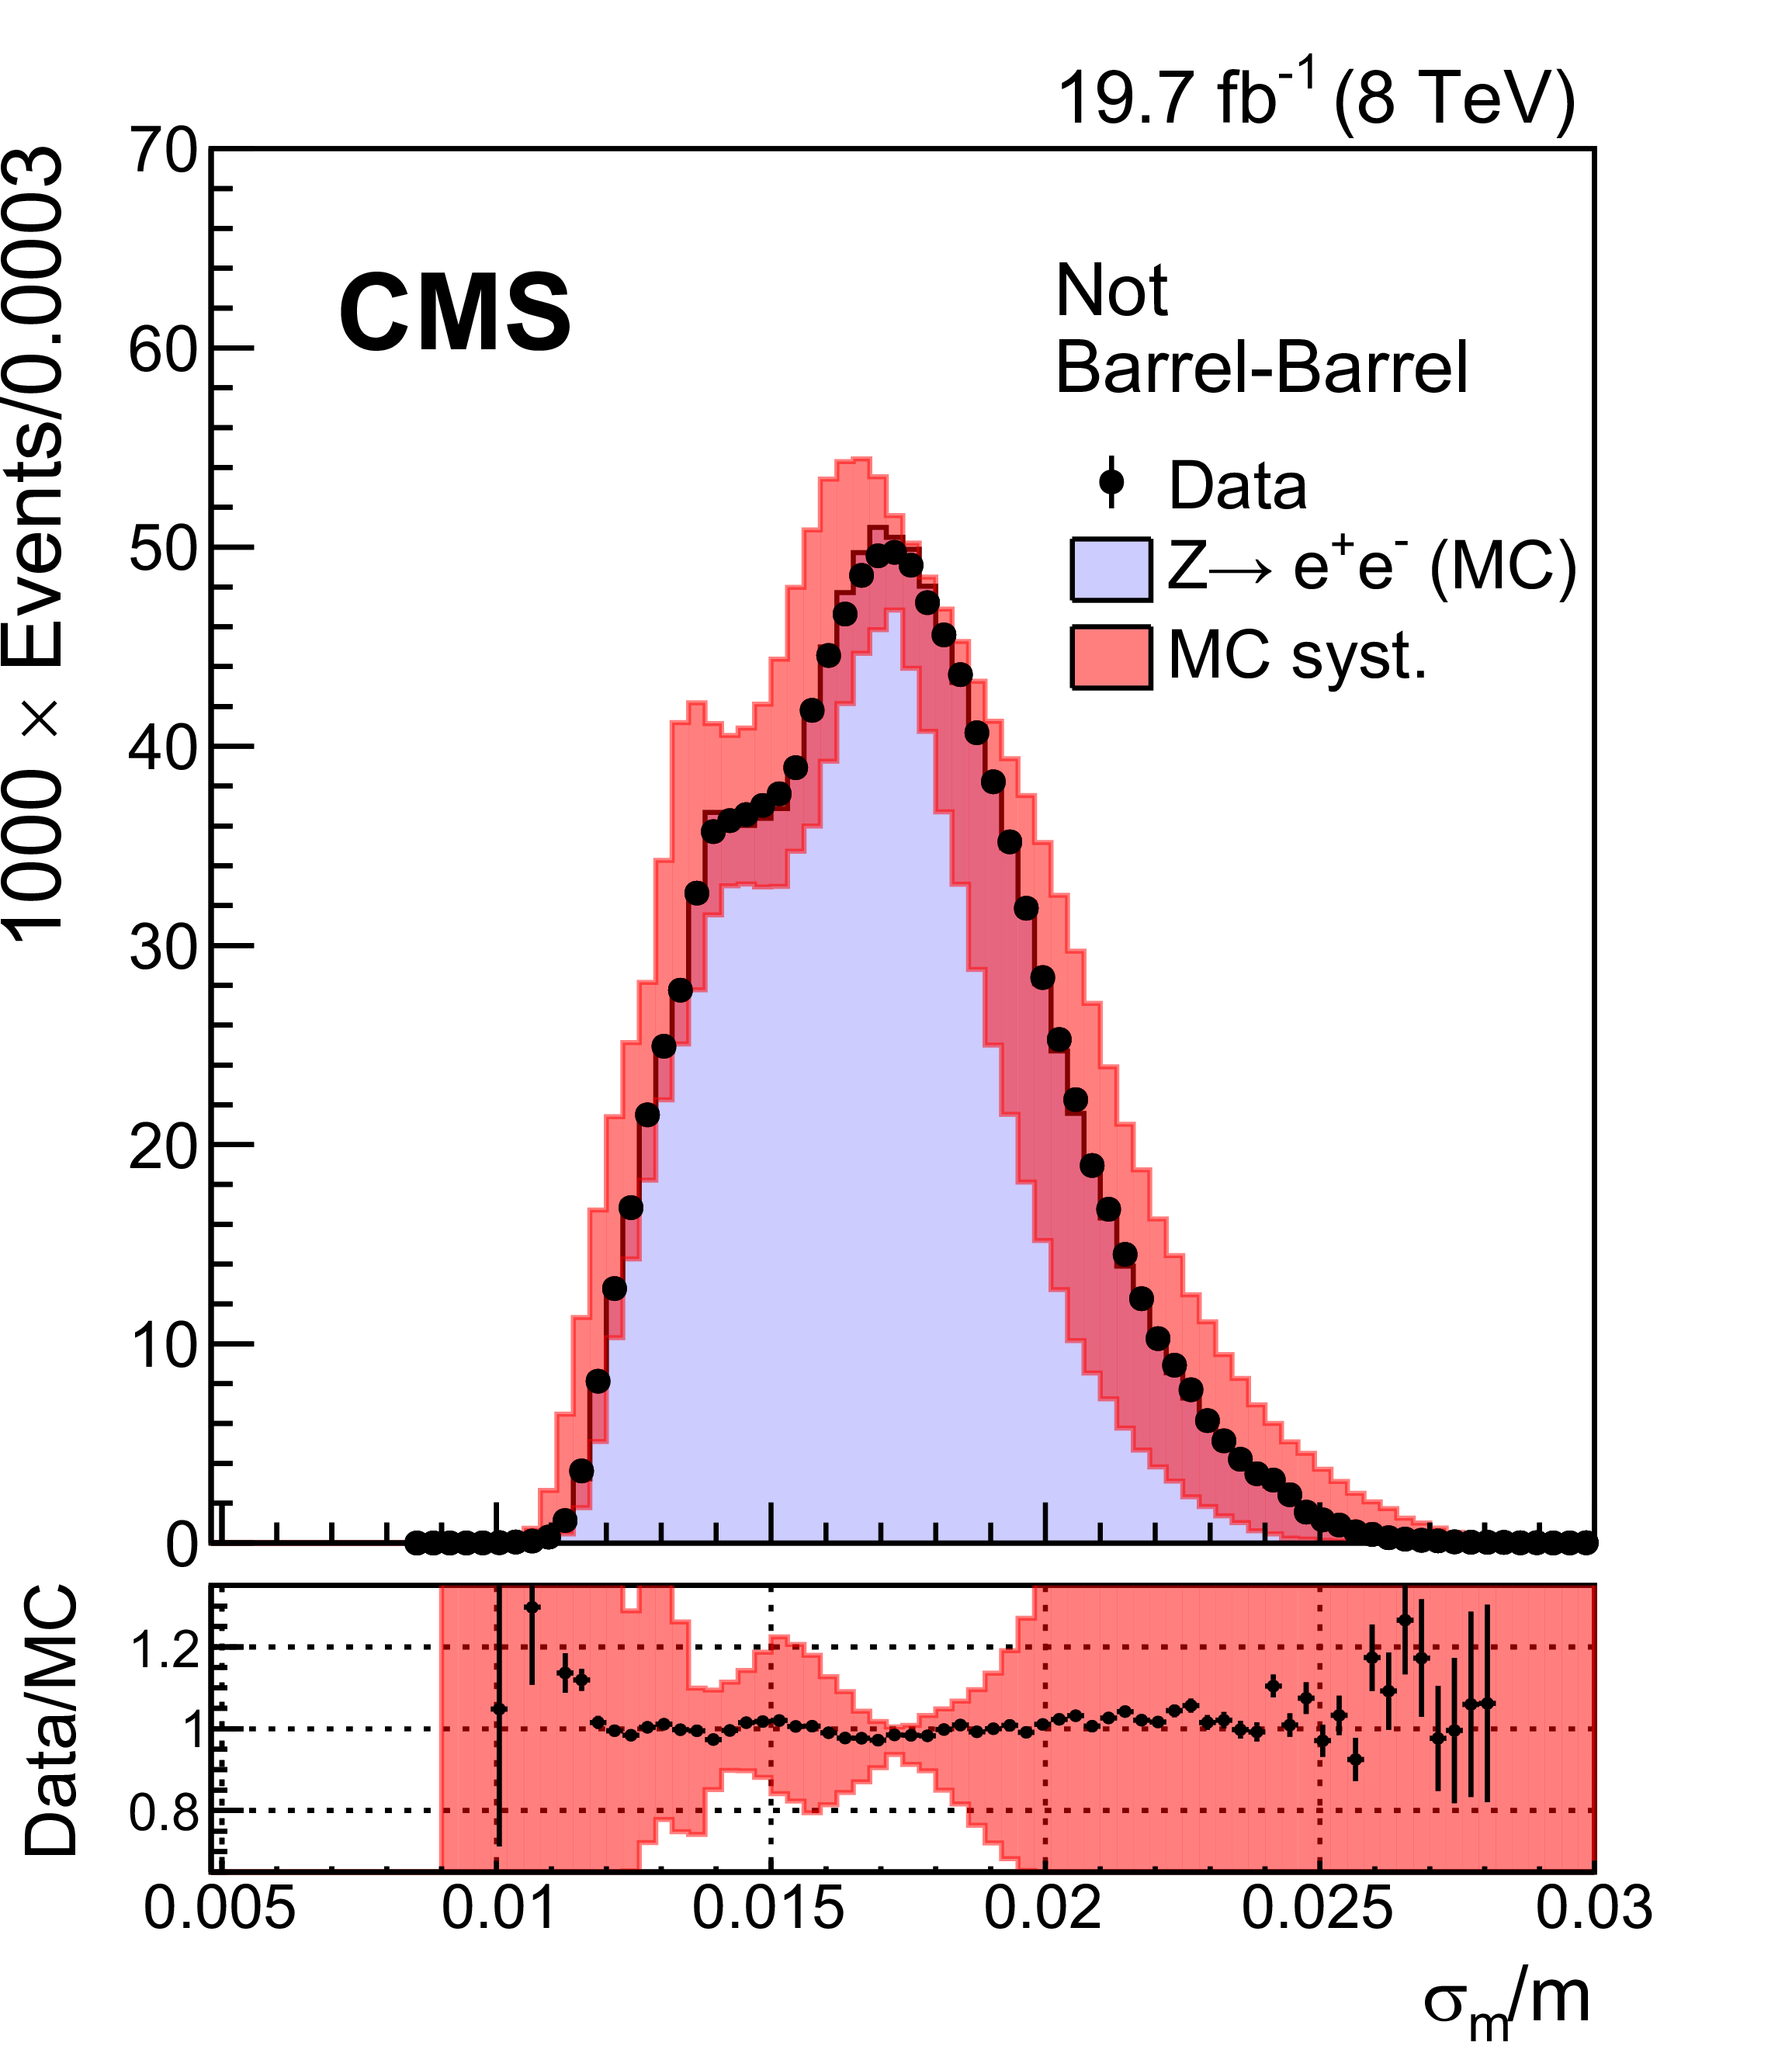
Figure 2-b:
Mass resolution estimator $\sigma _m/ {m_{\gamma \gamma }} $ after the decorrelation procedure, in ${ {\mathrm {Z}}\to {\mathrm {e}^+} {\mathrm {e}^-}} $ events in data (dots) and simulated events (histogram) with their systematic uncertainties (shaded bands) for barrel-barrel events (a), all the other events (b). The ratio of data to MC predictions are shown below each panel, and the error bars on each point represent the statistical uncertainties of the data. |
png pdf |
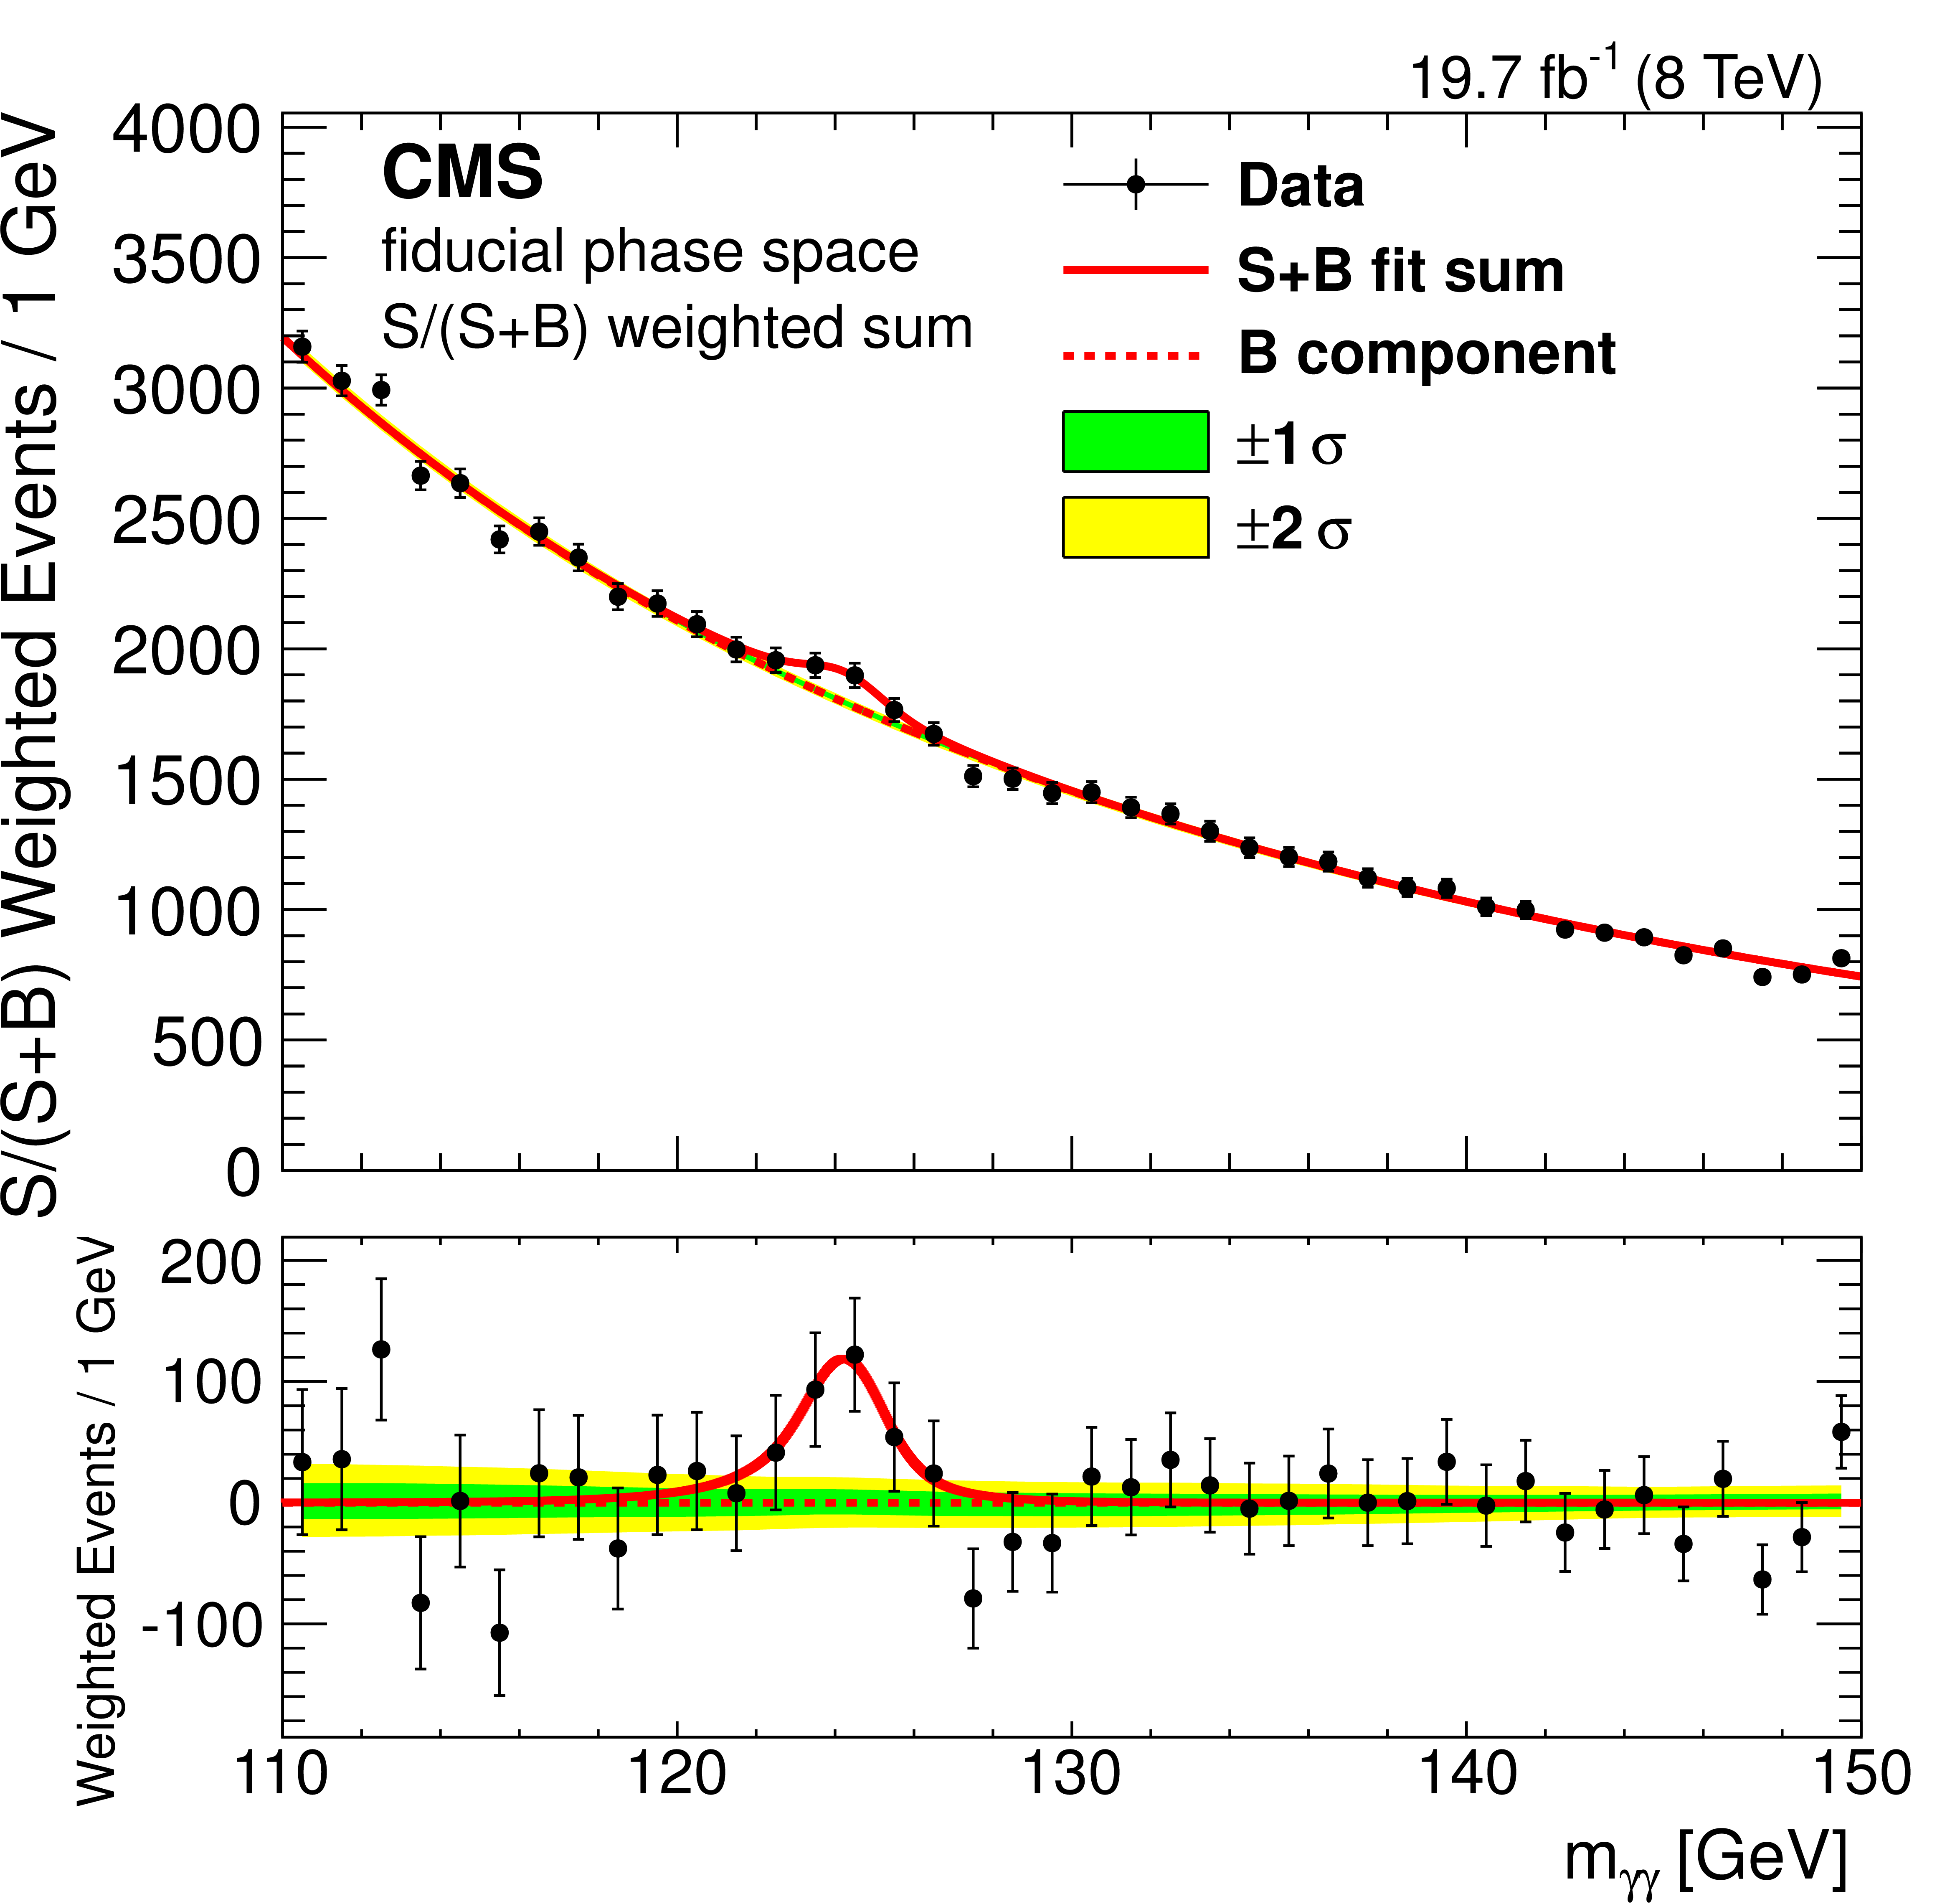
Figure 3:
Sum of the signal+background (S+B) model fits to the events of the three $\sigma _{m}/ {m_{\gamma \gamma }} $ classes in the fiducial phase space measurement, weighted by S/(S+B) separately in each category, together with the data binned as a function of $ {m_{\gamma \gamma }} $. The 1 and 2 standard deviation bands of uncertainty (labeled as 1$\sigma $ and 2$\sigma $) shown for the background component include the uncertainty due to the choice of function and the uncertainty in the fitted parameters. The bottom panel shows the result after subtracting the background component. |
png pdf |
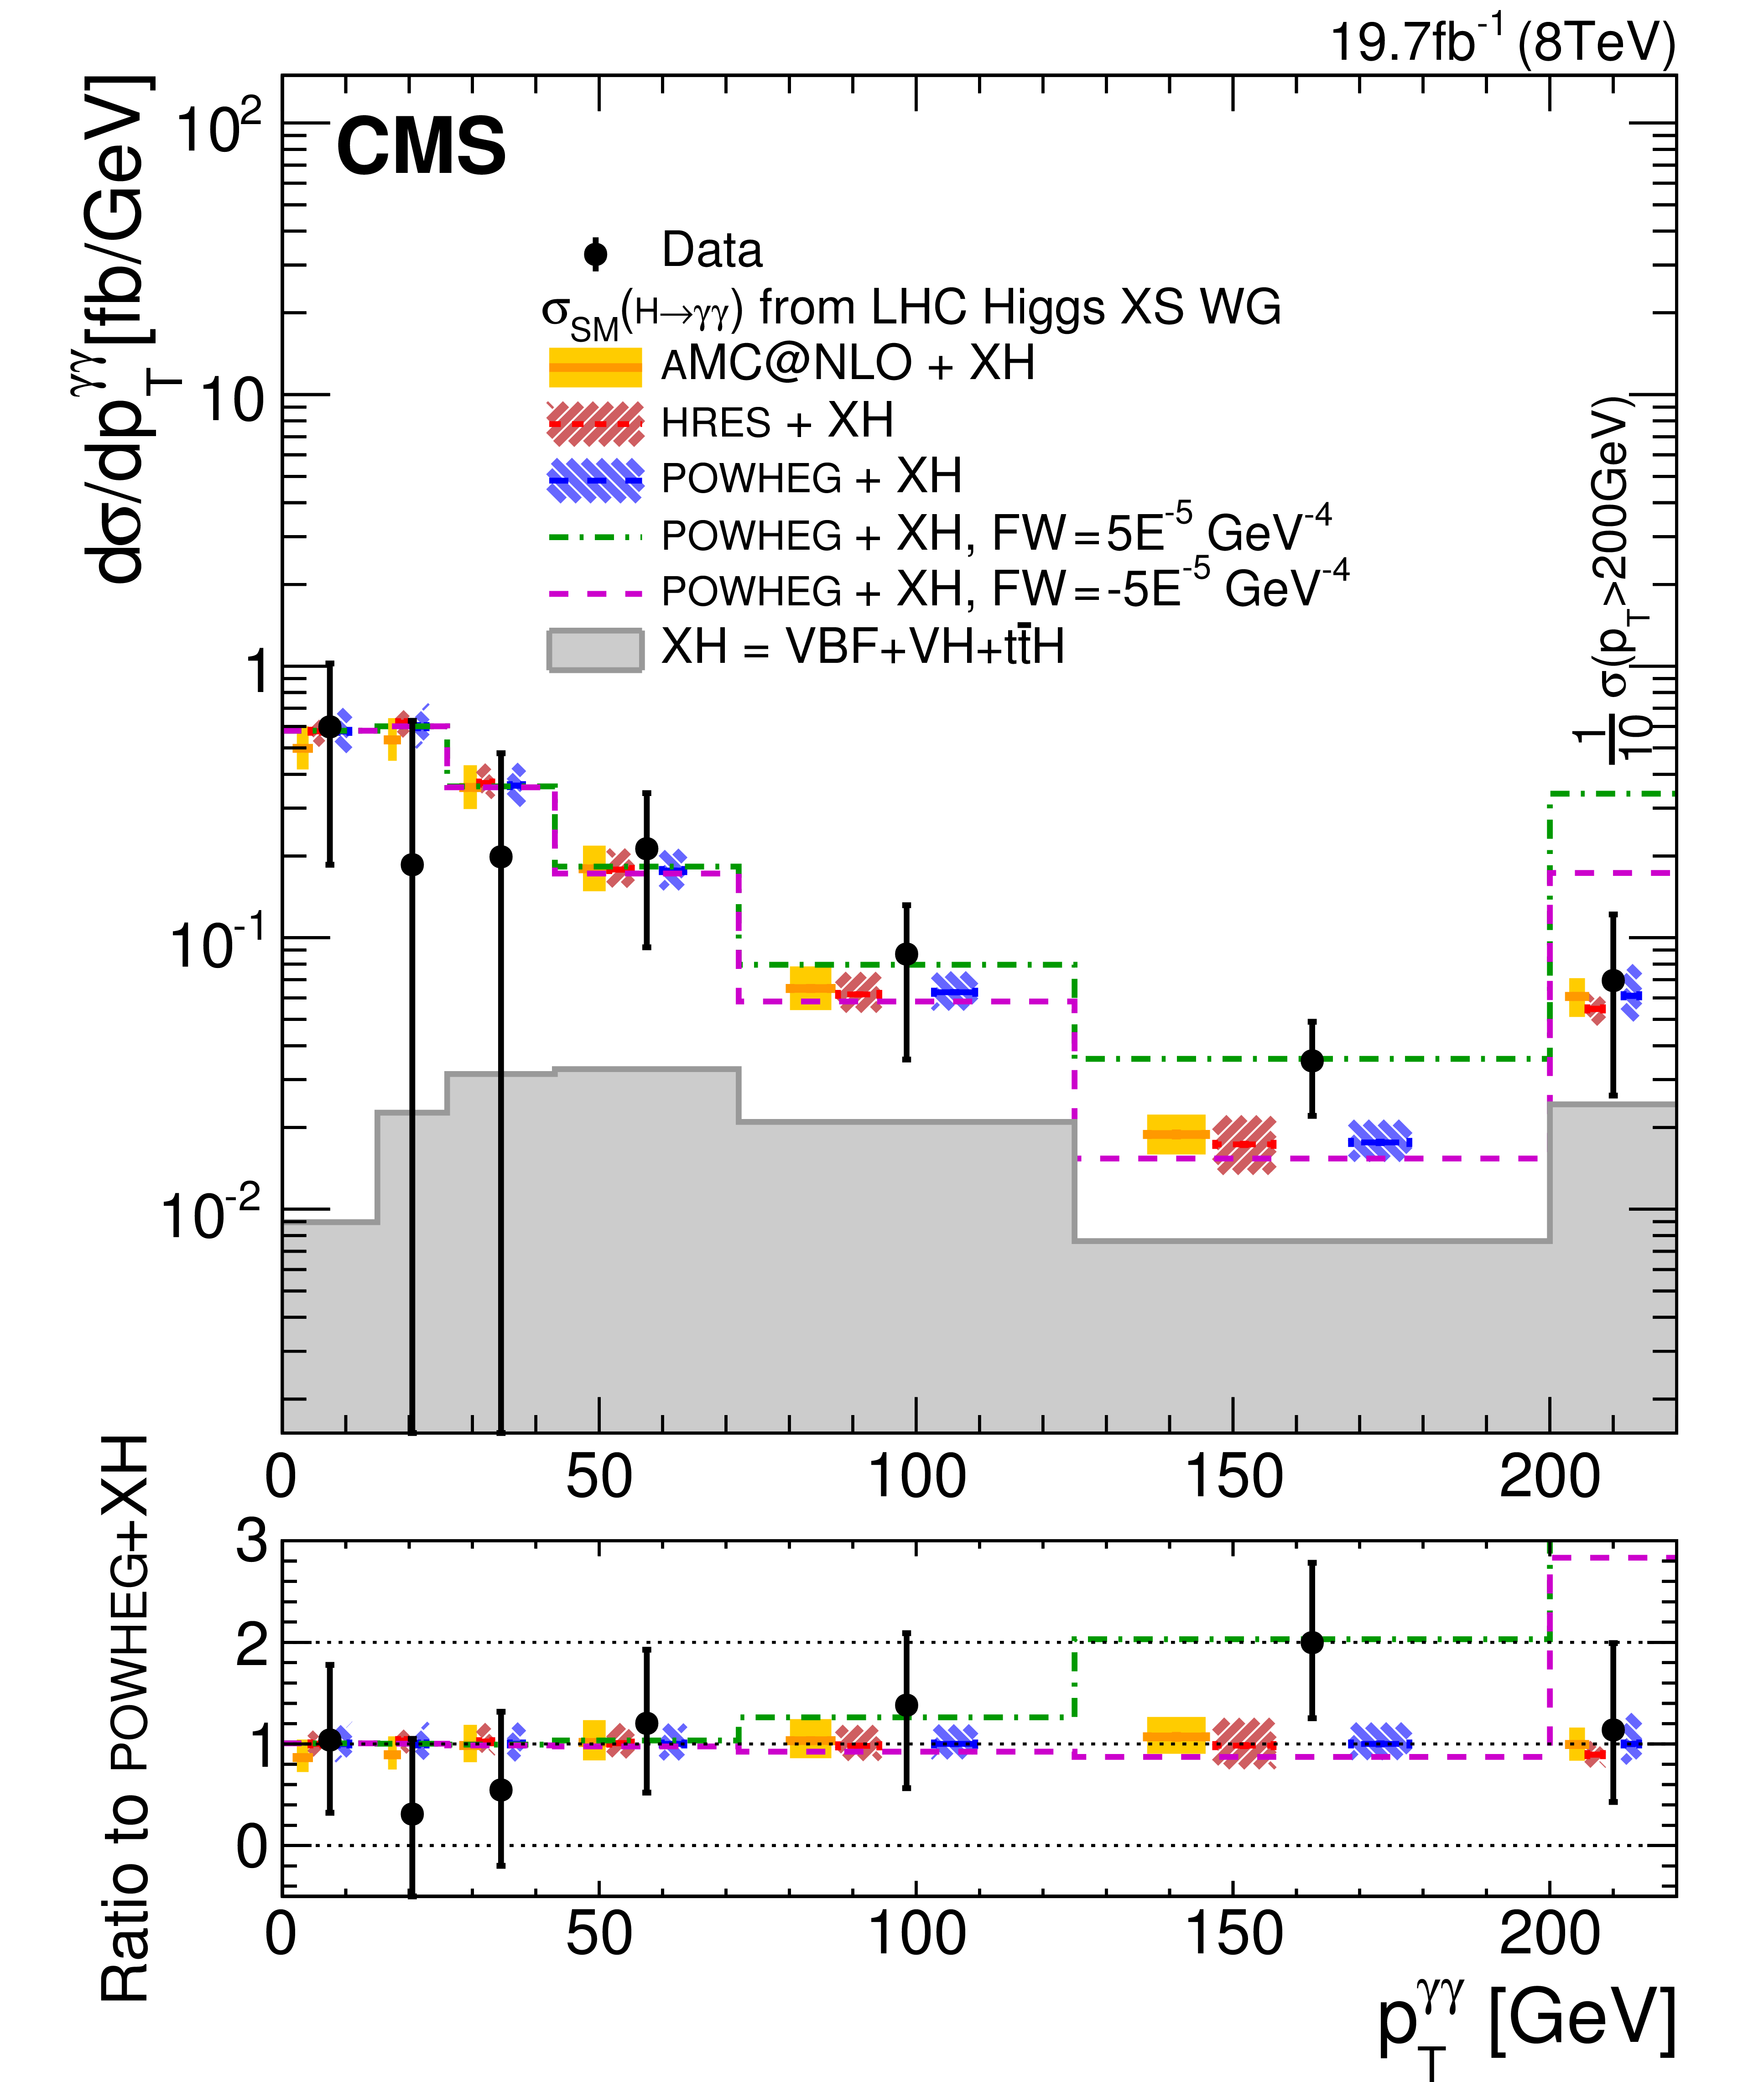
Figure 4-a:
The $ { {\mathrm {H}} \to {\gamma } {\gamma }} $ differential cross section for inclusive events as a function of (a) $ {p_{\mathrm {T}}^{\gamma \gamma }} $, (upper right) $ { {| y^{\gamma \gamma } | }} $, (lower left) $ {\Delta \phi ^{\gamma \gamma }} $, and (lower right) $ {| \cos{ \theta ^{\ast }} | }$. All the SM contributions are normalized to their cross section from the LHC Higgs Cross Section Working Group (2013). Theoretical uncertainties in the renormalization and factorization scales, PDF, and branching fraction are added in quadrature. The error bars on data points reflect both statistical and systematic uncertainties. The last bin of $ {p_{\mathrm {T}}^{\gamma \gamma }} $ distribution sums the events above 200 GeV . For each graph, the bottom panel shows the ratio of data to theoretical predictions from POWHEG generator. |
png pdf |
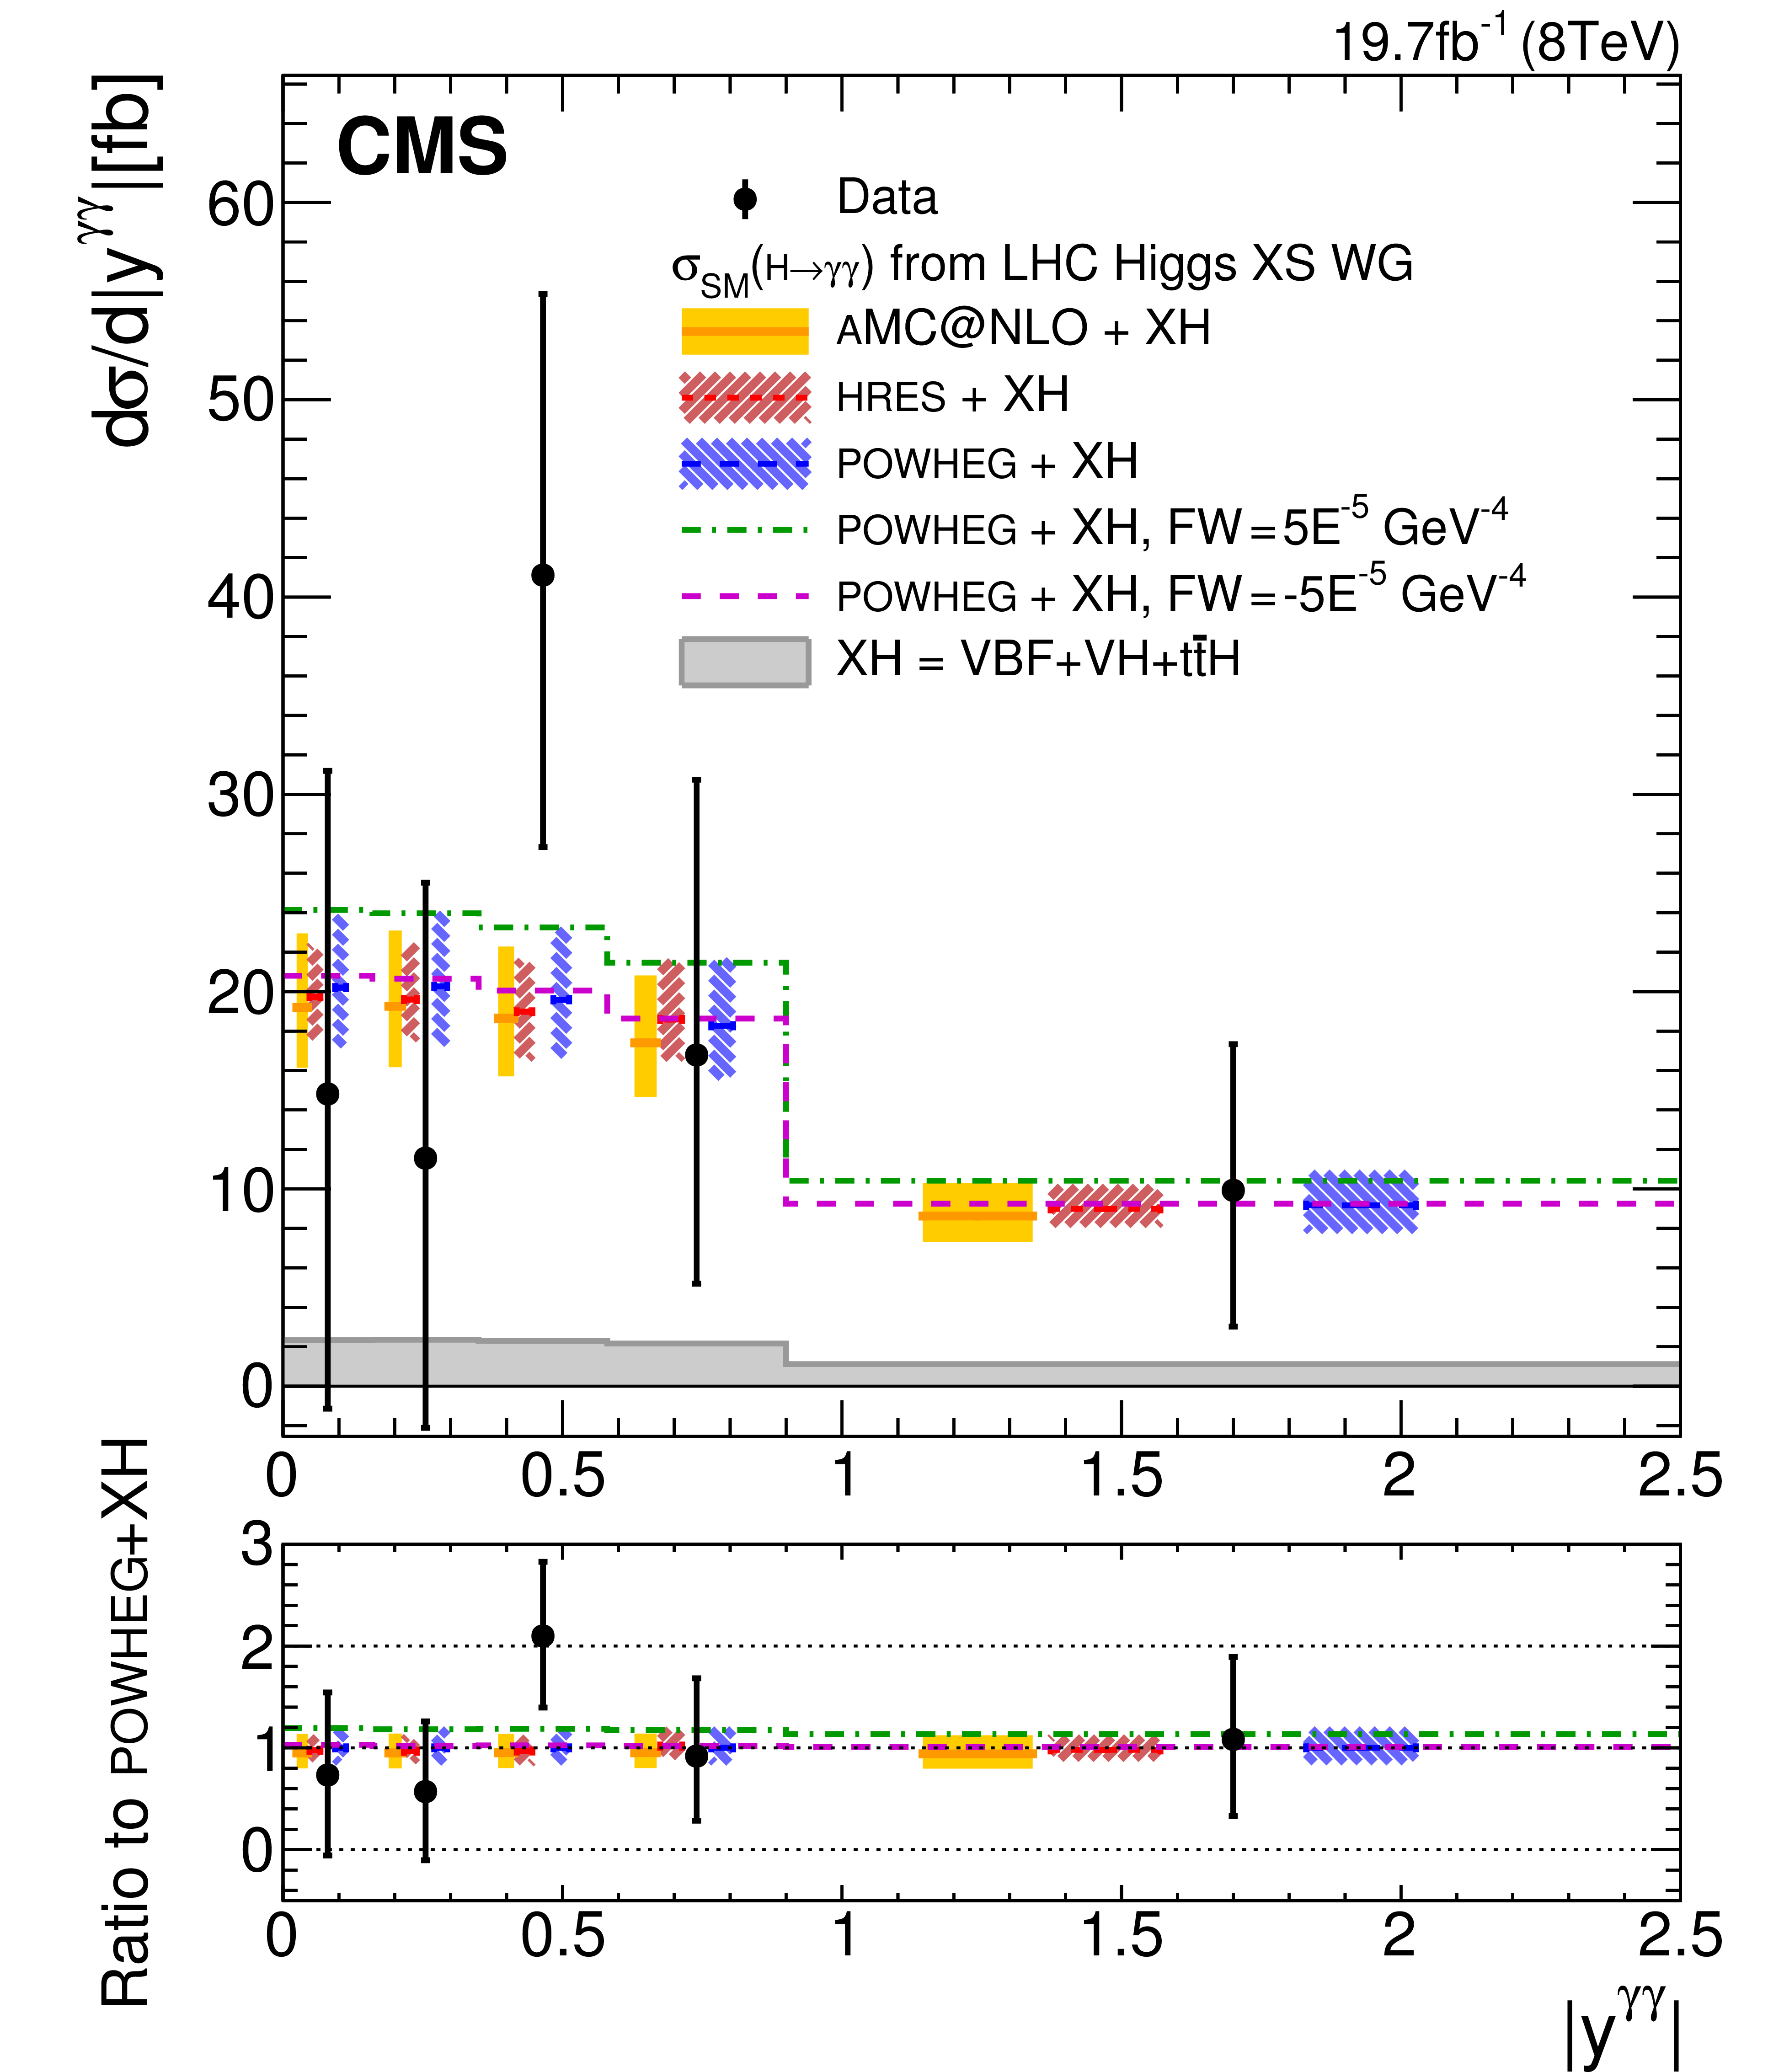
Figure 4-b:
The $ { {\mathrm {H}} \to {\gamma } {\gamma }} $ differential cross section for inclusive events as a function of (a) $ {p_{\mathrm {T}}^{\gamma \gamma }} $, (upper right) $ { {| y^{\gamma \gamma } | }} $, (lower left) $ {\Delta \phi ^{\gamma \gamma }} $, and (lower right) $ {| \cos{ \theta ^{\ast }} | }$. All the SM contributions are normalized to their cross section from the LHC Higgs Cross Section Working Group (2013). Theoretical uncertainties in the renormalization and factorization scales, PDF, and branching fraction are added in quadrature. The error bars on data points reflect both statistical and systematic uncertainties. The last bin of $ {p_{\mathrm {T}}^{\gamma \gamma }} $ distribution sums the events above 200 GeV . For each graph, the bottom panel shows the ratio of data to theoretical predictions from POWHEG generator. |
png pdf |
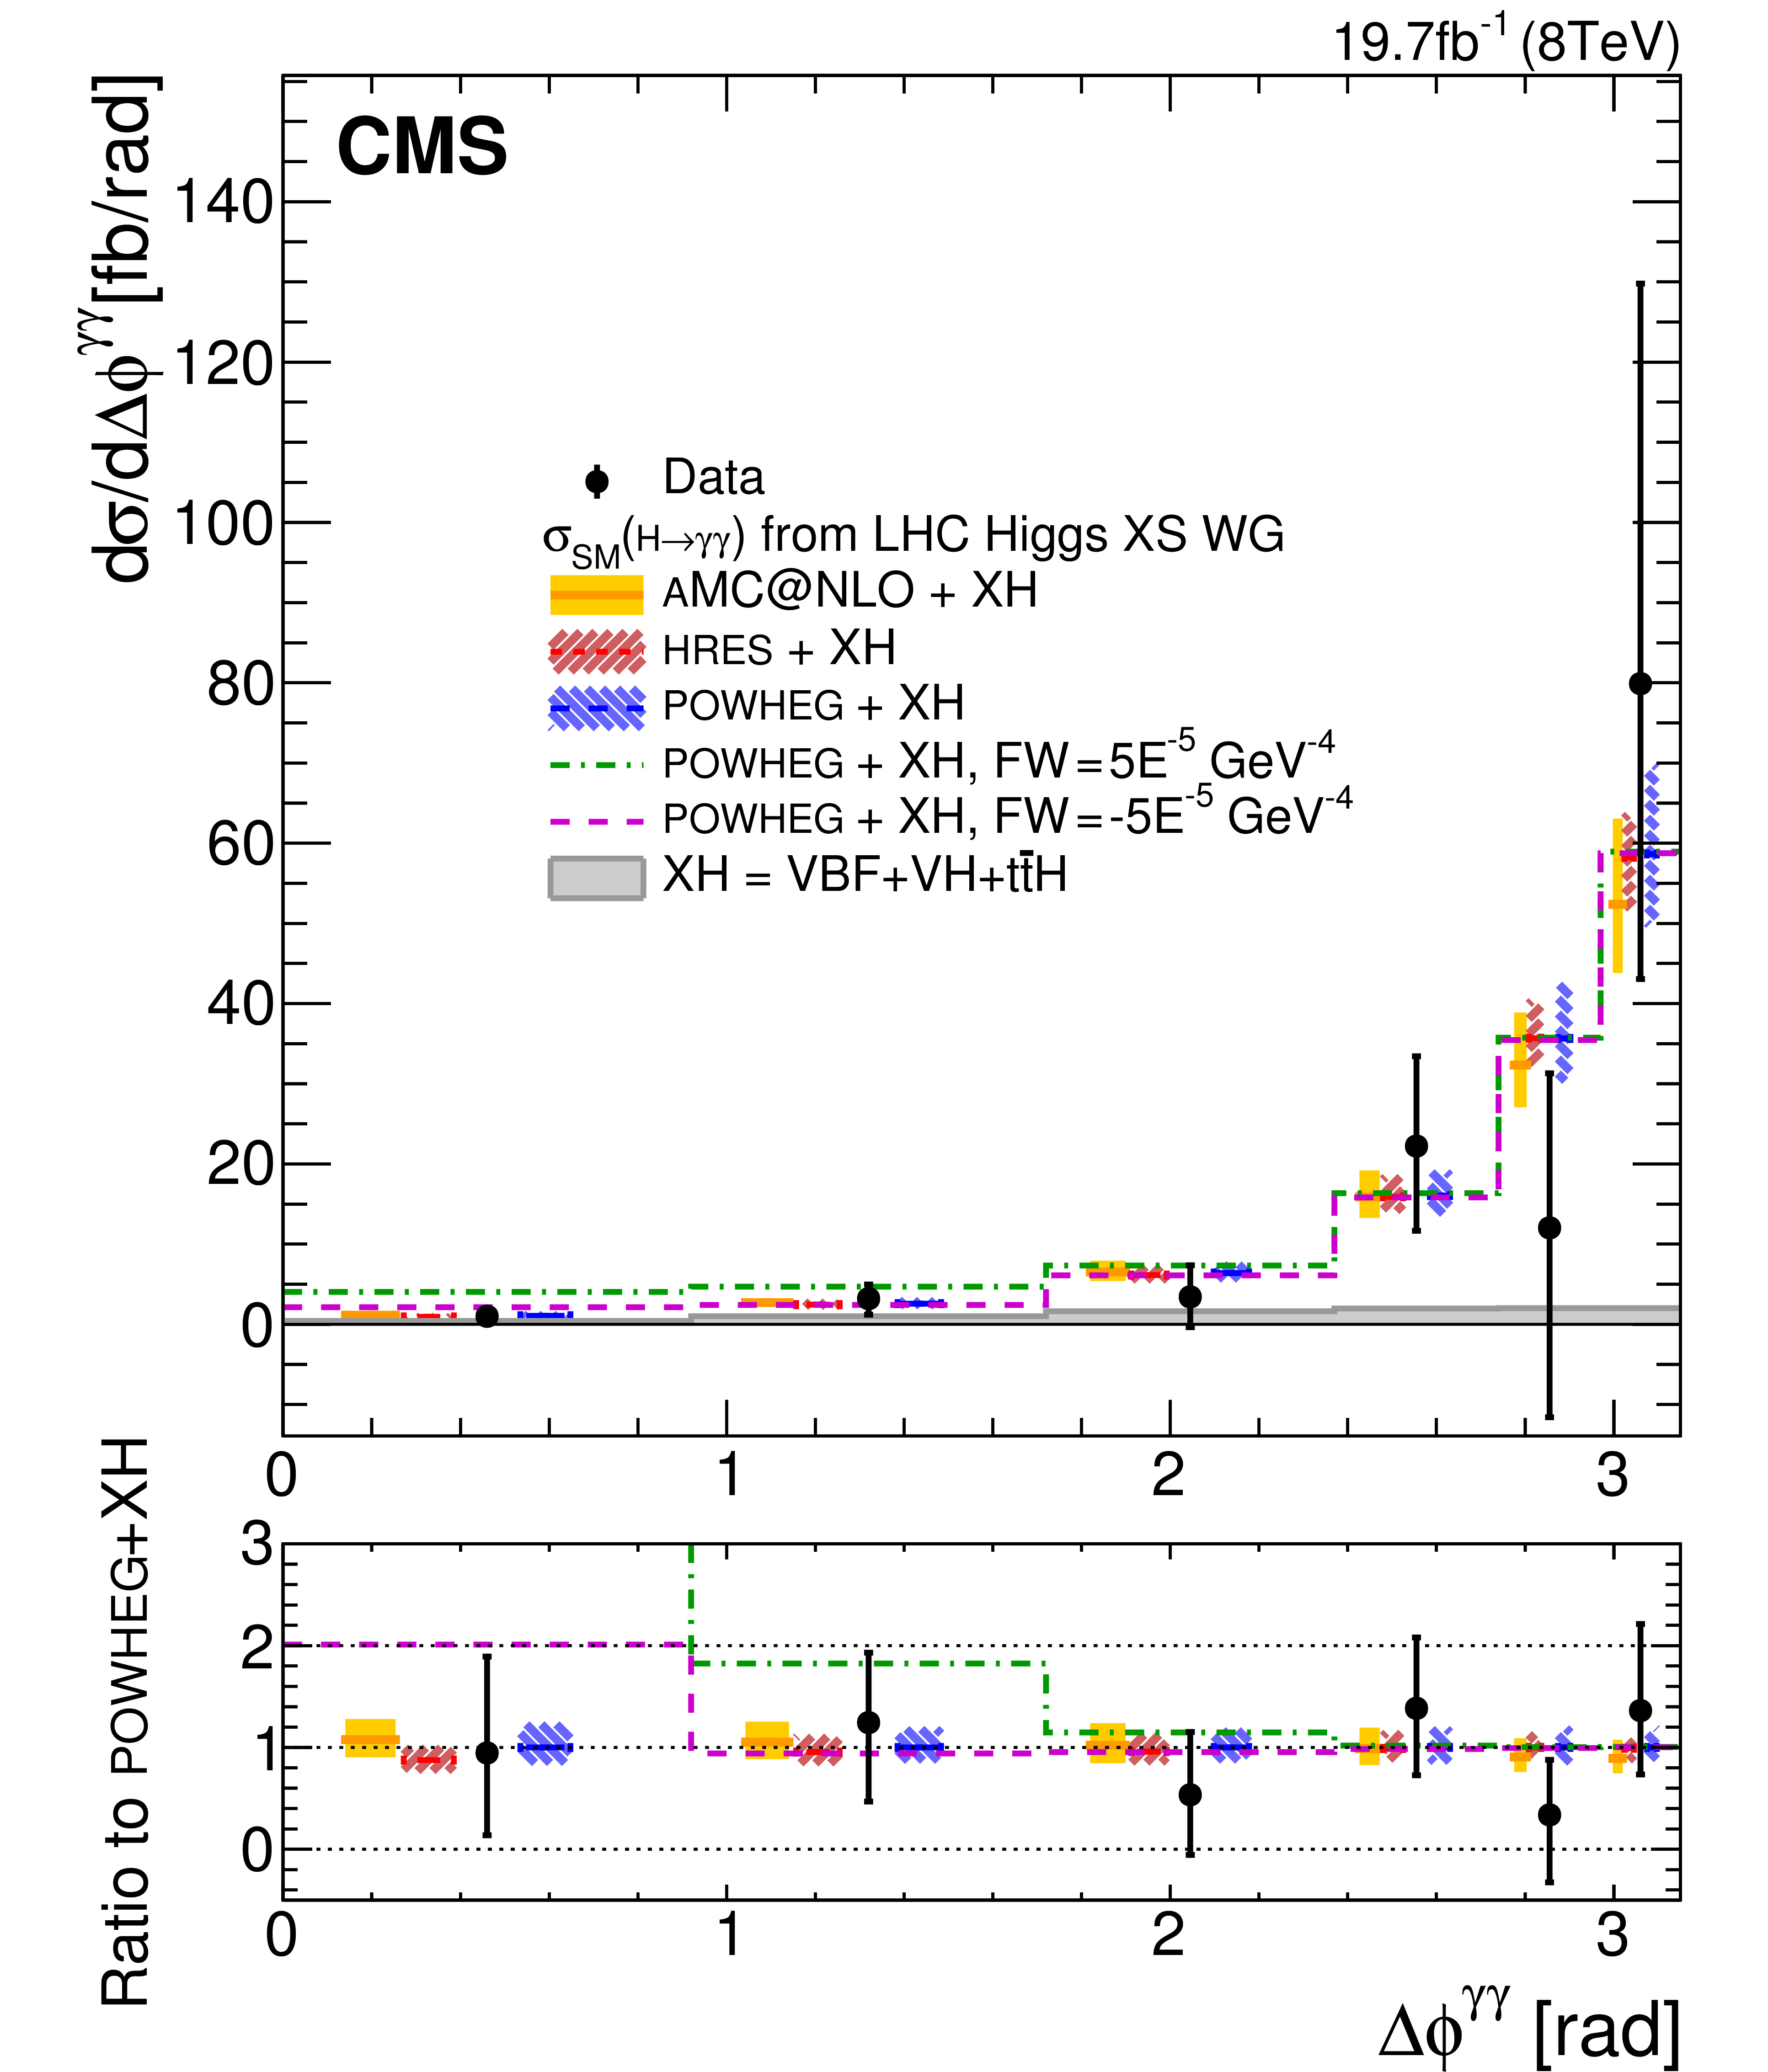
Figure 4-c:
The $ { {\mathrm {H}} \to {\gamma } {\gamma }} $ differential cross section for inclusive events as a function of (a) $ {p_{\mathrm {T}}^{\gamma \gamma }} $, (upper right) $ { {| y^{\gamma \gamma } | }} $, (lower left) $ {\Delta \phi ^{\gamma \gamma }} $, and (lower right) $ {| \cos{ \theta ^{\ast }} | }$. All the SM contributions are normalized to their cross section from the LHC Higgs Cross Section Working Group (2013). Theoretical uncertainties in the renormalization and factorization scales, PDF, and branching fraction are added in quadrature. The error bars on data points reflect both statistical and systematic uncertainties. The last bin of $ {p_{\mathrm {T}}^{\gamma \gamma }} $ distribution sums the events above 200 GeV . For each graph, the bottom panel shows the ratio of data to theoretical predictions from POWHEG generator. |
png pdf |
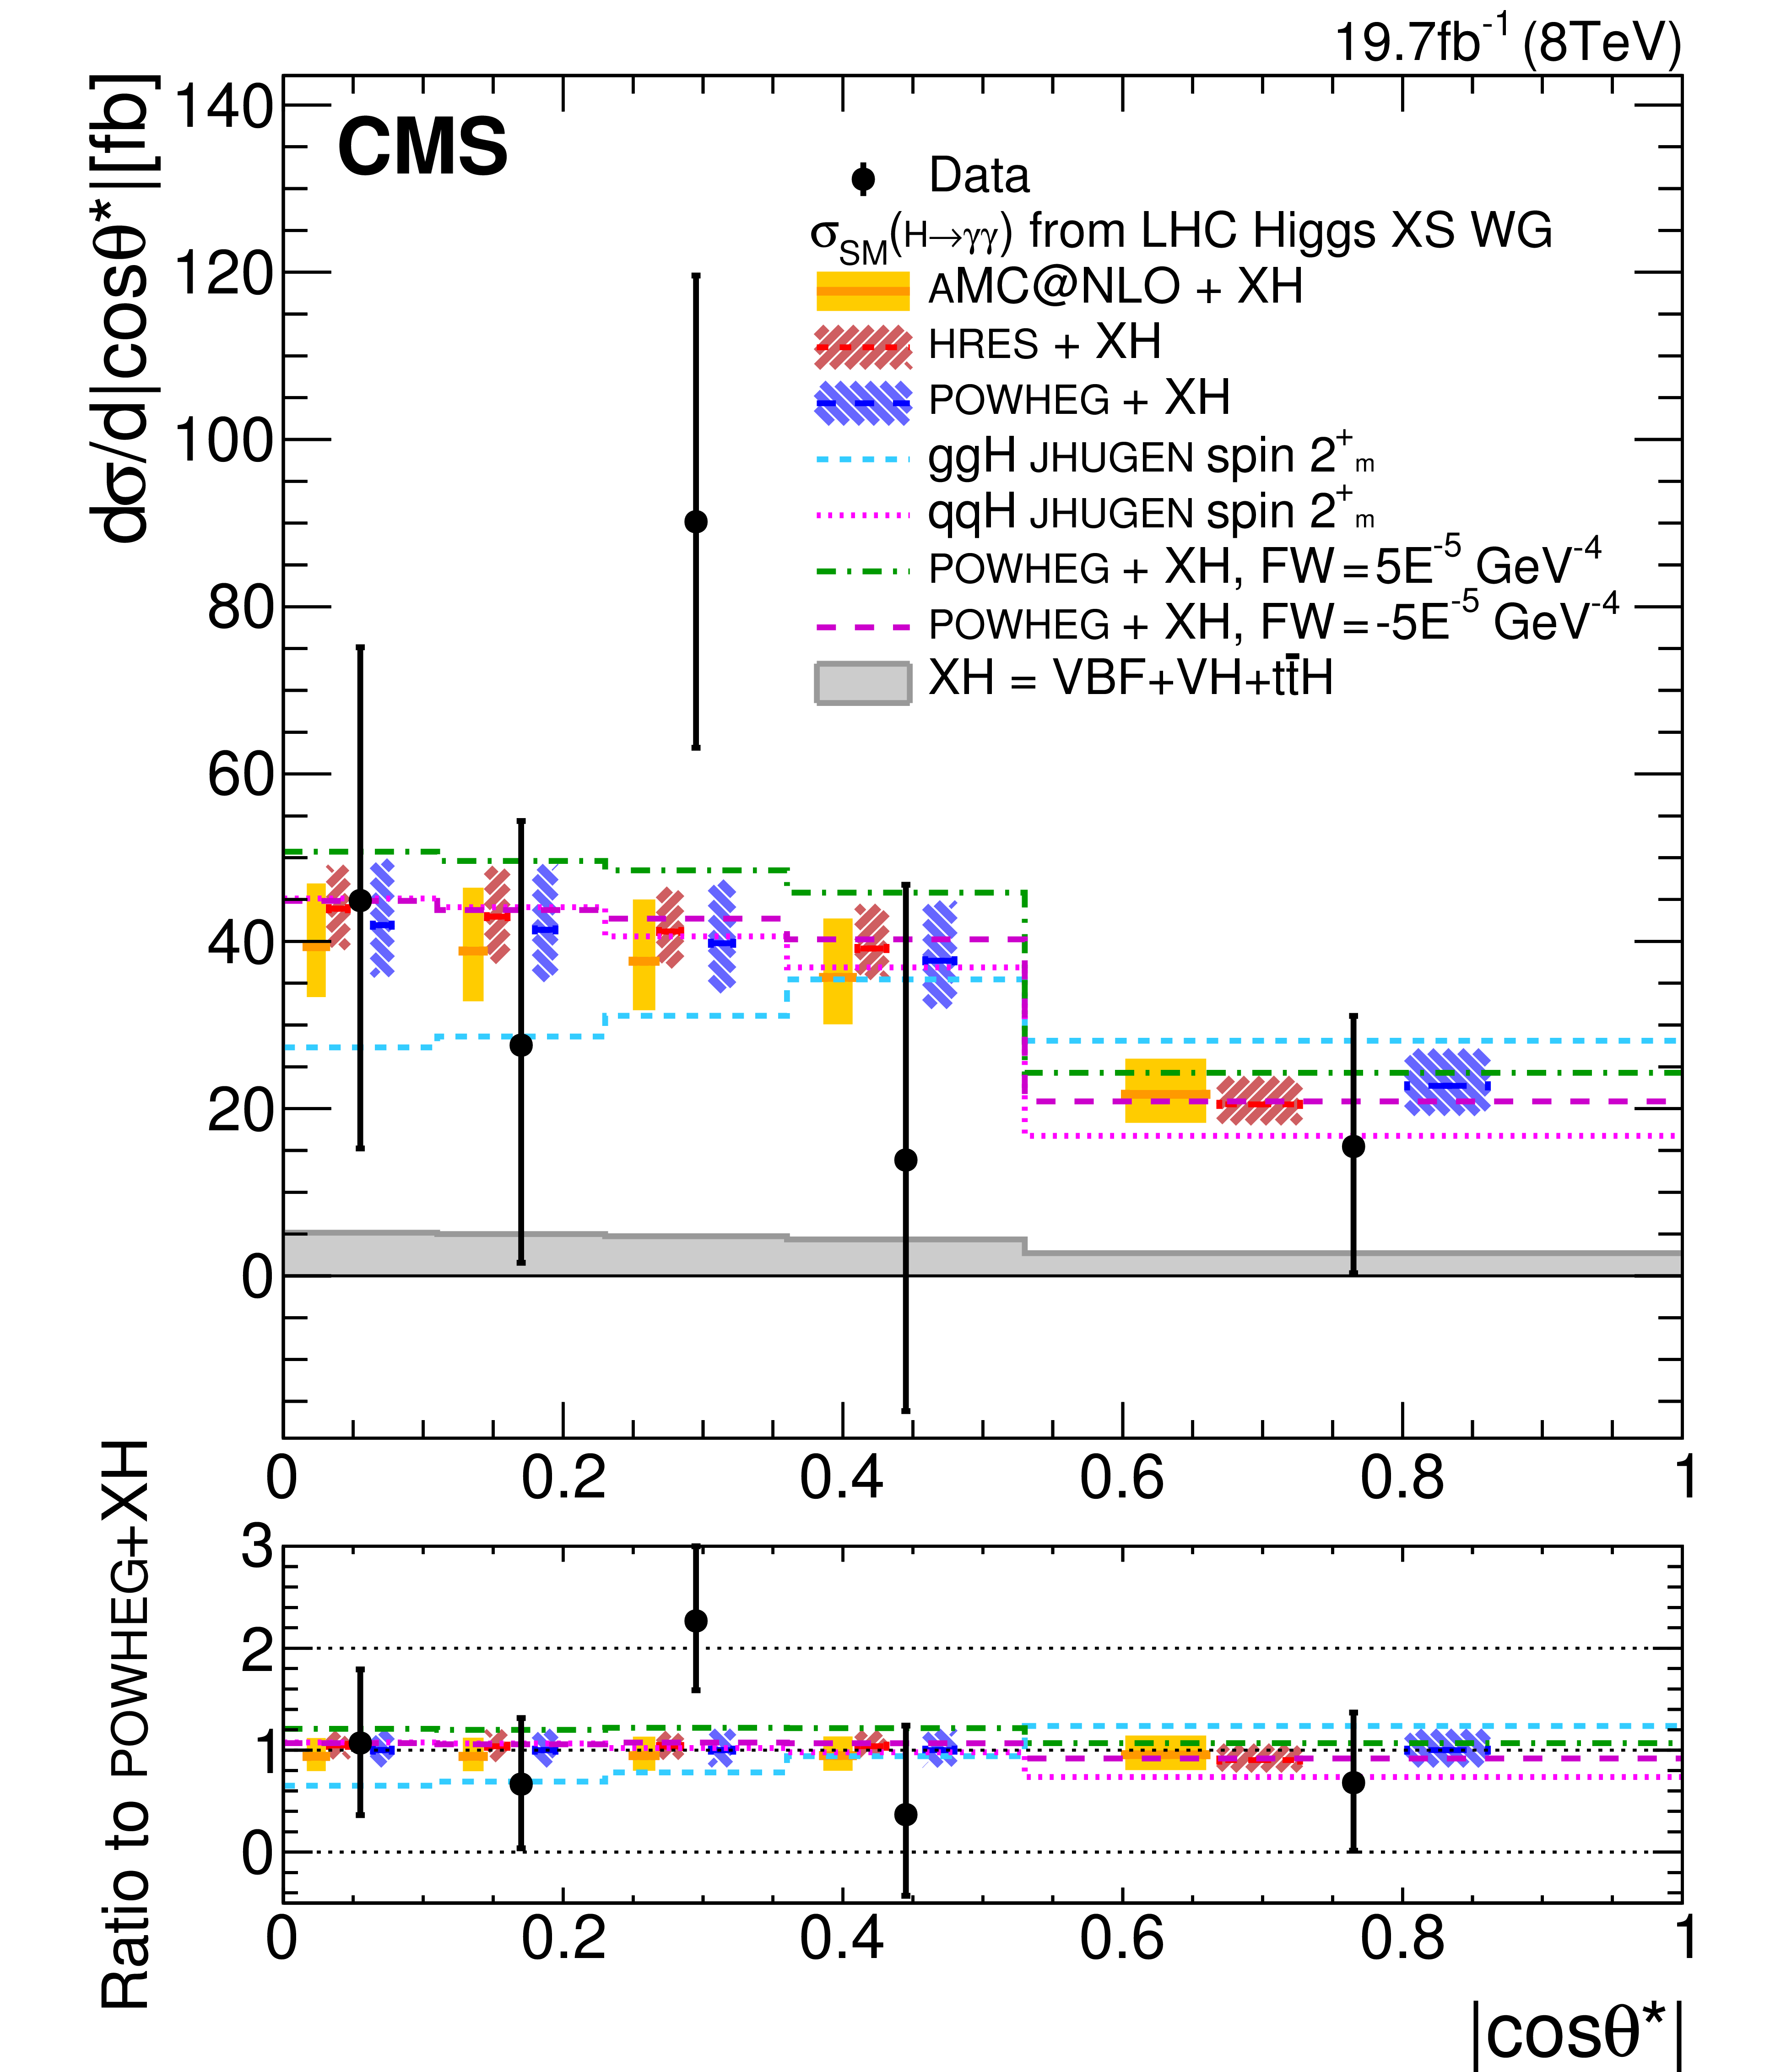
Figure 4-d:
The $ { {\mathrm {H}} \to {\gamma } {\gamma }} $ differential cross section for inclusive events as a function of (a) $ {p_{\mathrm {T}}^{\gamma \gamma }} $, (upper right) $ { {| y^{\gamma \gamma } | }} $, (lower left) $ {\Delta \phi ^{\gamma \gamma }} $, and (lower right) $ {| \cos{ \theta ^{\ast }} | }$. All the SM contributions are normalized to their cross section from the LHC Higgs Cross Section Working Group (2013). Theoretical uncertainties in the renormalization and factorization scales, PDF, and branching fraction are added in quadrature. The error bars on data points reflect both statistical and systematic uncertainties. The last bin of $ {p_{\mathrm {T}}^{\gamma \gamma }} $ distribution sums the events above 200 GeV . For each graph, the bottom panel shows the ratio of data to theoretical predictions from POWHEG generator. |
png pdf |
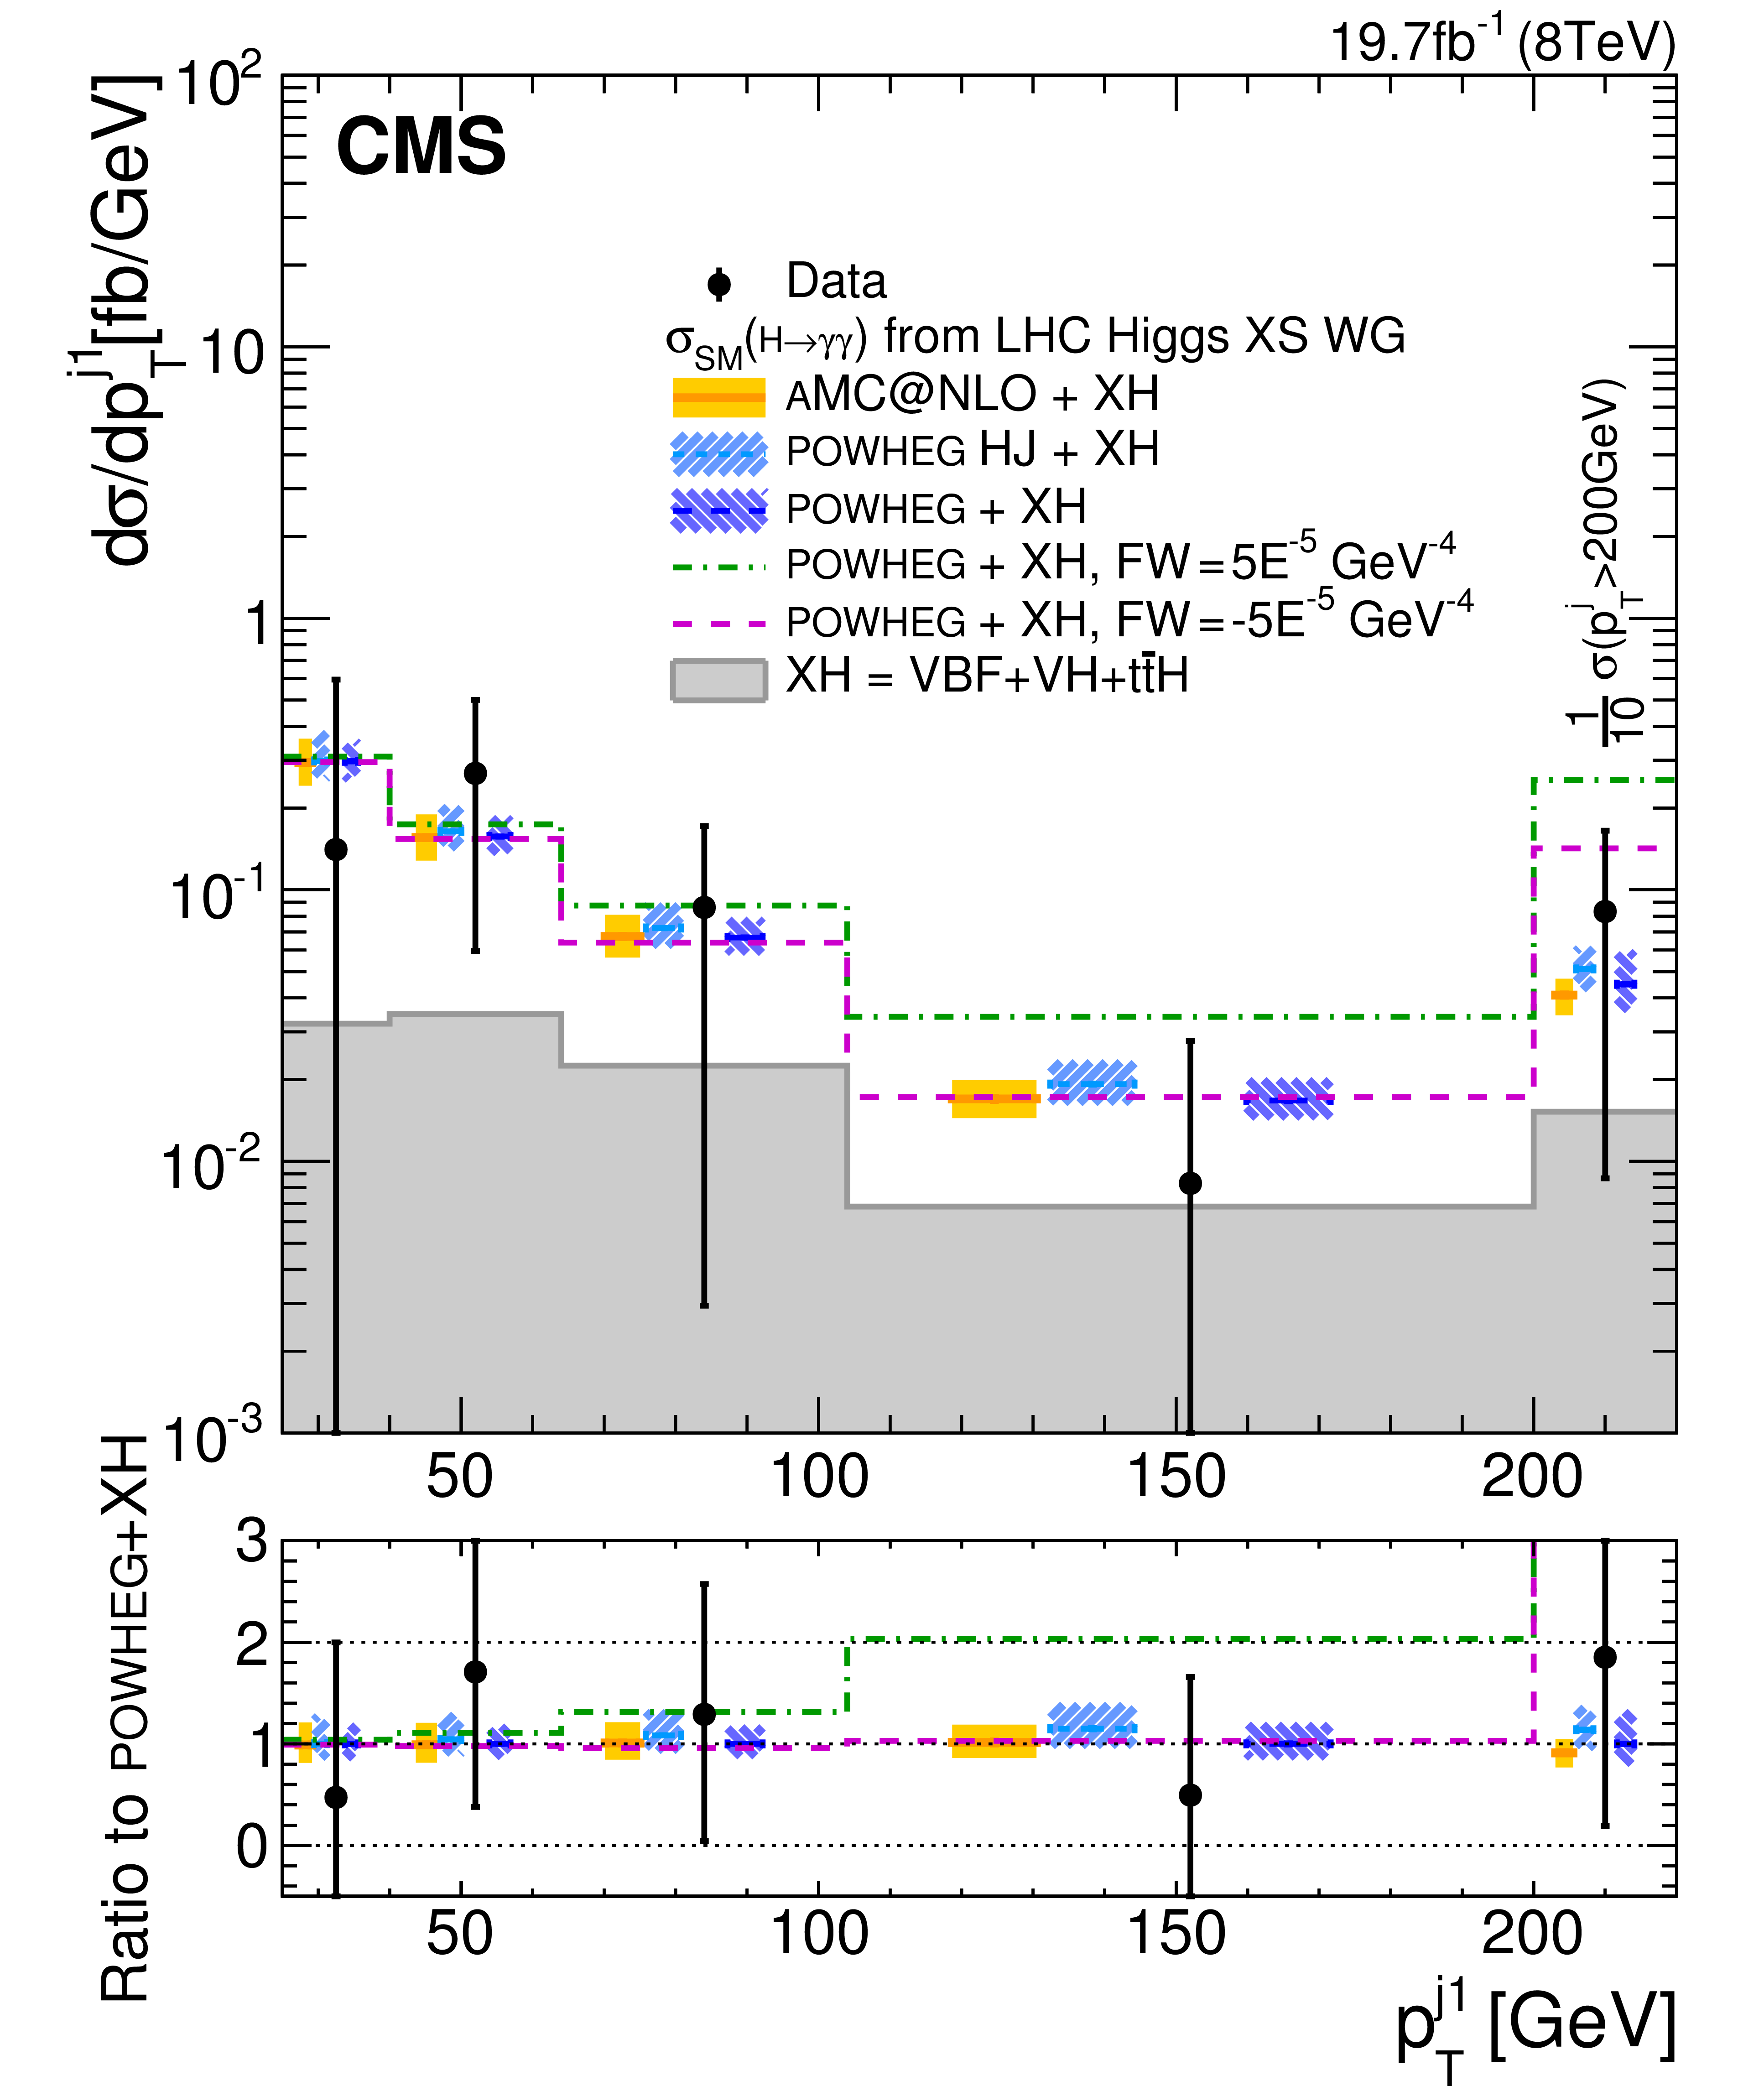
Figure 5-a:
The $ { {\mathrm {H}} \to {\gamma } {\gamma }} $ differential cross section for H+jets events as a function of (a) $ { {p_{\mathrm {T}}} ^\mathrm {j1}} $, (b) $ { {| y^{\gamma \gamma }-y^{\mathrm {j1}} | }} $, (c) $ {N_\text {jets}} $, with jets within $ {| \eta | }<2.5$, and (d) $ {m_\mathrm {jj}} $ with jets within $ {| \eta | }<4.7$. All the SM contributions are normalized to their cross section from the LHC Higgs Cross Section Working Group (2013). Theoretical uncertainties in the renormalization and factorization scales, PDF, and branching fraction are added in quadrature. The error bars on data points reflect both statistical and systematic uncertainties. In each distribution, the last bin corresponds to the sum over the events beyond the bins shown in the figure. For each graph, the bottom panel shows the ratio of data to theoretical predictions from POWHEG generator. |
png pdf |
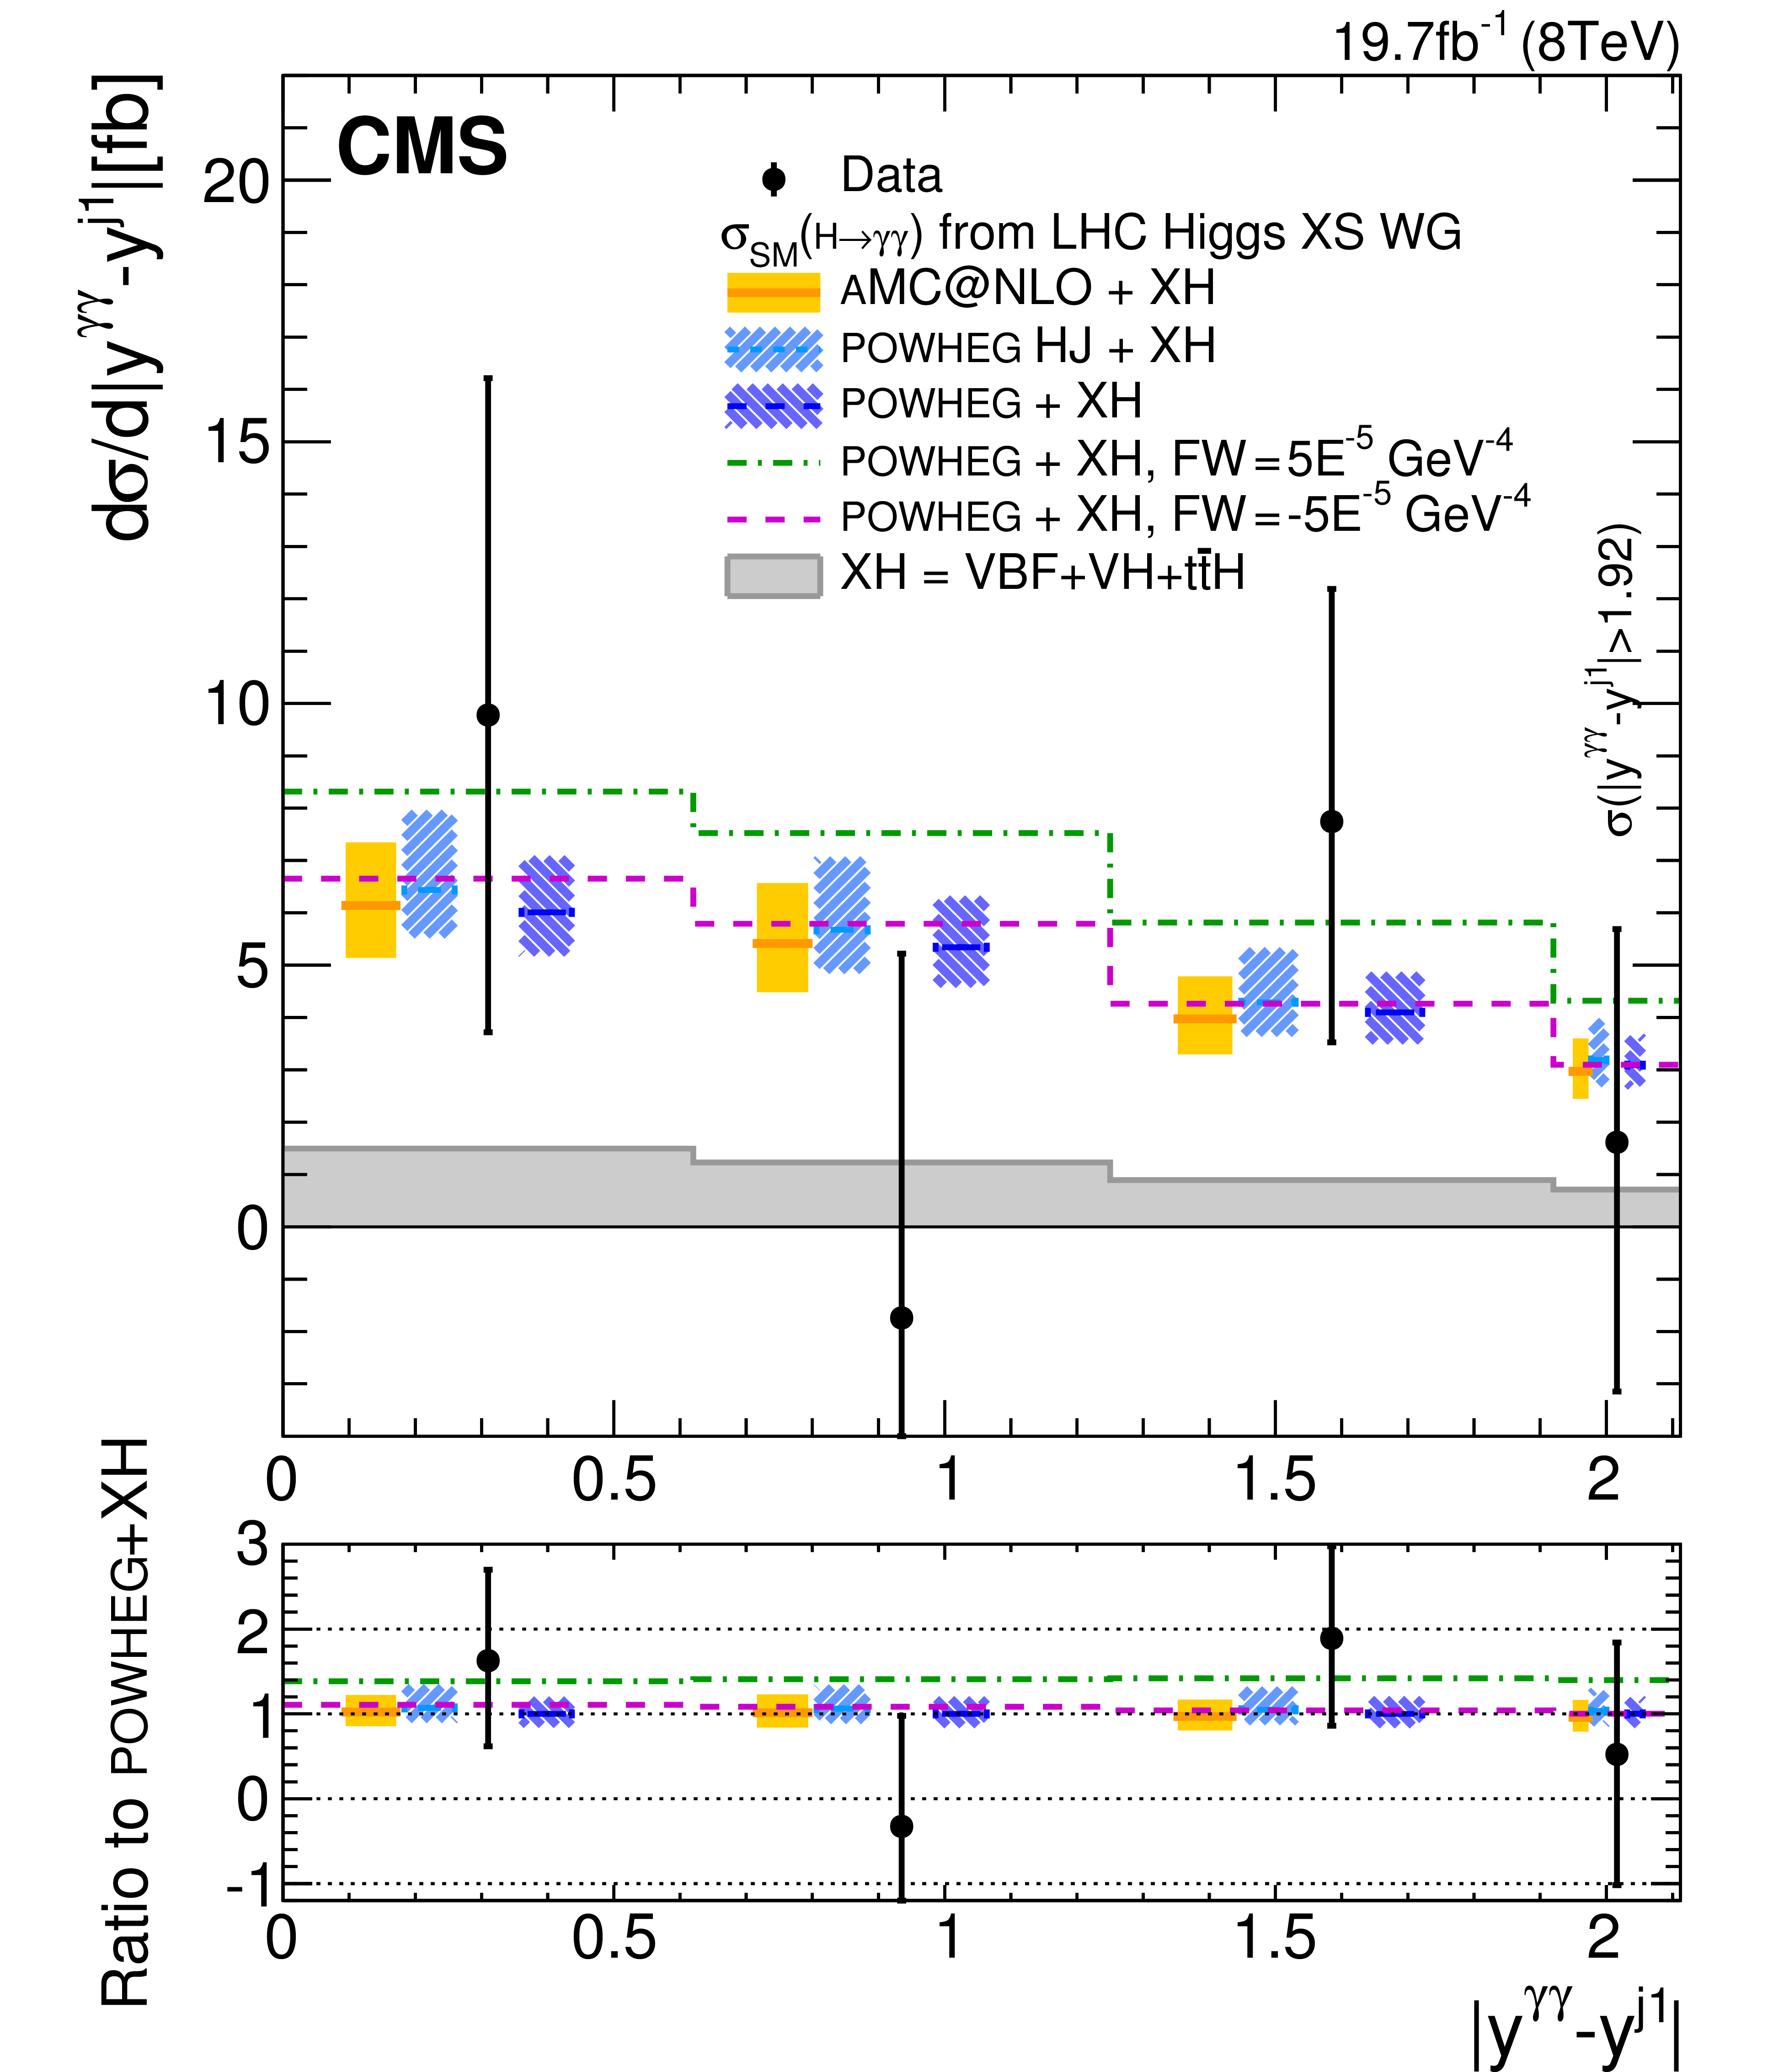
Figure 5-b:
The $ { {\mathrm {H}} \to {\gamma } {\gamma }} $ differential cross section for H+jets events as a function of (a) $ { {p_{\mathrm {T}}} ^\mathrm {j1}} $, (b) $ { {| y^{\gamma \gamma }-y^{\mathrm {j1}} | }} $, (c) $ {N_\text {jets}} $, with jets within $ {| \eta | }<2.5$, and (d) $ {m_\mathrm {jj}} $ with jets within $ {| \eta | }<4.7$. All the SM contributions are normalized to their cross section from the LHC Higgs Cross Section Working Group (2013). Theoretical uncertainties in the renormalization and factorization scales, PDF, and branching fraction are added in quadrature. The error bars on data points reflect both statistical and systematic uncertainties. In each distribution, the last bin corresponds to the sum over the events beyond the bins shown in the figure. For each graph, the bottom panel shows the ratio of data to theoretical predictions from POWHEG generator. |

png pdf |
Figure 5-c:
The $ { {\mathrm {H}} \to {\gamma } {\gamma }} $ differential cross section for H+jets events as a function of (a) $ { {p_{\mathrm {T}}} ^\mathrm {j1}} $, (b) $ { {| y^{\gamma \gamma }-y^{\mathrm {j1}} | }} $, (c) $ {N_\text {jets}} $, with jets within $ {| \eta | }<2.5$, and (d) $ {m_\mathrm {jj}} $ with jets within $ {| \eta | }<4.7$. All the SM contributions are normalized to their cross section from the LHC Higgs Cross Section Working Group (2013). Theoretical uncertainties in the renormalization and factorization scales, PDF, and branching fraction are added in quadrature. The error bars on data points reflect both statistical and systematic uncertainties. In each distribution, the last bin corresponds to the sum over the events beyond the bins shown in the figure. For each graph, the bottom panel shows the ratio of data to theoretical predictions from POWHEG generator. |
png pdf |
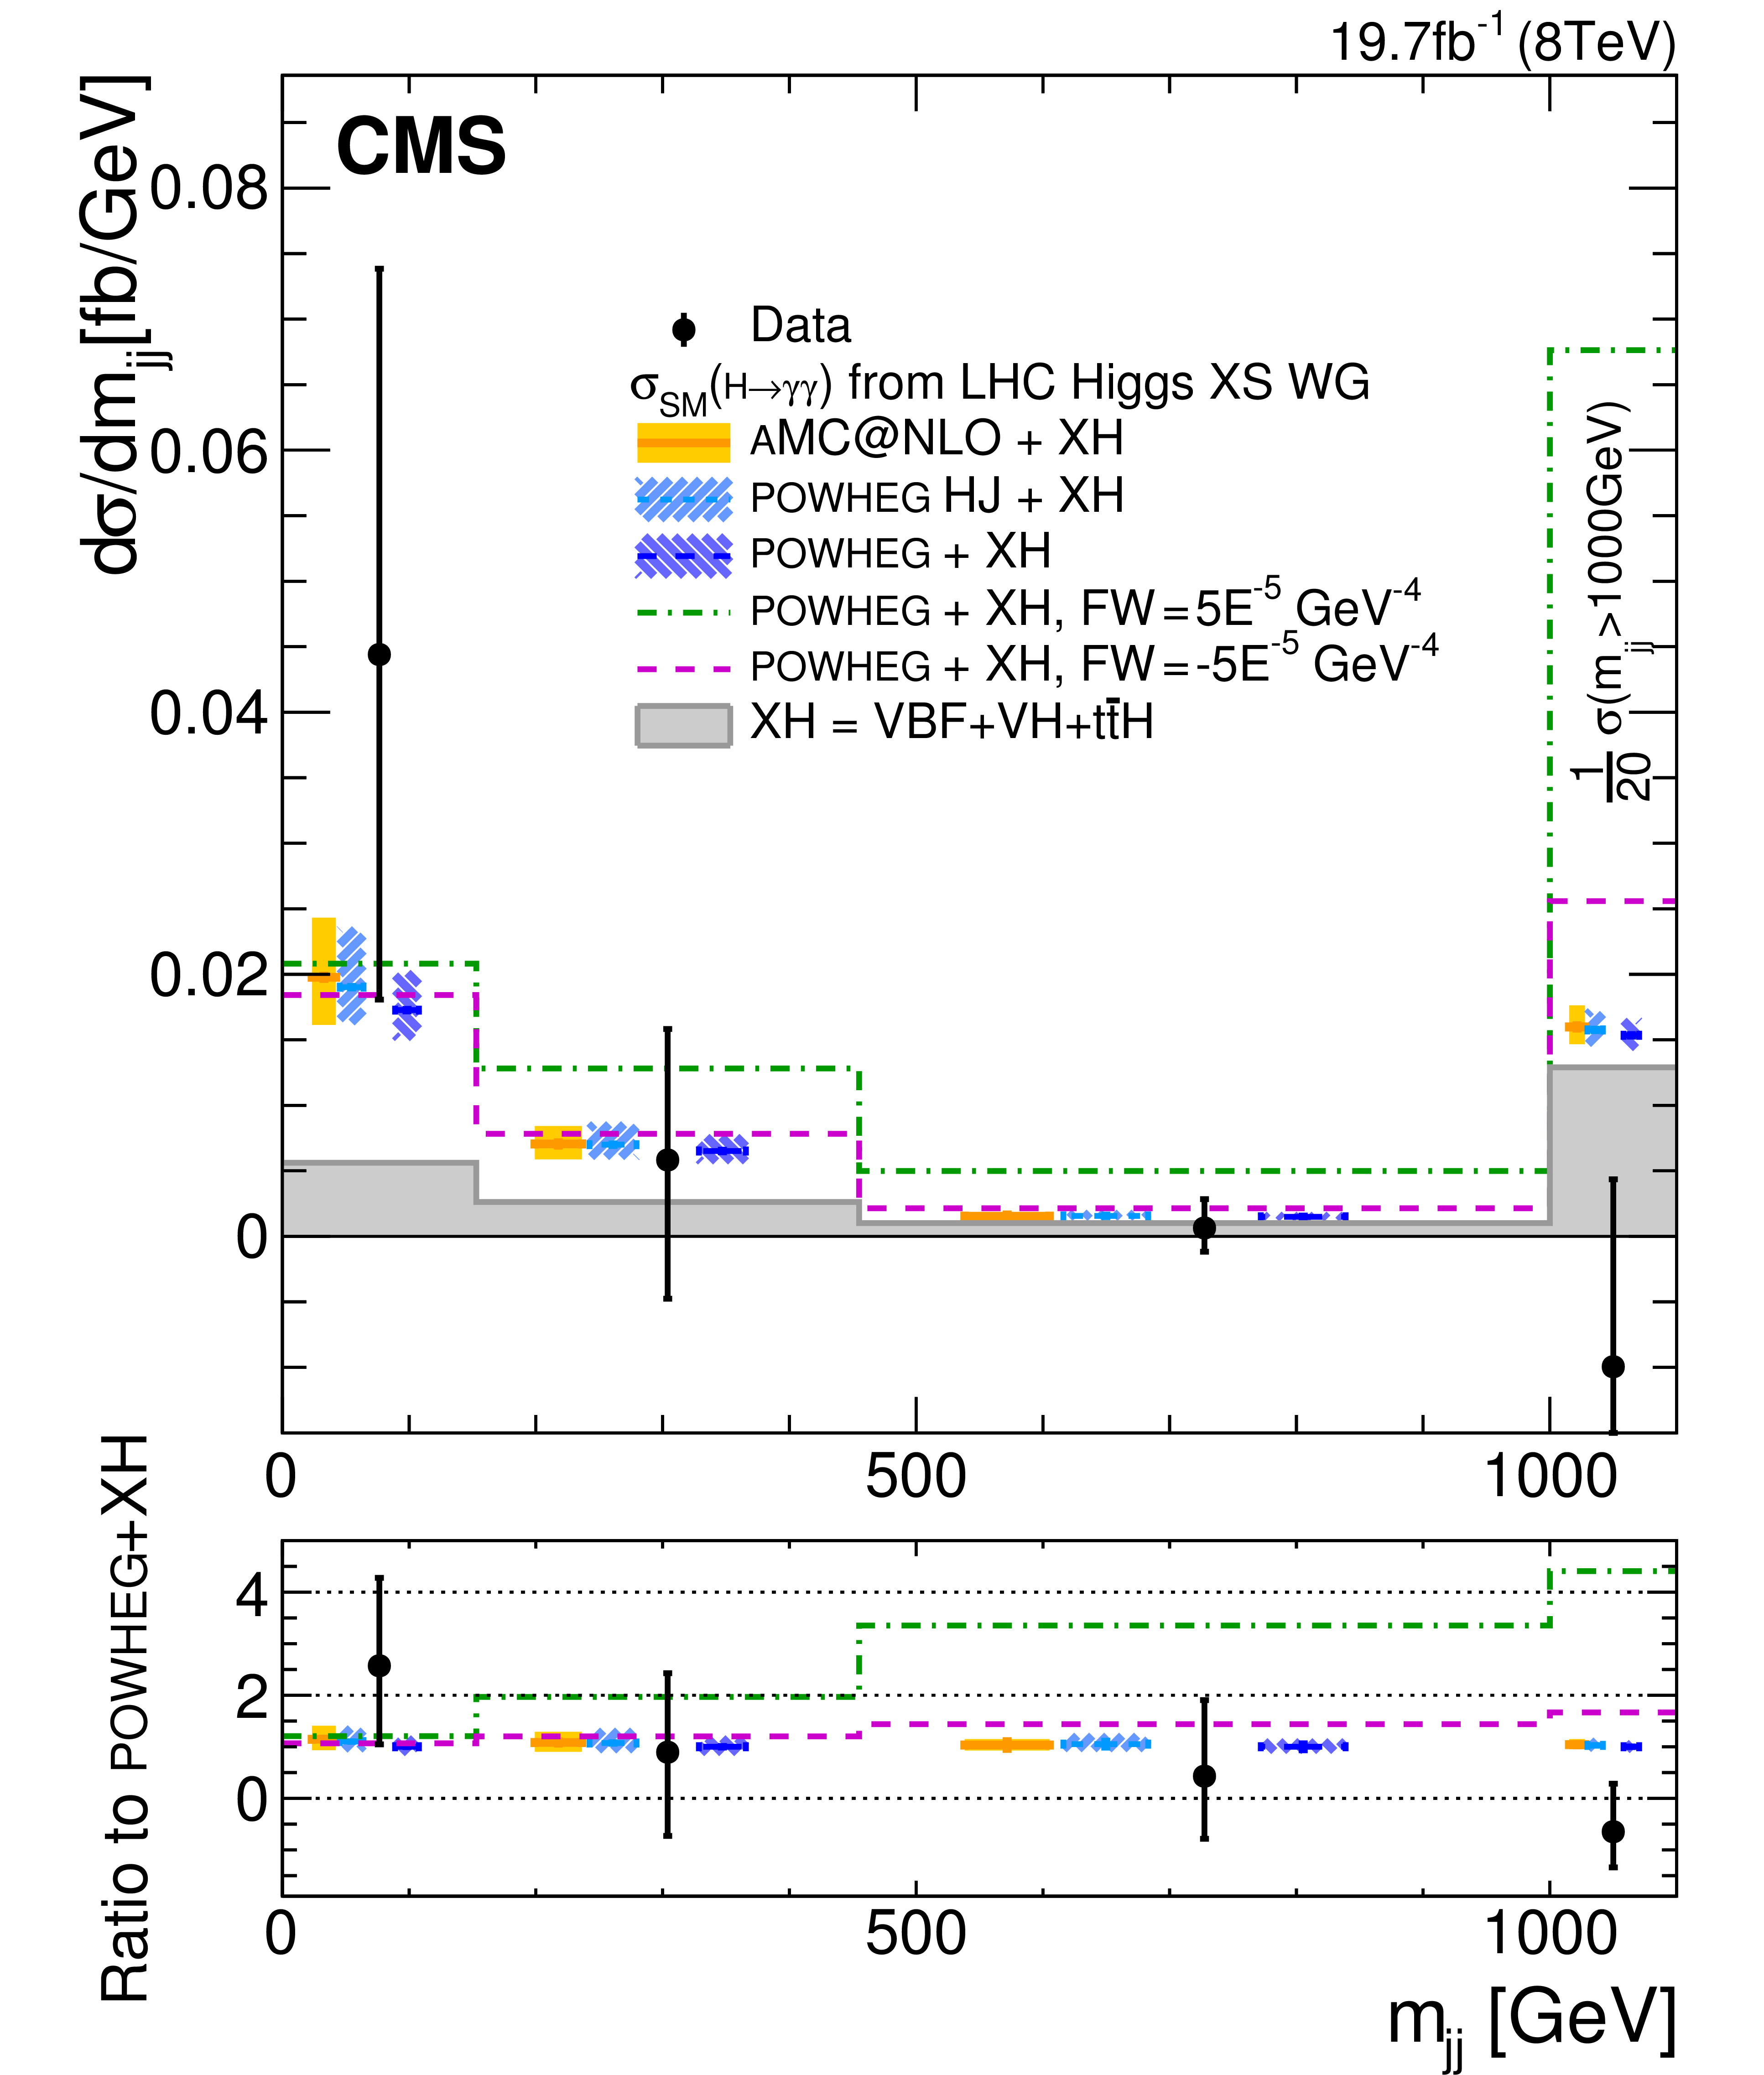
Figure 5-d:
The $ { {\mathrm {H}} \to {\gamma } {\gamma }} $ differential cross section for H+jets events as a function of (a) $ { {p_{\mathrm {T}}} ^\mathrm {j1}} $, (b) $ { {| y^{\gamma \gamma }-y^{\mathrm {j1}} | }} $, (c) $ {N_\text {jets}} $, with jets within $ {| \eta | }<2.5$, and (d) $ {m_\mathrm {jj}} $ with jets within $ {| \eta | }<4.7$. All the SM contributions are normalized to their cross section from the LHC Higgs Cross Section Working Group (2013). Theoretical uncertainties in the renormalization and factorization scales, PDF, and branching fraction are added in quadrature. The error bars on data points reflect both statistical and systematic uncertainties. In each distribution, the last bin corresponds to the sum over the events beyond the bins shown in the figure. For each graph, the bottom panel shows the ratio of data to theoretical predictions from POWHEG generator. |
png pdf |
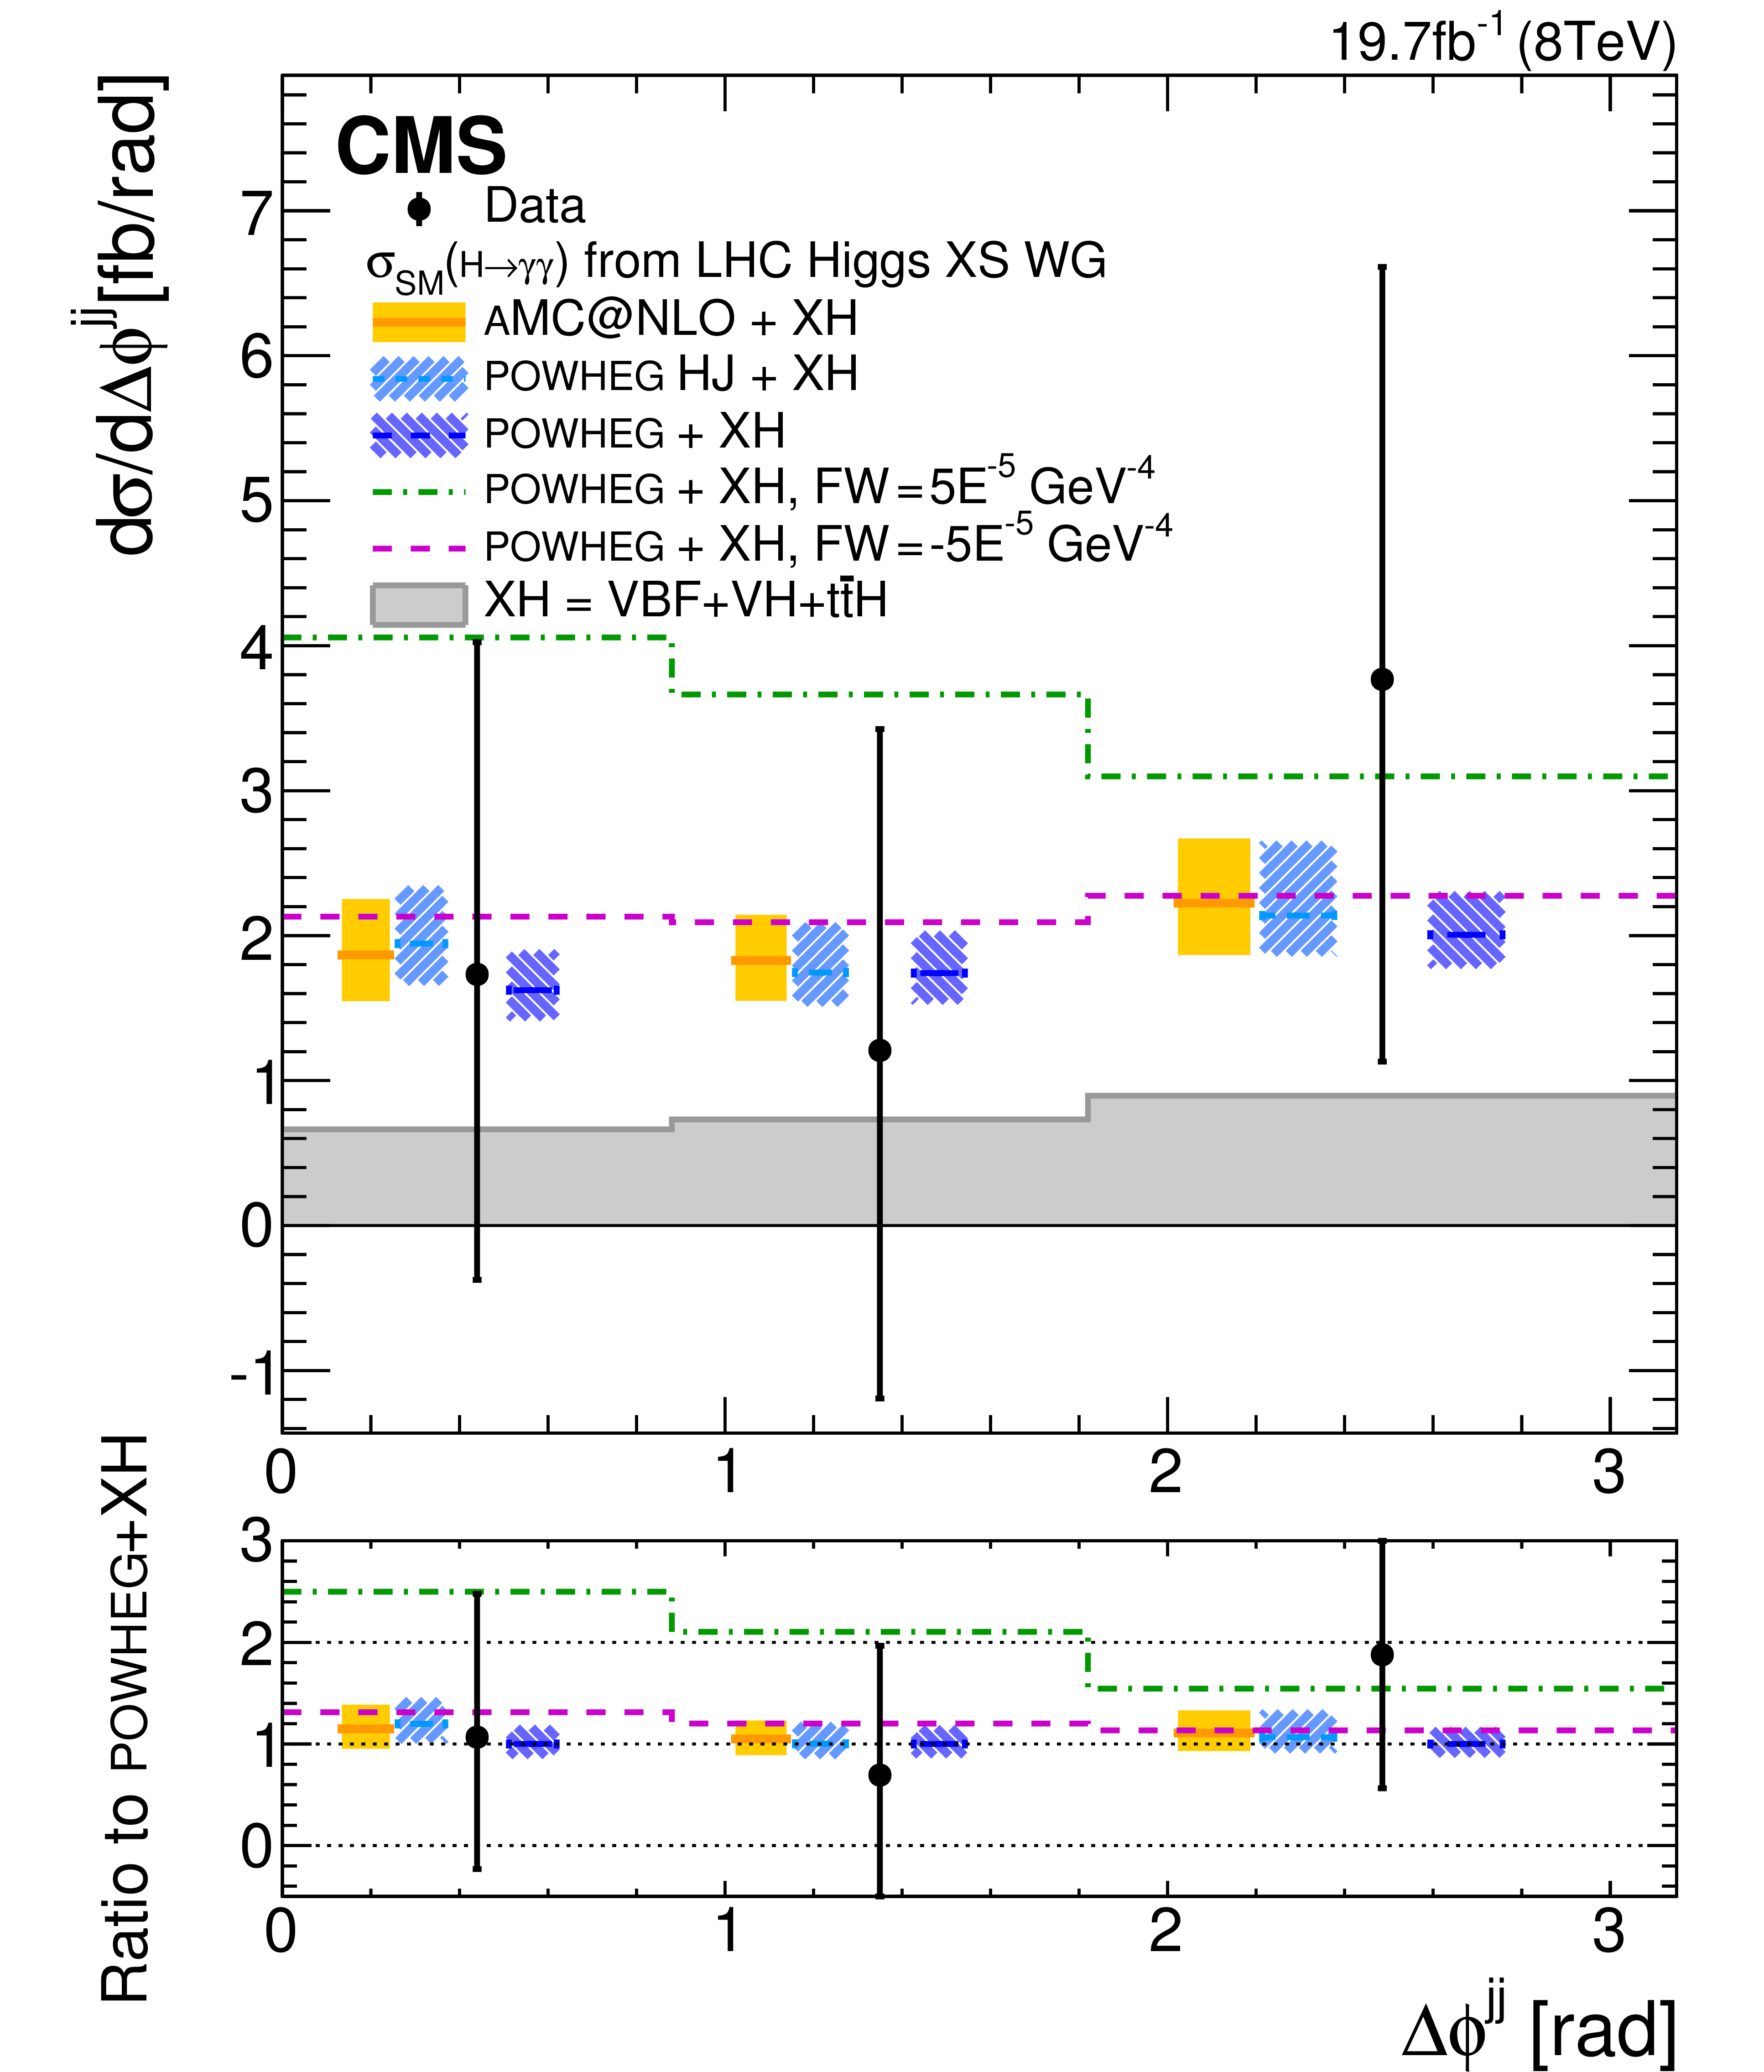
Figure 6-a:
The $ { {\mathrm {H}} \to {\gamma } {\gamma }} $ differential cross section for H+2 jets events, with jets within $ {| \eta | }<4.7$, as a function of (a) $ {\Delta \phi ^{\mathrm {jj}}} $, (b) $ {\Delta \eta ^{\mathrm {jj}}} $, (c) Zeppenfeld variable, and (d) $ {\Delta \phi ^{\gamma \gamma ,\mathrm {jj}}} $. All the SM contributions are normalized to their cross section from the LHC Higgs Cross Section Working Group (2013).. Theoretical uncertainties in the renormalization and factorization scales, PDF, and branching fraction are added in quadrature. The error bars on data points reflect both statistical and systematic uncertainties. In the Zeppenfeld distribution, the last bin sums the events with values above 1.2. For each graph, the bottom panel shows the ratio of data to theoretical predictions from POWHEG generator. |
png pdf |
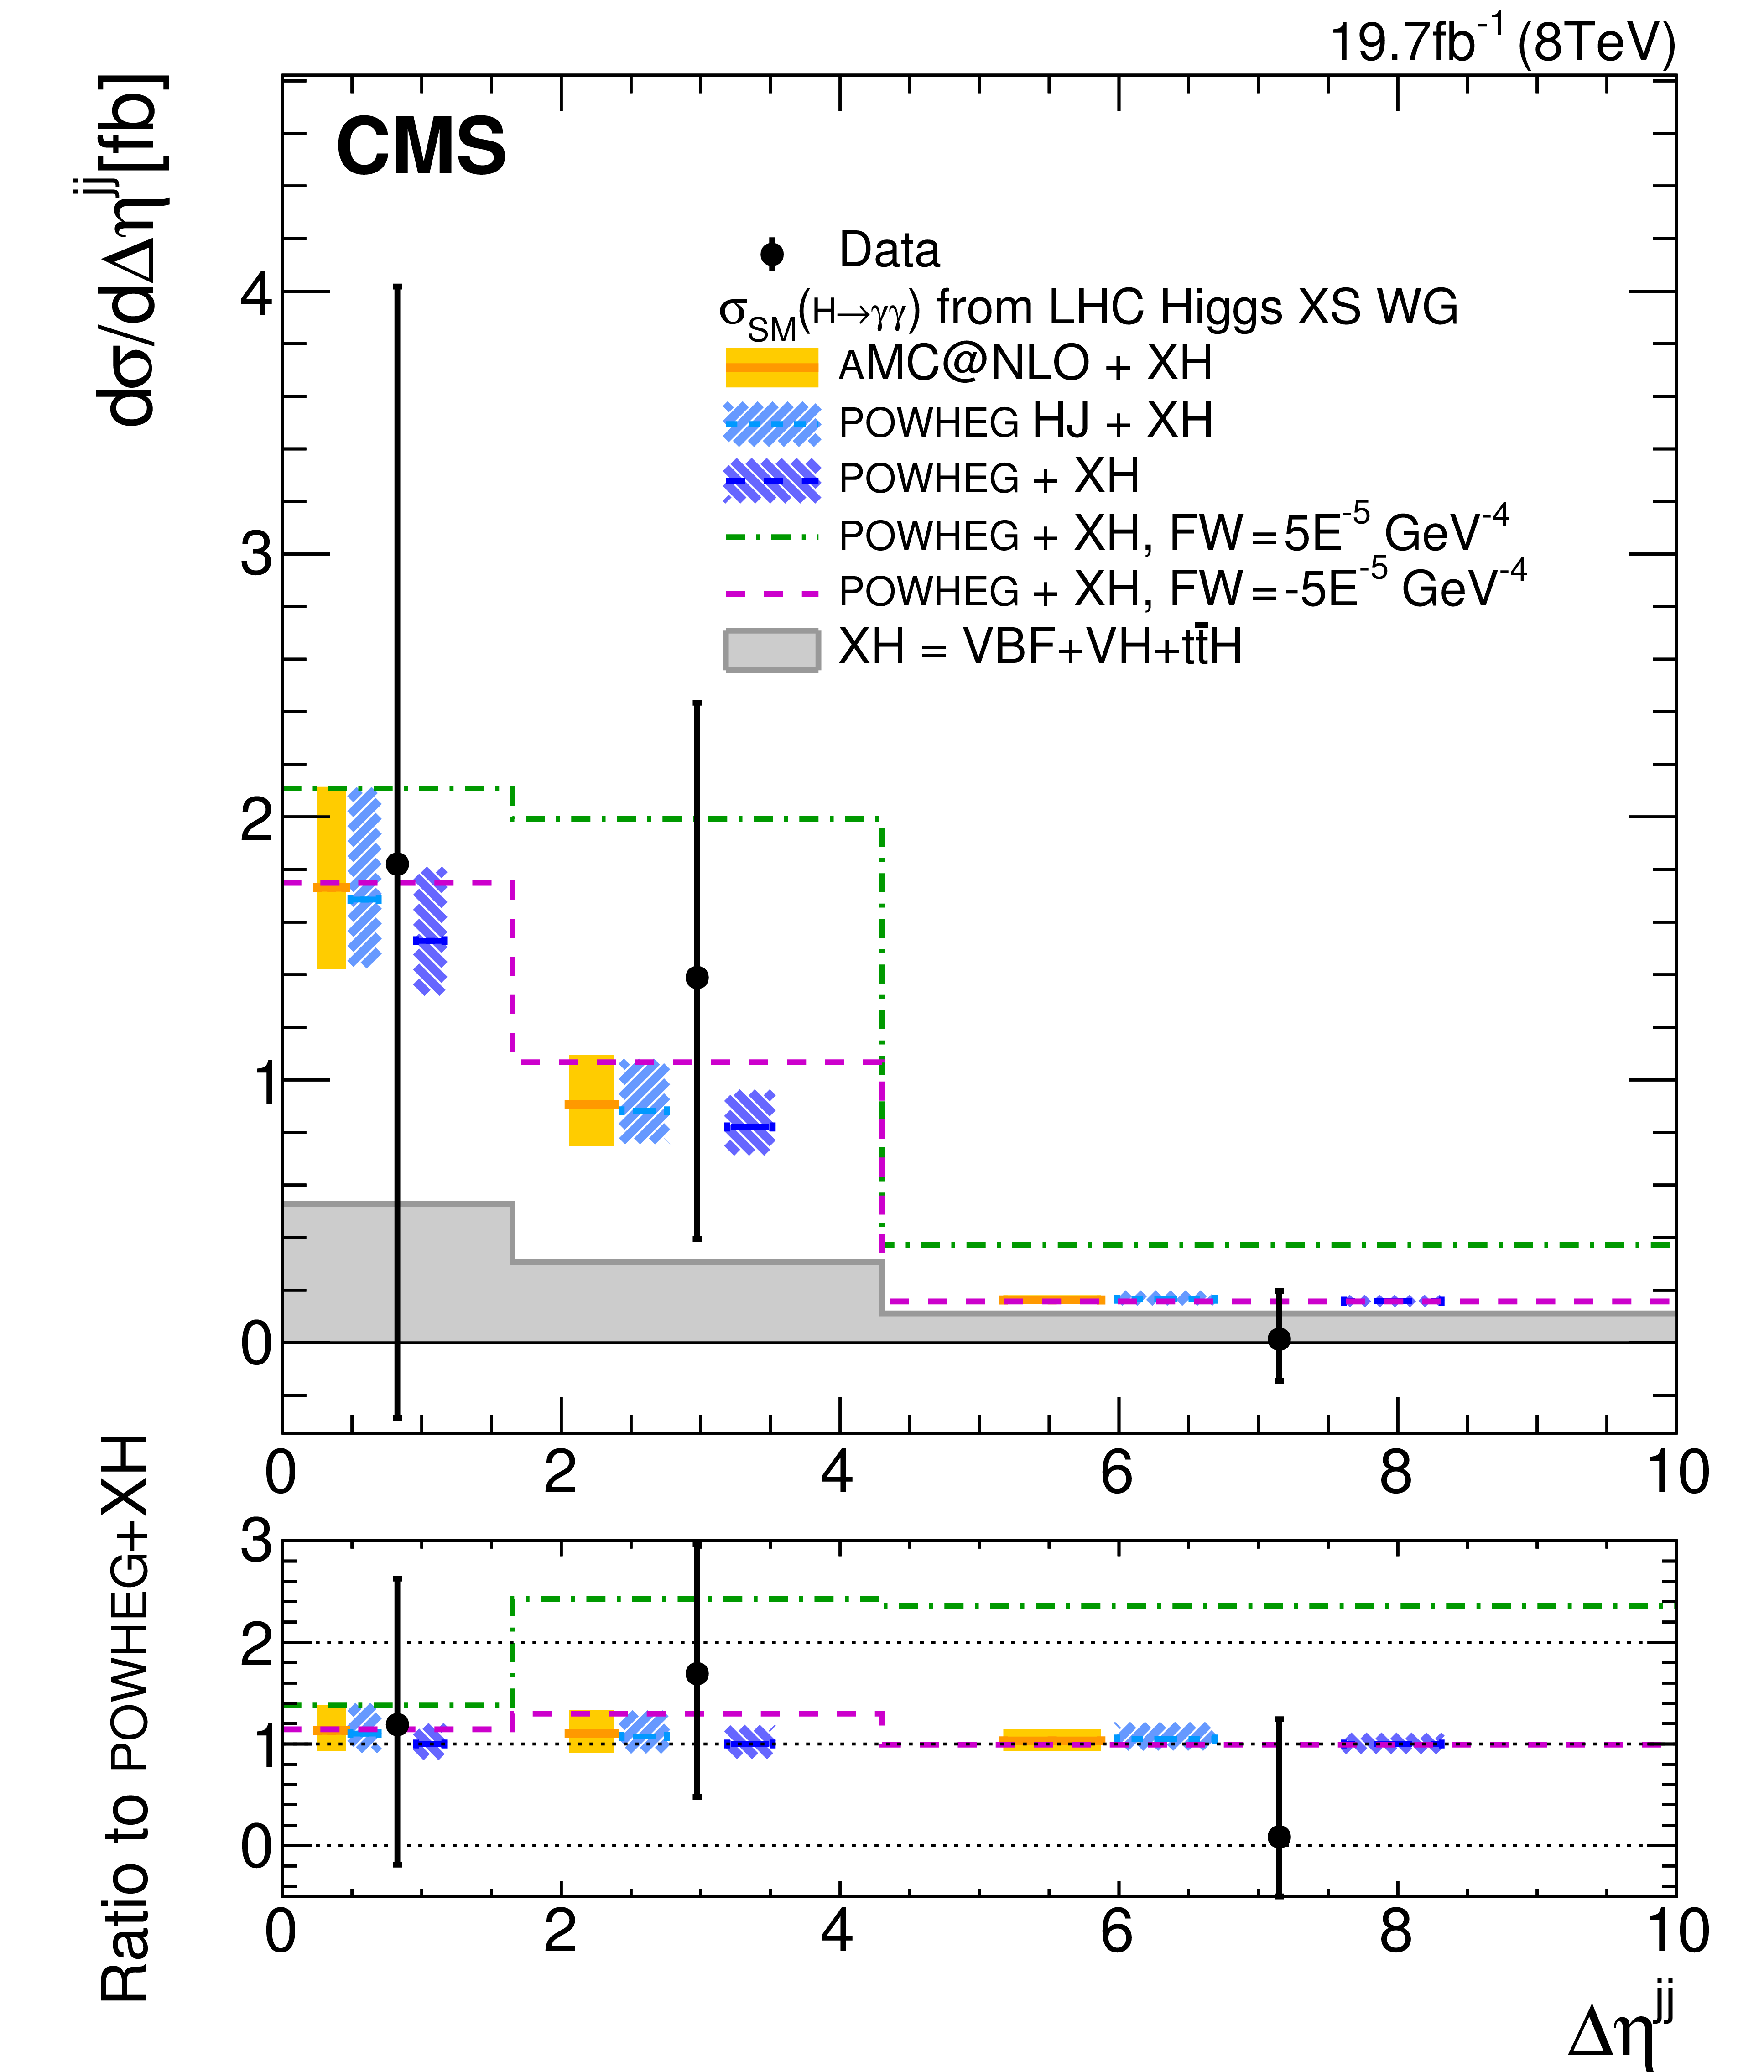
Figure 6-b:
The $ { {\mathrm {H}} \to {\gamma } {\gamma }} $ differential cross section for H+2 jets events, with jets within $ {| \eta | }<4.7$, as a function of (a) $ {\Delta \phi ^{\mathrm {jj}}} $, (b) $ {\Delta \eta ^{\mathrm {jj}}} $, (c) Zeppenfeld variable, and (d) $ {\Delta \phi ^{\gamma \gamma ,\mathrm {jj}}} $. All the SM contributions are normalized to their cross section from the LHC Higgs Cross Section Working Group (2013).. Theoretical uncertainties in the renormalization and factorization scales, PDF, and branching fraction are added in quadrature. The error bars on data points reflect both statistical and systematic uncertainties. In the Zeppenfeld distribution, the last bin sums the events with values above 1.2. For each graph, the bottom panel shows the ratio of data to theoretical predictions from POWHEG generator. |

png pdf |
Figure 6-c:
The $ { {\mathrm {H}} \to {\gamma } {\gamma }} $ differential cross section for H+2 jets events, with jets within $ {| \eta | }<4.7$, as a function of (a) $ {\Delta \phi ^{\mathrm {jj}}} $, (b) $ {\Delta \eta ^{\mathrm {jj}}} $, (c) Zeppenfeld variable, and (d) $ {\Delta \phi ^{\gamma \gamma ,\mathrm {jj}}} $. All the SM contributions are normalized to their cross section from the LHC Higgs Cross Section Working Group (2013).. Theoretical uncertainties in the renormalization and factorization scales, PDF, and branching fraction are added in quadrature. The error bars on data points reflect both statistical and systematic uncertainties. In the Zeppenfeld distribution, the last bin sums the events with values above 1.2. For each graph, the bottom panel shows the ratio of data to theoretical predictions from POWHEG generator. |
png pdf |
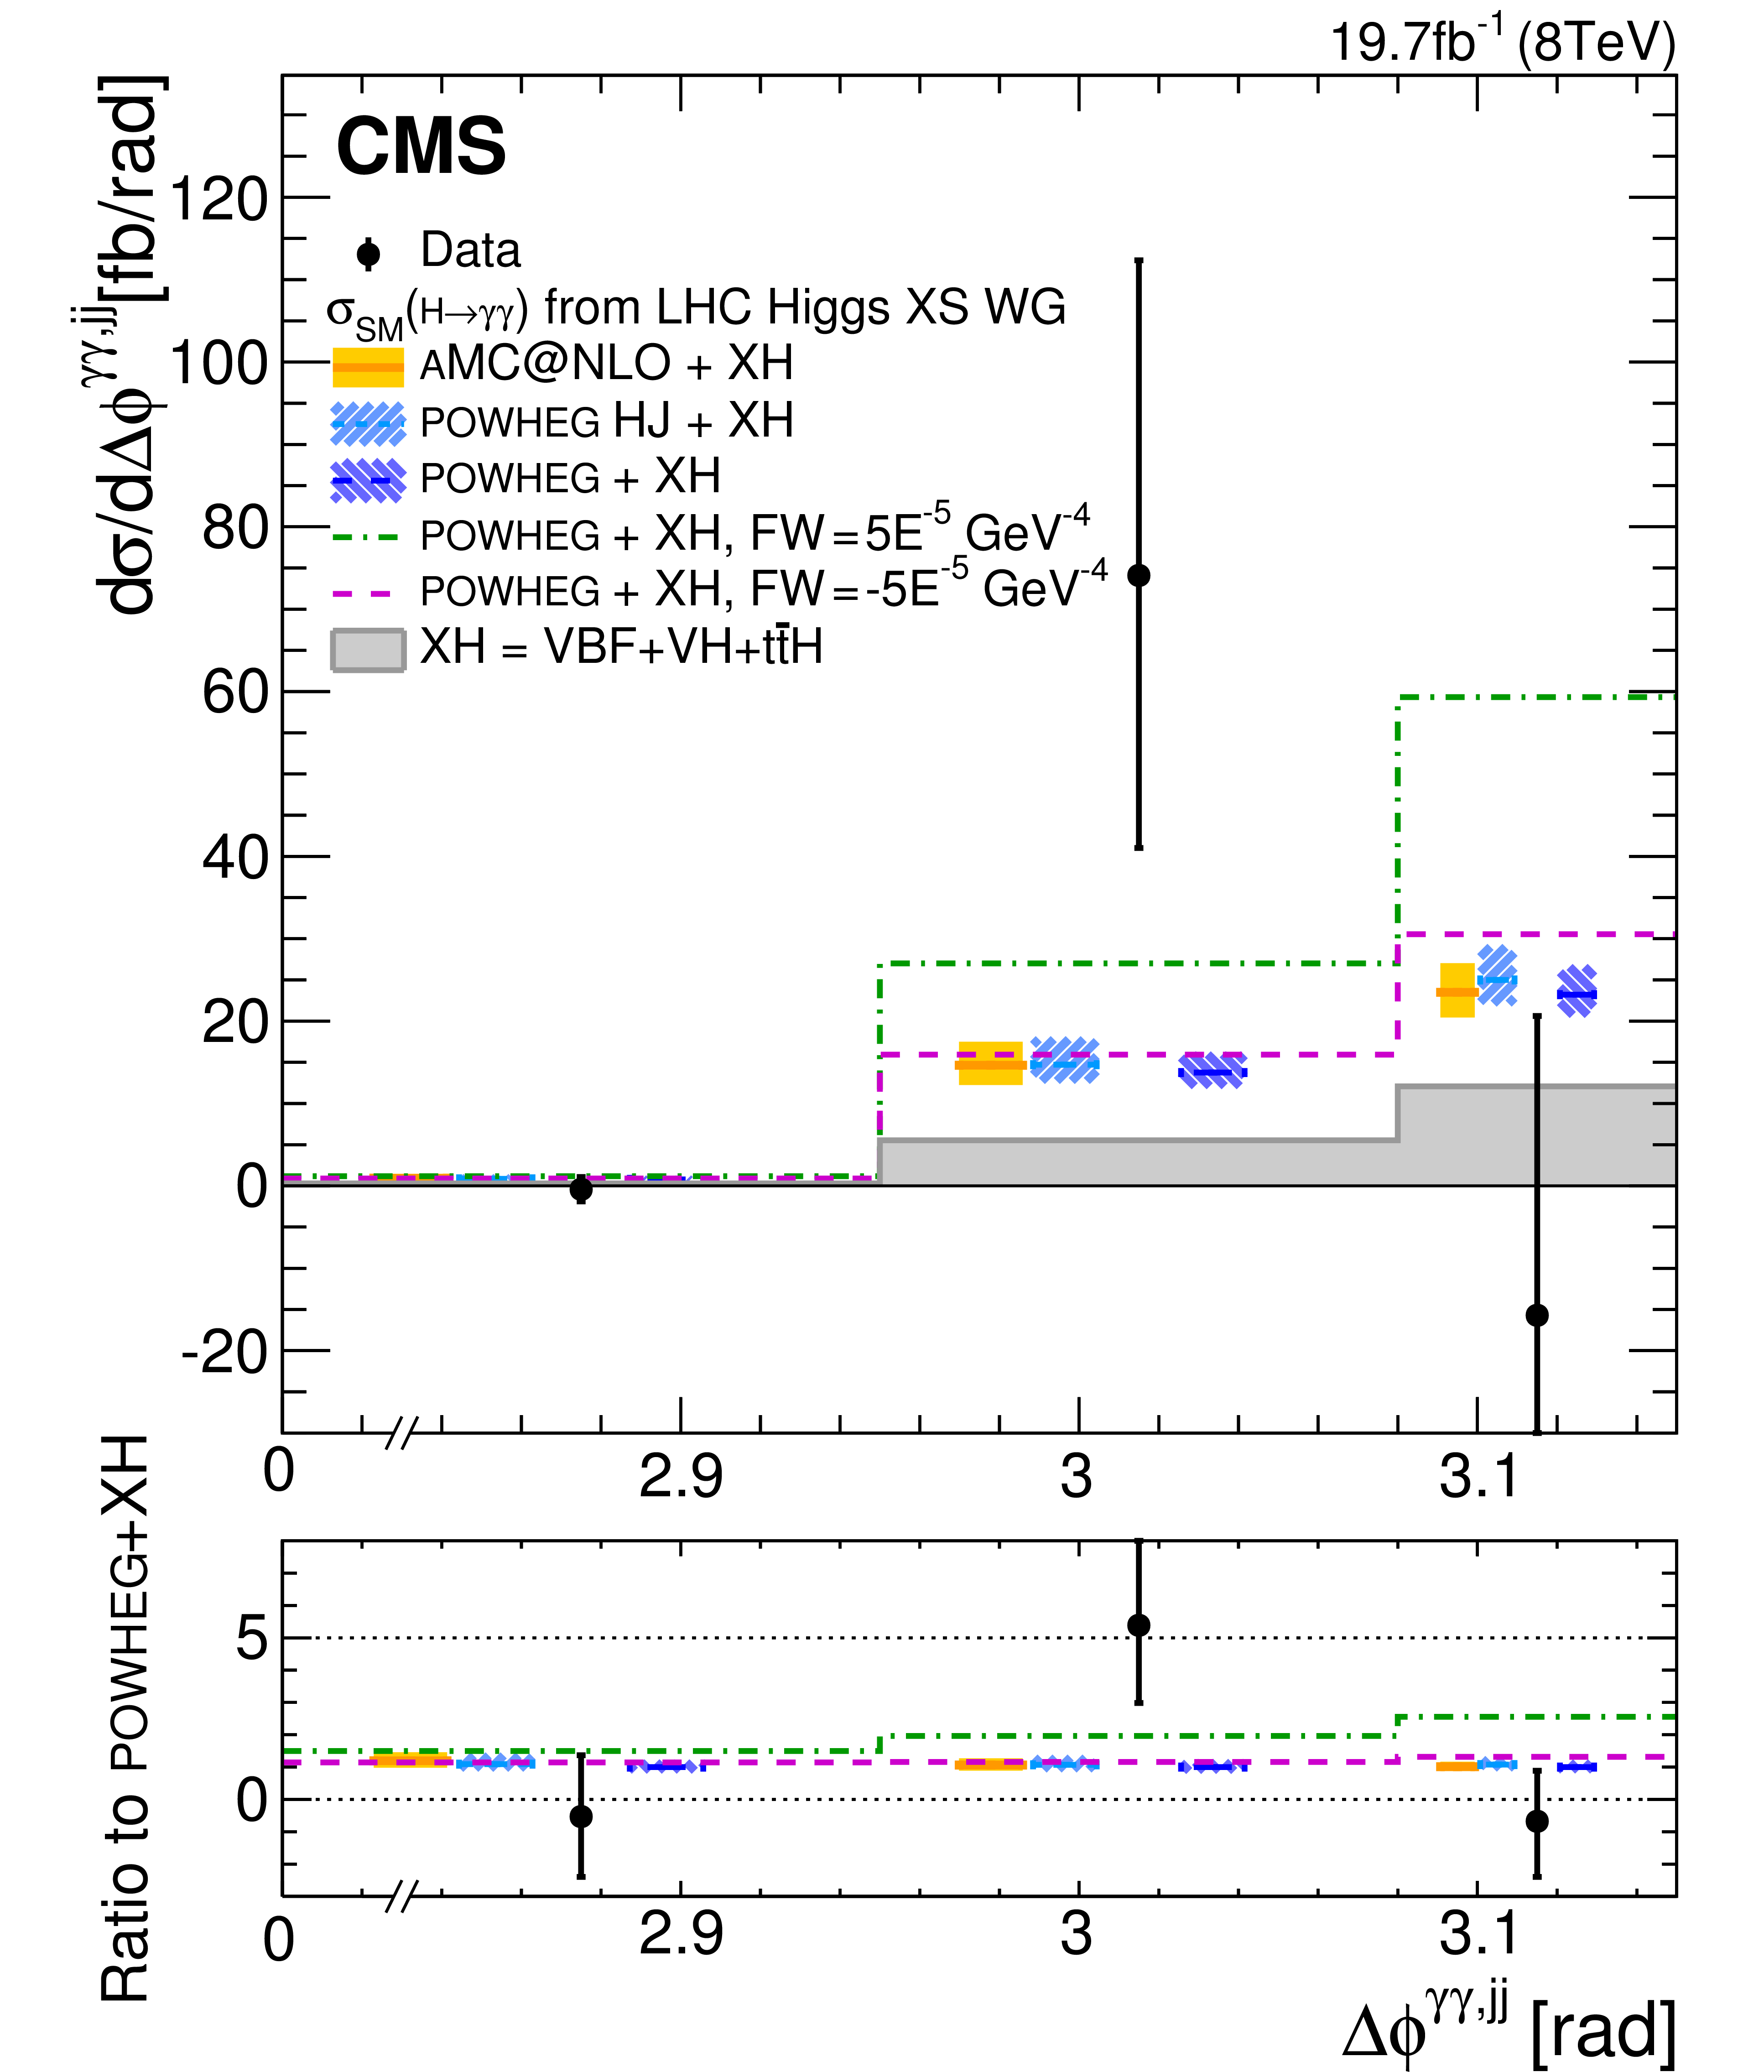
Figure 6-d:
The $ { {\mathrm {H}} \to {\gamma } {\gamma }} $ differential cross section for H+2 jets events, with jets within $ {| \eta | }<4.7$, as a function of (a) $ {\Delta \phi ^{\mathrm {jj}}} $, (b) $ {\Delta \eta ^{\mathrm {jj}}} $, (c) Zeppenfeld variable, and (d) $ {\Delta \phi ^{\gamma \gamma ,\mathrm {jj}}} $. All the SM contributions are normalized to their cross section from the LHC Higgs Cross Section Working Group (2013).. Theoretical uncertainties in the renormalization and factorization scales, PDF, and branching fraction are added in quadrature. The error bars on data points reflect both statistical and systematic uncertainties. In the Zeppenfeld distribution, the last bin sums the events with values above 1.2. For each graph, the bottom panel shows the ratio of data to theoretical predictions from POWHEG generator. |
| Tables | |

png pdf |
Table 1:
Values of the $ {\mathrm {p}} {\mathrm {p}} \to { {\mathrm {H}} \to {\gamma } {\gamma }} $ differential cross sections as a function of kinematic observables as measured in data and as predicted in SM simulations. For each observable the fit to $ {m_{\gamma \gamma }} $ is performed simultaneously in all the bins. Since the signal mass is profiled for each observable, the best fit $\hat{m}_{\mathrm {H}} $ varies from observable to observable. |
| Summary |
| A measurement was carried out of differential cross sections as a function of kinematic observables in the $\mathrm{H} \to \gamma \gamma$ decay channel, using data collected by the CMS experiment $\sqrt{s} =$ 8 TeV, corresponding to an integrated luminosity of 19.7 fb$^{-1}$. The measurement was performed for events with two isolated photons in the kinematic range $p_{\mathrm{T}}^{\gamma1} / m_{\gamma \gamma} >$ 1/3 and $p_{\mathrm{T}}^{\gamma2} / m_{\gamma \gamma} >$ 1/4, with photon pseudorapidities within $ | \eta | <$ 2.5. Photon identification was chosen to reduce the dependence of the measurement on the kinematics of the signal. Event classification relied on an estimator of diphoton mass resolution. The signal extraction and the unfolding of experimental resolution were performed simultaneously in all bins of the chosen observables. In this kinematic range, the fiducial cross section was measured to be 32 $\pm$ 10 fb. The differential cross section of the Higgs boson was measured, inclusively in the number of jets, as a function of its transverse momentum $ p_{\mathrm{T}}^{ \gamma \gamma }$, its rapidity $ | y ^{\gamma \gamma} | $, the Collins-Soper angular variable $ \cos \theta^{*}$, the difference in azimuthal angle between the two photons $\Delta \phi ^{ \gamma \gamma }$, and the number of associated jets $ N_{ \text{jets} }$. The transverse momentum of the leading jet $ p_{\mathrm{T}}^{ \mathrm{j}1 }$, and the difference in rapidity between the Higgs boson and the leading jet $ | y^{\gamma \gamma} - y^{ \mathrm{j}1 } | $ were determined in events with at least one accompanying jet. In events with at least two jets, measurements were made of the dijet mass $ m_{ \mathrm{jj} }$, the azimuth between the two jets $\Delta \phi^{ \mathrm{jj} }$, the pseudorapidity difference between the two jets $\Delta \eta^{ \mathrm{jj} }$, the Zeppenfeld variable $ | \eta^{\gamma \gamma } - ( \eta^{\mathrm{j1}} + \eta^{\mathrm{j2}} )/2 | $, and the azimuthal angle between the Higgs boson and the dijet system $ \Delta \phi^{\mathrm {\gamma \gamma, jj} }$. The differential cross sections were compared with several SM and beyond SM calculations, and found to be compatible with the SM predictions within statistical, systematic, and theoretical uncertainties. |
|
|
Compact Muon Solenoid LHC, CERN |
|

|

|

|

|

|