

Compact Muon Solenoid
LHC, CERN
| CMS-HIN-13-007 ; CERN-PH-EP-2015-054 | ||
| Study of W boson production in pPb collisions at $ \sqrt{s_{\mathrm{NN}}} $ = 5.02 TeV | ||
| CMS Collaboration | ||
| 20 March 2015 | ||
| Phys. Lett. B 750 (2015) 565 | ||
| Abstract: The first study of W boson production in pPb collisions is presented, for bosons decaying to a muon or electron, and a neutrino. The measurements are based on a data sample corresponding to an integrated luminosity of 34.6 nb$^{−1}$ at a nucleon-nucleon centre-of-mass energy of $ \sqrt{ s_{\mathrm{NN}} }$ = 5.02 TeV, collected by the CMS experiment. The W boson differential cross sections, lepton charge asymmetry, and forward-backward asymmetries are measured for leptons of transverse momentum exceeding 25 GeV/$c$, and as a function of the lepton pseudorapidity in the $ | \eta_{\mathrm{lab}}| $ lower than 2.4 range. Deviations from the expectations based on currently available parton distribution functions are observed, showing the need for including W boson data in nuclear parton distribution global fits. | ||
| Links: e-print arXiv:1503.05825 [nucl-ex] (PDF) ; CDS record ; inSPIRE record ; Public twiki page ; HepData record ; CADI line (restricted) ; | ||
| Figures | |
png pdf |
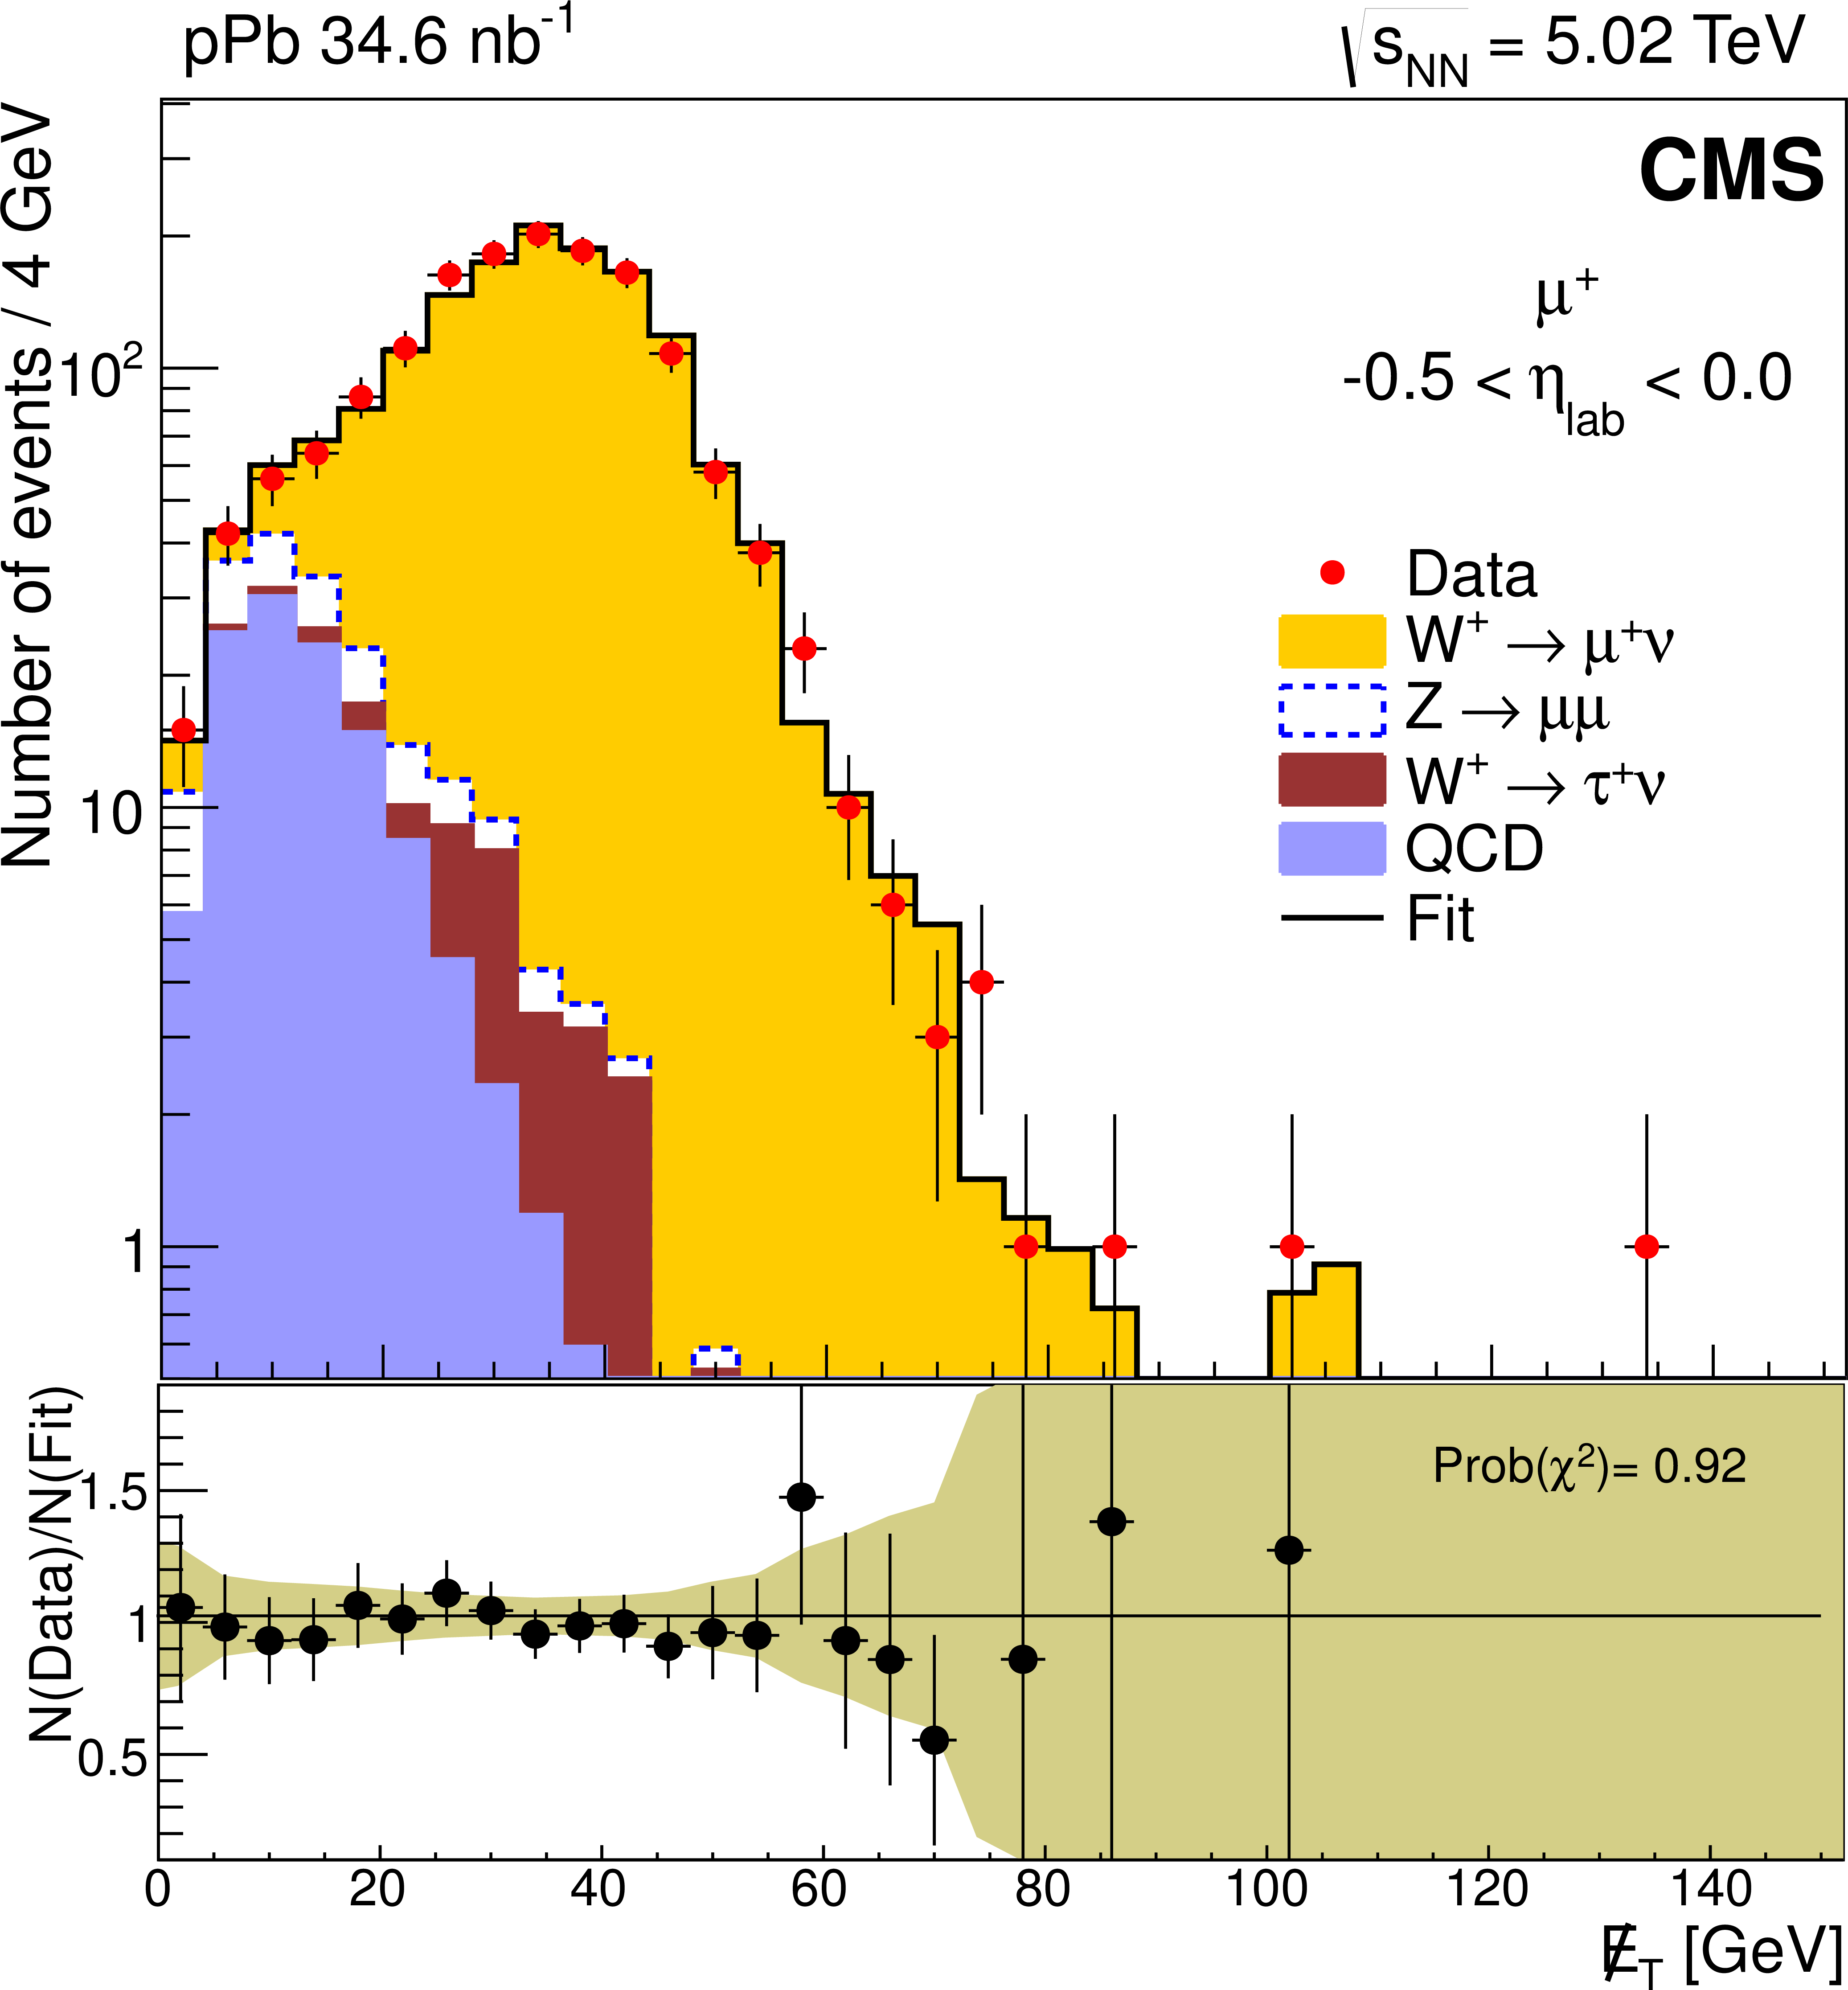
Figure 1-a:
Missing transverse energy distribution for $ {\mathrm {W^+}}\to {{\mu ^+}}\nu $ (a, c) and $ {\mathrm {W^+}}\to {\mathrm {e}^+}\nu $ (b, d) events within the $-0.5 < \eta _\text {lab}< 0.0$ (a, b) and $2.0 < \eta _\text {lab}< 2.4$ (c, d) ranges. Binned fits to the data (red points) are performed with four contributions, stacked from bottom to top: multijet (QCD, blue), $ {\mathrm {W^+}}\to \tau ^+ \nu $ (brown), $ {\mathrm {Z}}\to \ell \ell $ (white) and $ {\mathrm {W^+}}\to \ell ^+ \nu $ (yellow). The $\eta _\text {lab}$ regions are defined such that the proton is moving towards positive $\eta _\text {lab}$ values. Error bars represent statistical uncertainties. The lower panels display the data divided by the result of the fit, with the band representing the statistical uncertainties on the sum of the fit components, for each $E_{\mathrm {T}}$ bin. |
png pdf |
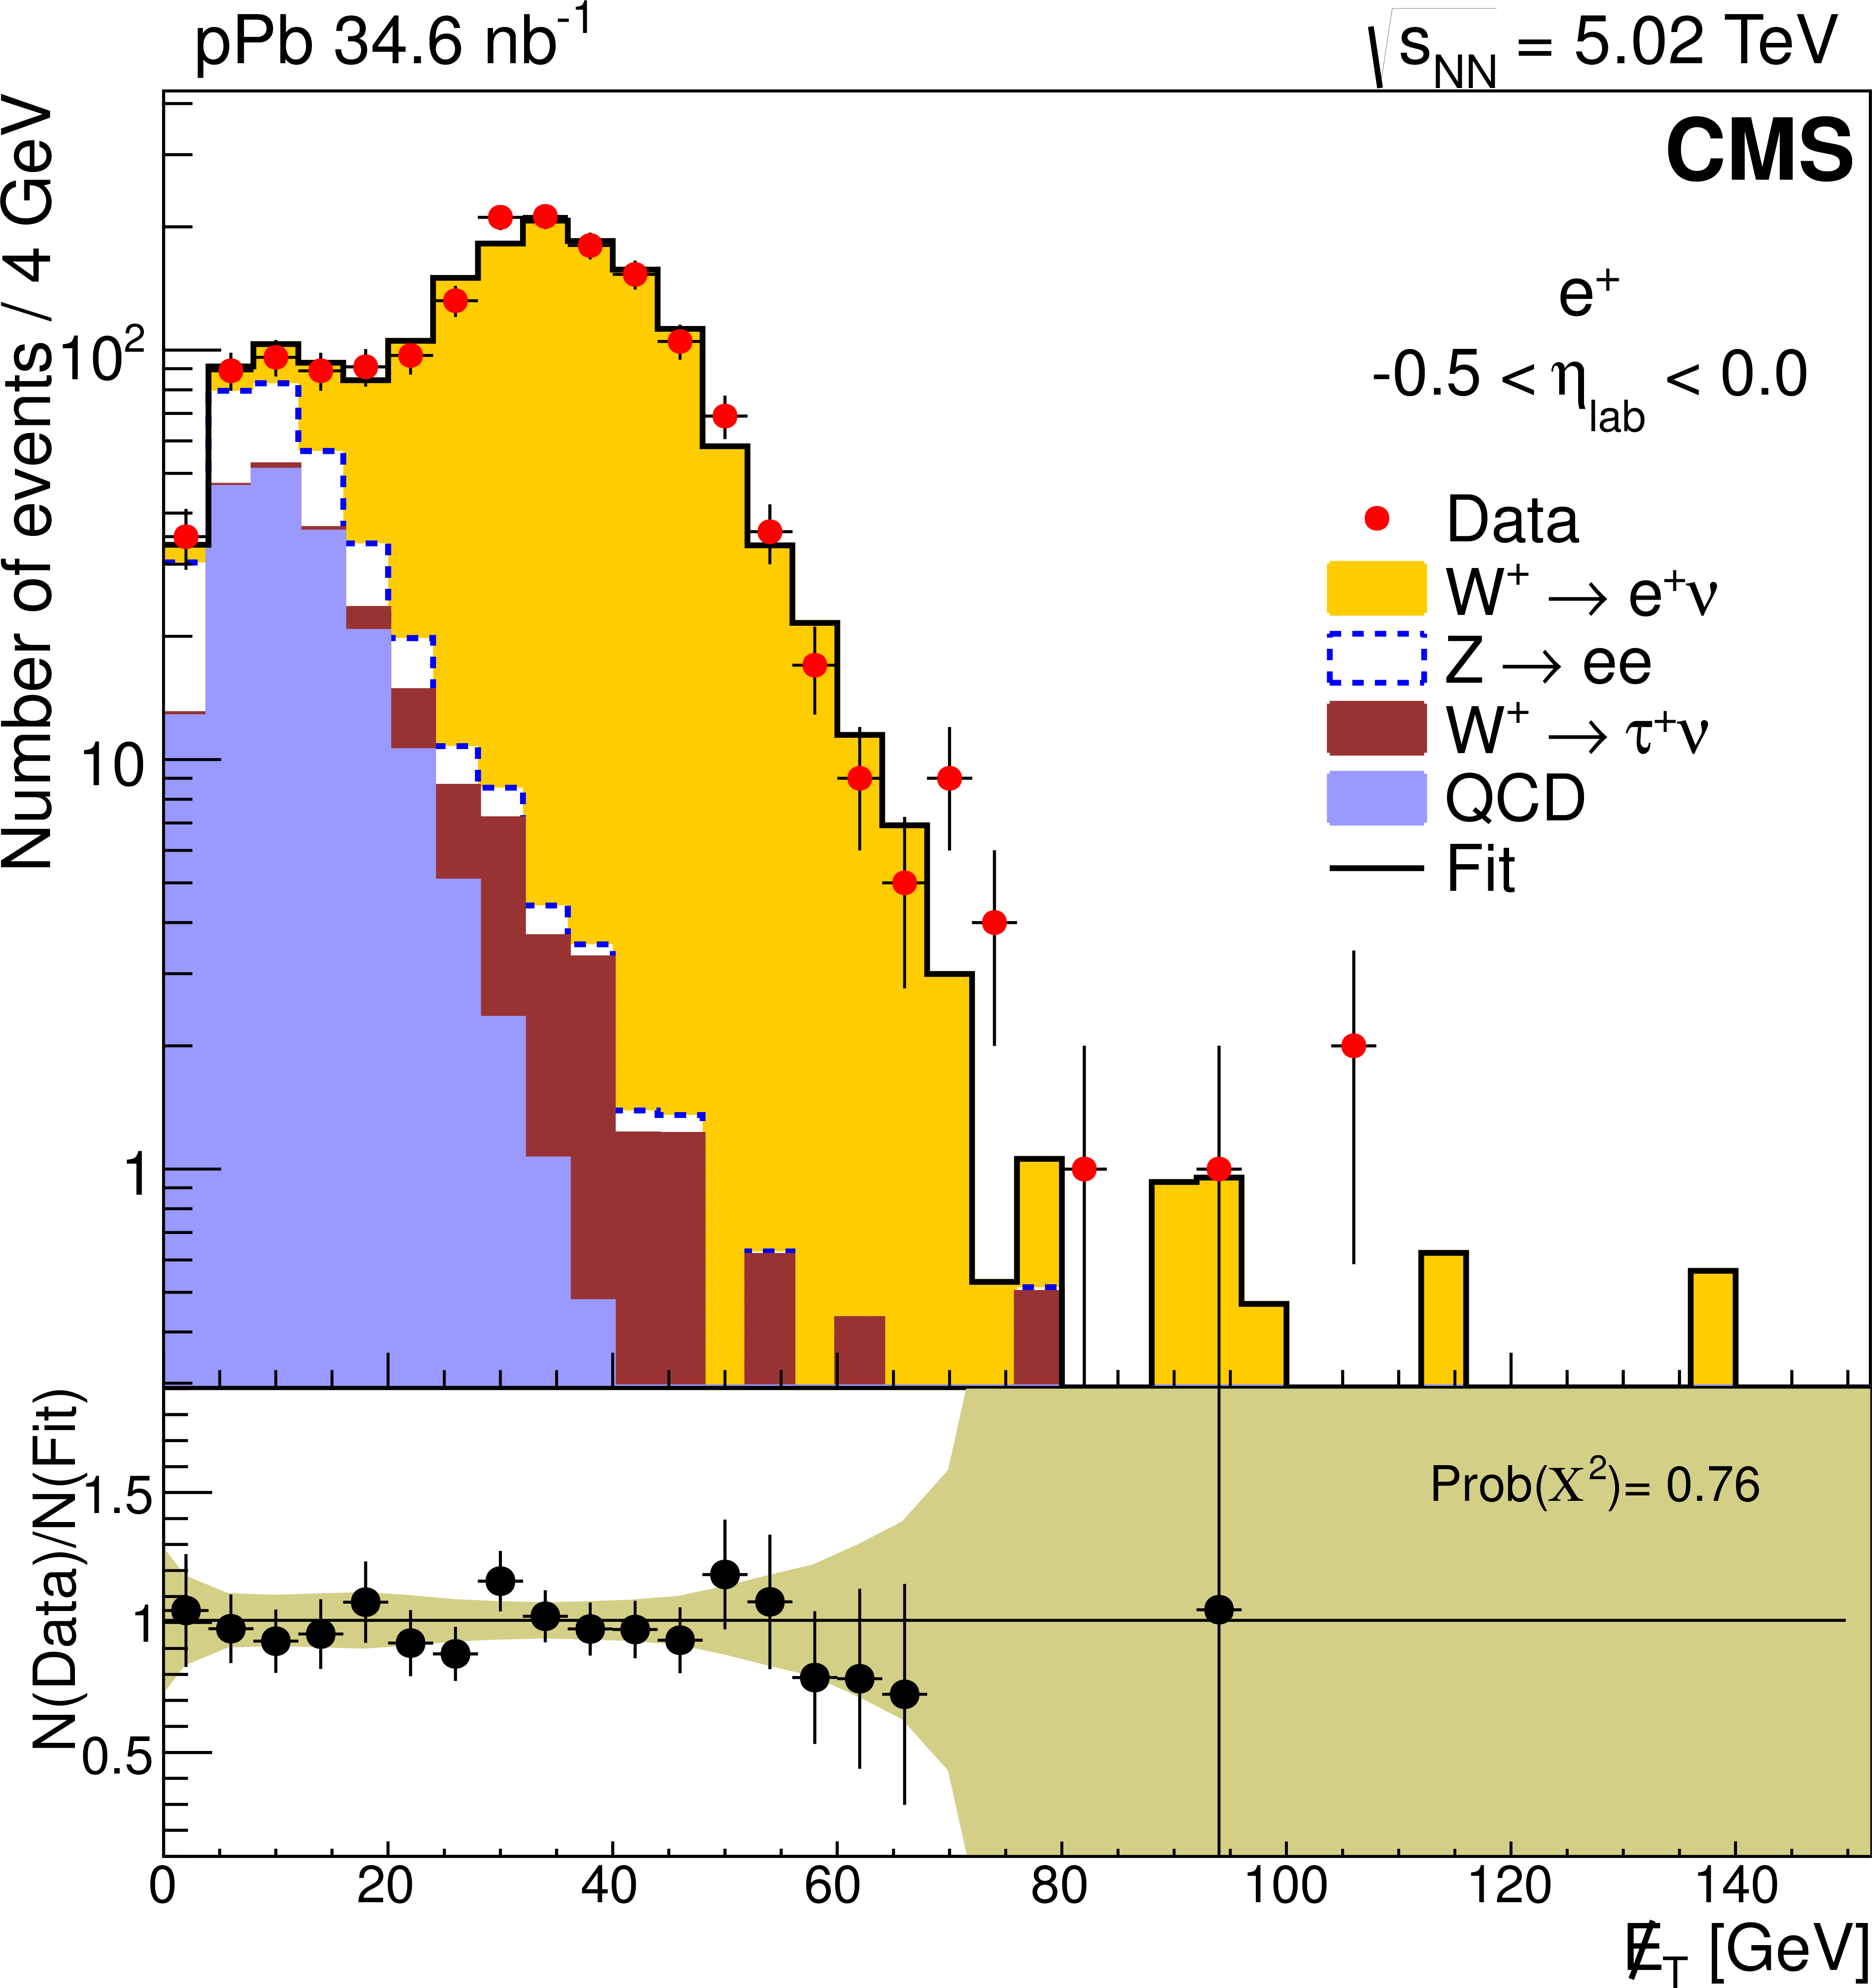
Figure 1-b:
Missing transverse energy distribution for $ {\mathrm {W^+}}\to {{\mu ^+}}\nu $ (a, c) and $ {\mathrm {W^+}}\to {\mathrm {e}^+}\nu $ (b, d) events within the $-0.5 < \eta _\text {lab}< 0.0$ (a, b) and $2.0 < \eta _\text {lab}< 2.4$ (c, d) ranges. Binned fits to the data (red points) are performed with four contributions, stacked from bottom to top: multijet (QCD, blue), $ {\mathrm {W^+}}\to \tau ^+ \nu $ (brown), $ {\mathrm {Z}}\to \ell \ell $ (white) and $ {\mathrm {W^+}}\to \ell ^+ \nu $ (yellow). The $\eta _\text {lab}$ regions are defined such that the proton is moving towards positive $\eta _\text {lab}$ values. Error bars represent statistical uncertainties. The lower panels display the data divided by the result of the fit, with the band representing the statistical uncertainties on the sum of the fit components, for each $E_{\mathrm {T}}$ bin. |
png pdf |
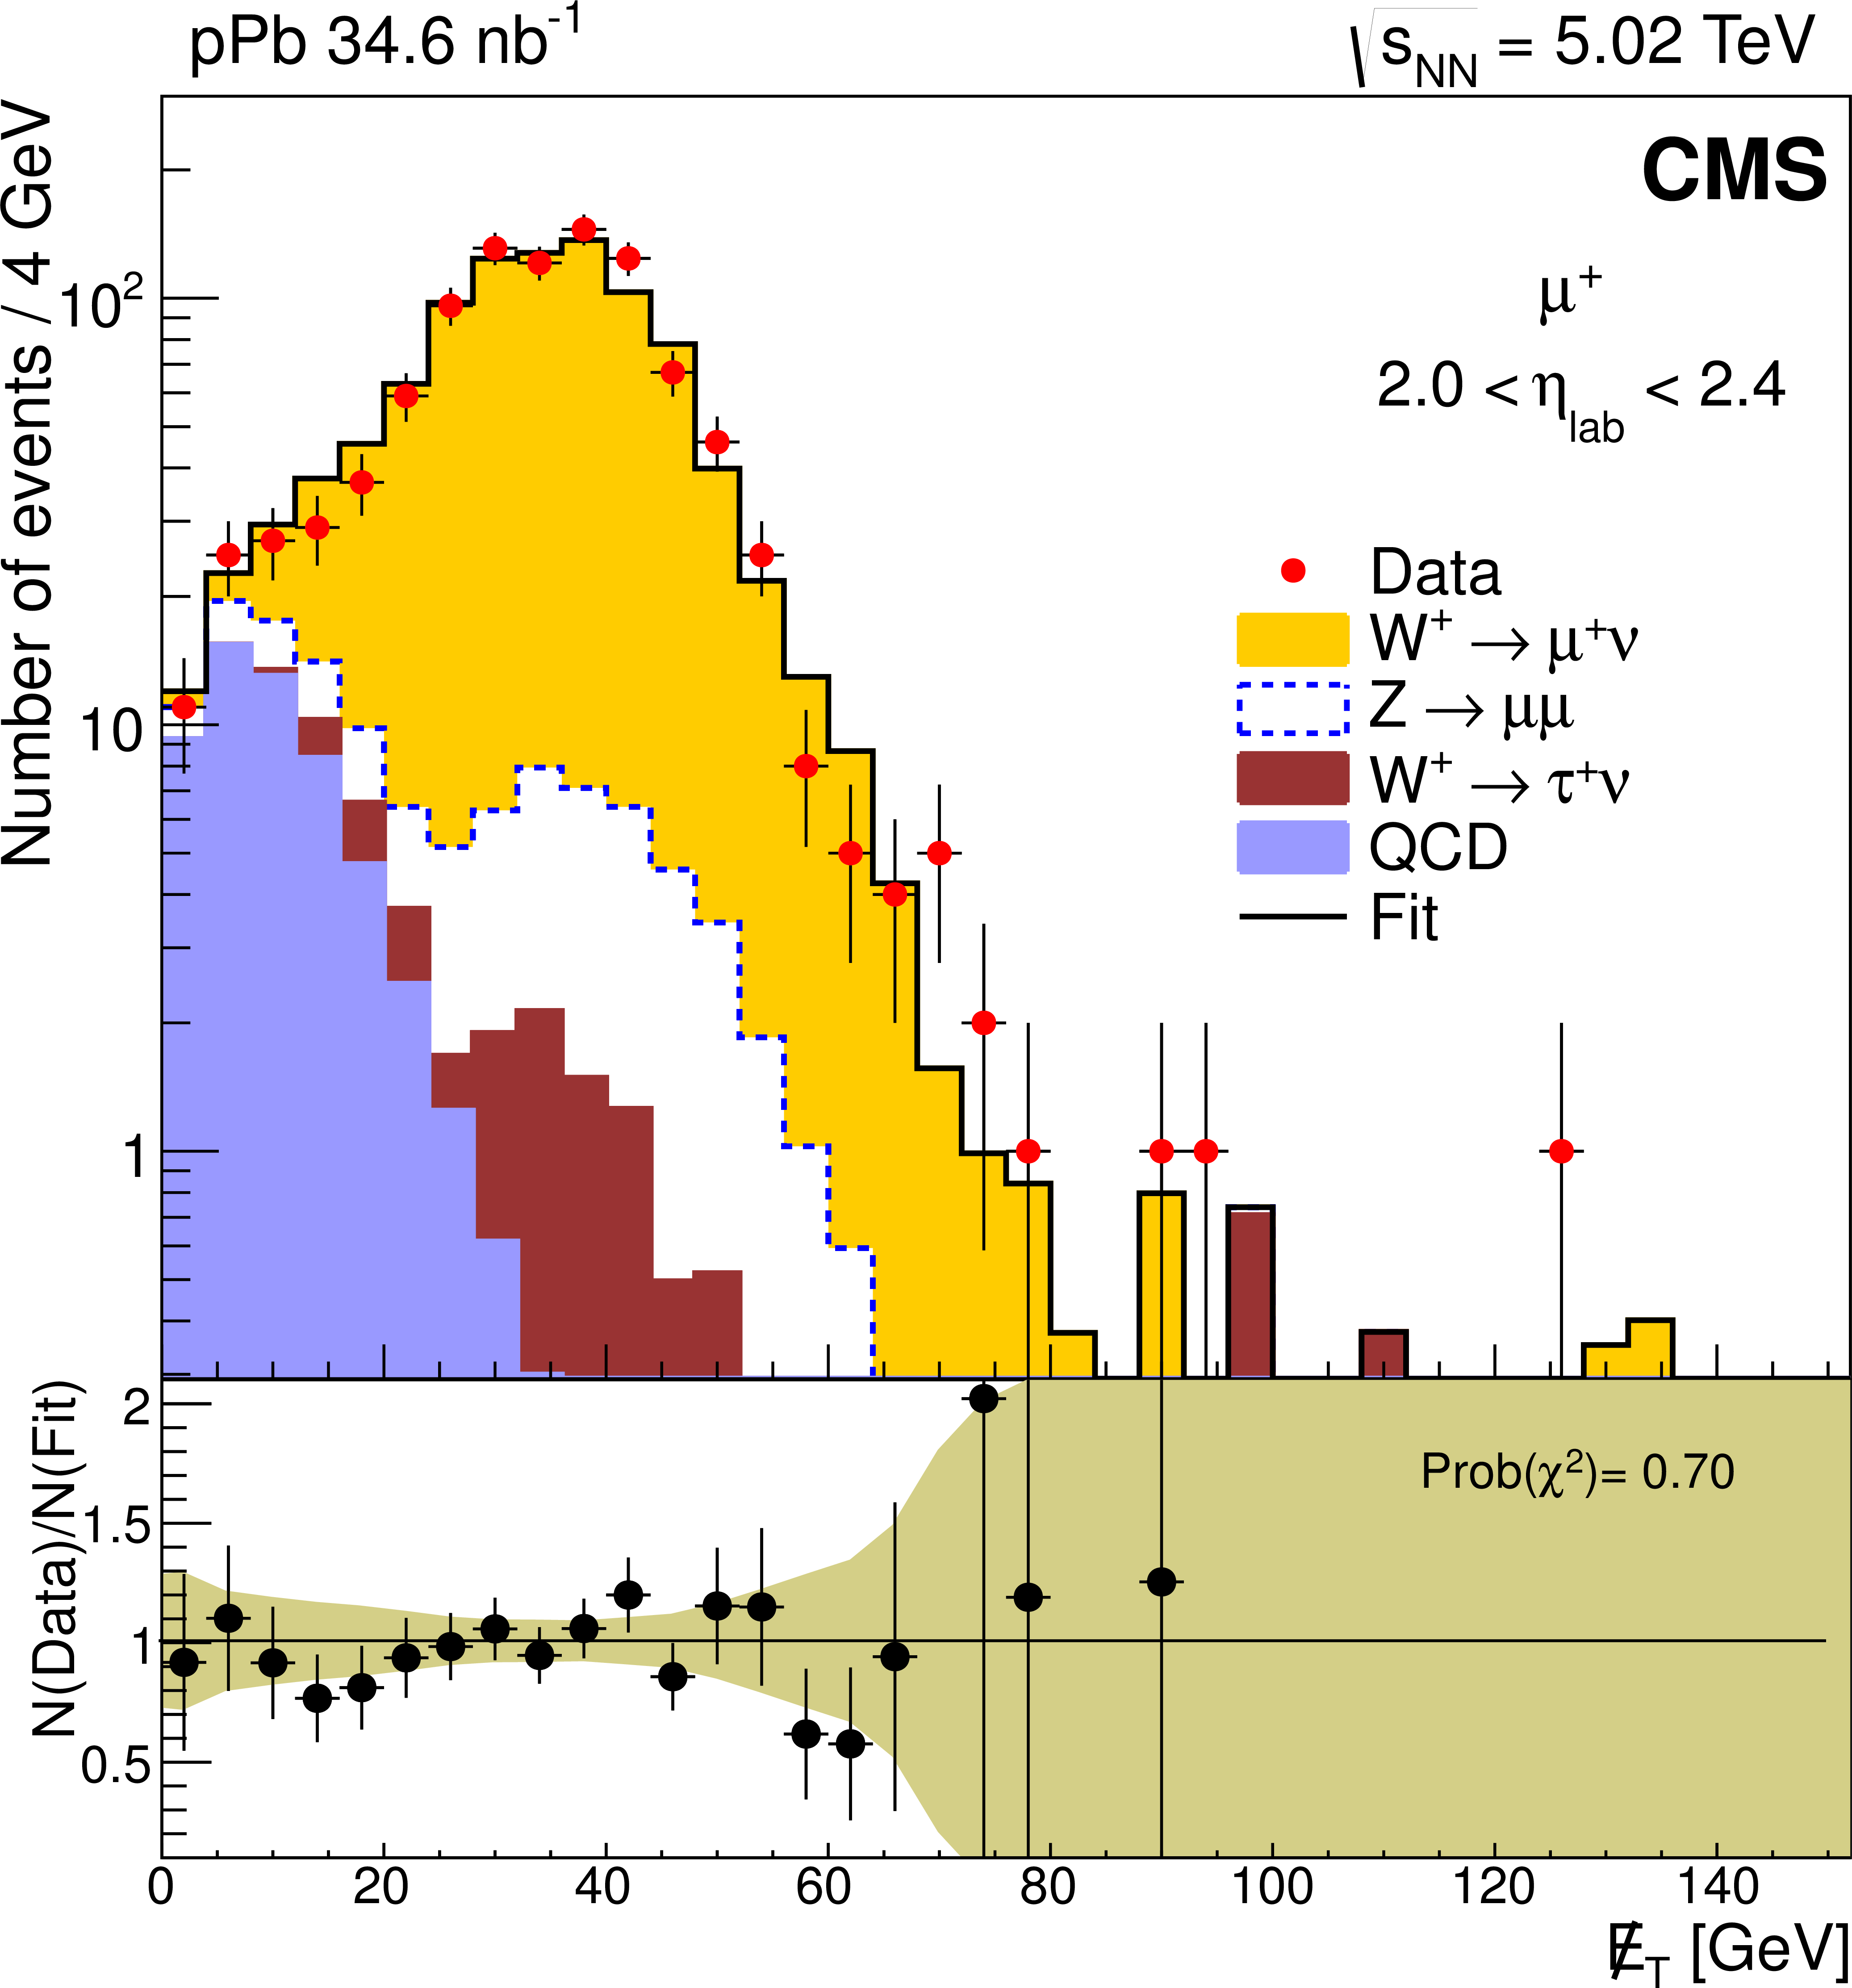
Figure 1-c:
Missing transverse energy distribution for $ {\mathrm {W^+}}\to {{\mu ^+}}\nu $ (a, c) and $ {\mathrm {W^+}}\to {\mathrm {e}^+}\nu $ (b, d) events within the $-0.5 < \eta _\text {lab}< 0.0$ (a, b) and $2.0 < \eta _\text {lab}< 2.4$ (c, d) ranges. Binned fits to the data (red points) are performed with four contributions, stacked from bottom to top: multijet (QCD, blue), $ {\mathrm {W^+}}\to \tau ^+ \nu $ (brown), $ {\mathrm {Z}}\to \ell \ell $ (white) and $ {\mathrm {W^+}}\to \ell ^+ \nu $ (yellow). The $\eta _\text {lab}$ regions are defined such that the proton is moving towards positive $\eta _\text {lab}$ values. Error bars represent statistical uncertainties. The lower panels display the data divided by the result of the fit, with the band representing the statistical uncertainties on the sum of the fit components, for each $E_{\mathrm {T}}$ bin. |
png pdf |
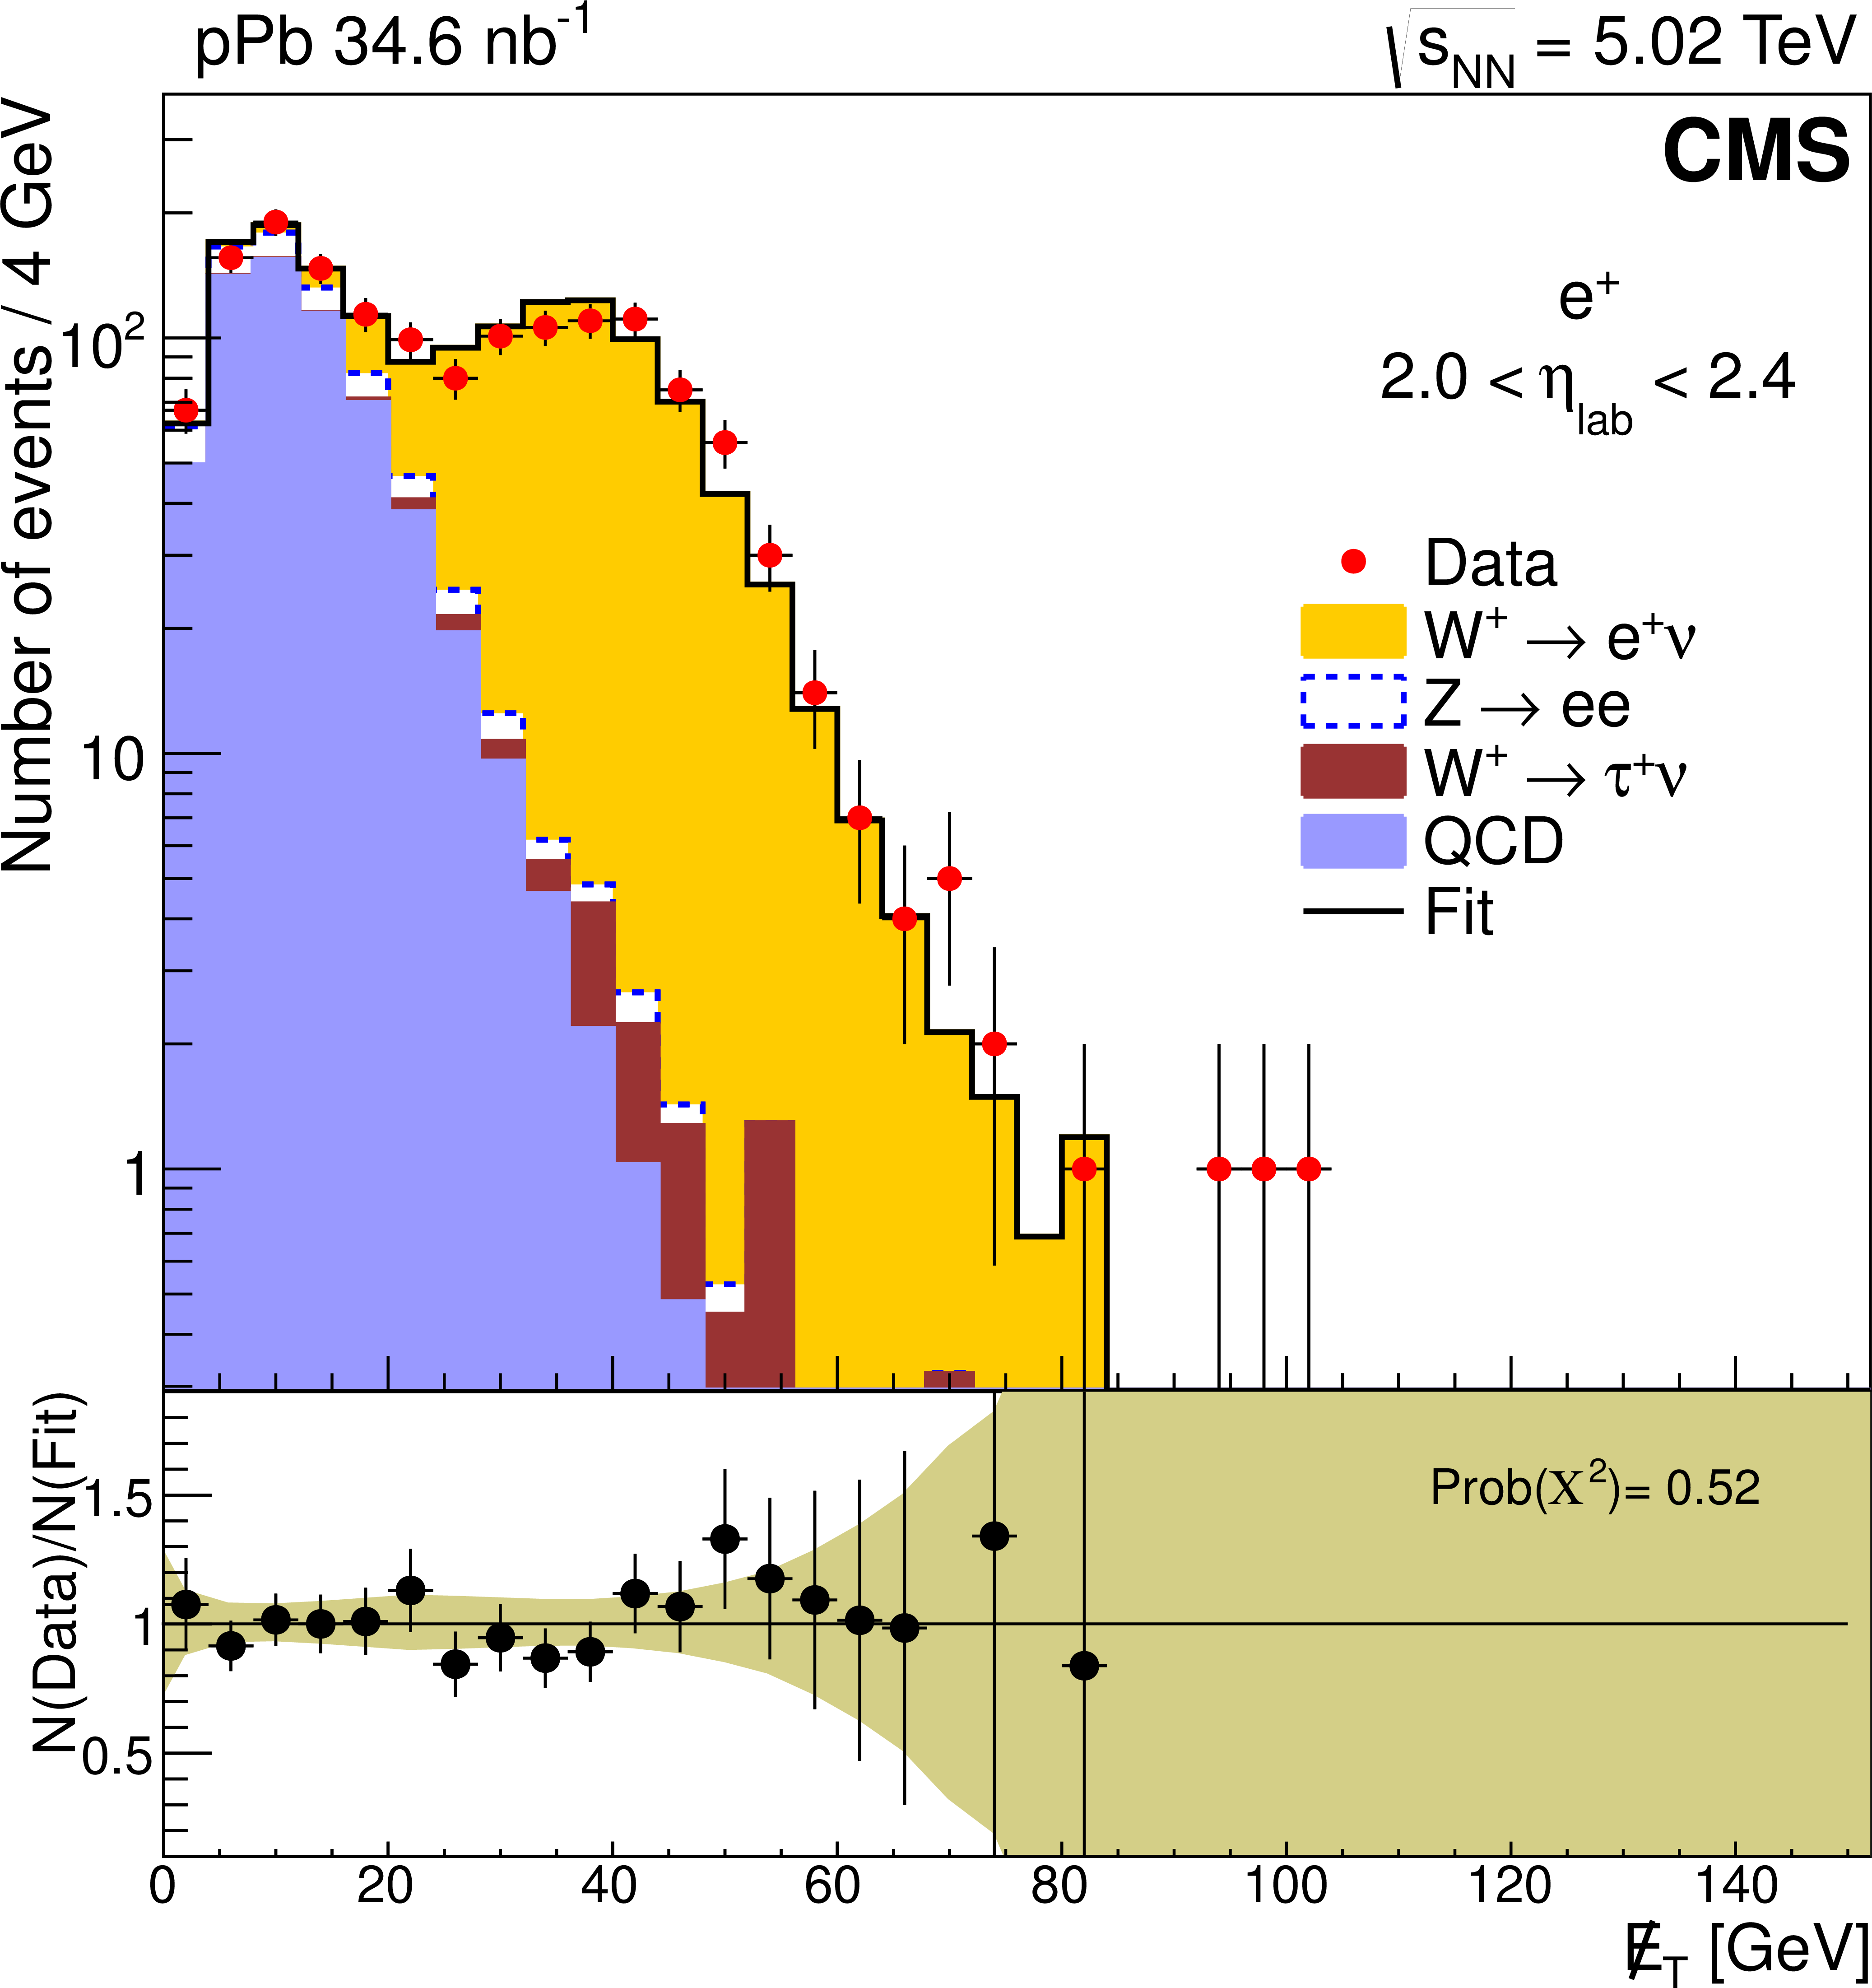
Figure 1-d:
Missing transverse energy distribution for $ {\mathrm {W^+}}\to {{\mu ^+}}\nu $ (a, c) and $ {\mathrm {W^+}}\to {\mathrm {e}^+}\nu $ (b, d) events within the $-0.5 < \eta _\text {lab}< 0.0$ (a, b) and $2.0 < \eta _\text {lab}< 2.4$ (c, d) ranges. Binned fits to the data (red points) are performed with four contributions, stacked from bottom to top: multijet (QCD, blue), $ {\mathrm {W^+}}\to \tau ^+ \nu $ (brown), $ {\mathrm {Z}}\to \ell \ell $ (white) and $ {\mathrm {W^+}}\to \ell ^+ \nu $ (yellow). The $\eta _\text {lab}$ regions are defined such that the proton is moving towards positive $\eta _\text {lab}$ values. Error bars represent statistical uncertainties. The lower panels display the data divided by the result of the fit, with the band representing the statistical uncertainties on the sum of the fit components, for each $E_{\mathrm {T}}$ bin. |
png pdf |
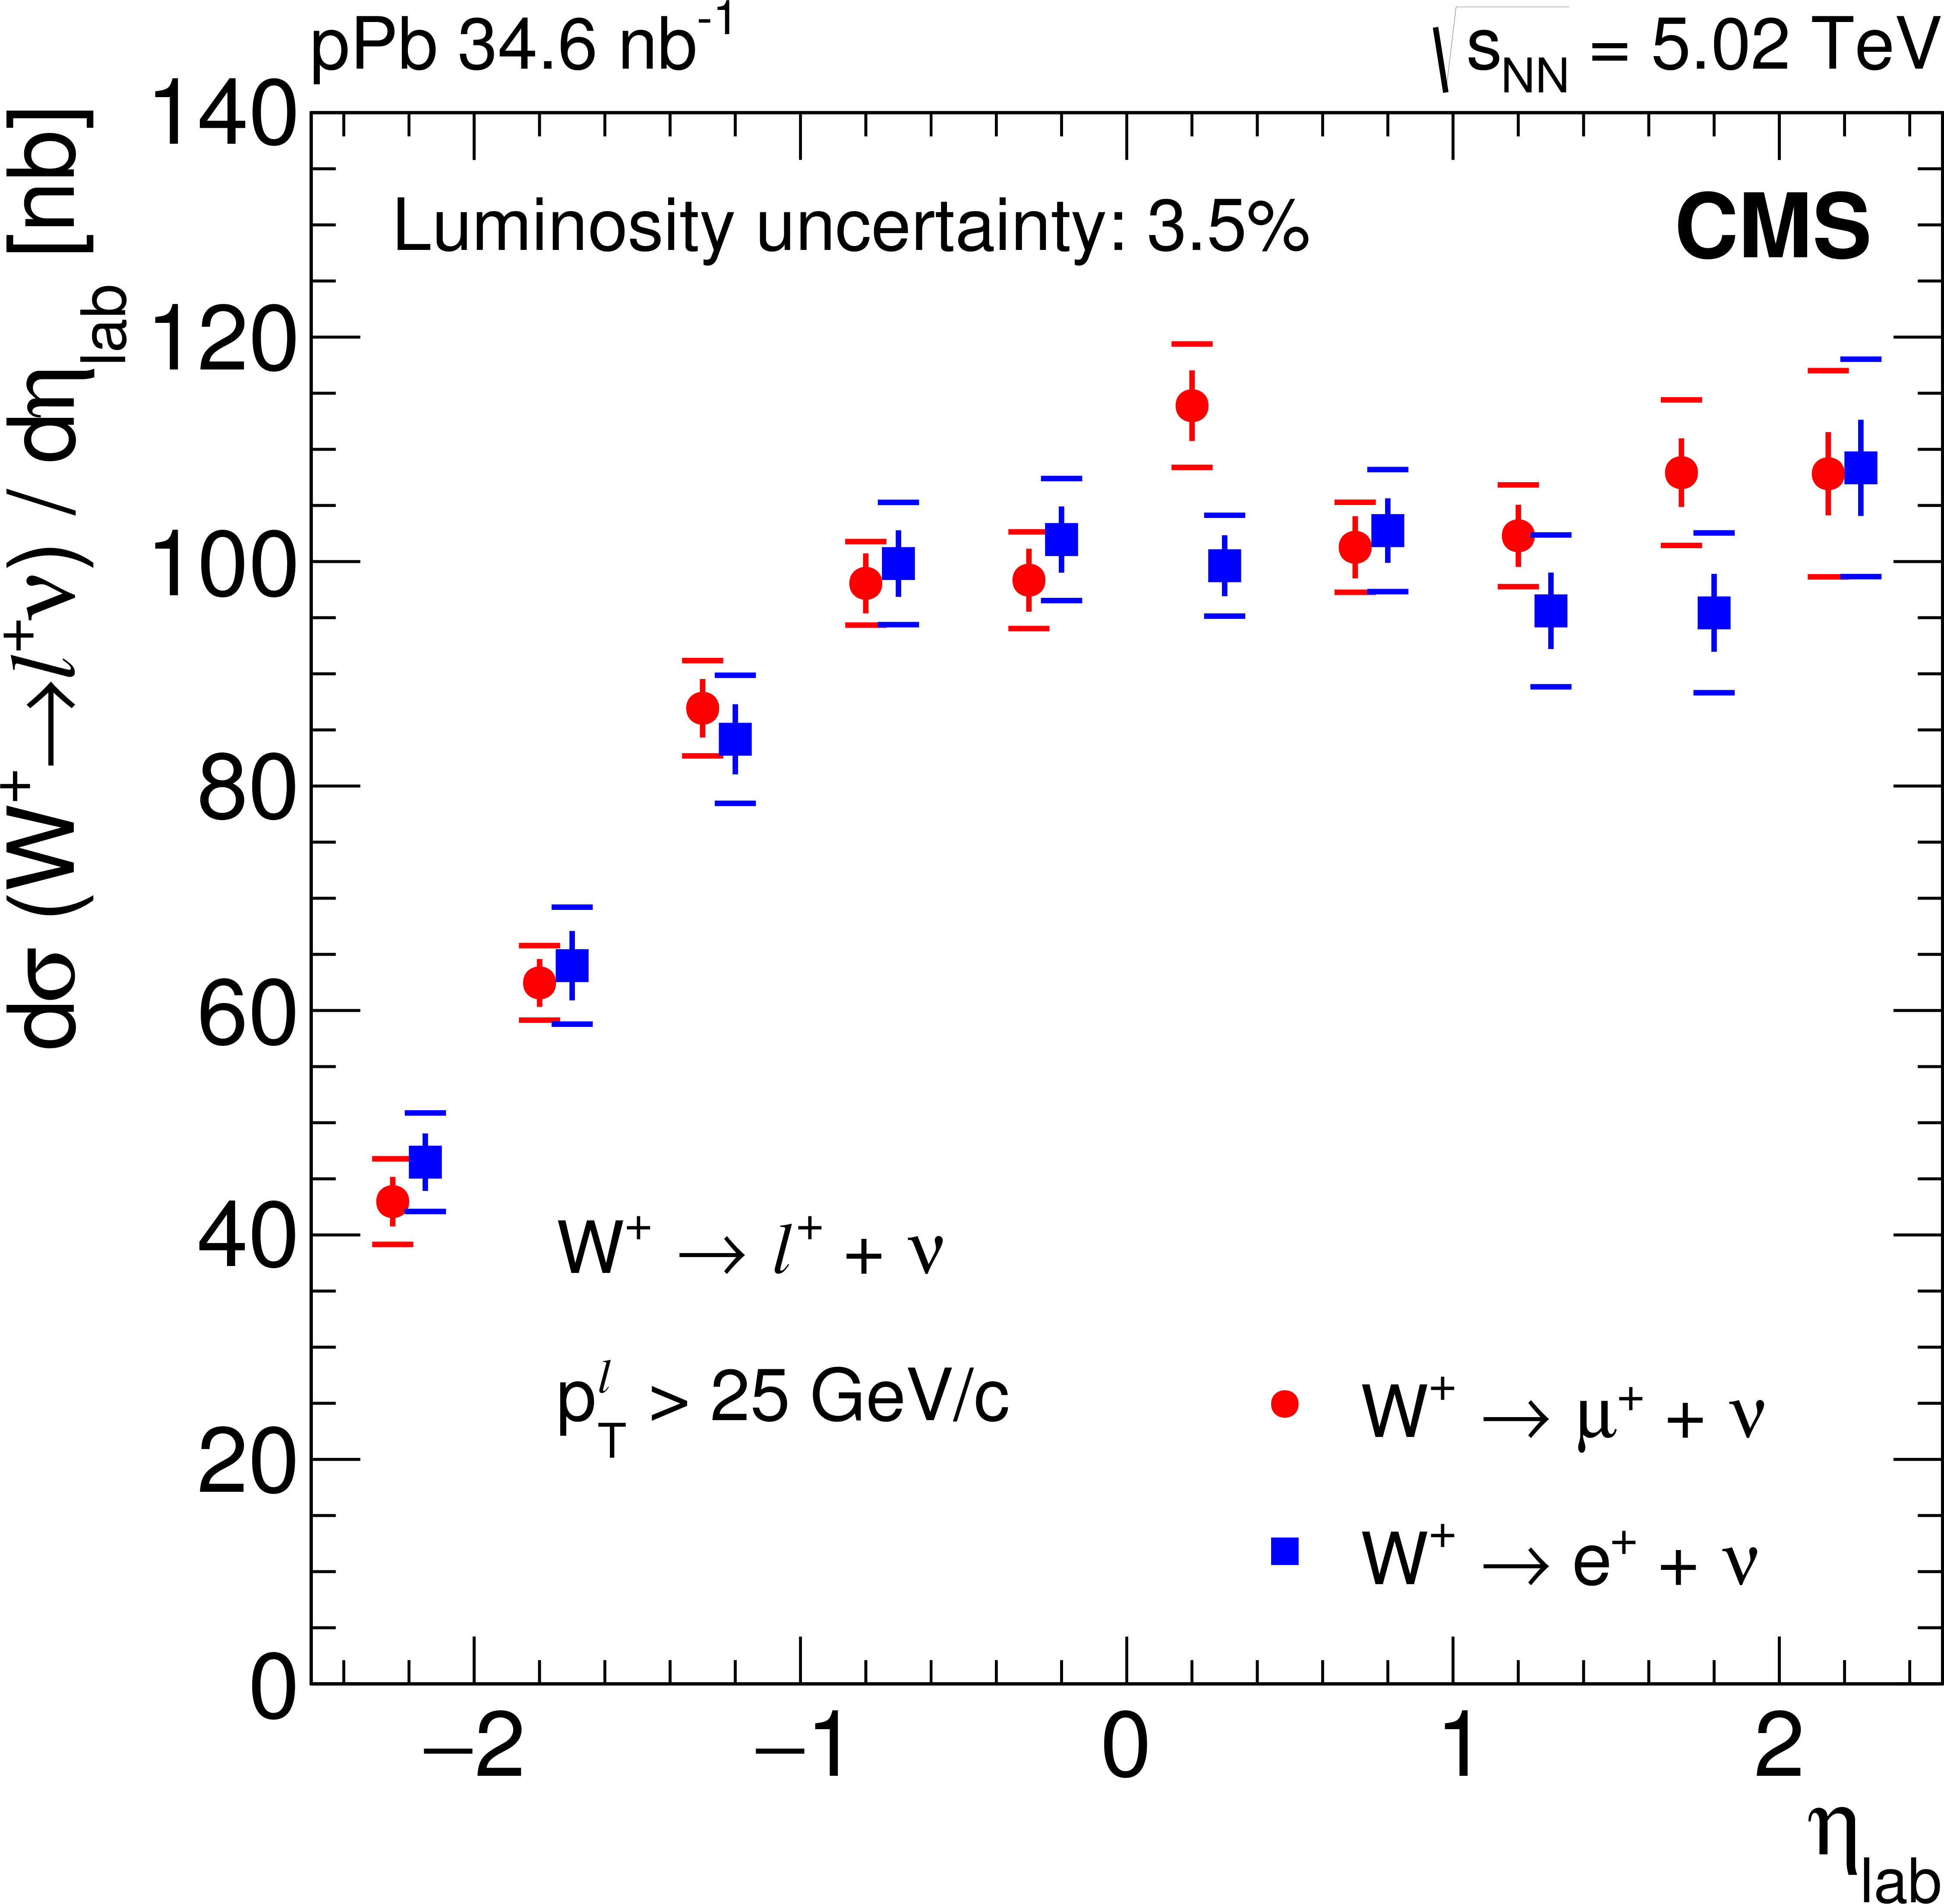
Figure 2-a:
Production cross sections for $ {\mathrm {W^+}}\to \ell ^+ \nu $ (a) and $ {\mathrm {W^-}}\to \ell ^- \nu $ (b), as a function of the lepton pseudorapidity. Error bars represent the statistical uncertainties, while brackets show statistical and systematic uncertainties summed in quadrature. The global luminosity uncertainty of $\pm $3.5% is not included. To improve visibility, the muon (electron) measurements, in red circles (blue squares), have been shifted by $-0.05$ ($+0.05$) in pseudorapidity. |
png pdf |
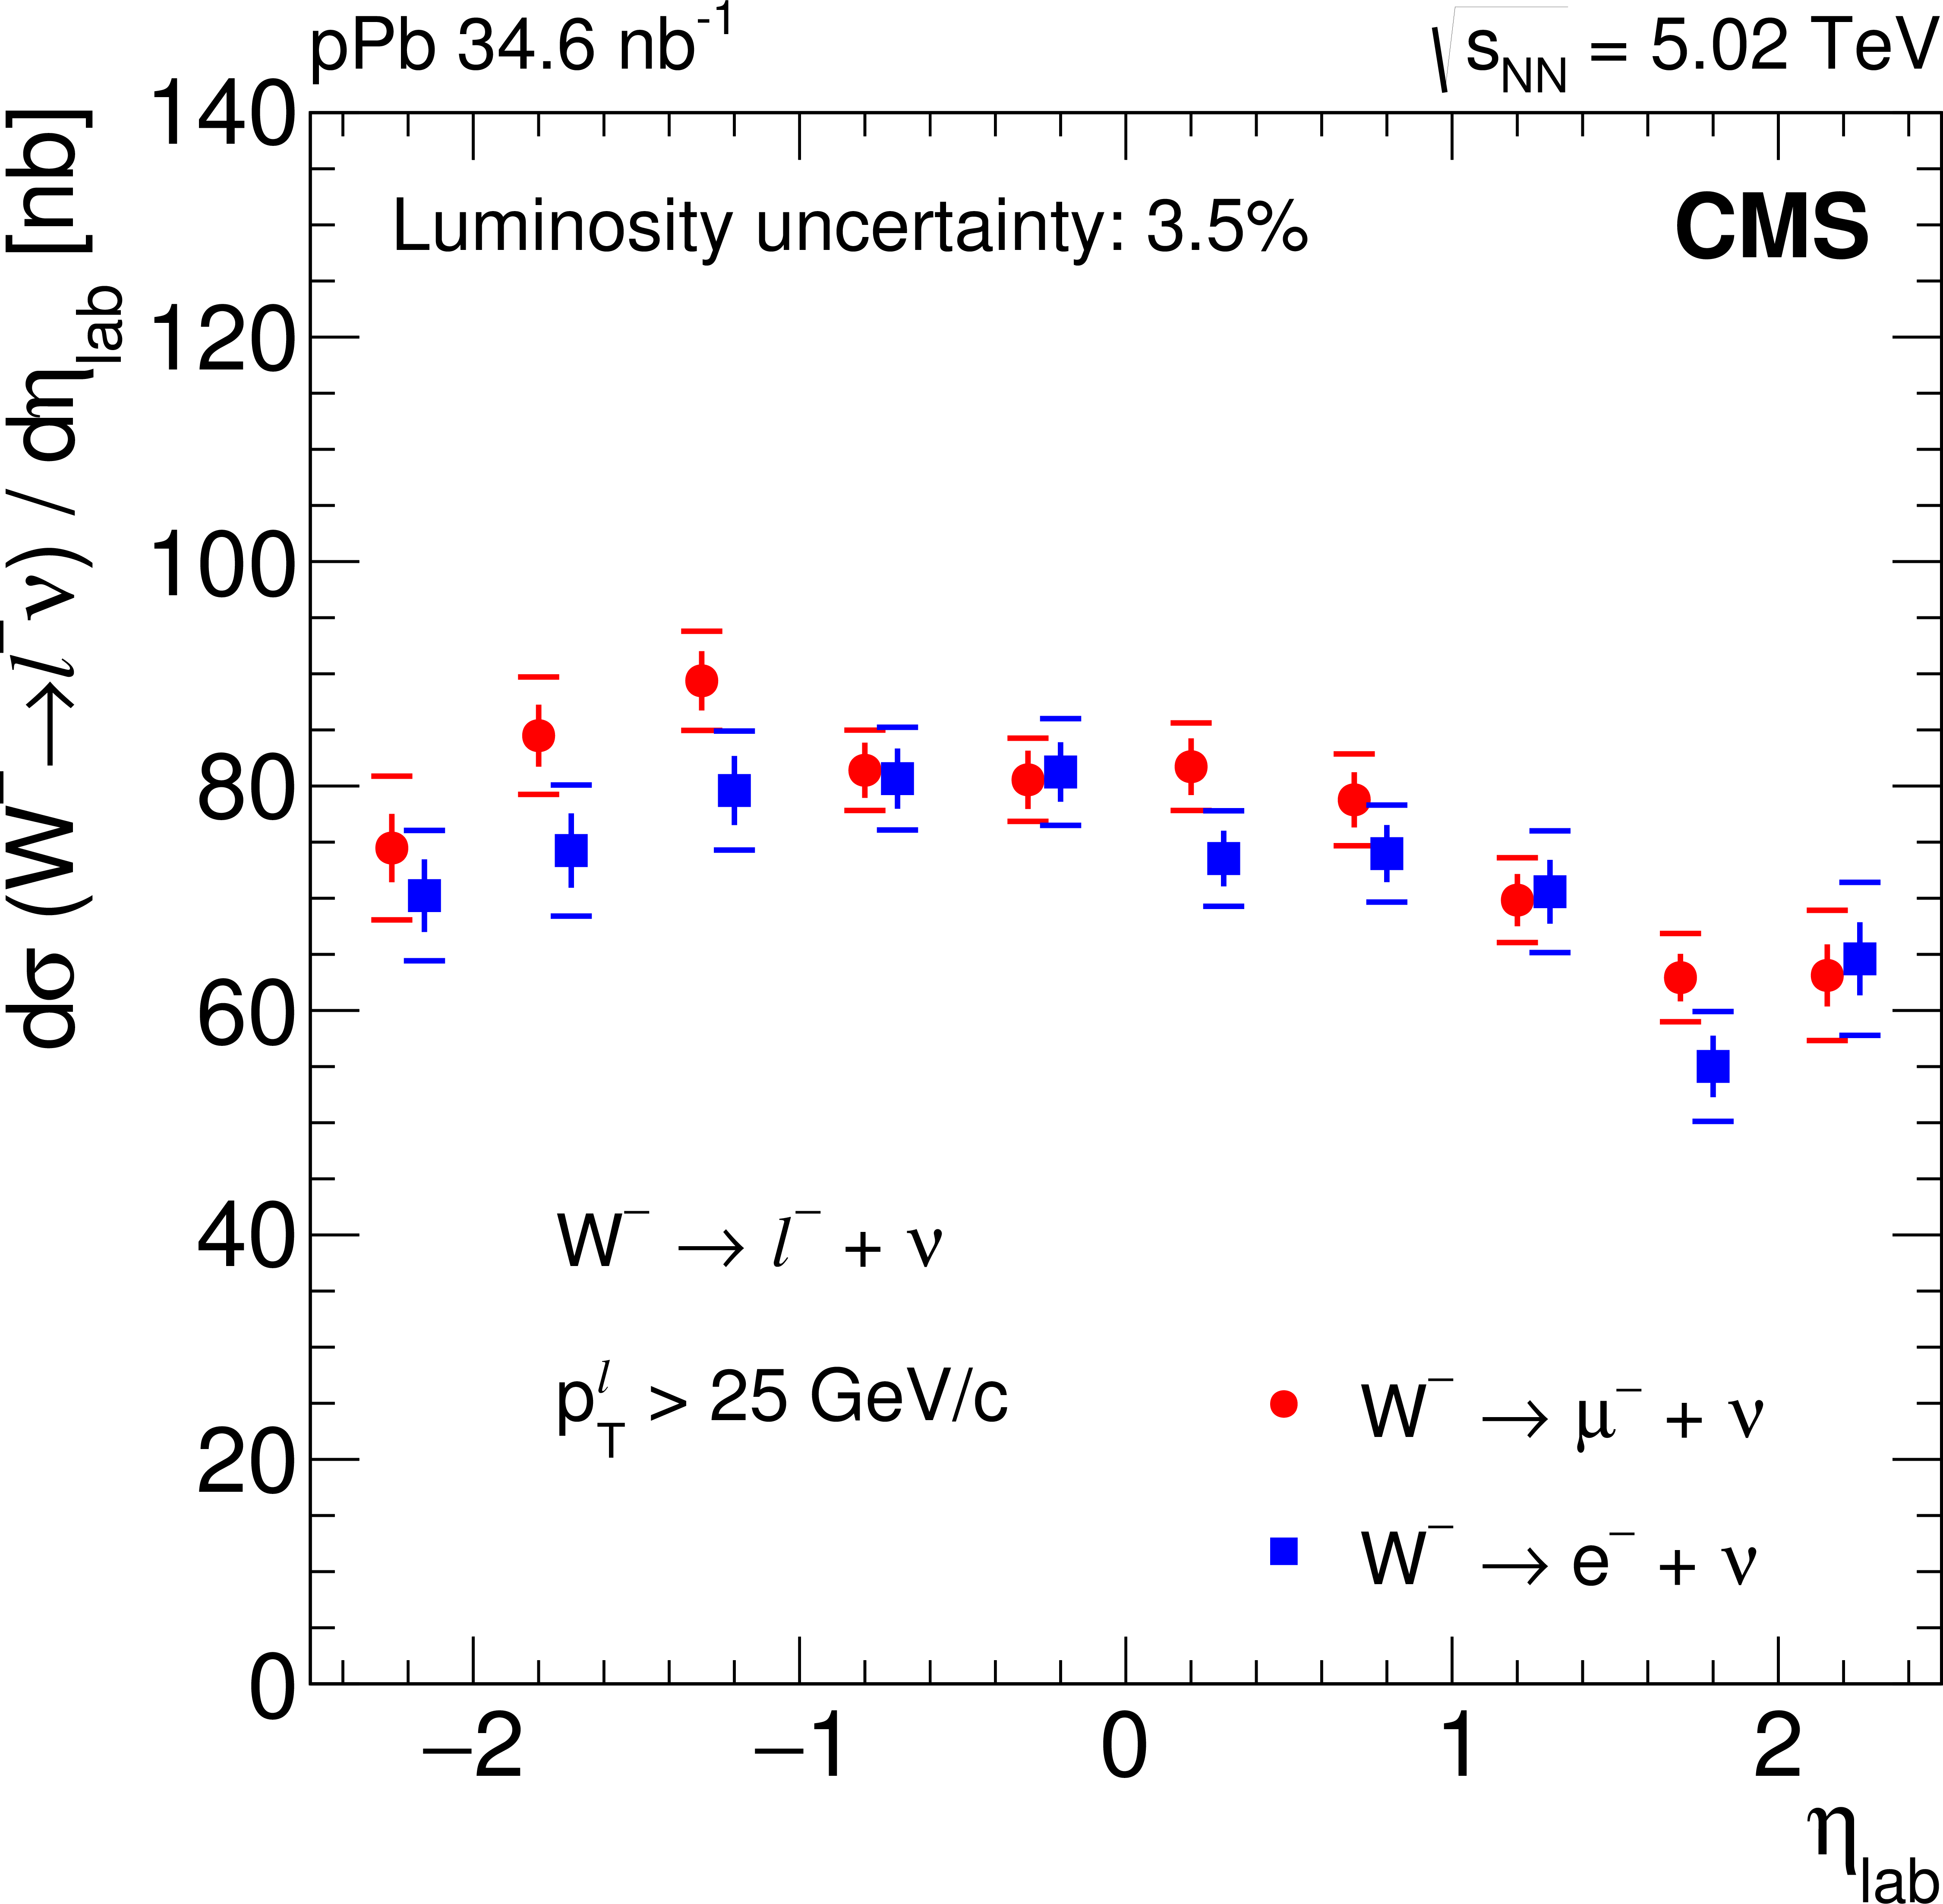
Figure 2-b:
Production cross sections for $ {\mathrm {W^+}}\to \ell ^+ \nu $ (a) and $ {\mathrm {W^-}}\to \ell ^- \nu $ (b), as a function of the lepton pseudorapidity. Error bars represent the statistical uncertainties, while brackets show statistical and systematic uncertainties summed in quadrature. The global luminosity uncertainty of $\pm $3.5% is not included. To improve visibility, the muon (electron) measurements, in red circles (blue squares), have been shifted by $-0.05$ ($+0.05$) in pseudorapidity. |
png pdf |
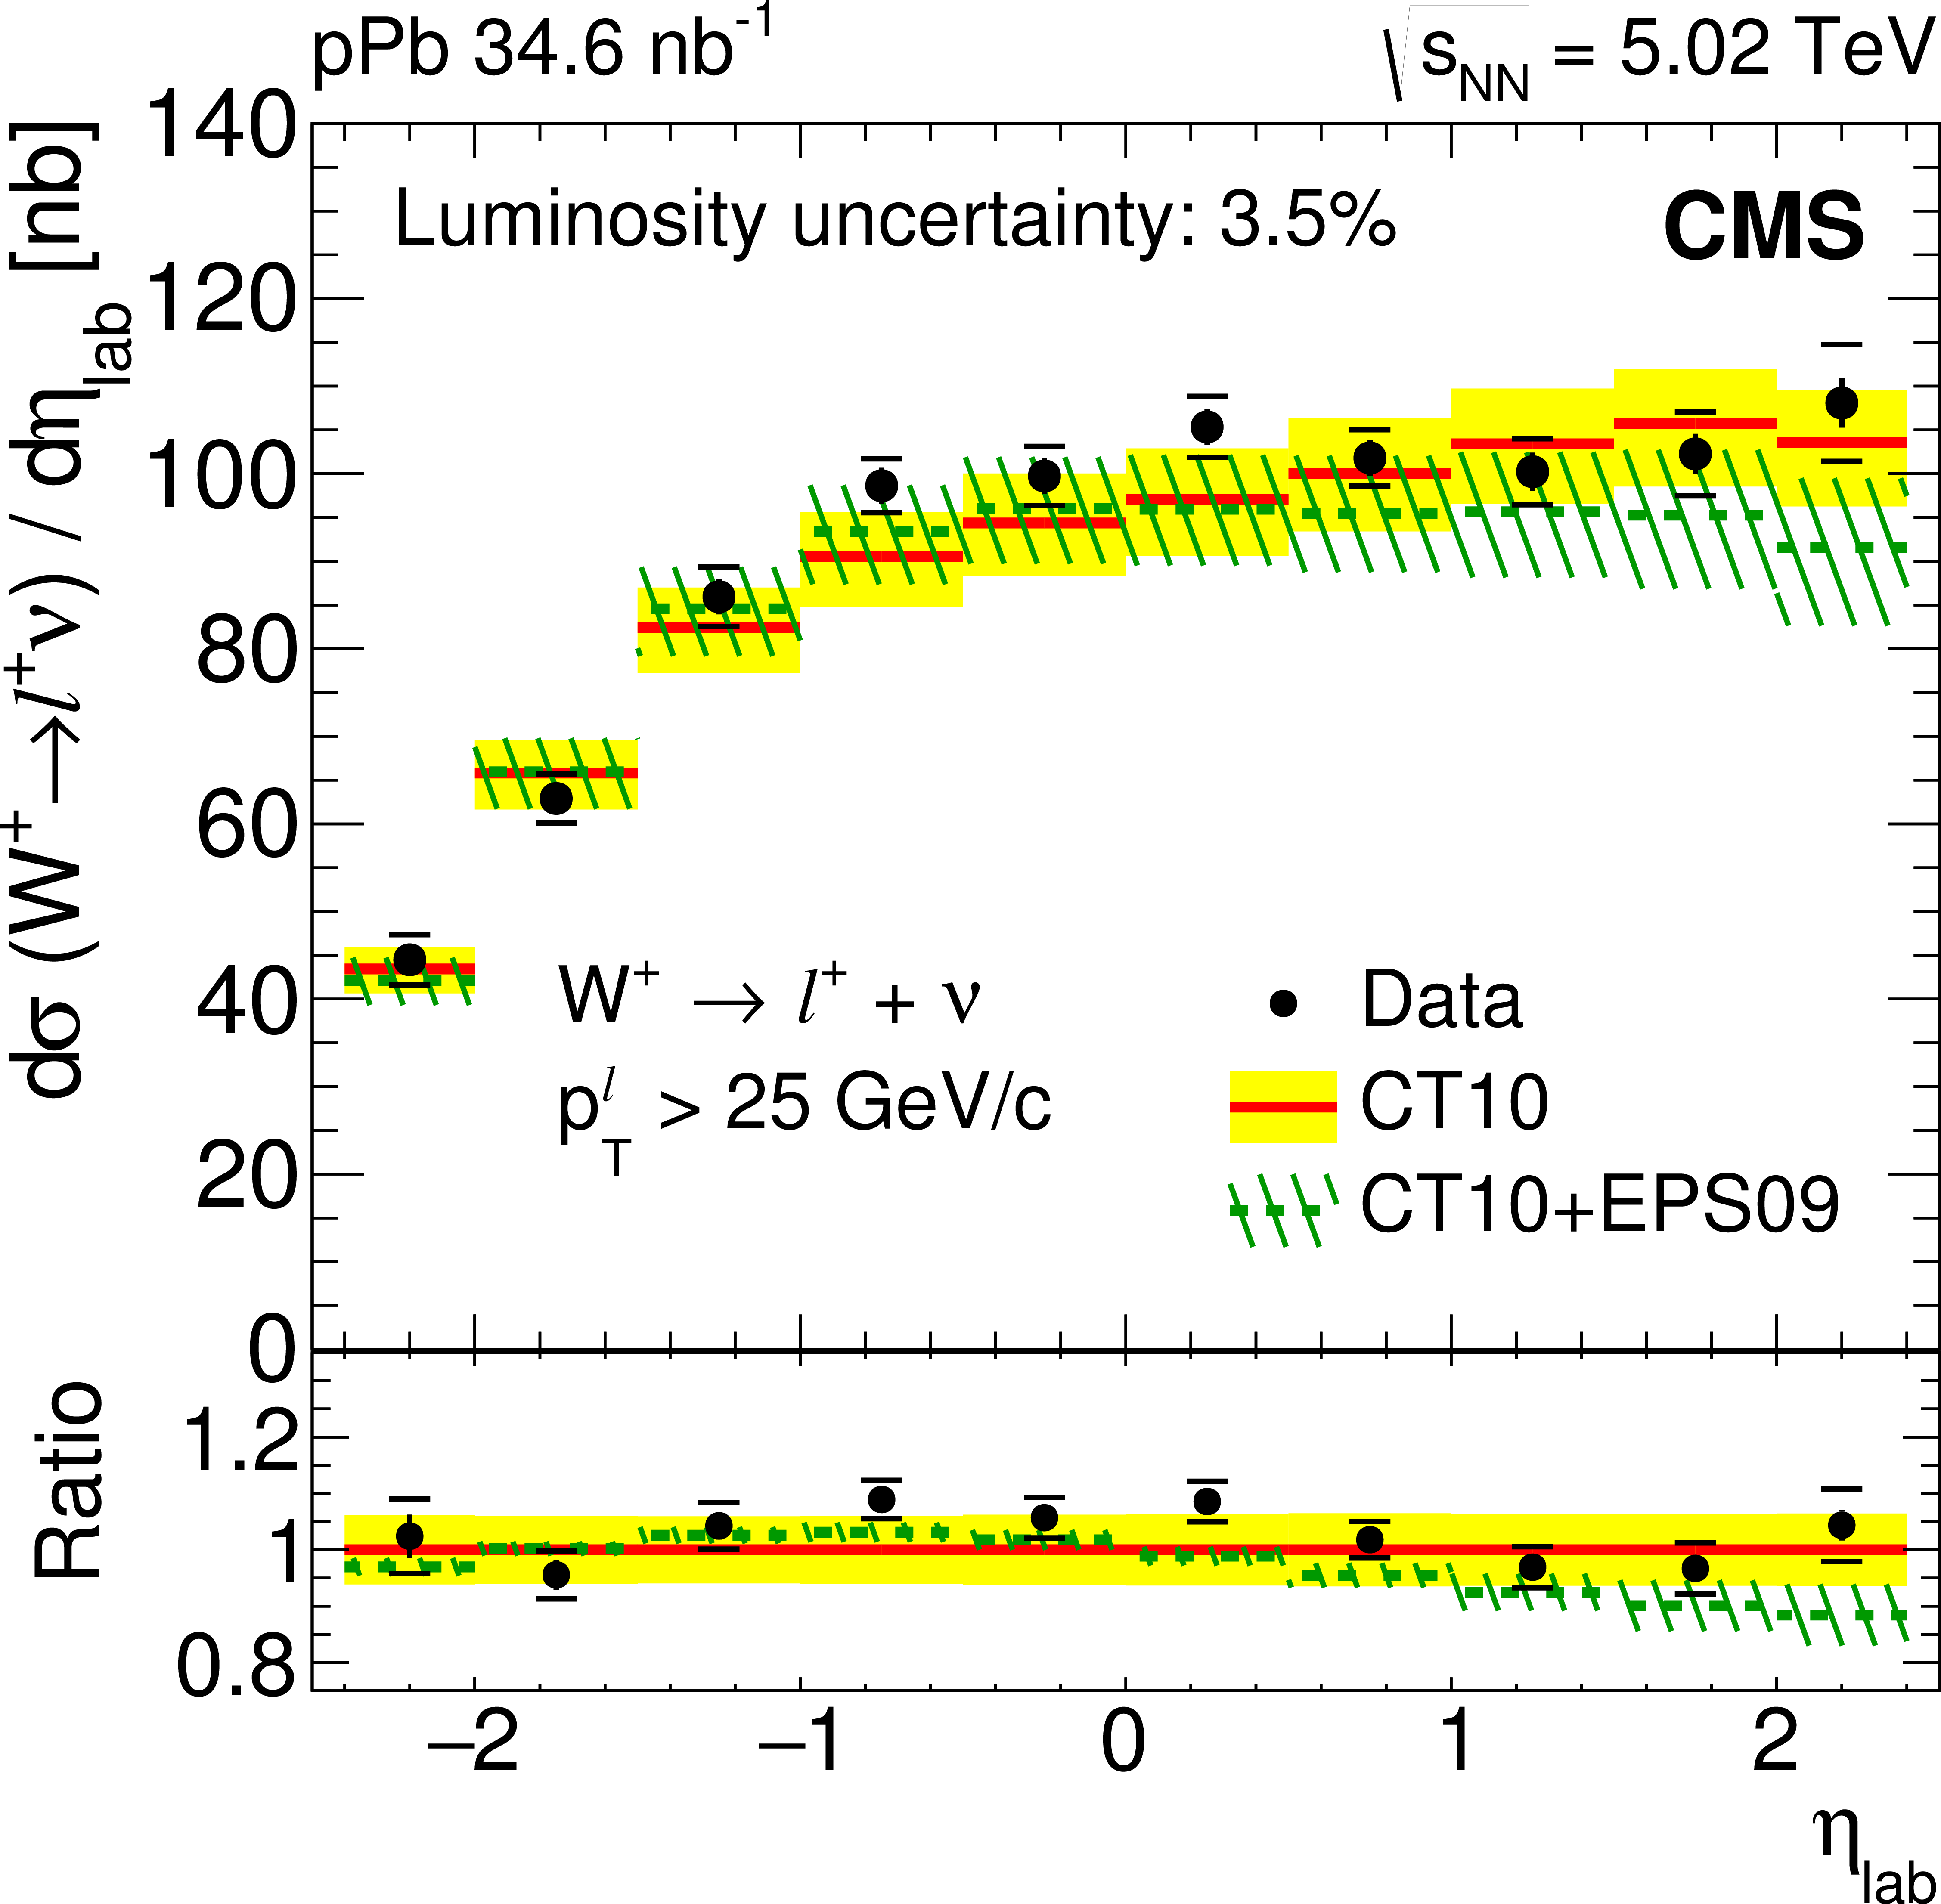
Figure 3-a:
Production cross sections for $ {\mathrm {W^+}}\to \ell ^+ \nu $ (a) and $ {\mathrm {W^-}}\to \ell ^- \nu $ (b), as a function of the lepton pseudorapidity. Error bars represent the statistical uncertainties, while brackets show statistical and systematic uncertainties summed in quadrature. The global luminosity uncertainty of $\pm $3.5% is not displayed. Theoretical predictions with (CT10+EPS09, dashed green line) and without (CT10, solid red line) PDF nuclear modifications are also shown, with the uncertainty bands. The bottom panels show the ratio of the data (black points) and CT10+EPS09 (dashed green line) to the CT10 baseline. All theory uncertainty bands include scale and PDF uncertainties, except the EPS09 of the bottom panels which only includes the EPS09 PDF uncertainties. |
png pdf |
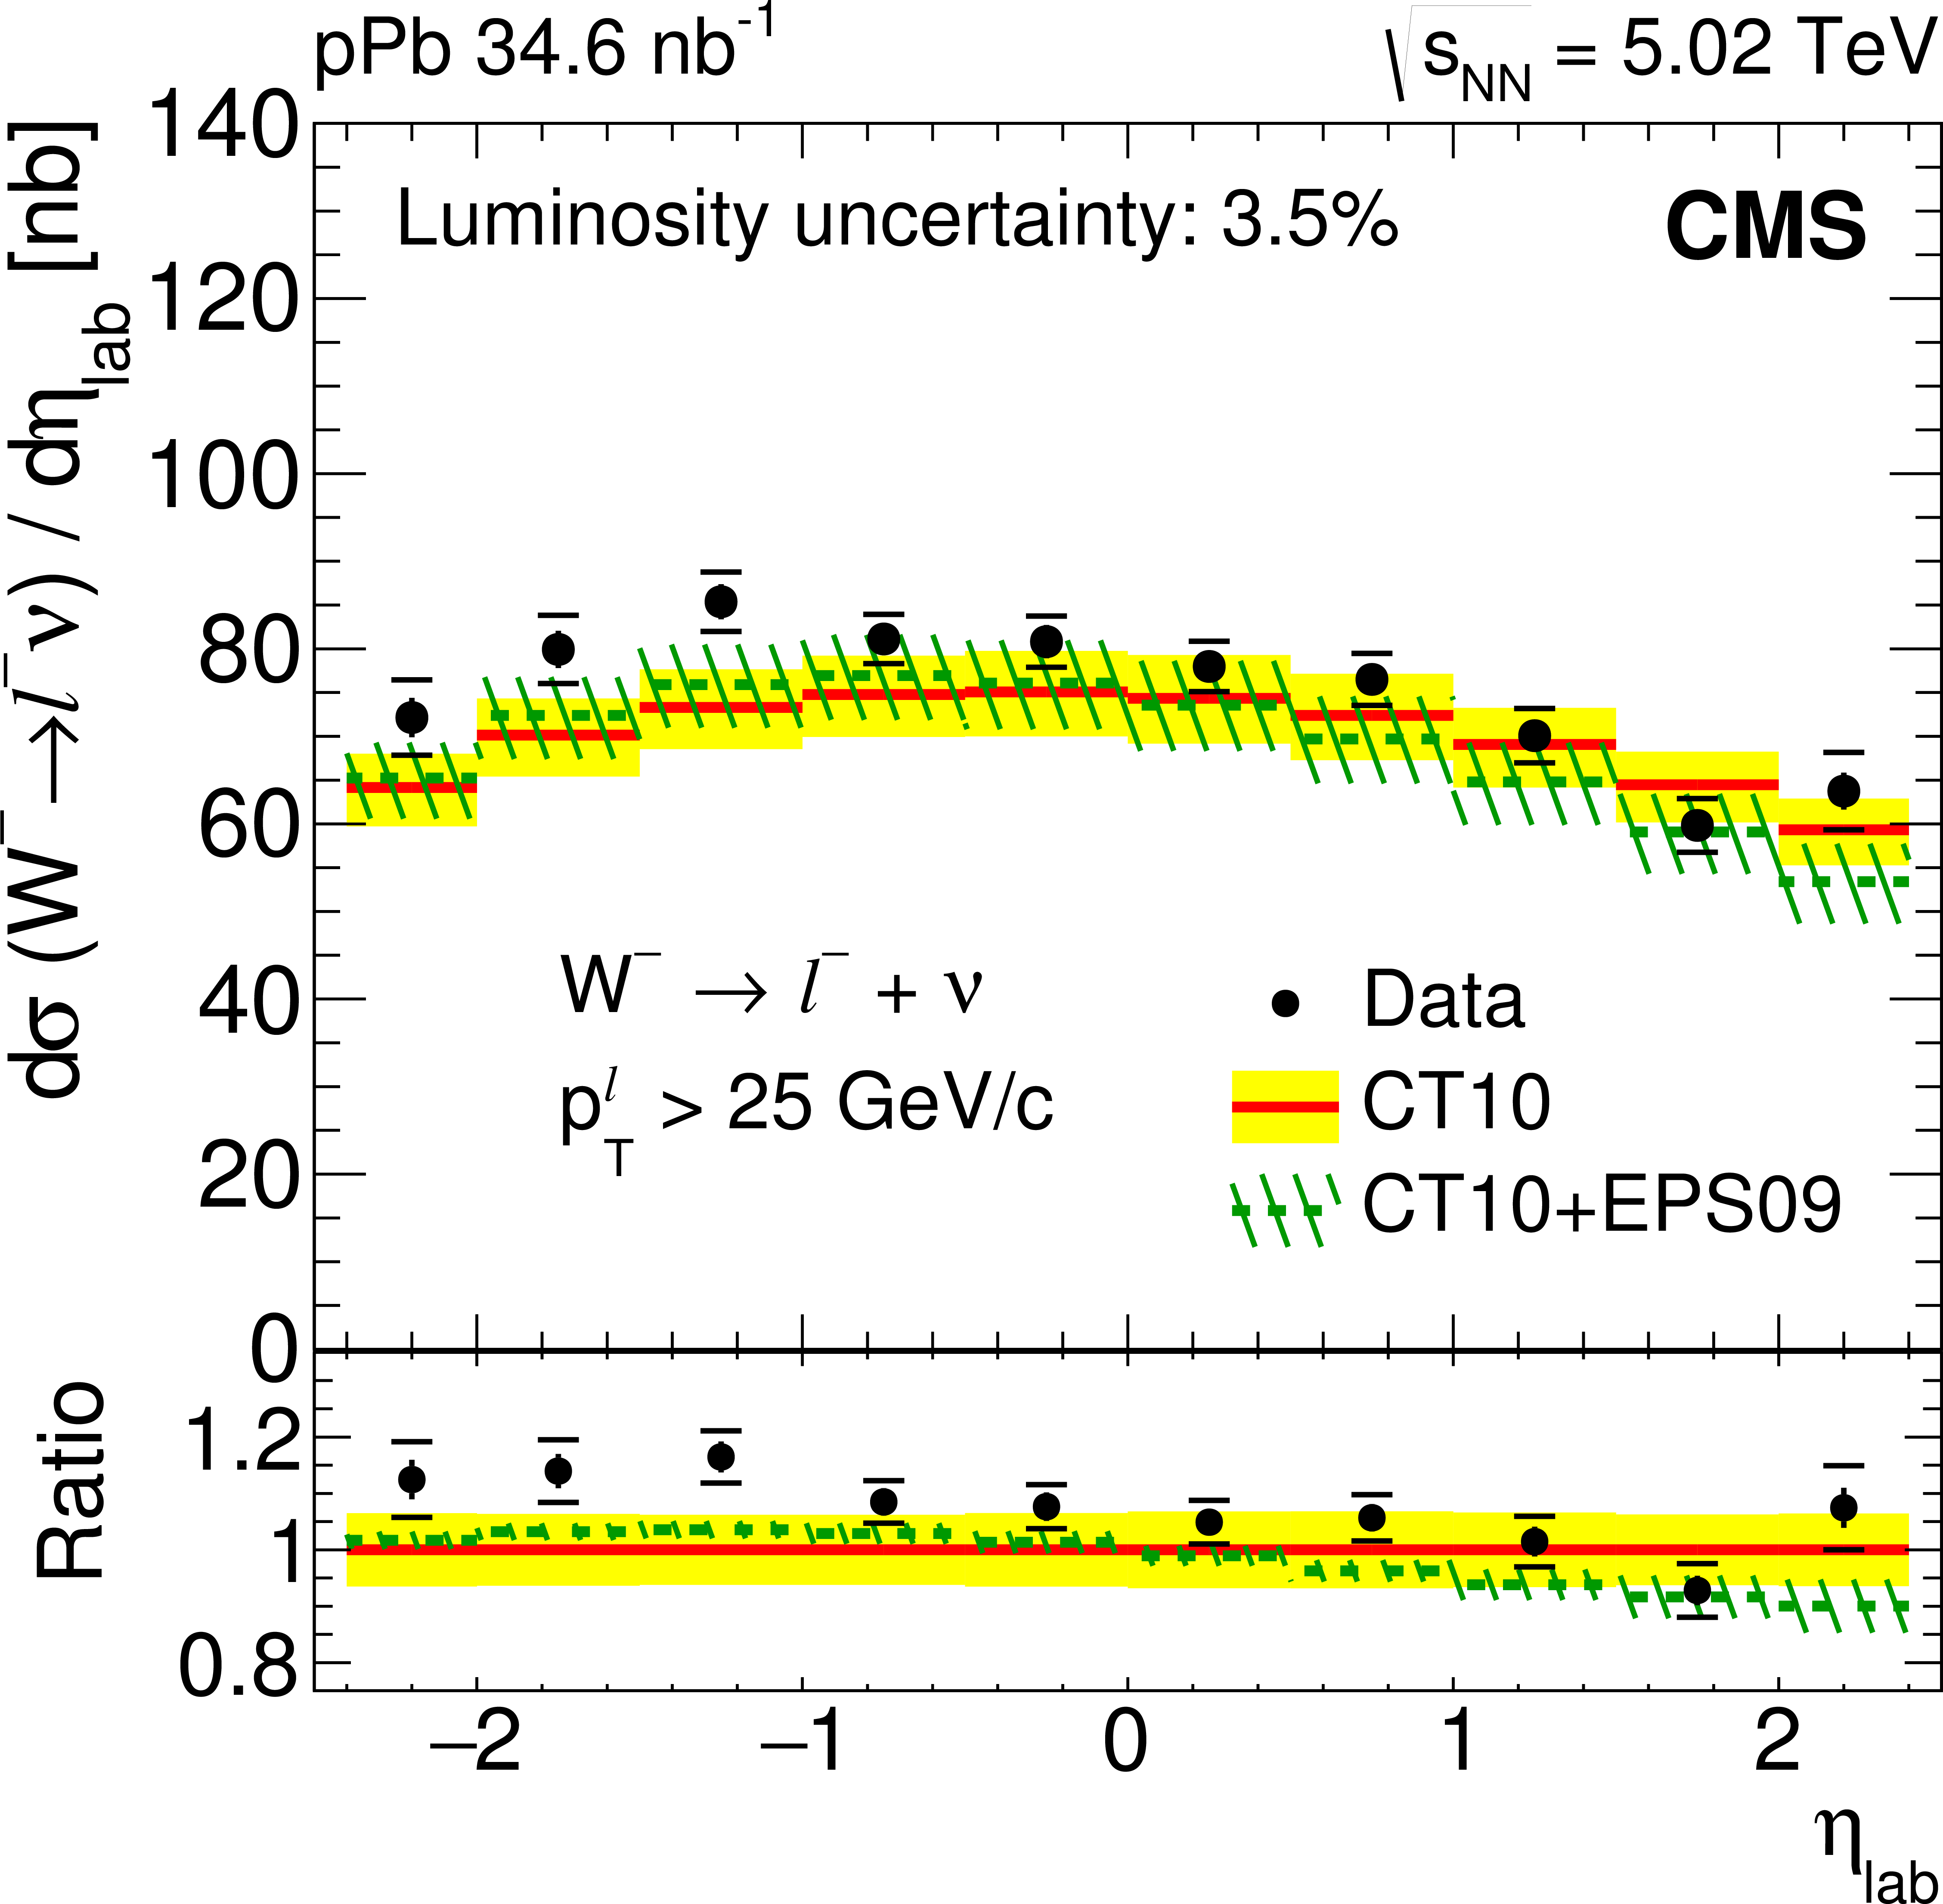
Figure 3-b:
Production cross sections for $ {\mathrm {W^+}}\to \ell ^+ \nu $ (a) and $ {\mathrm {W^-}}\to \ell ^- \nu $ (b), as a function of the lepton pseudorapidity. Error bars represent the statistical uncertainties, while brackets show statistical and systematic uncertainties summed in quadrature. The global luminosity uncertainty of $\pm $3.5% is not displayed. Theoretical predictions with (CT10+EPS09, dashed green line) and without (CT10, solid red line) PDF nuclear modifications are also shown, with the uncertainty bands. The bottom panels show the ratio of the data (black points) and CT10+EPS09 (dashed green line) to the CT10 baseline. All theory uncertainty bands include scale and PDF uncertainties, except the EPS09 of the bottom panels which only includes the EPS09 PDF uncertainties. |

png pdf |
Figure 4:
Lepton charge asymmetry, $(N_{\ell }^+ - N_{\ell }^-)/(N_{\ell }^+ + N_{\ell }^-)$, as a function of the lepton pseudorapidity. Error bars represent the statistical uncertainties, while brackets show statistical and systematic uncertainties summed in quadrature. Theoretical predictions with (CT10+EPS09, dashed green line) and without (CT10, solid red line) PDF nuclear modifications are also shown, with their uncertainty bands. |
png pdf |
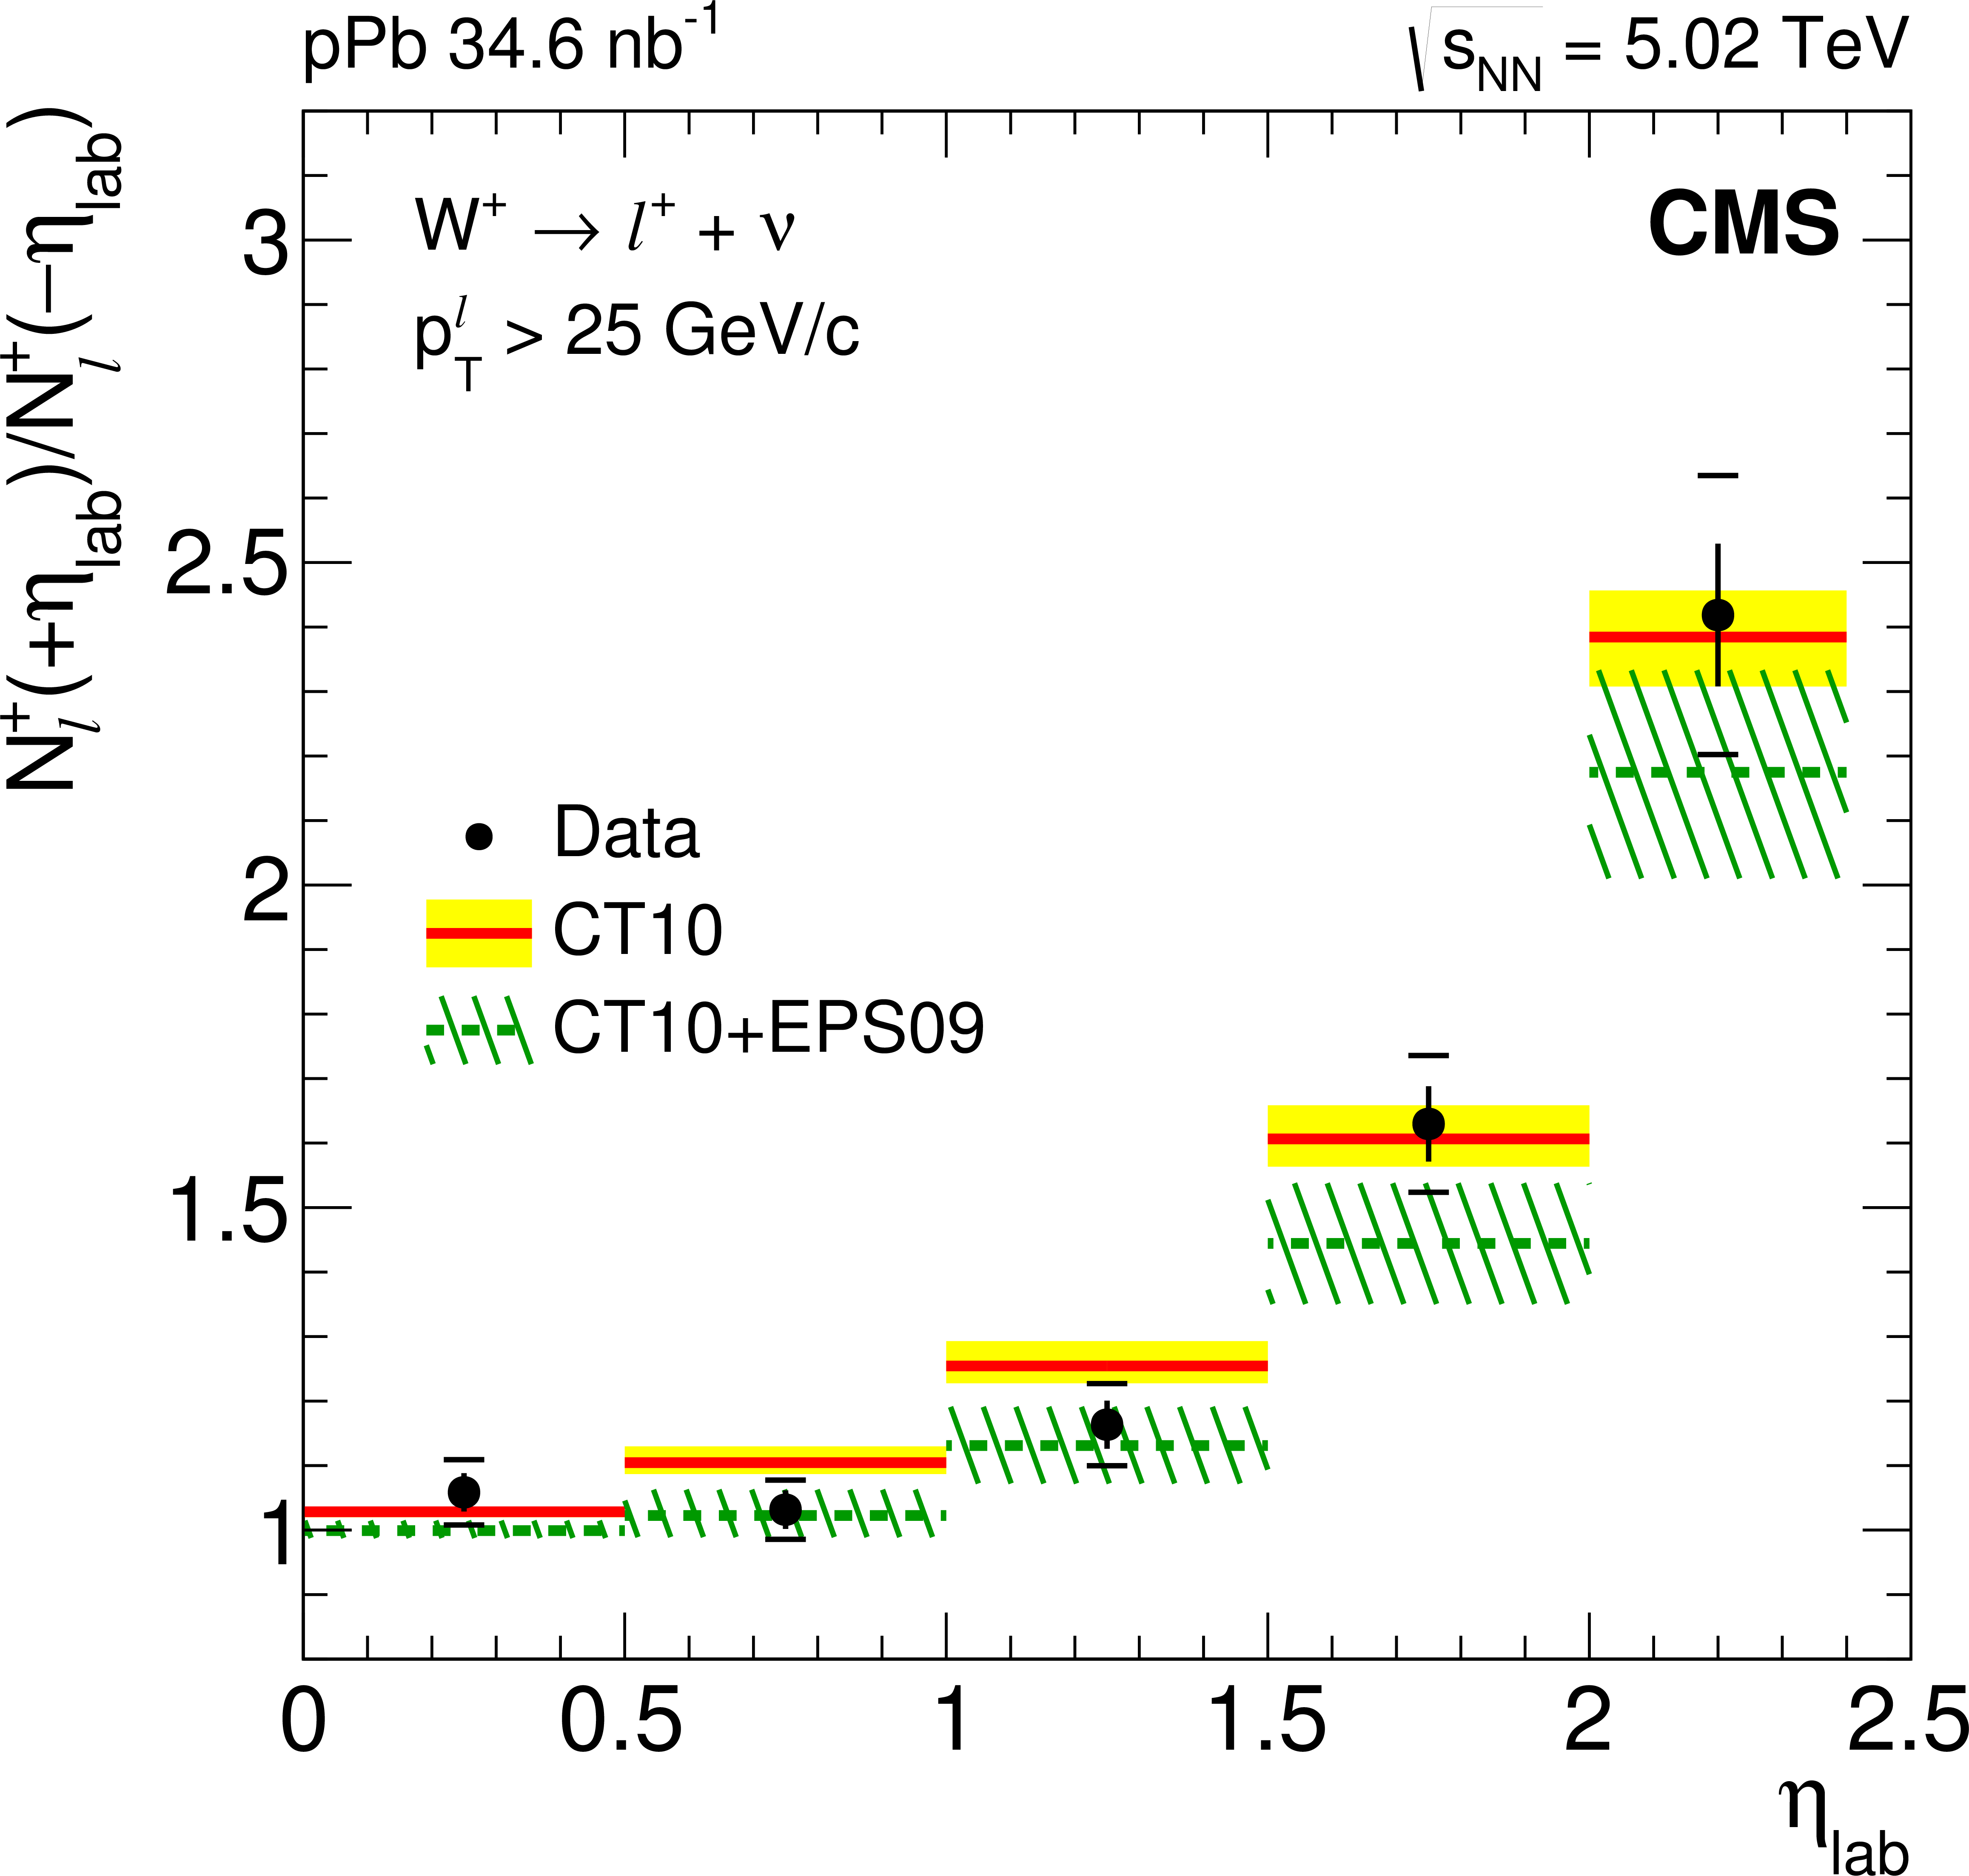
Figure 5-a:
Forward-backward asymmetries, $N_{\ell }(+\eta _\text {lab})/N_{\ell }(-\eta _\text {lab})$, for the positive (a) and negative (b) leptons. Error bars represent the statistical uncertainties, while brackets show statistical and systematic uncertainties summed in quadrature. Theoretical predictions with (CT10+EPS09, dashed green line) and without (CT10, solid red line) PDF nuclear modifications are also shown, with their uncertainty bands. |

png pdf |
Figure 5-b:
Forward-backward asymmetries, $N_{\ell }(+\eta _\text {lab})/N_{\ell }(-\eta _\text {lab})$, for the positive (a) and negative (b) leptons. Error bars represent the statistical uncertainties, while brackets show statistical and systematic uncertainties summed in quadrature. Theoretical predictions with (CT10+EPS09, dashed green line) and without (CT10, solid red line) PDF nuclear modifications are also shown, with their uncertainty bands. |
png pdf |
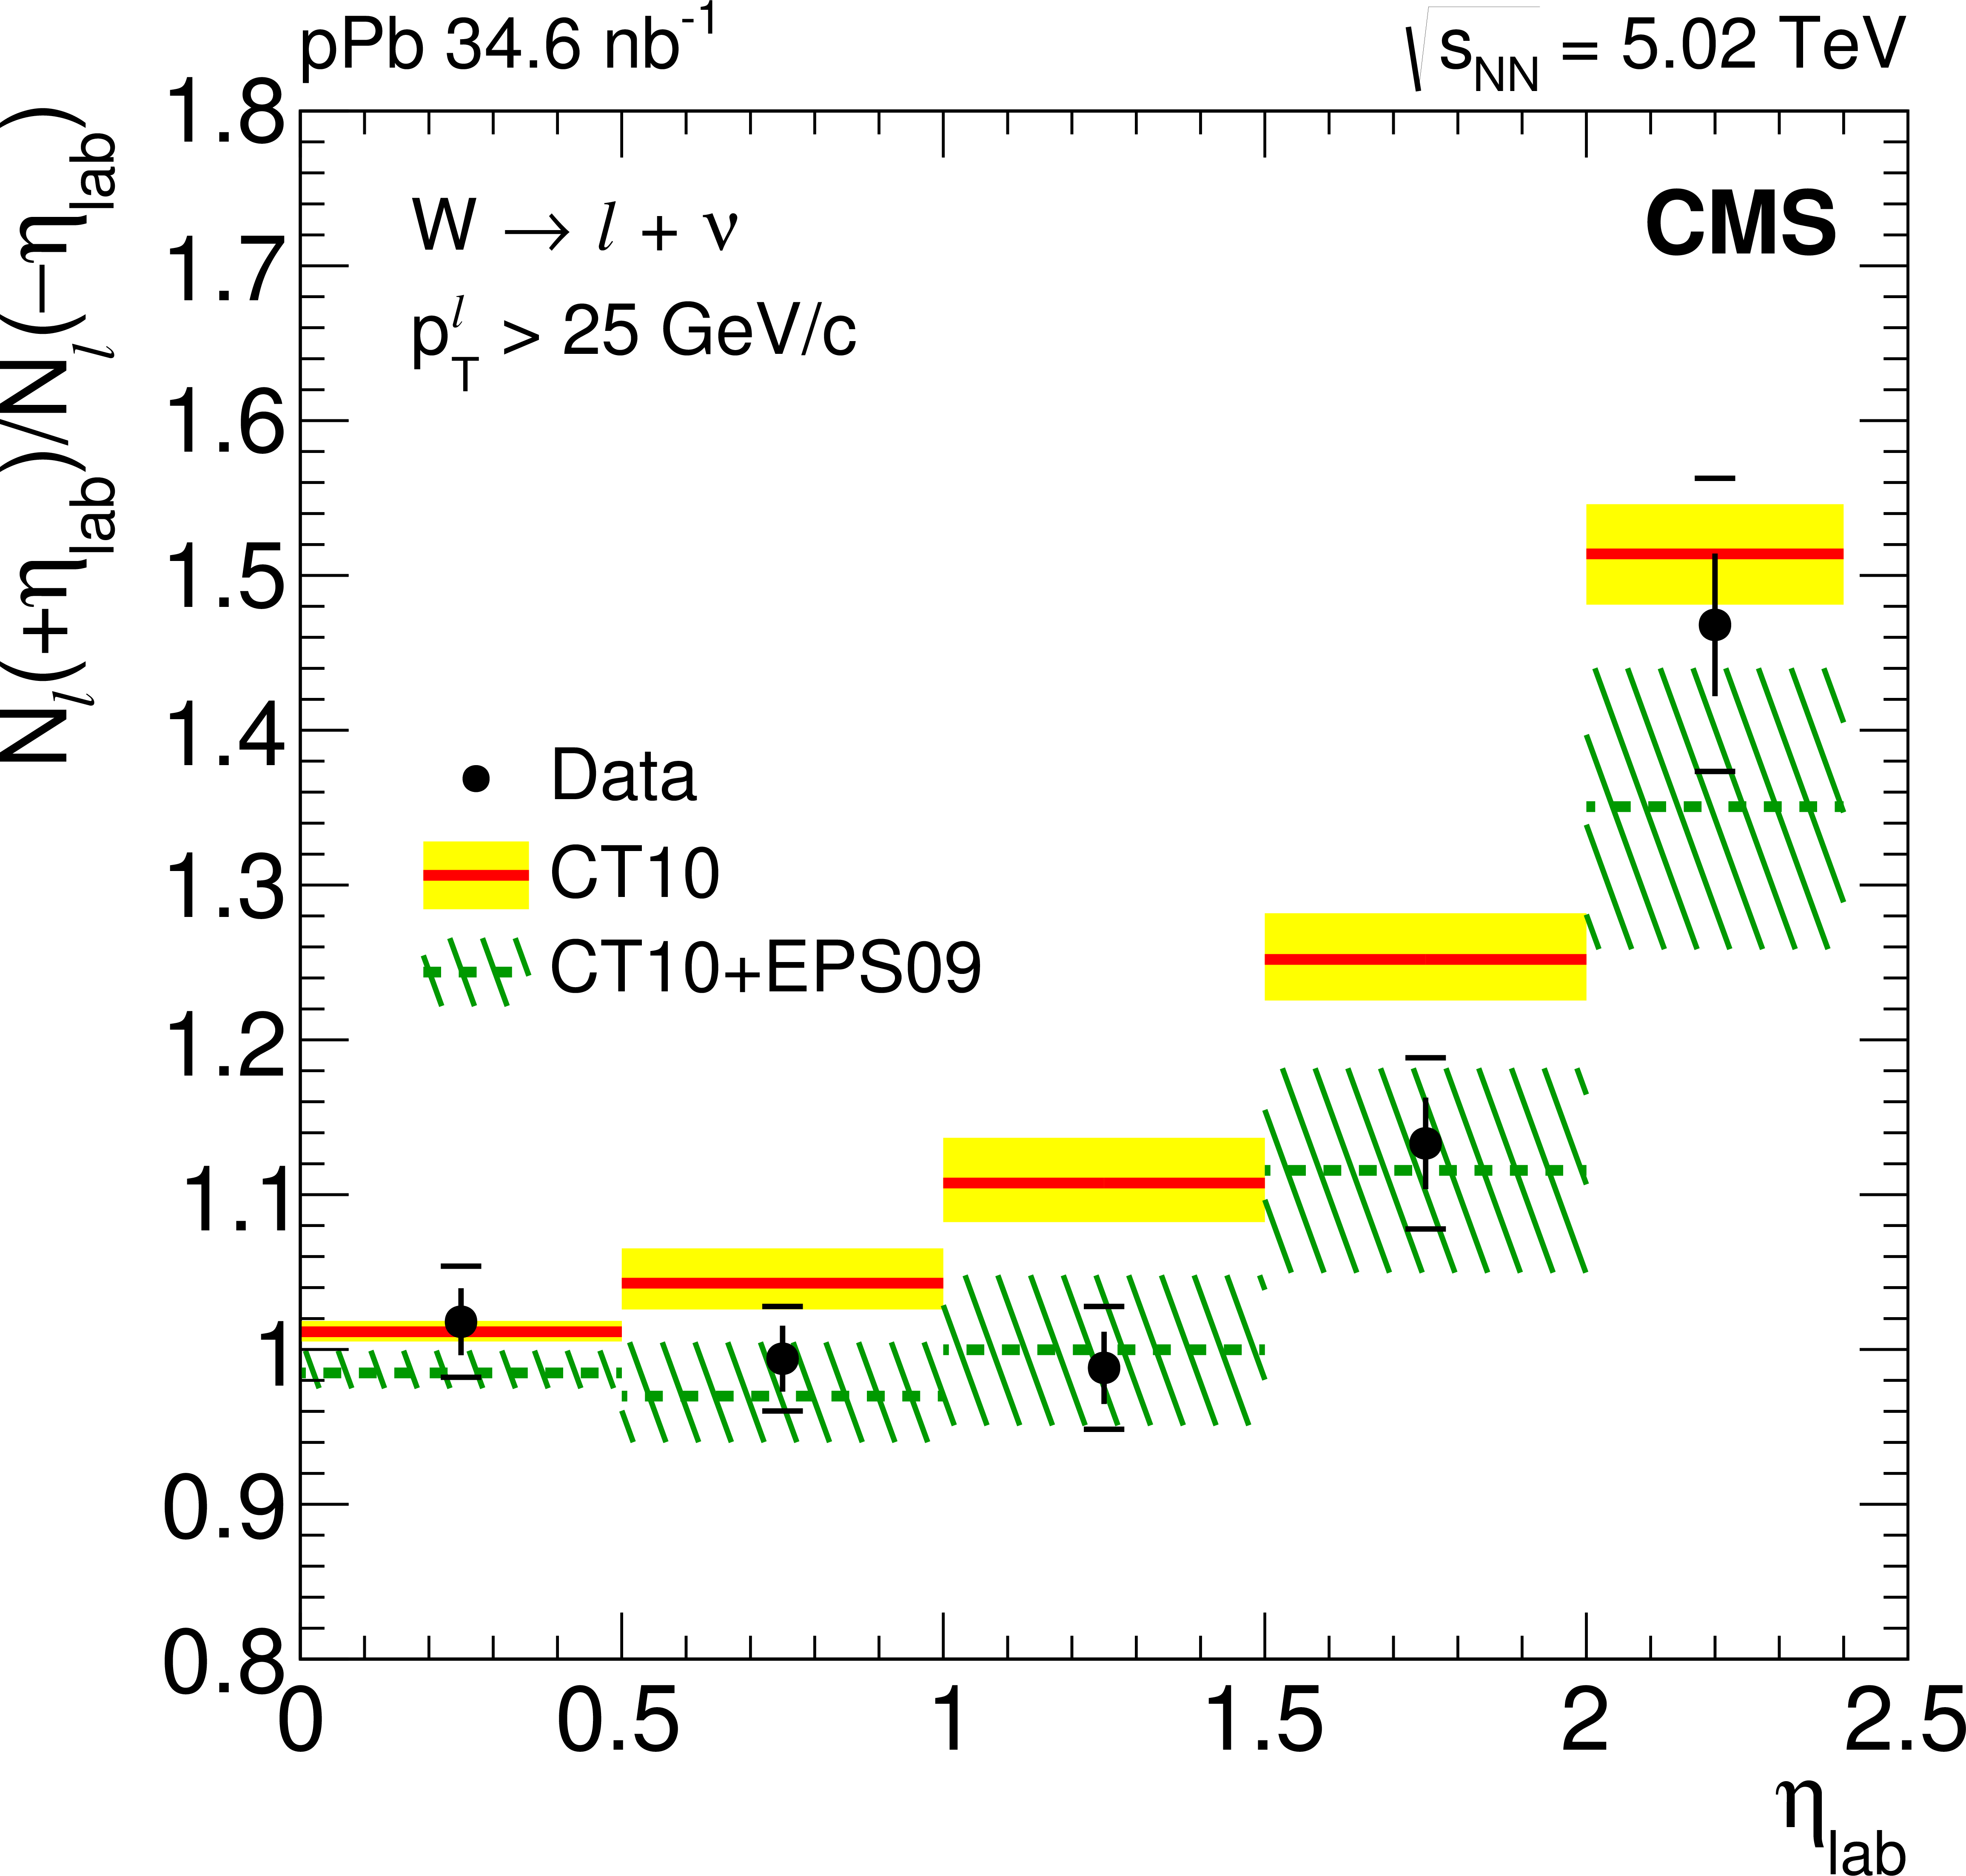
Figure 6:
The forward-backward asymmetry of charge-summed W bosons, as a function of the lepton pseudorapidity. Error bars represent the statistical uncertainties, while brackets show statistical and systematic uncertainties summed in quadrature. Theoretical predictions with (CT10+EPS09, dashed green line) and without (CT10, solid red line) PDF nuclear modifications are also shown, with their uncertainty bands. |
|
|
Compact Muon Solenoid LHC, CERN |
|

|

|

|

|

|