

Compact Muon Solenoid
LHC, CERN
| CMS-HIN-14-007 ; CERN-PH-EP-2015-205 | ||
| Transverse momentum spectra of b jets in pPb collisions at $\sqrt{ s_{\mathrm{NN}} } =$ 5.02 TeV | ||
| CMS Collaboration | ||
| 12 October 2015 | ||
| Phys. Lett. B 754 (2016) 59 | ||
| Abstract: We present a measurement of b jet transverse momentum ($ p_{\mathrm{T}} $) spectra in proton-lead (pPb) collisions using a dataset corresponding to about 35 nb$^{-1}$ collected with the CMS detector at the LHC. Jets from b quark fragmentation are found by exploiting the long lifetime of hadrons containing a b quark through tagging methods using distributions of the secondary vertex mass and displacement. Extracted cross sections for b jets are scaled by the effective number of nucleon-nucleon collisions and are compared to a reference obtained from PYTHIA simulations of pp collisions. The PYTHIA-based estimate of the nuclear modification factor is found to be 1.22 $\pm$ 0.15 (stat+syst pPb) $\pm$ 0.27 (syst PYTHIA) averaged over all jets with $ p_{\mathrm{T}} $ between 55 and 400 GeV$c$ and with $ | \eta_{\text{lab}} | < $ 2. We also compare this result to predictions from models using perturbative calculations in quantum chromodynamics. | ||
| Links: e-print arXiv:1510.03373 [nucl-ex] (PDF) ; CDS record ; inSPIRE record ; HepData record ; CADI line (restricted) ; | ||
| Figures | |
png pdf |
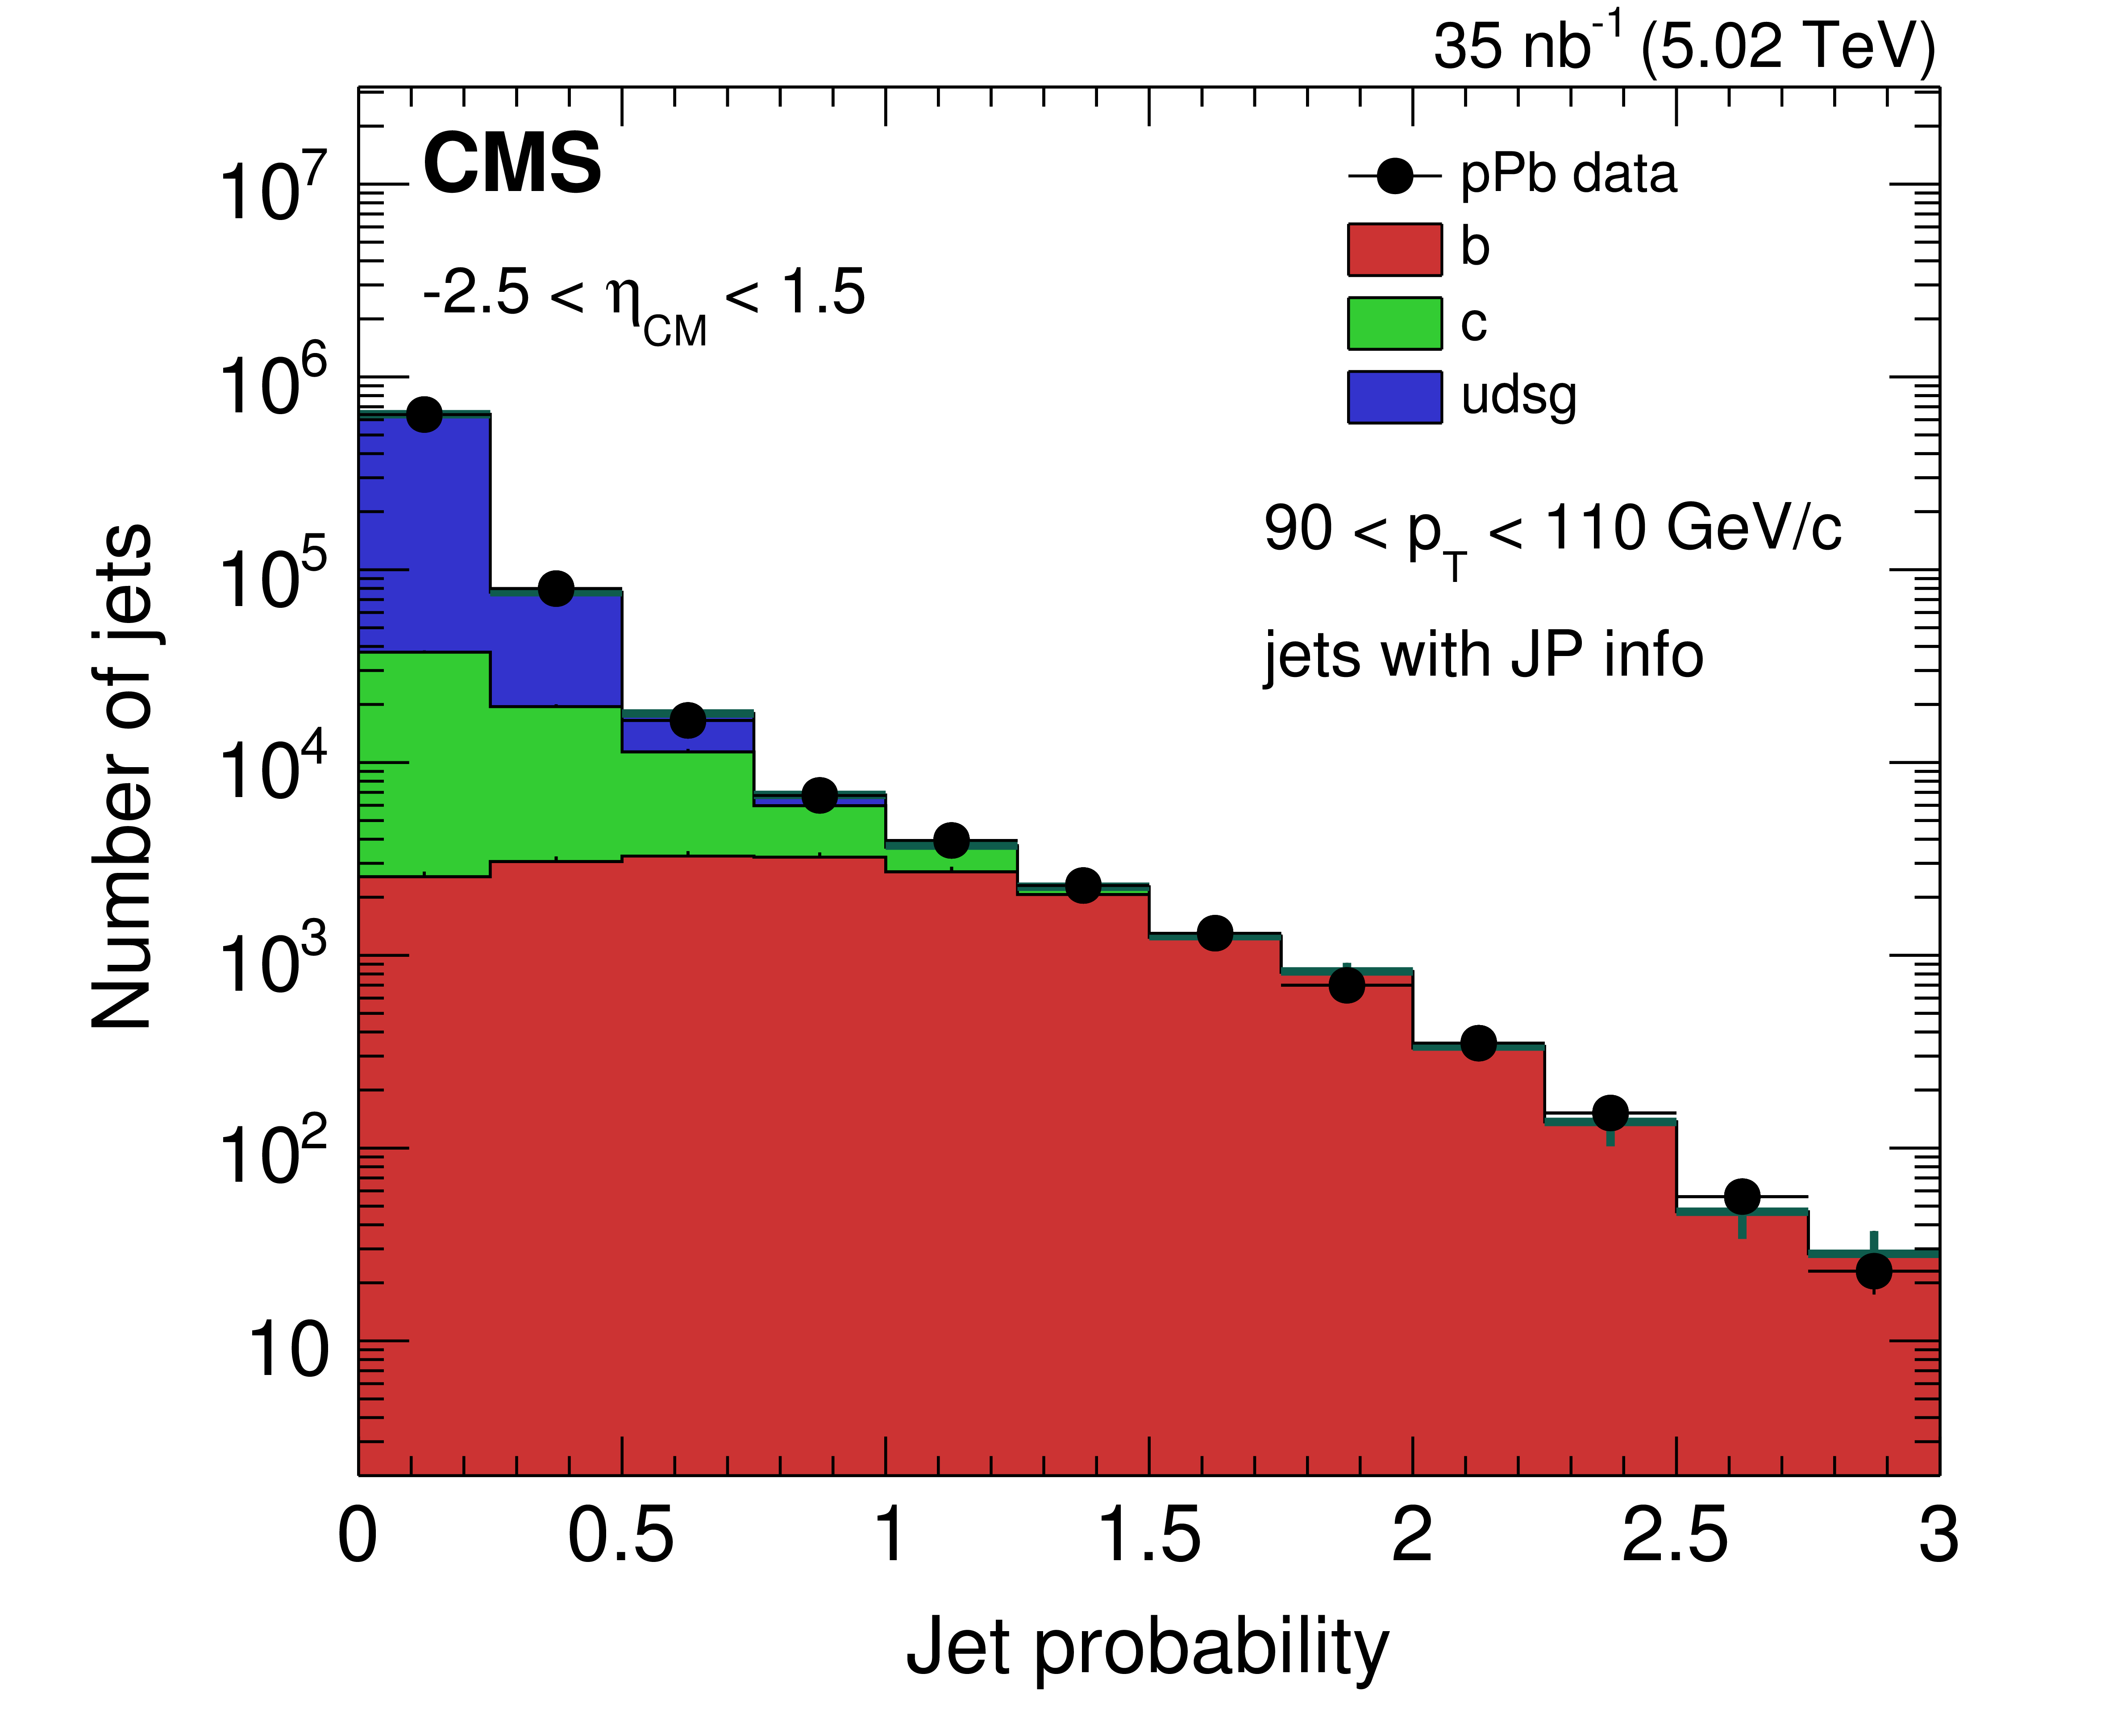
Figure 1-a:
Distributions of the JP tagger discriminator before (a) and after (b) applying the SSV tagger selection. Closed black points are data, while the colored histograms denote contributions from simulated b, c, and light-flavor jets in red, green and blue, respectively, obtained from a fit to data. Statistical uncertainties from data are in black, while statistical uncertainty from the templates are shown in dark green. |
png pdf |
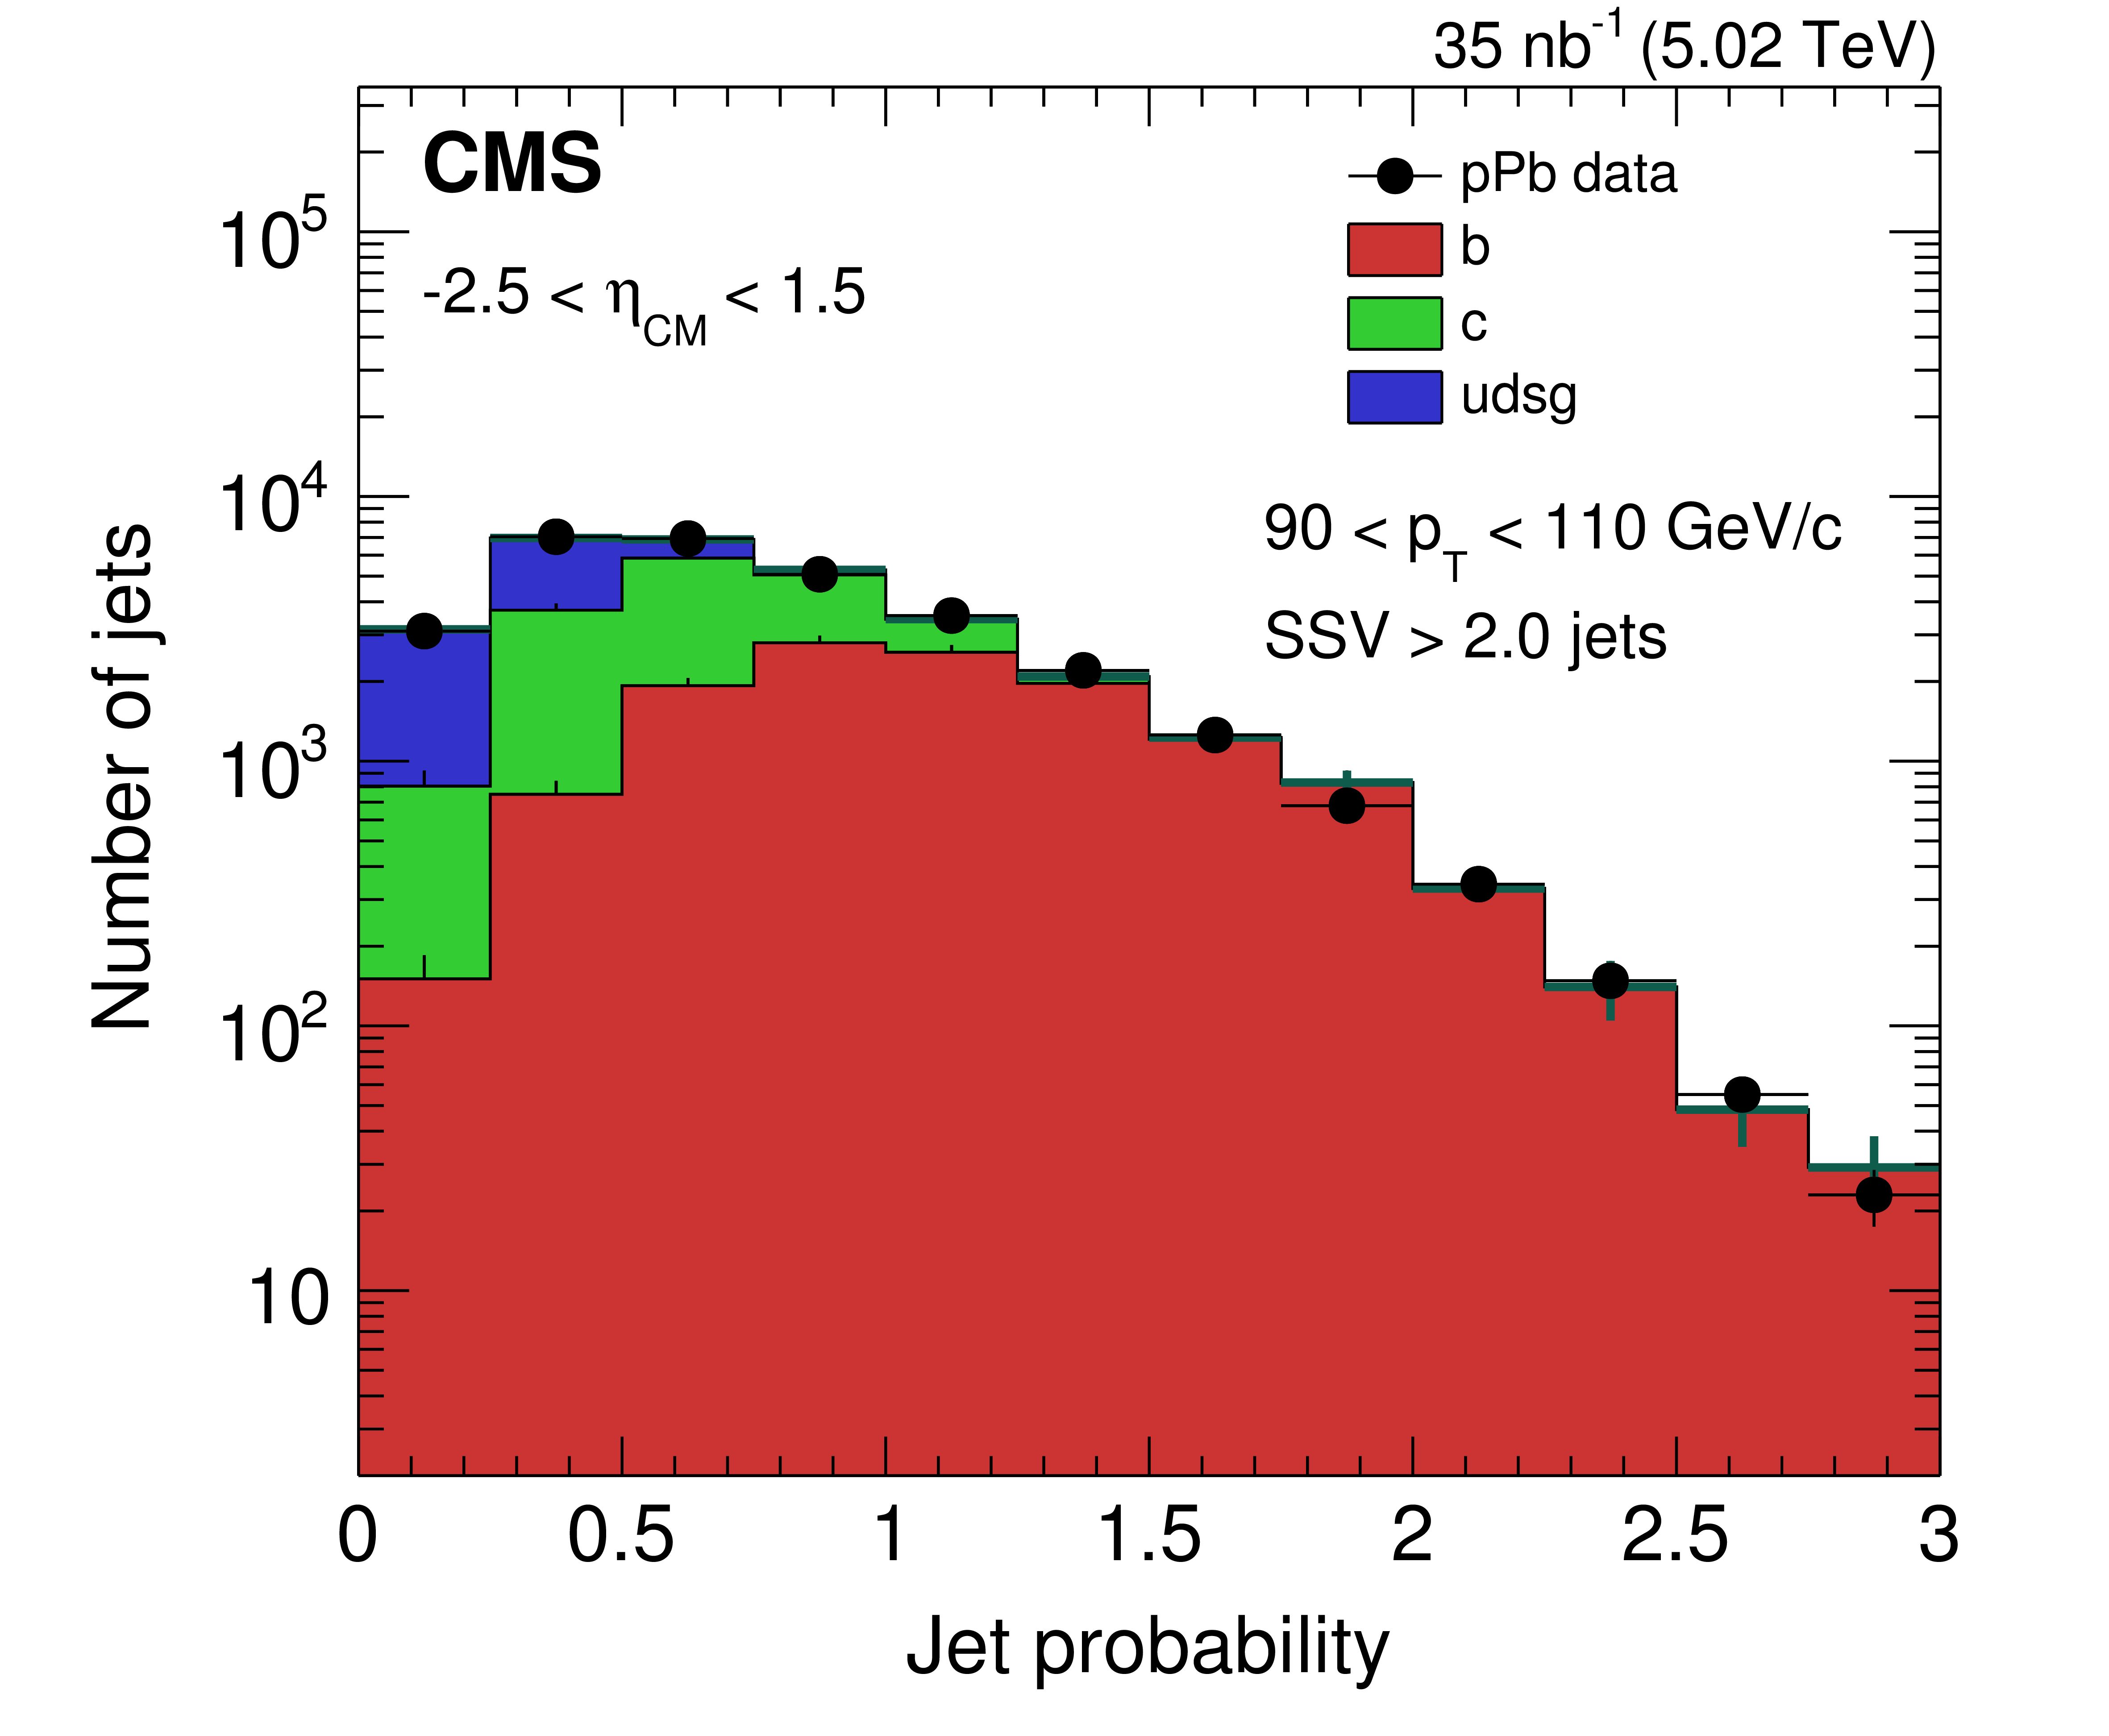
Figure 1-b:
Distributions of the JP tagger discriminator before (a) and after (b) applying the SSV tagger selection. Closed black points are data, while the colored histograms denote contributions from simulated b, c, and light-flavor jets in red, green and blue, respectively, obtained from a fit to data. Statistical uncertainties from data are in black, while statistical uncertainty from the templates are shown in dark green. |
png pdf |
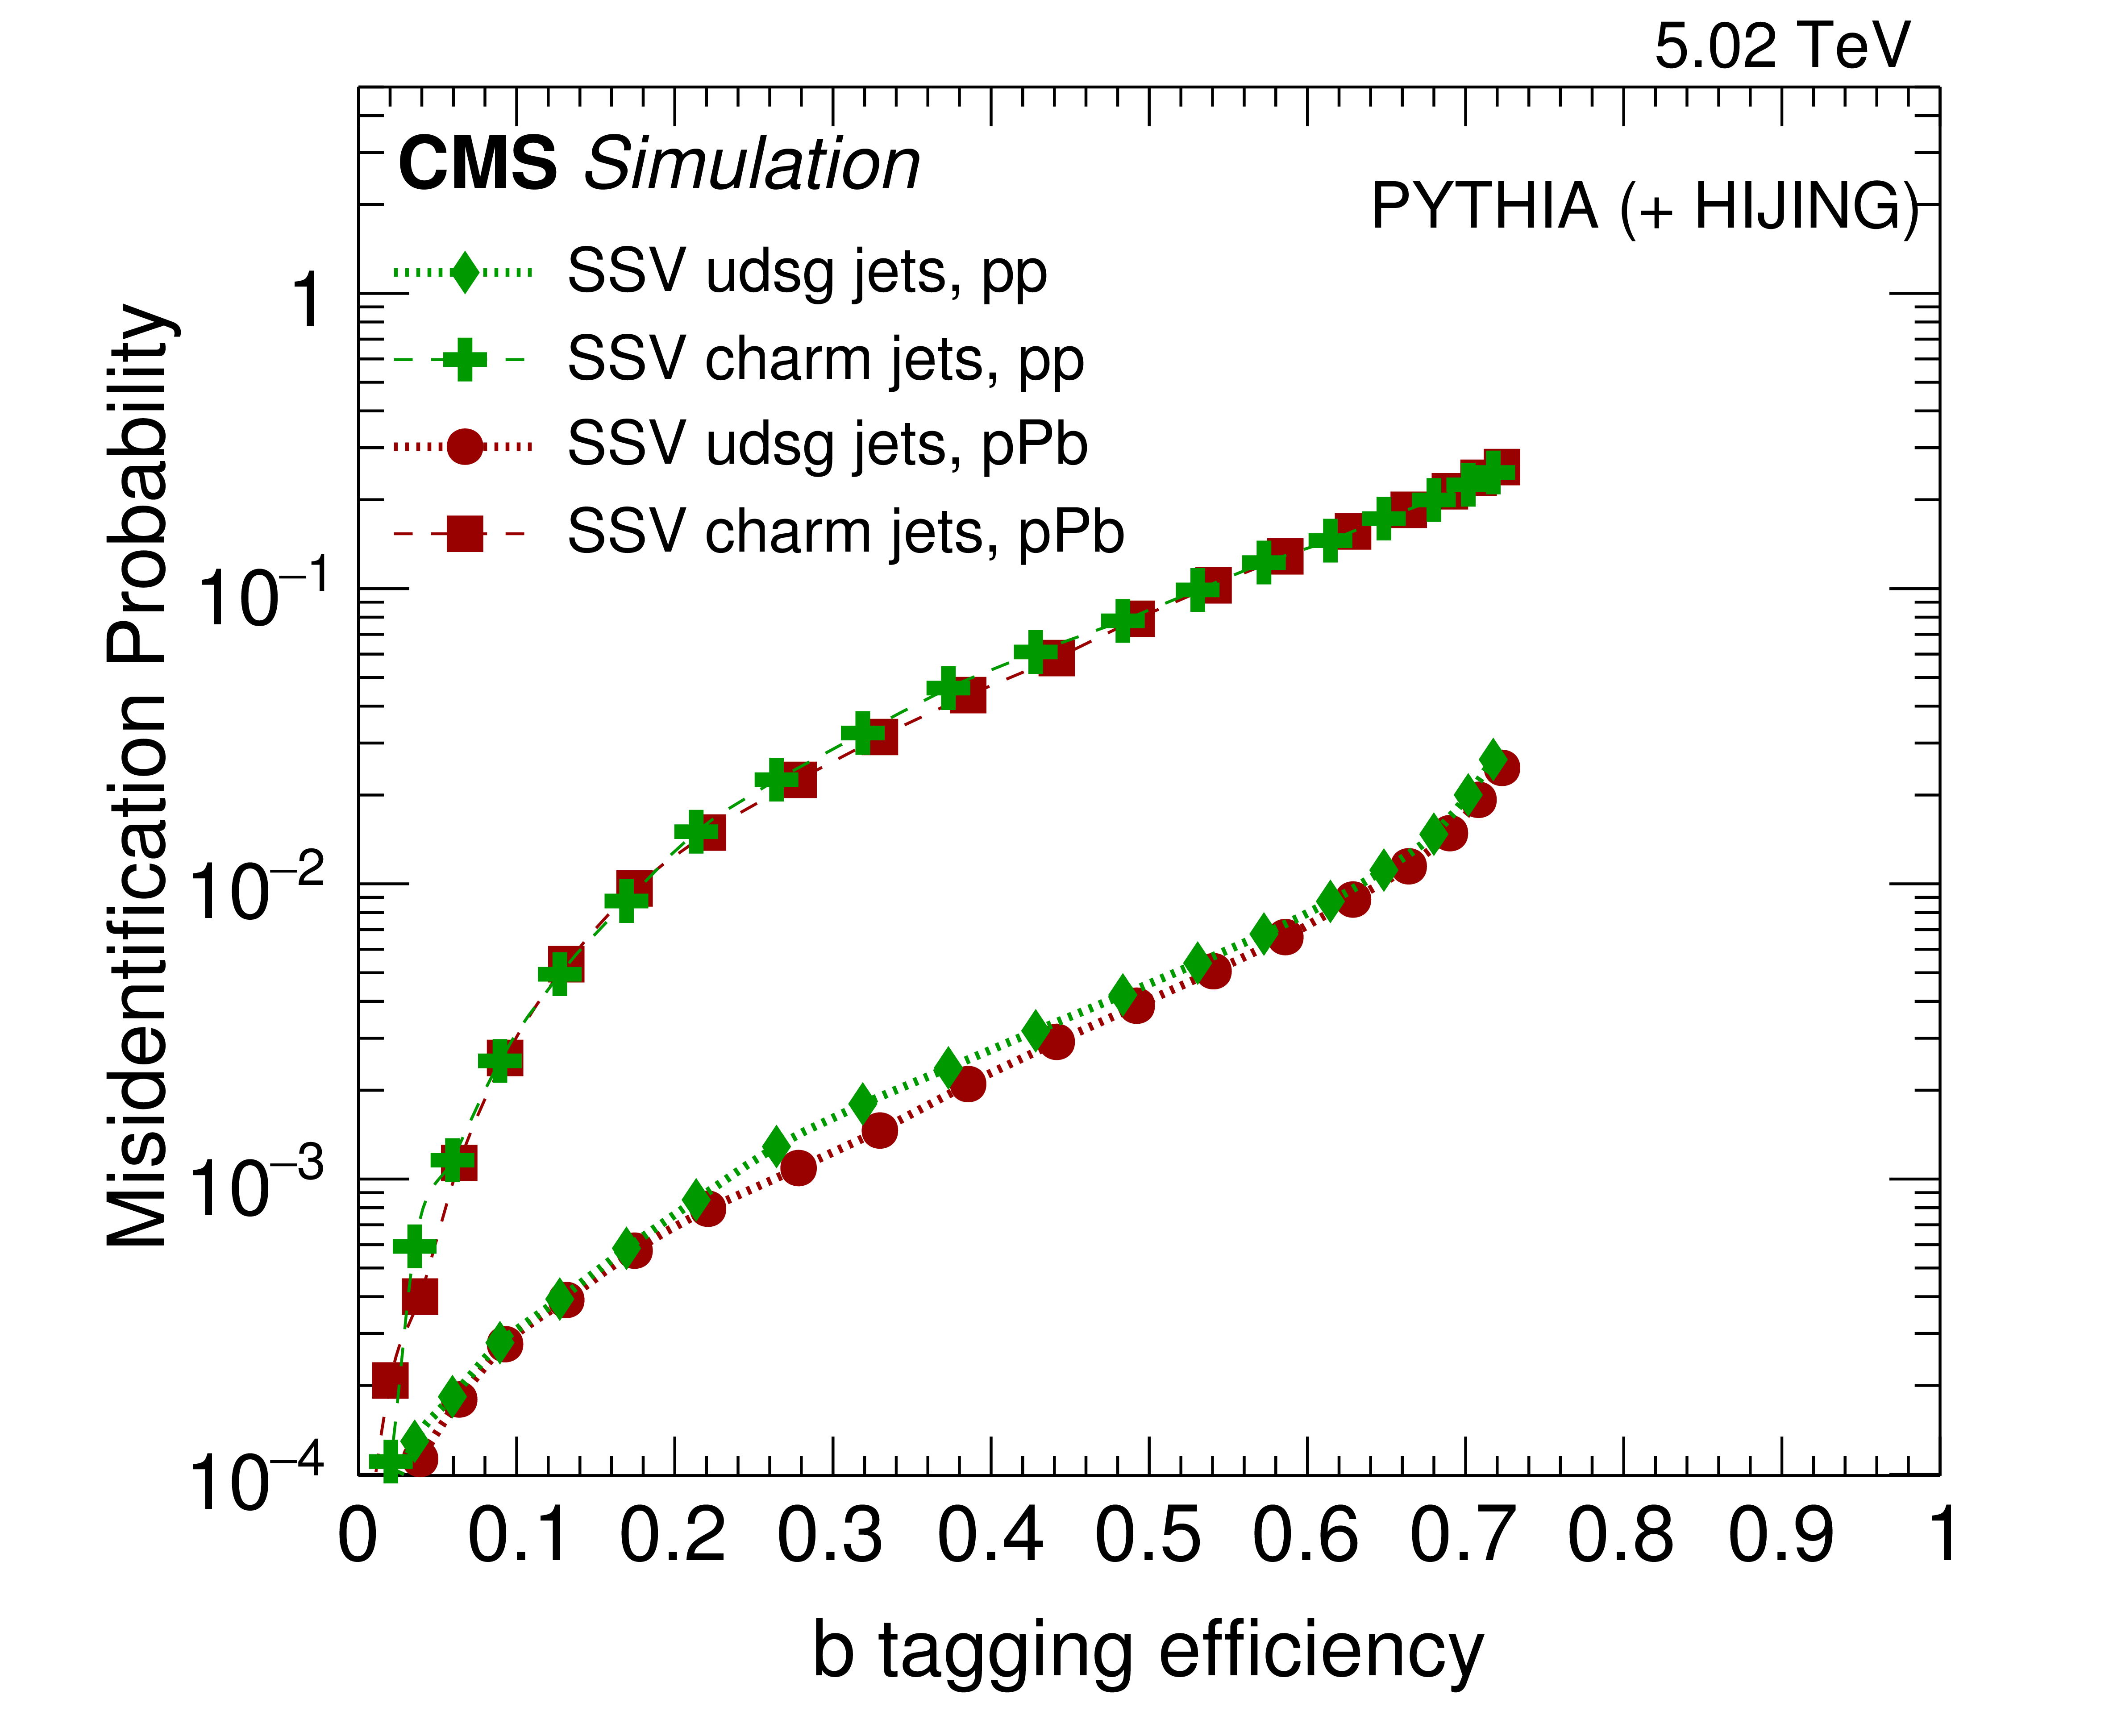
Figure 2-a:
The (a) plot shows the likelihood of misidentifying a light-flavor (circles and dotted lines) or charm (squares and dashed lines) jet as a b jet, as a function of the b tagging efficiency. Shown is the SSV tagger for pPb (purple) and pp (green) collisions. The (b) plot shows a template fit to the secondary vertex invariant mass distribution in pPb collisions for jets with 90 $ < {p_{\mathrm {T}}} <$ 110 GeV/$c$. Closed black points are data, while the colored histograms denote distributions of b, c, and light-quark jets in red, green and blue, respectively, extracted from the fit to data. Statistical uncertainties from data are shown as black vertical bars, while statistical uncertainties from the templates are shown as dark green vertical bars around the sum of the templates. |
png pdf |
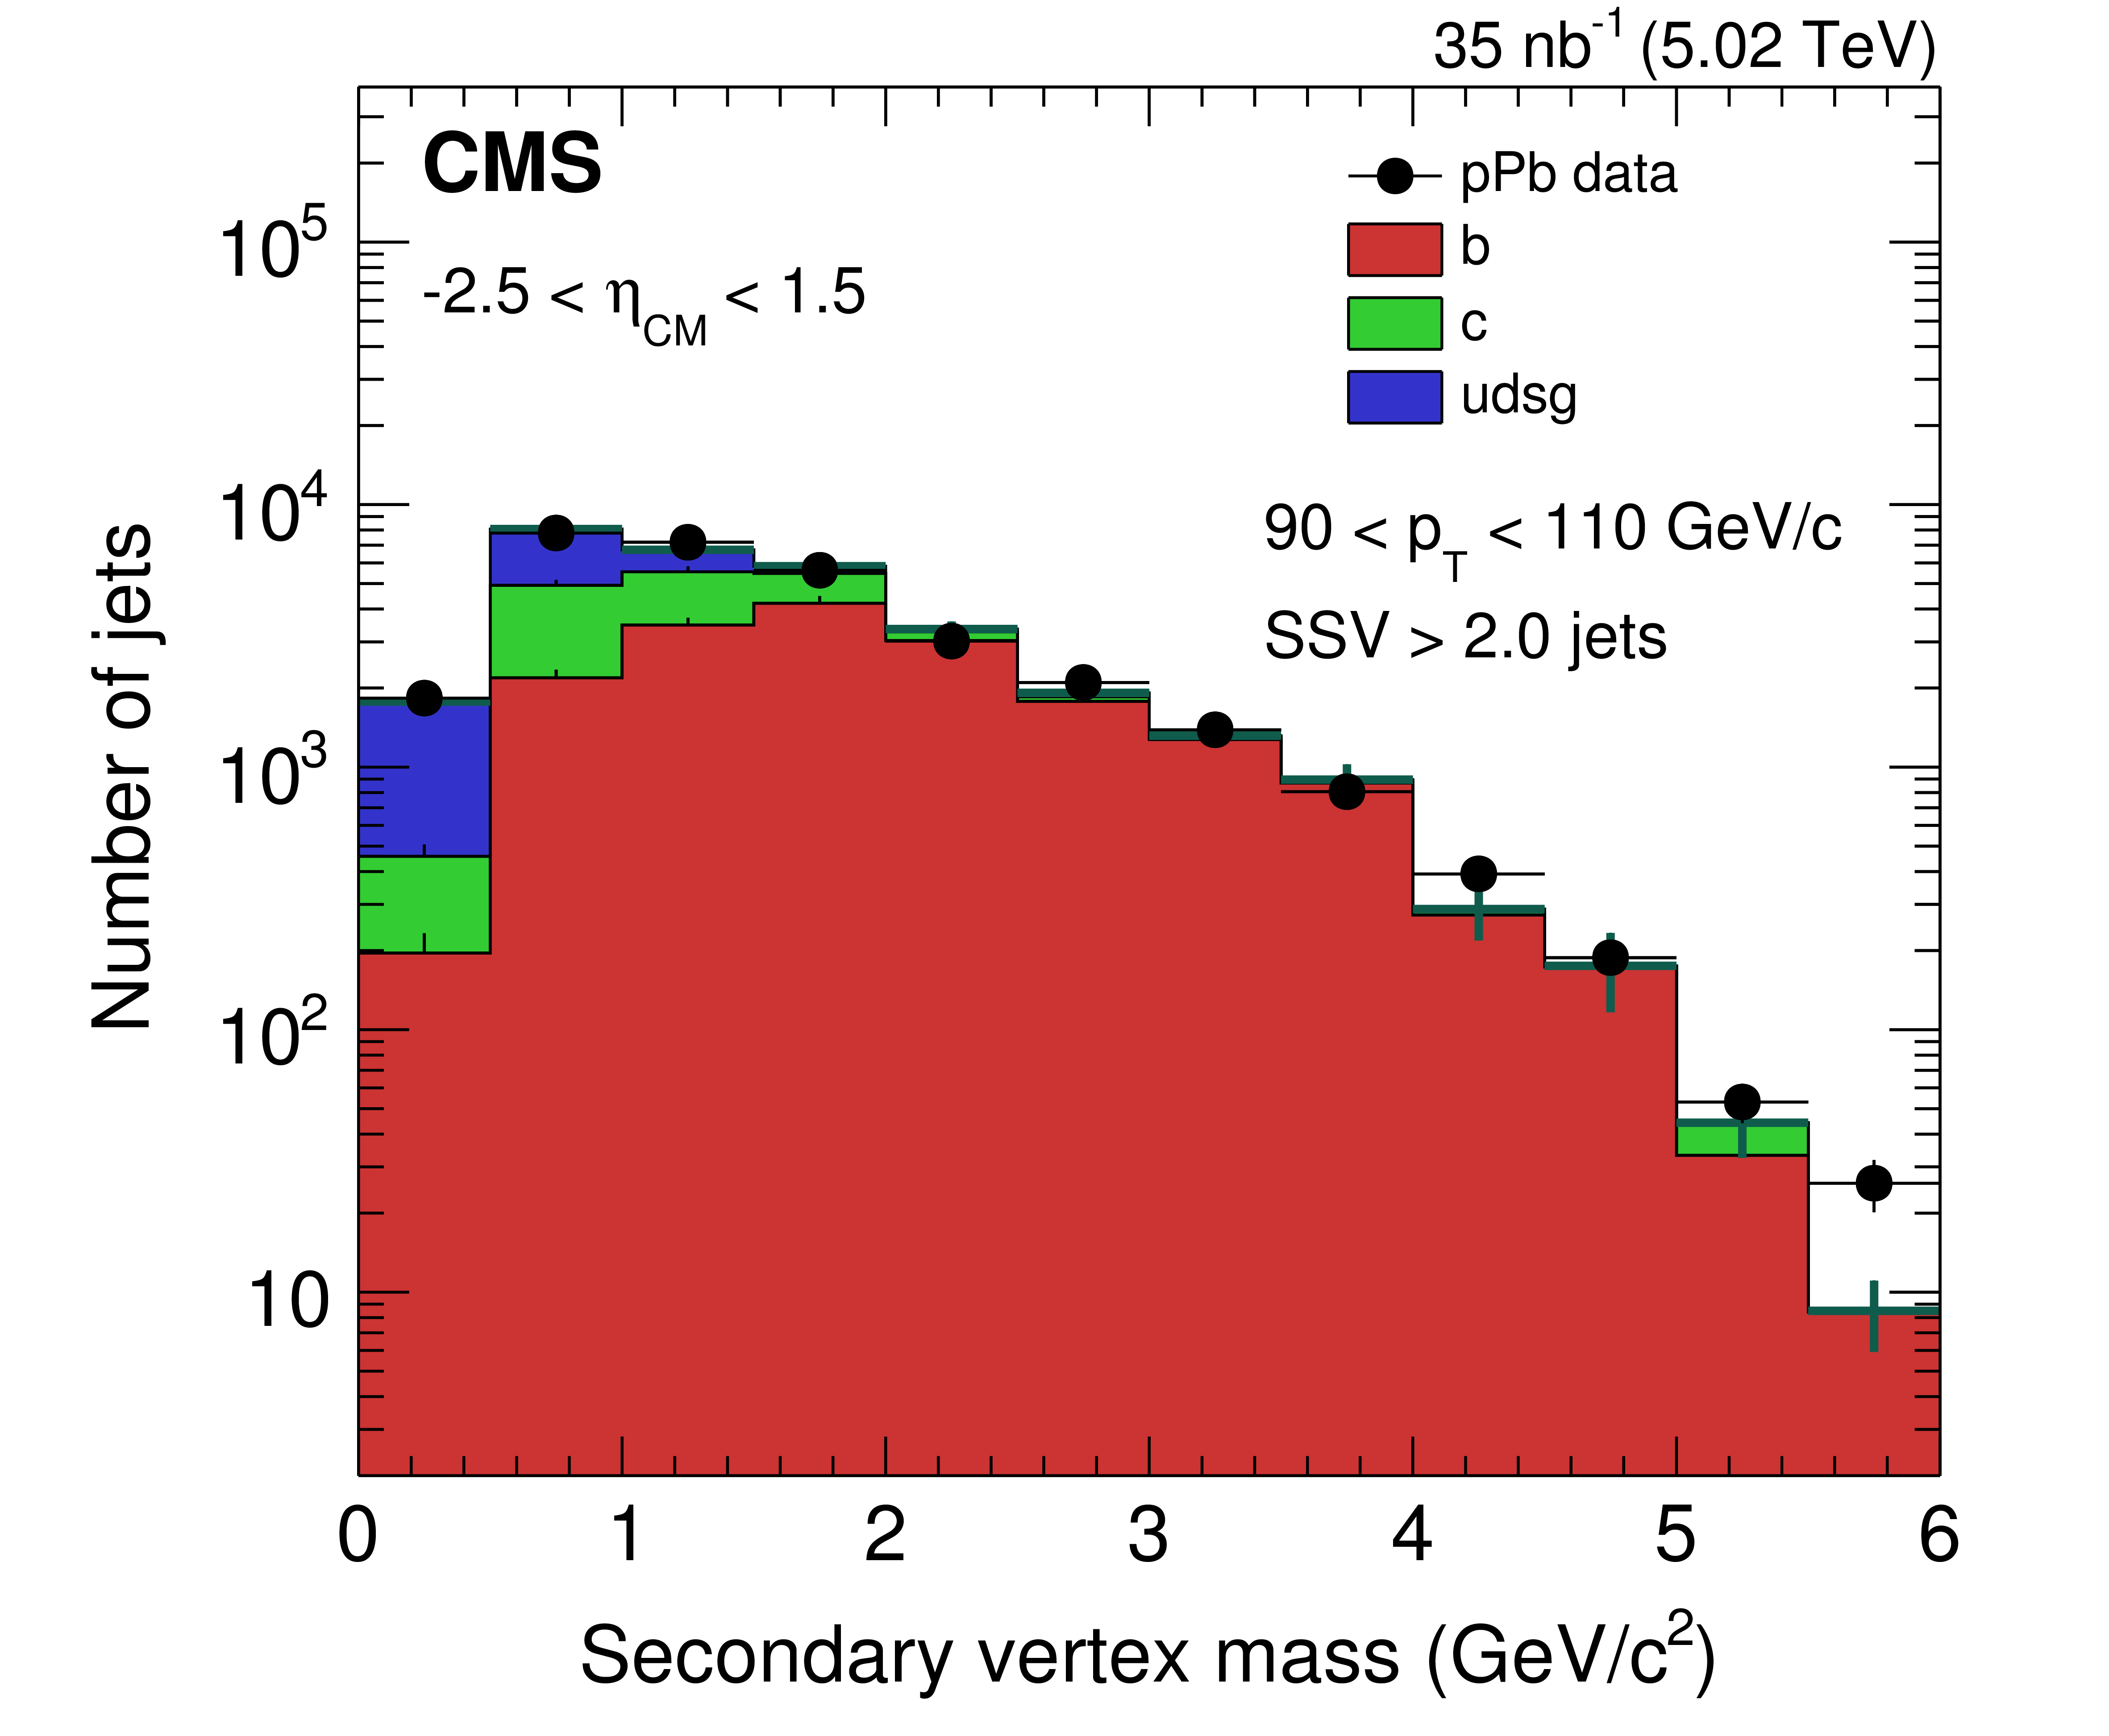
Figure 2-b:
The (a) plot shows the likelihood of misidentifying a light-flavor (circles and dotted lines) or charm (squares and dashed lines) jet as a b jet, as a function of the b tagging efficiency. Shown is the SSV tagger for pPb (purple) and pp (green) collisions. The (b) plot shows a template fit to the secondary vertex invariant mass distribution in pPb collisions for jets with 90 $ < {p_{\mathrm {T}}} <$ 110 GeV/$c$. Closed black points are data, while the colored histograms denote distributions of b, c, and light-quark jets in red, green and blue, respectively, extracted from the fit to data. Statistical uncertainties from data are shown as black vertical bars, while statistical uncertainties from the templates are shown as dark green vertical bars around the sum of the templates. |
png pdf |
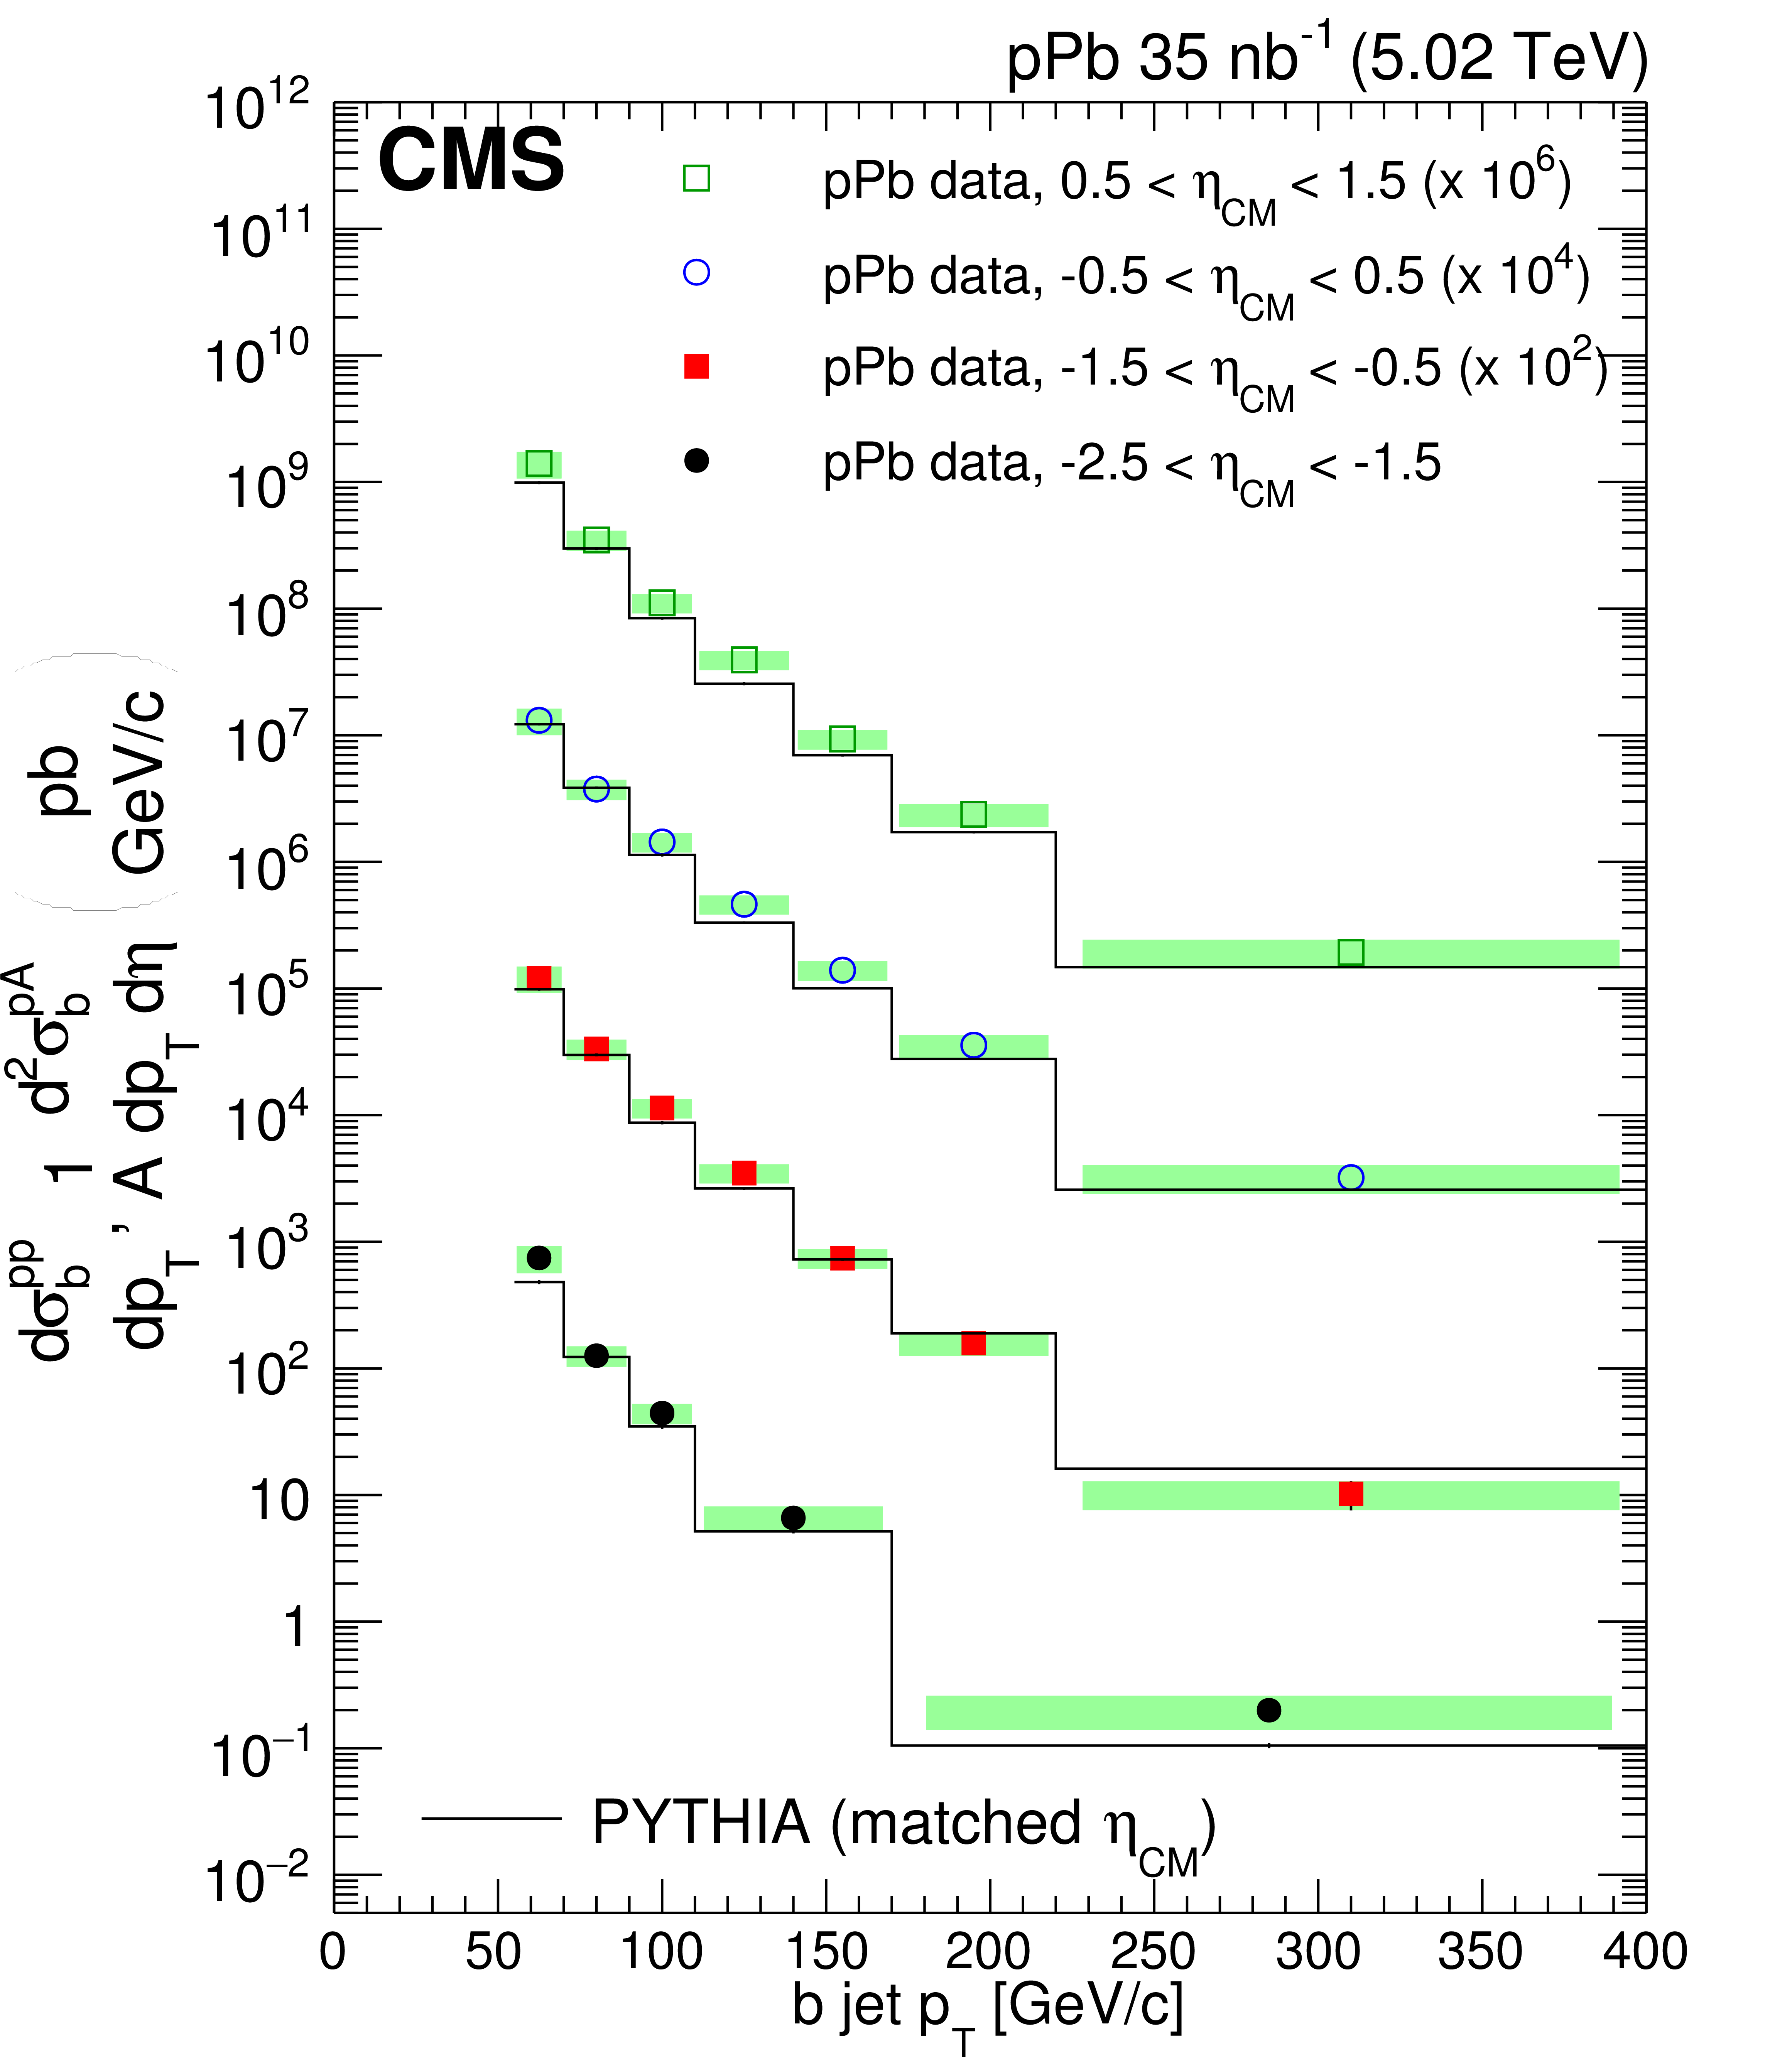
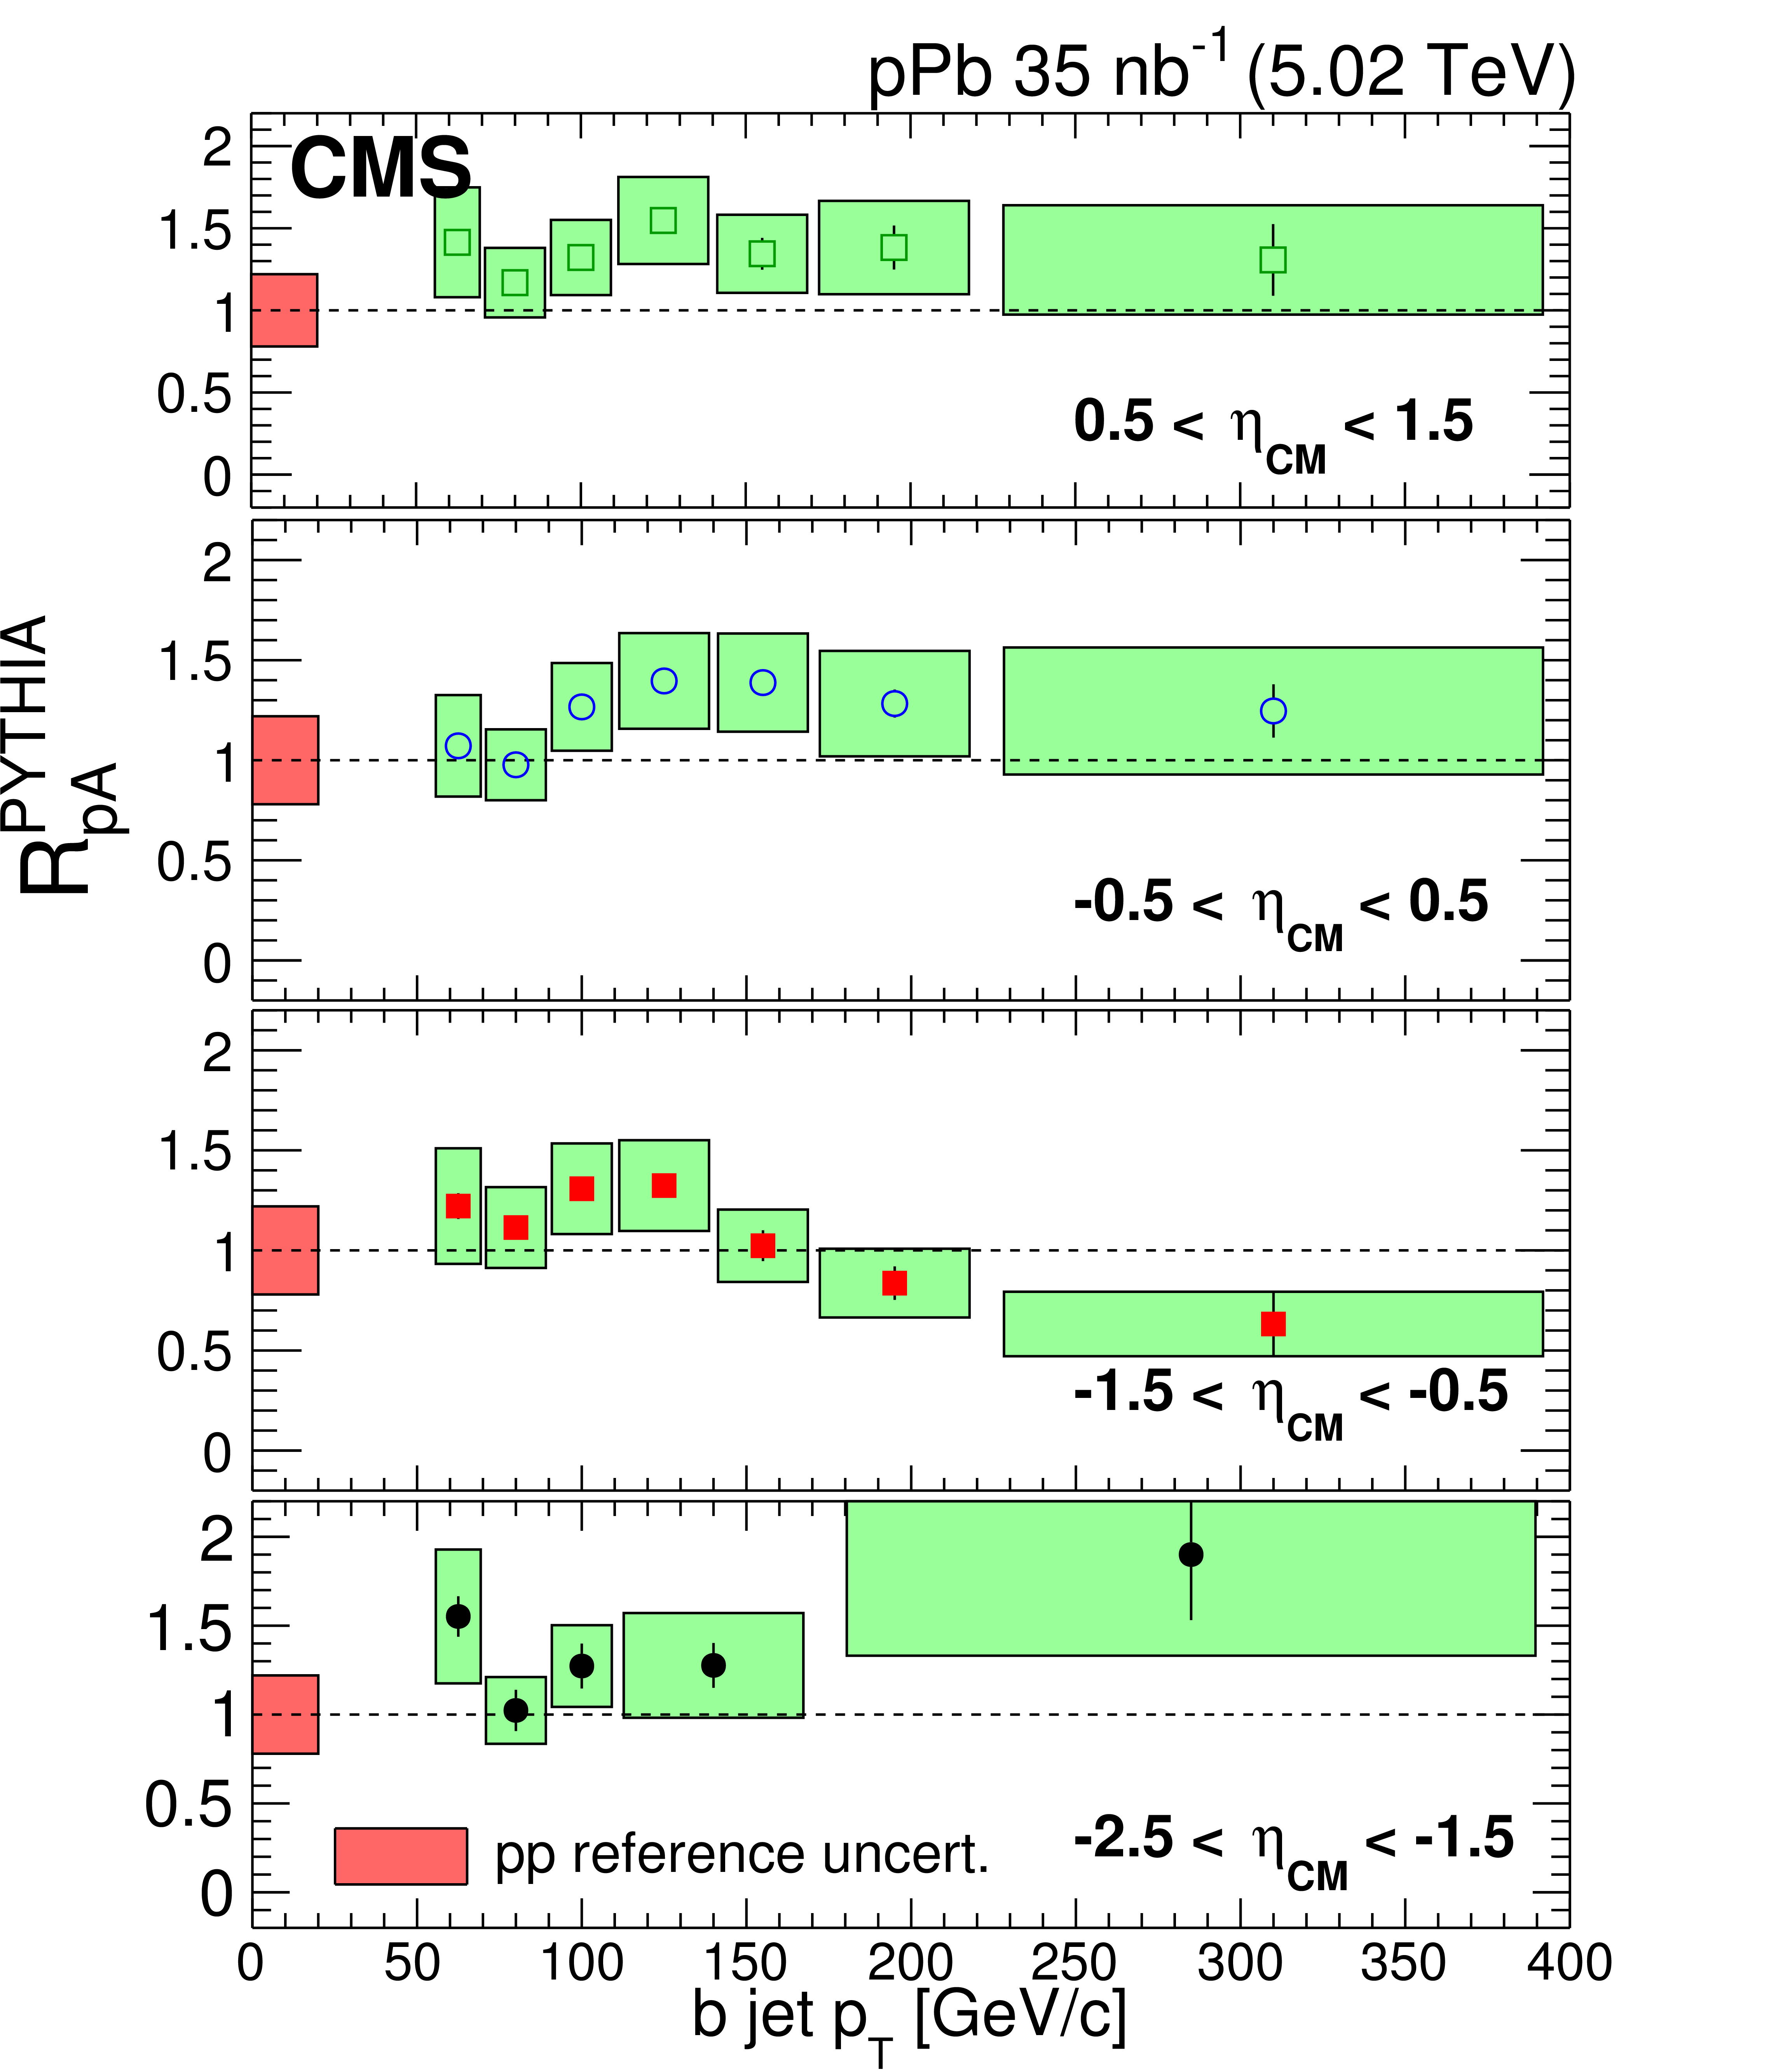
Figure 3-a:
The b jet cross section as a function of $ p_{\mathrm{T}} $ is shown for various pseudorapidity selections for pPb collisions, scaled by the mass number of lead (filled boxes), and compared to PYTHIA predictions of b jet cross sections in pp shown as bare histograms on the left. In addition, $\mathcal{R}^{\rm PYTHIA}_{\mathrm{ pA} }$ measurements for the same four $\eta_{CM}$ ranges are shown on the right. Positive $\eta$ corresponds to the direction of the proton beam. Statistical uncertainties are represented using vertical bars, while systematic uncertainties are shown as colored bands on the left and filled boxes on the right. The pp reference uncertainties are shown separately as red boxes around unity on the right panel. |
png pdf |
Figure 3-b:
The b jet cross section as a function of $ p_{\mathrm{T}} $ is shown for various pseudorapidity selections for pPb collisions, scaled by the mass number of lead (filled boxes), and compared to PYTHIA predictions of b jet cross sections in pp shown as bare histograms on the left. In addition, $\mathcal{R}^{\rm PYTHIA}_{\mathrm{ pA} }$ measurements for the same four $\eta_{CM}$ ranges are shown on the right. Positive $\eta$ corresponds to the direction of the proton beam. Statistical uncertainties are represented using vertical bars, while systematic uncertainties are shown as colored bands on the left and filled boxes on the right. The pp reference uncertainties are shown separately as red boxes around unity on the right panel. |
png pdf |
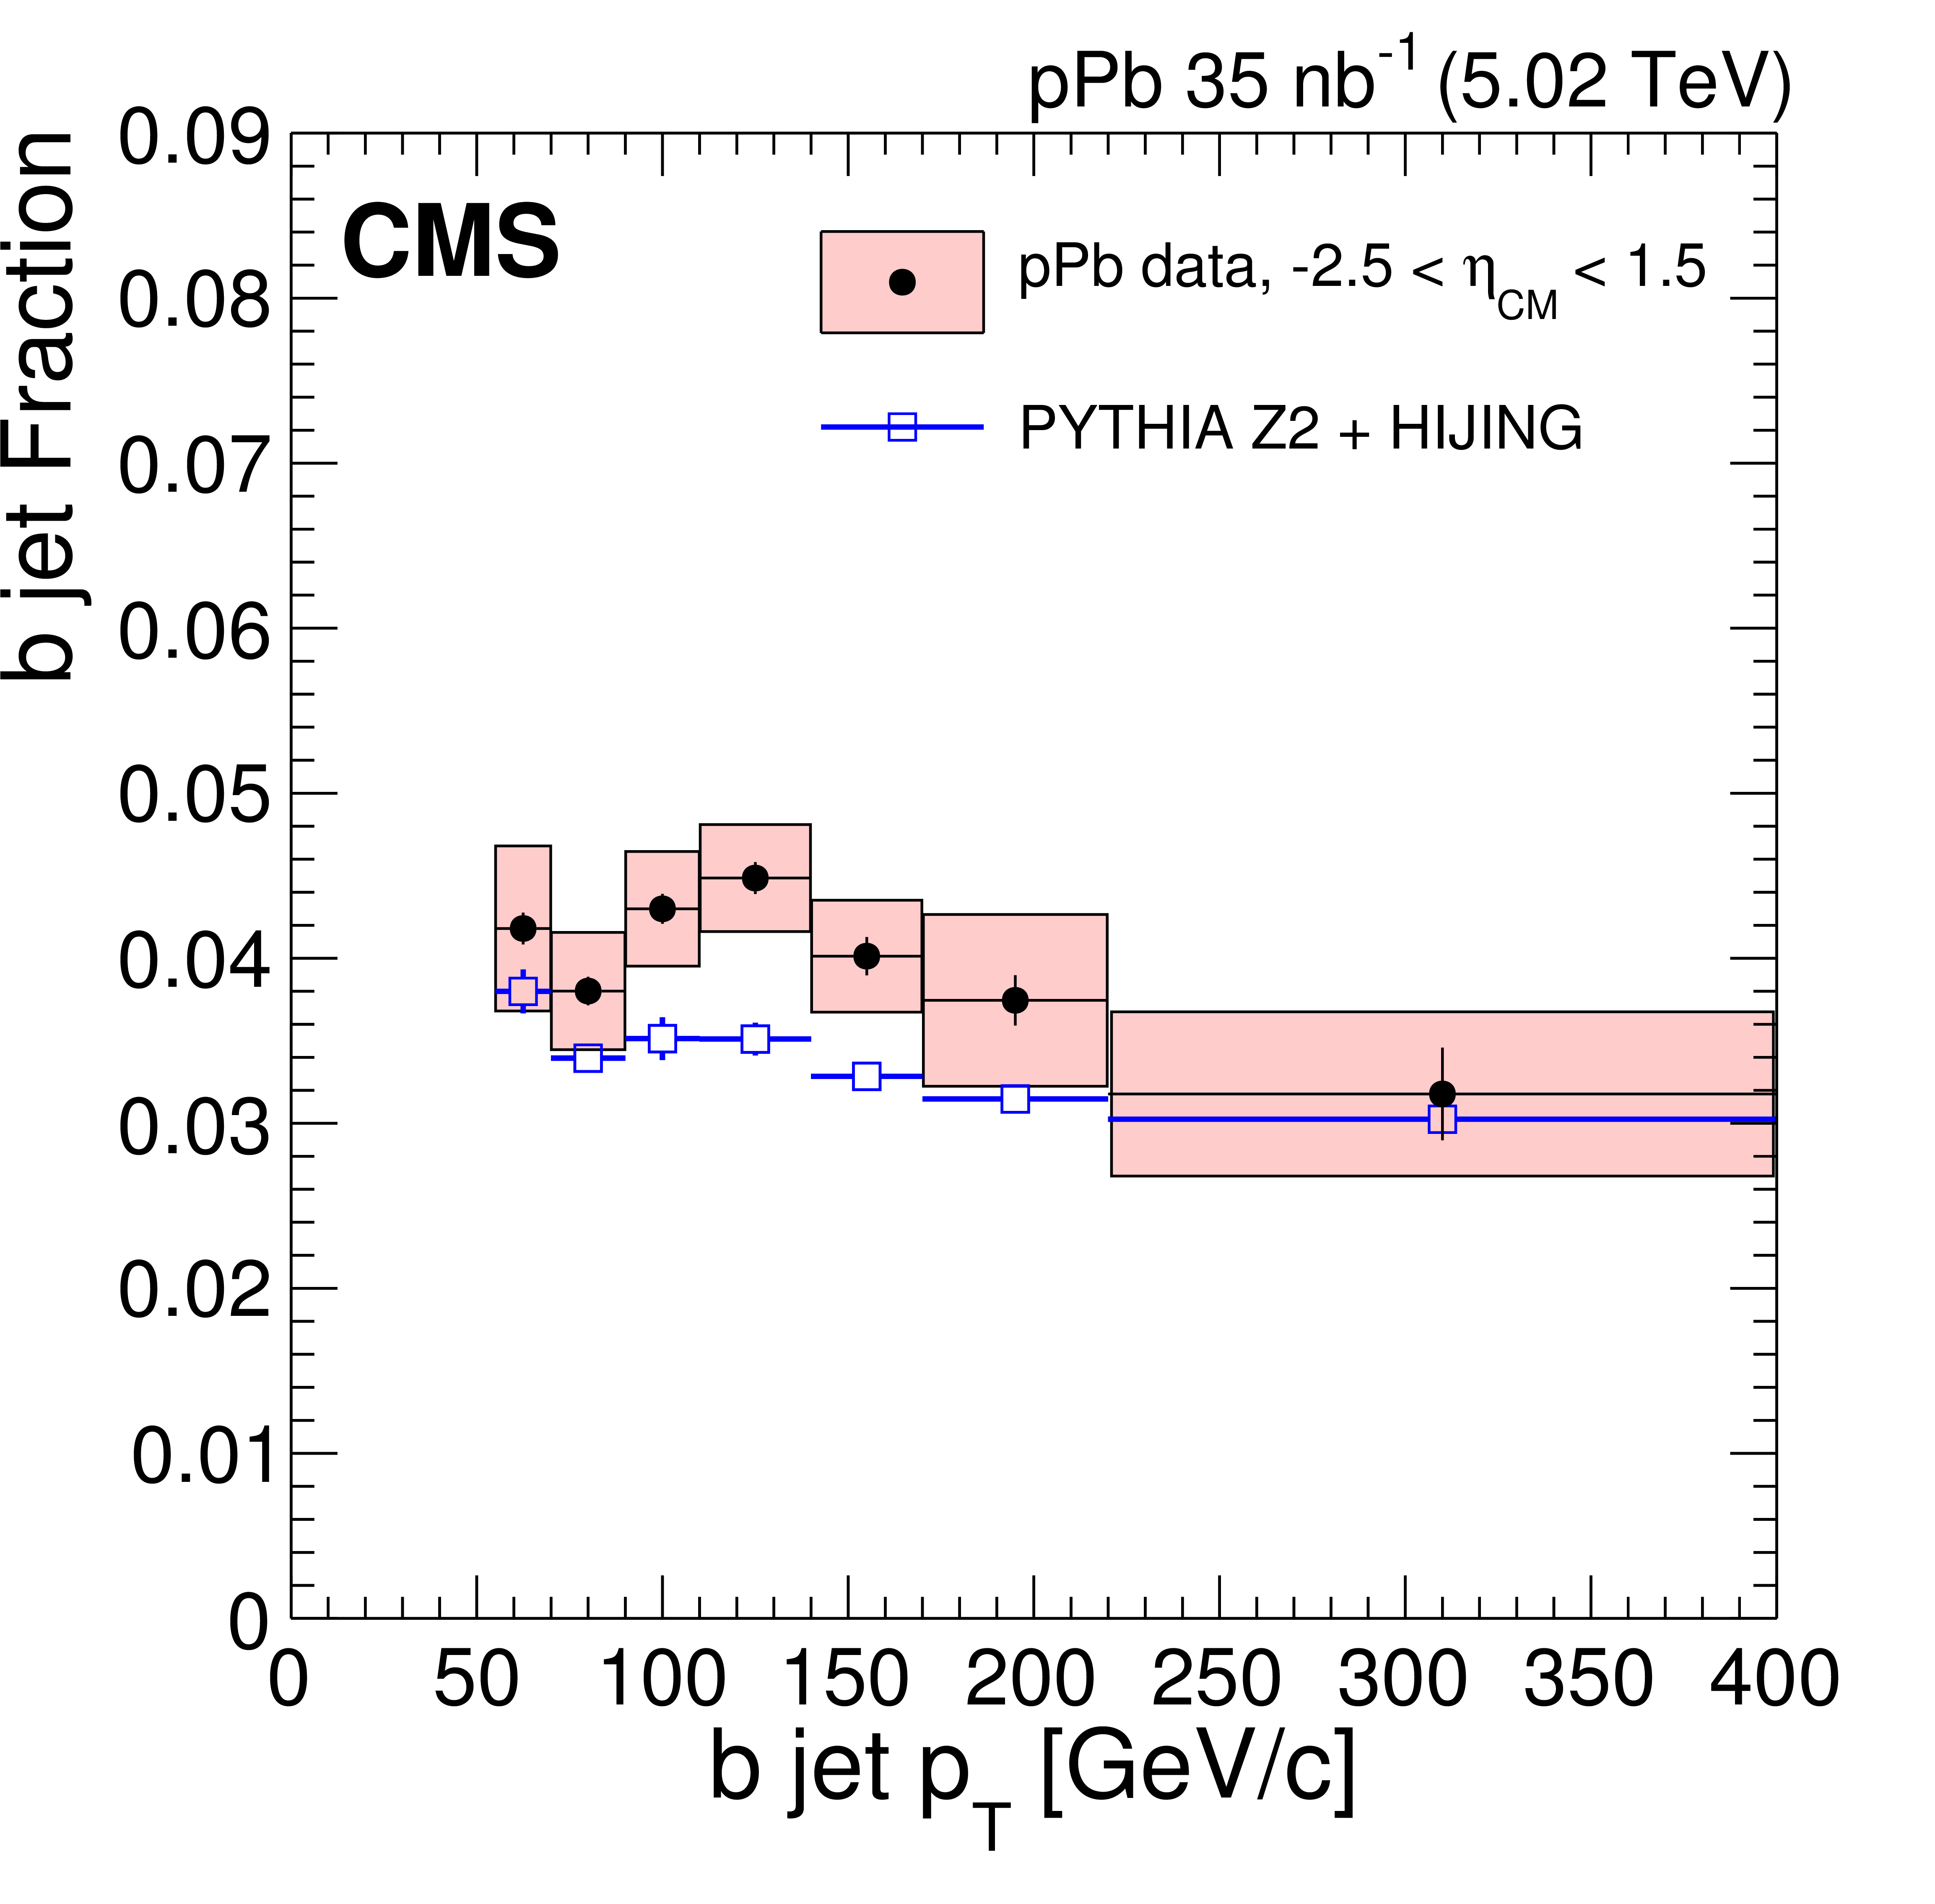
Figure 4:
The b jet fraction is shown for pPb data as filled black circles surrounded by filled boxes for systematic uncertainties, which are highly correlated to the b jet $\mathcal{R}^{\rm PYTHIA}_{\mathrm{ pA} }$ uncertainties. A simulation from the Z2 tune of PYTHIA+HIJING at $\sqrt{ s_{\mathrm{NN}} } =$ 5.02 TeV is also shown as open blue boxes. |
png pdf |
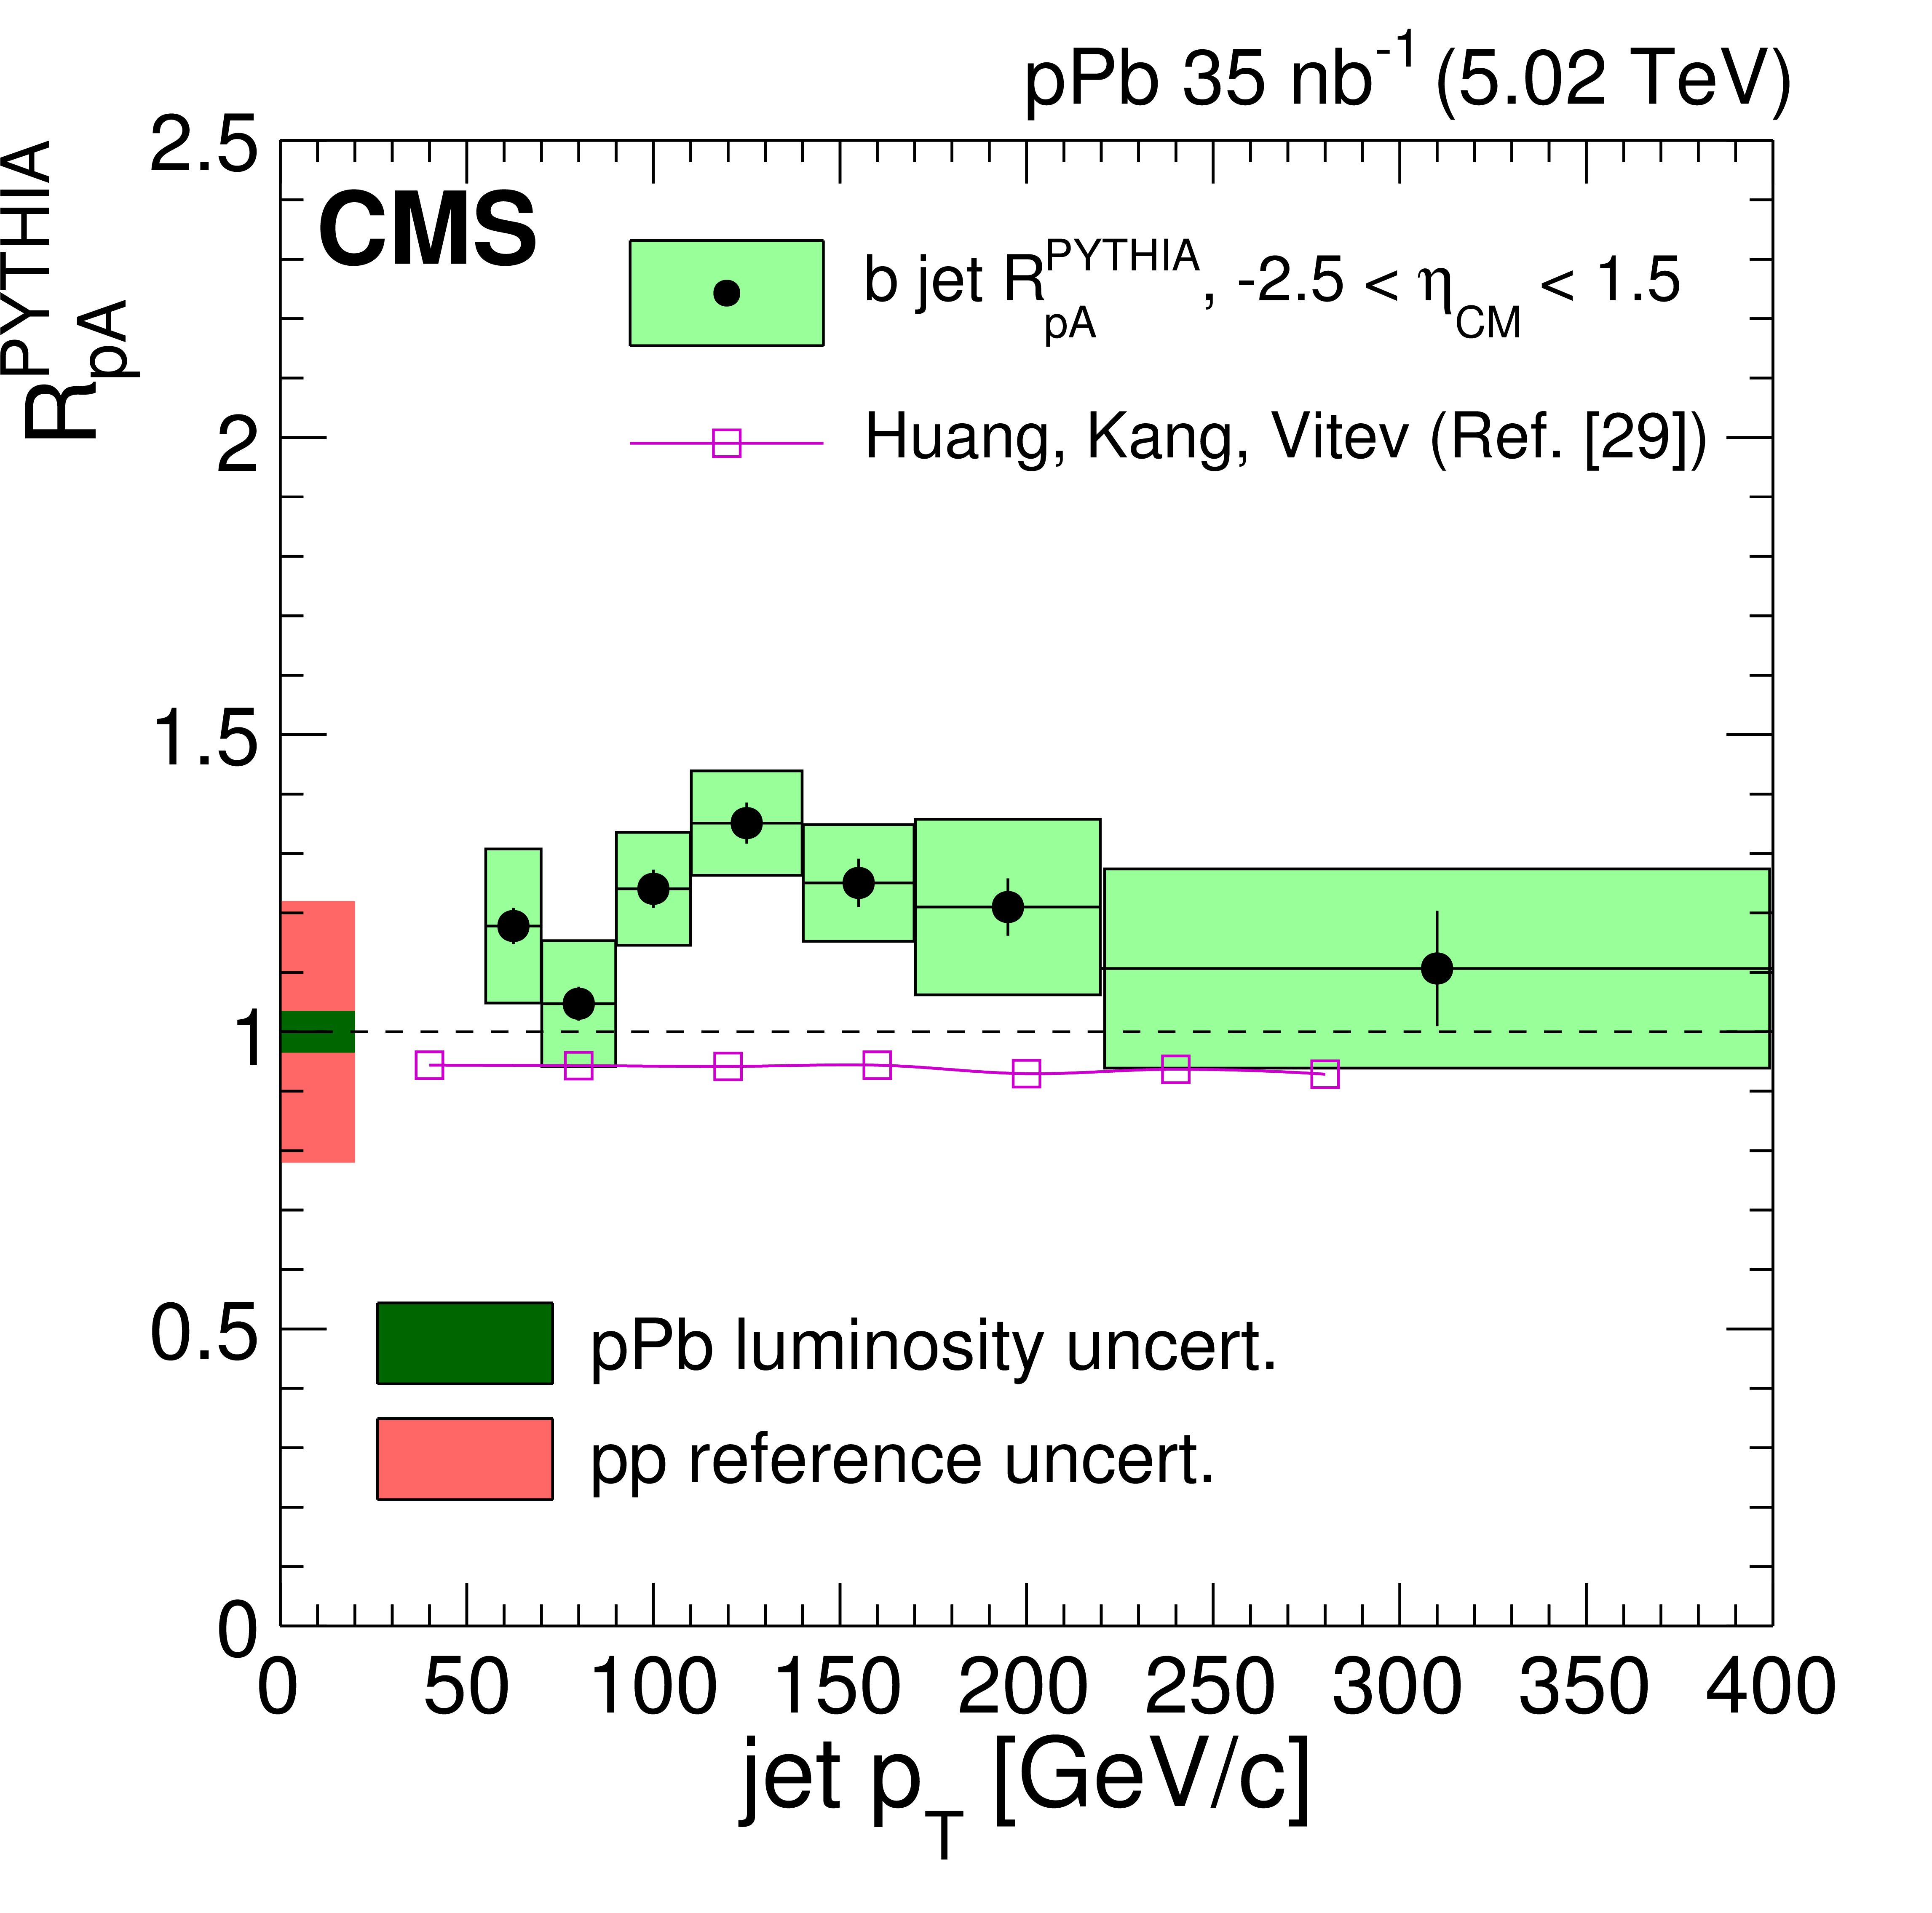
Figure 5:
The b jet $\mathcal{R}^{\rm PYTHIA}_{\mathrm{ pA} }$ as a function of jet $ p_{\mathrm{T}} $ is shown as points with filled boxes for systematic uncertainties. The pp reference and integrated luminosity uncertainties are shown as red and green bands around unity, respectively. A pQCD prediction from Huang et. al. [29] is also shown. |
| Summary |
| In summary, the first measurements of b jet production at 5.02 TeV have been presented over a $ p_{\mathrm{T}} $ range from 55?400 GeV/c and a pseudorapidity window of $- 2.5 < \eta_{\rm CM} < 1.5 $. A sizeable jet production enhancement from cold nuclear matter effects is not expected at such large $ p_{\mathrm{T}} $, a conclusion which the data supports. In addition, the observed value of $\mathcal{R}^{\rm PYTHIA}_{\mathrm{ pA} }$ =1.22 $\pm$ 0.15 (stat + syst pPb) $\pm$ 0.27 (syst PYTHIA) suggests that jet energy loss effects are not significant in the b jet events used in this analysis. We find that the pseudorapidity-integrated and pseudorapidity-dependent $\mathcal{R}^{\rm PYTHIA}_{\mathrm{ pA} }$ values are consistent both with unity and with the enhancement observed by CMS for charged particles at high $ p_{\mathrm{T}} $. We also find that the $\eta$-dependence of this result is very small, indicating that any nPDF effects are smaller than the uncertainties. Overall, these results provide a baseline for the study of in-medium b quark energy loss in PbPb collisions. Future measurements of b jets in pp collisions at 5.02 TeV will reduce the large systematic uncertainties from the current PYTHIA reference, allowing for a more precise measurement of b jet energy modification in pPb collisions. |
|
|
Compact Muon Solenoid LHC, CERN |
|

|

|

|

|

|