

Compact Muon Solenoid
LHC, CERN
| CMS-HIN-14-012 ; CERN-PH-EP-2015-039 | ||
| Evidence for transverse momentum and pseudorapidity dependent event plane fluctuations in PbPb and pPb collisions | ||
| CMS Collaboration | ||
| 5 March 2015 | ||
| Phys. Rev. C 92 (2015) 034911 | ||
| Abstract: A systematic study of the factorization of long-range azimuthal two-particle correlations into a product of single-particle anisotropies is presented as a function of pt and eta of both particles, and as a function of the particle multiplicity in PbPb and pPb collisions. The data were taken with the CMS detector for PbPb collisions at $ \sqrt{s_{ \mathrm{NN} } }$ = 2.76 TeV and pPb collisions at $ \sqrt{s_{ \mathrm{NN} } }$ = 5.02 TeV, covering a very wide range of multiplicity. Factorization is observed to be broken as a function of both particle pt and eta. When measured with particles of different pt, the magnitude of the factorization breakdown for the second Fourier harmonic reaches 20% for very central PbPb collisions but decreases rapidly as the multiplicity decreases. The data are consistent with viscous hydrodynamic predictions, which suggest that the effect of factorization breaking is mainly sensitive to the initial-state conditions rather than to the transport properties (e.g., shear viscosity) of the medium. The factorization breakdown is also computed with particles of different eta. The effect is found to be weakest for mid-central PbPb events but becomes larger for more central or peripheral PbPb collisions, and also for very high-multiplicity pPb collisions. The eta-dependent factorization data provide new insights to the longitudinal evolution of the medium formed in heavy ion collisions. | ||
| Links: e-print arXiv:1503.01692 [nucl-ex] (PDF) ; CDS record ; inSPIRE record ; Public twiki page ; HepData record ; CADI line (restricted) ; | ||
| Figures | |

png pdf |
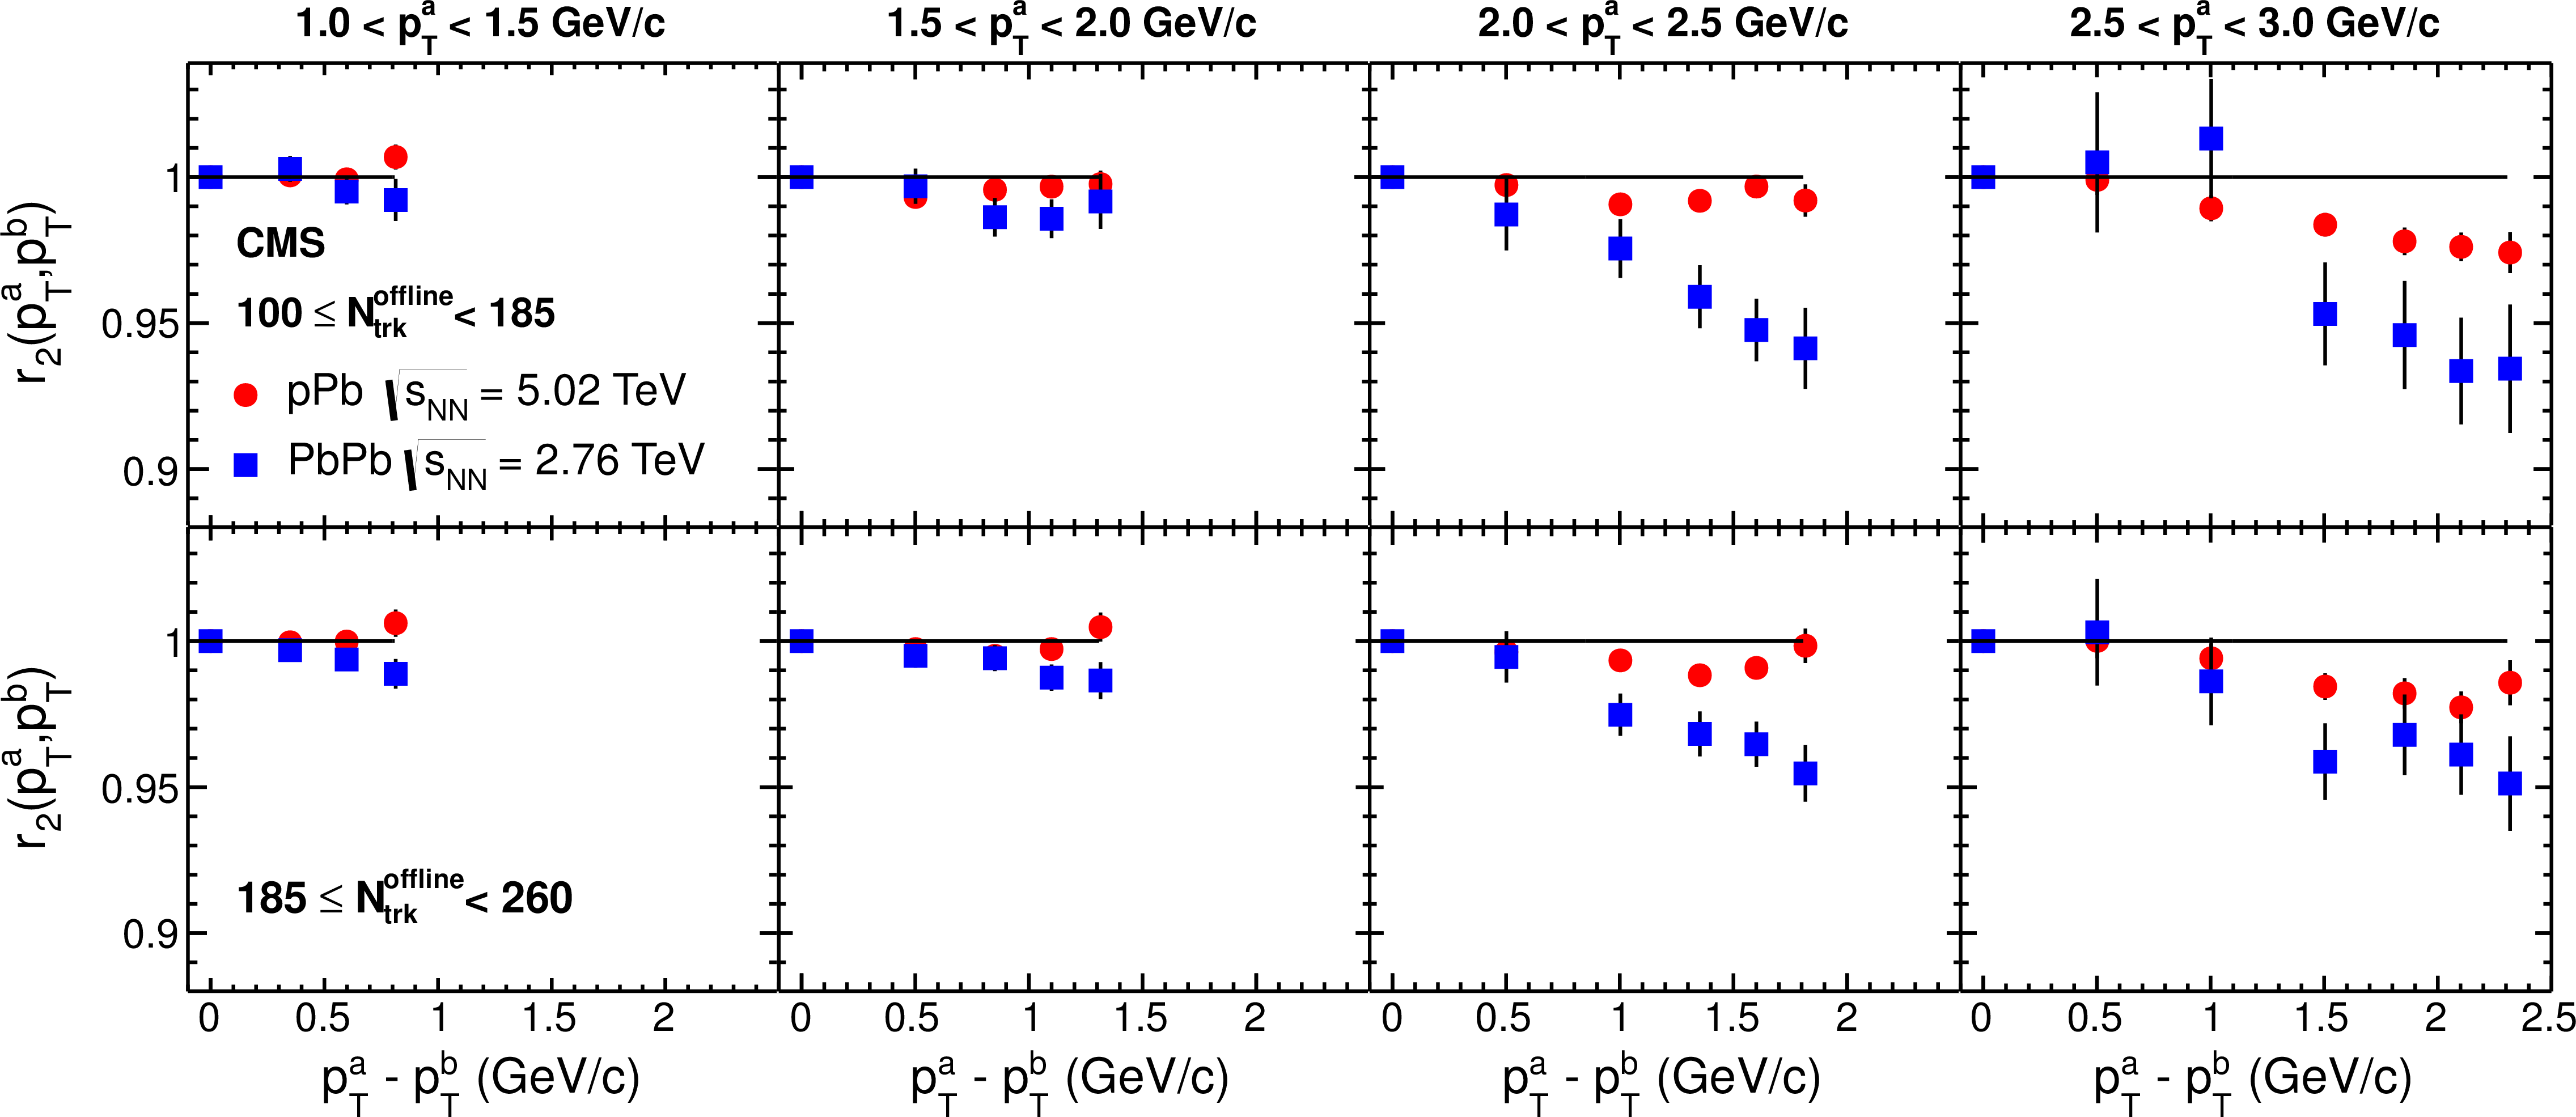
Figure 1:
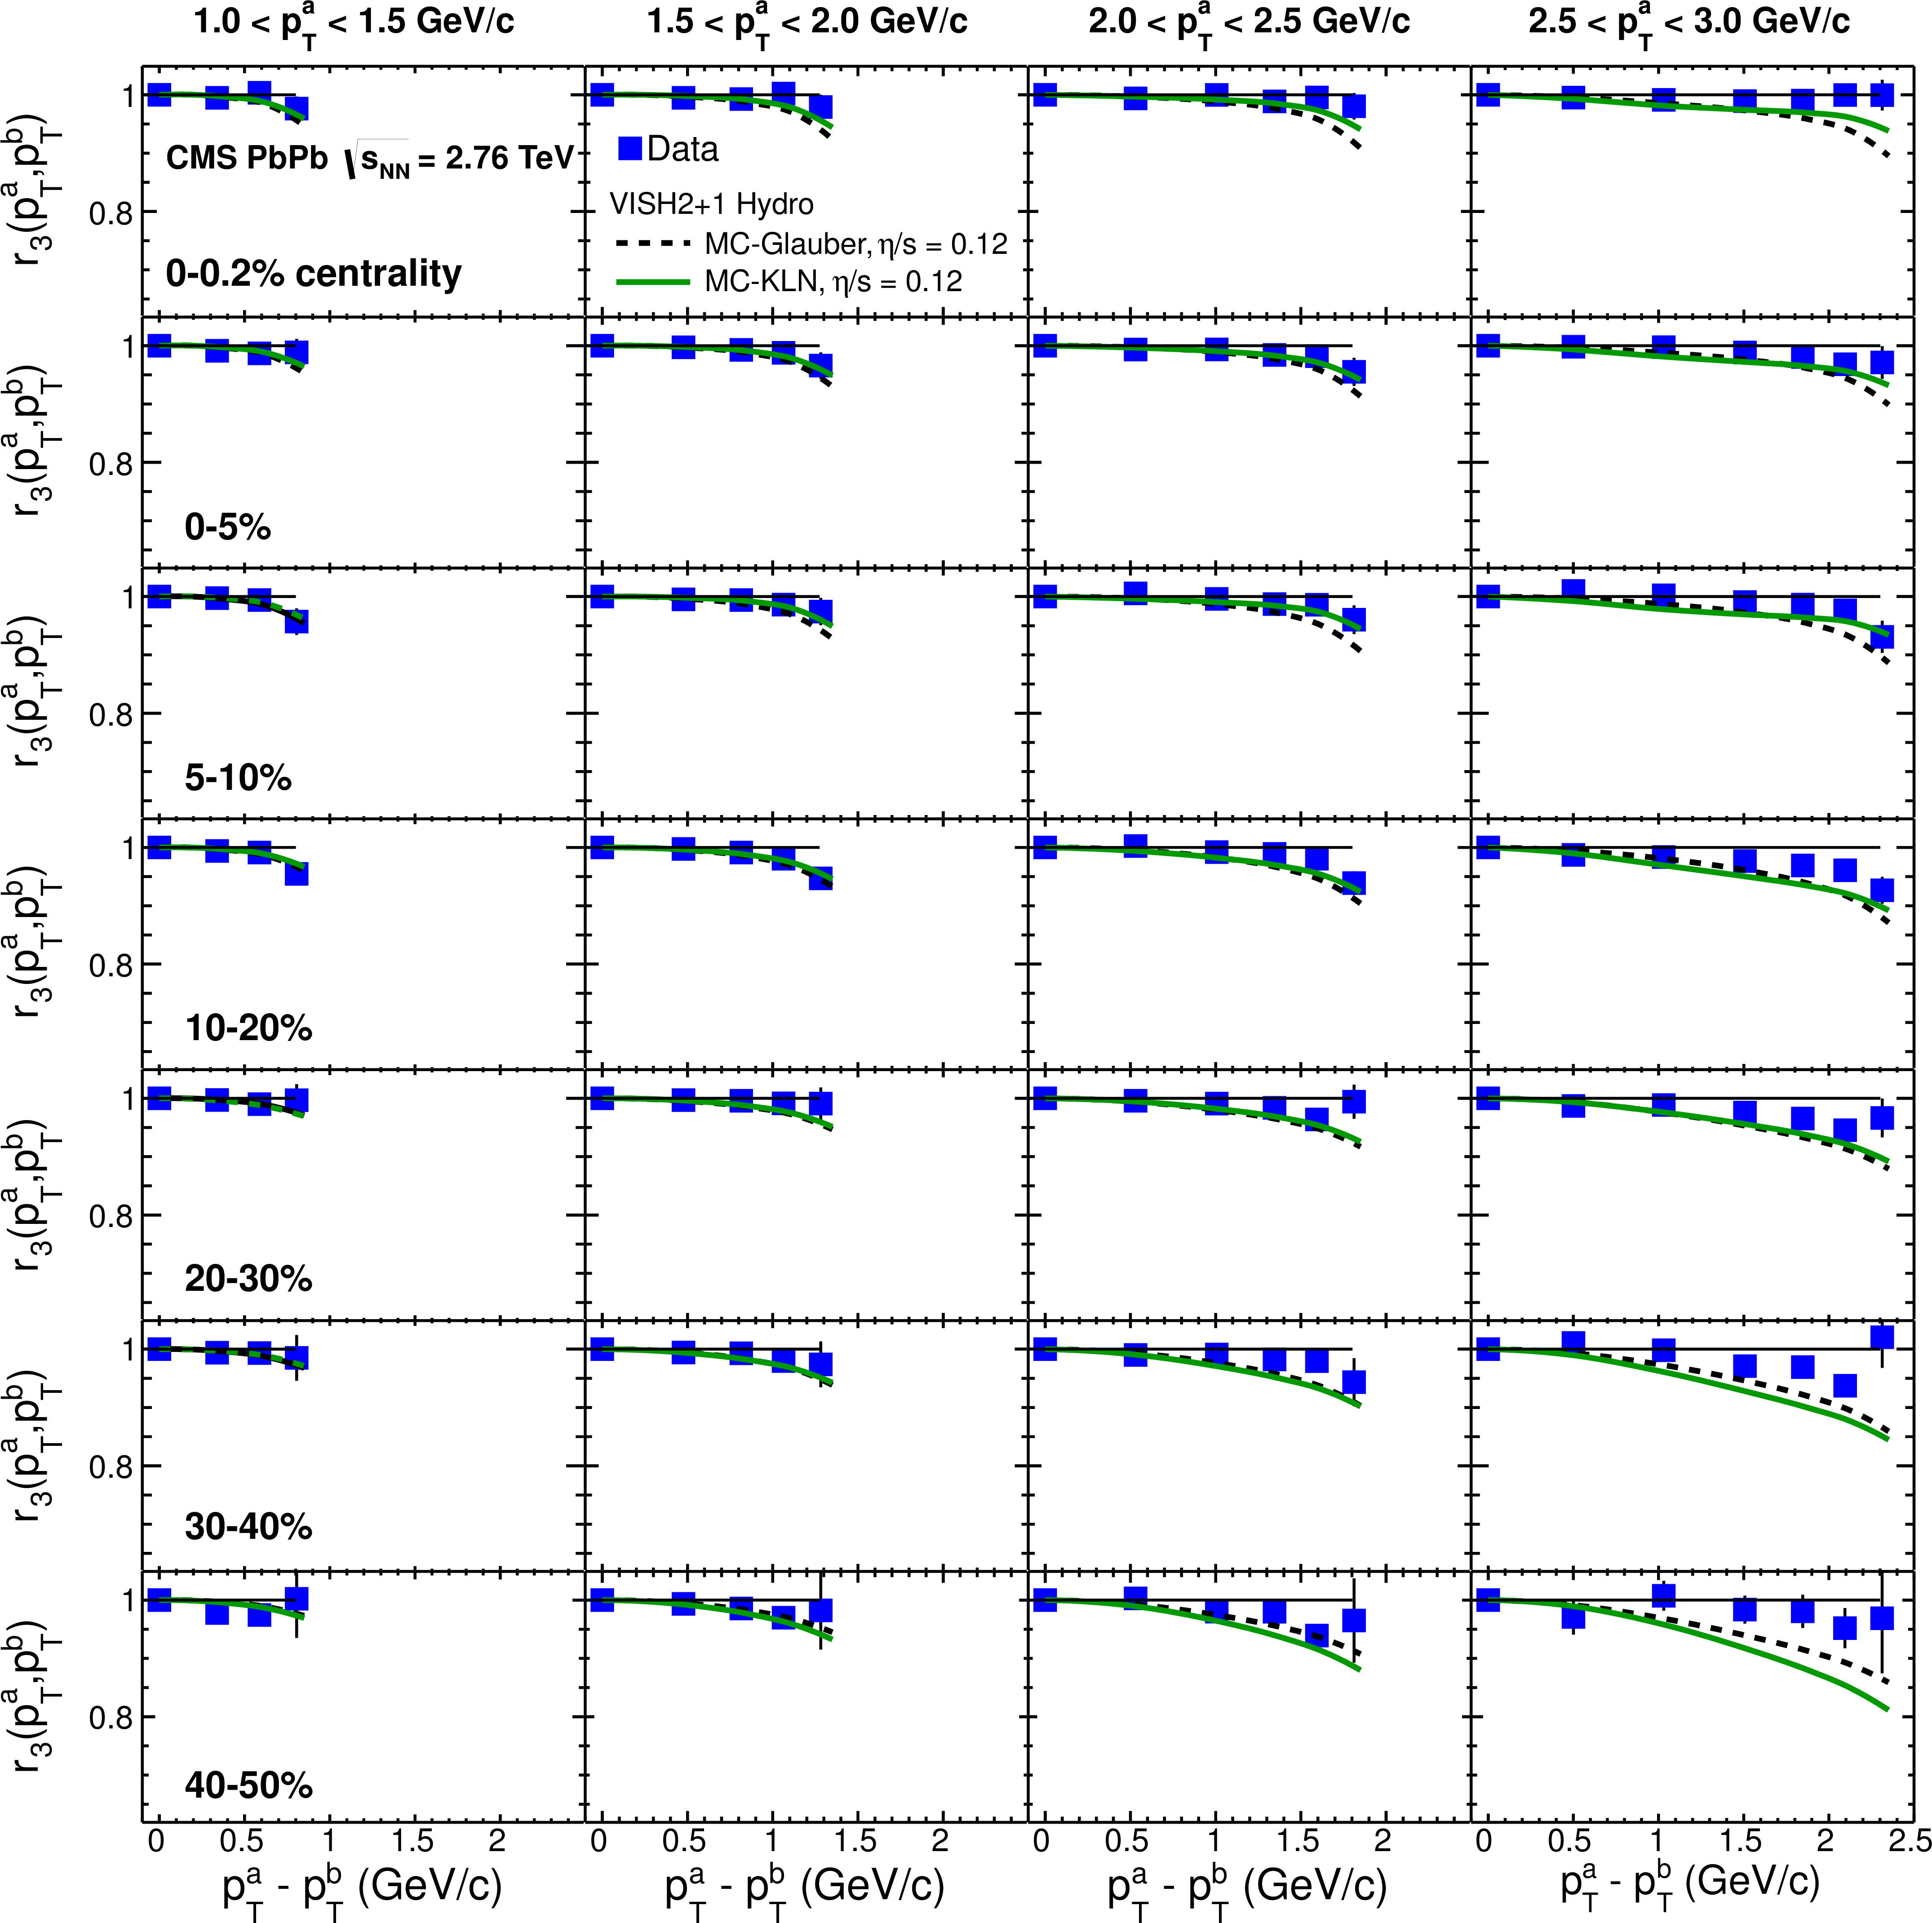
The $ {p_{\mathrm {T}}} $-dependent factorization ratio, $r_2$, as a function of $ { {p_{\mathrm {T}}} ^{a}} - { {p_{\mathrm {T}}} ^{b}} $ in bins of $ { {p_{\mathrm {T}}} ^{a}} $ for different centrality ranges of PbPb collisions at $ {\sqrt {s_{_\mathrm {NN}}}} $ = 2.76 TeV . The curves show the calculations from a viscous hydrodynamic model [PRC 87 (2013) 034913] using MC-Glauber and MC-KLN initial condition models, and an $\eta /s$ value of 0.12. Each row represents a different centrality range, while each column corresponds to a different $ { {p_{\mathrm {T}}} ^{a}} $ range. The horizontal solid lines denote the $r_{2}$ value of unity. The error bars correspond to statistical uncertainties, while systematic uncertainties are negligible for the $r_n$ results, and thus are not shown. |
png pdf |
Figure 2:
Similar distributions as shown in Fig.1, but for the factorization ratio $r_3$. |
png pdf |
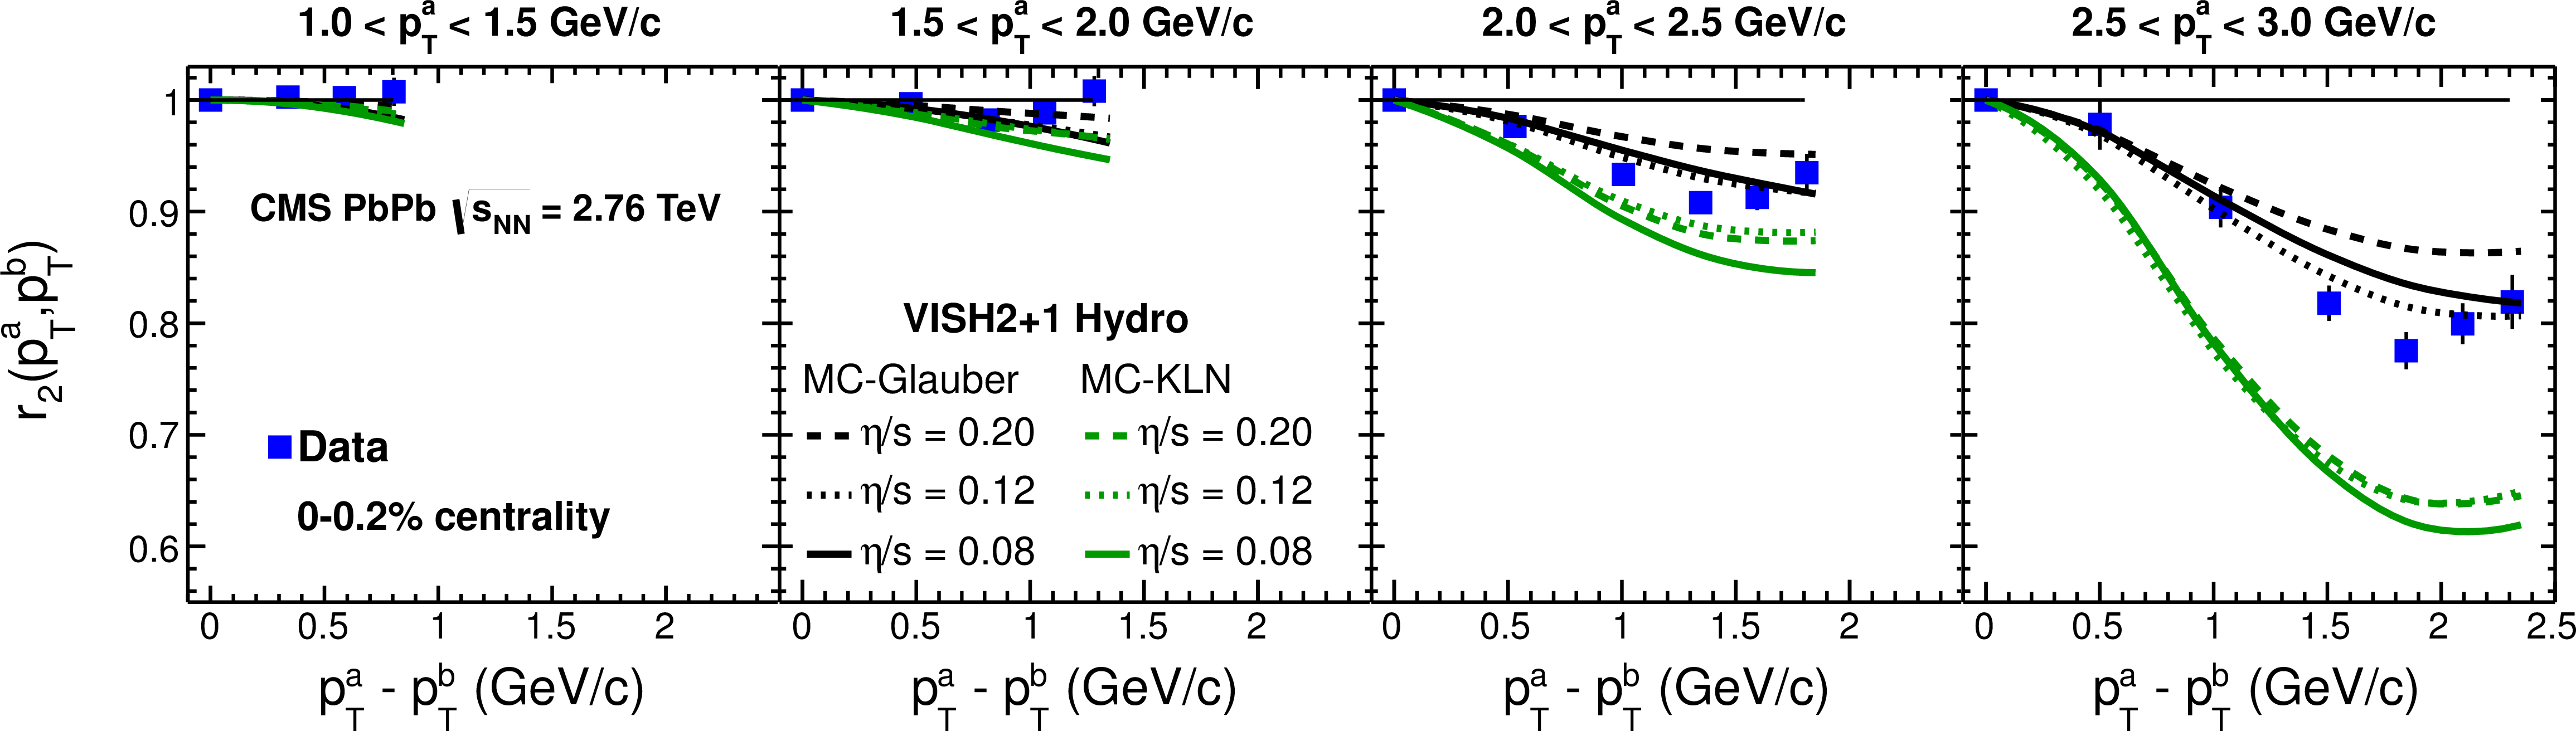
Figure 3:
Factorization ratio, $r_2$, as a function of $ { {p_{\mathrm {T}}} ^{a}} - { {p_{\mathrm {T}}} ^{b}} $ in bins of $ { {p_{\mathrm {T}}} ^{a}} $ for 0-0.2% centrality PbPb data at $ {\sqrt {s_{_\mathrm {NN}}}} $ = 2.76 TeV compared to viscous hydrodynamic calculations [PRC 87 (2013) 034913] using MC-Glauber and MC-KLN initial condition models, and three different values of $\eta /s$. The horizontal solid lines denote the $r_{2}$ value of unity. The error bars correspond to statistical uncertainties, while systematic uncertainties are negligible for the $r_n$ results, and thus are not shown. |
png pdf |
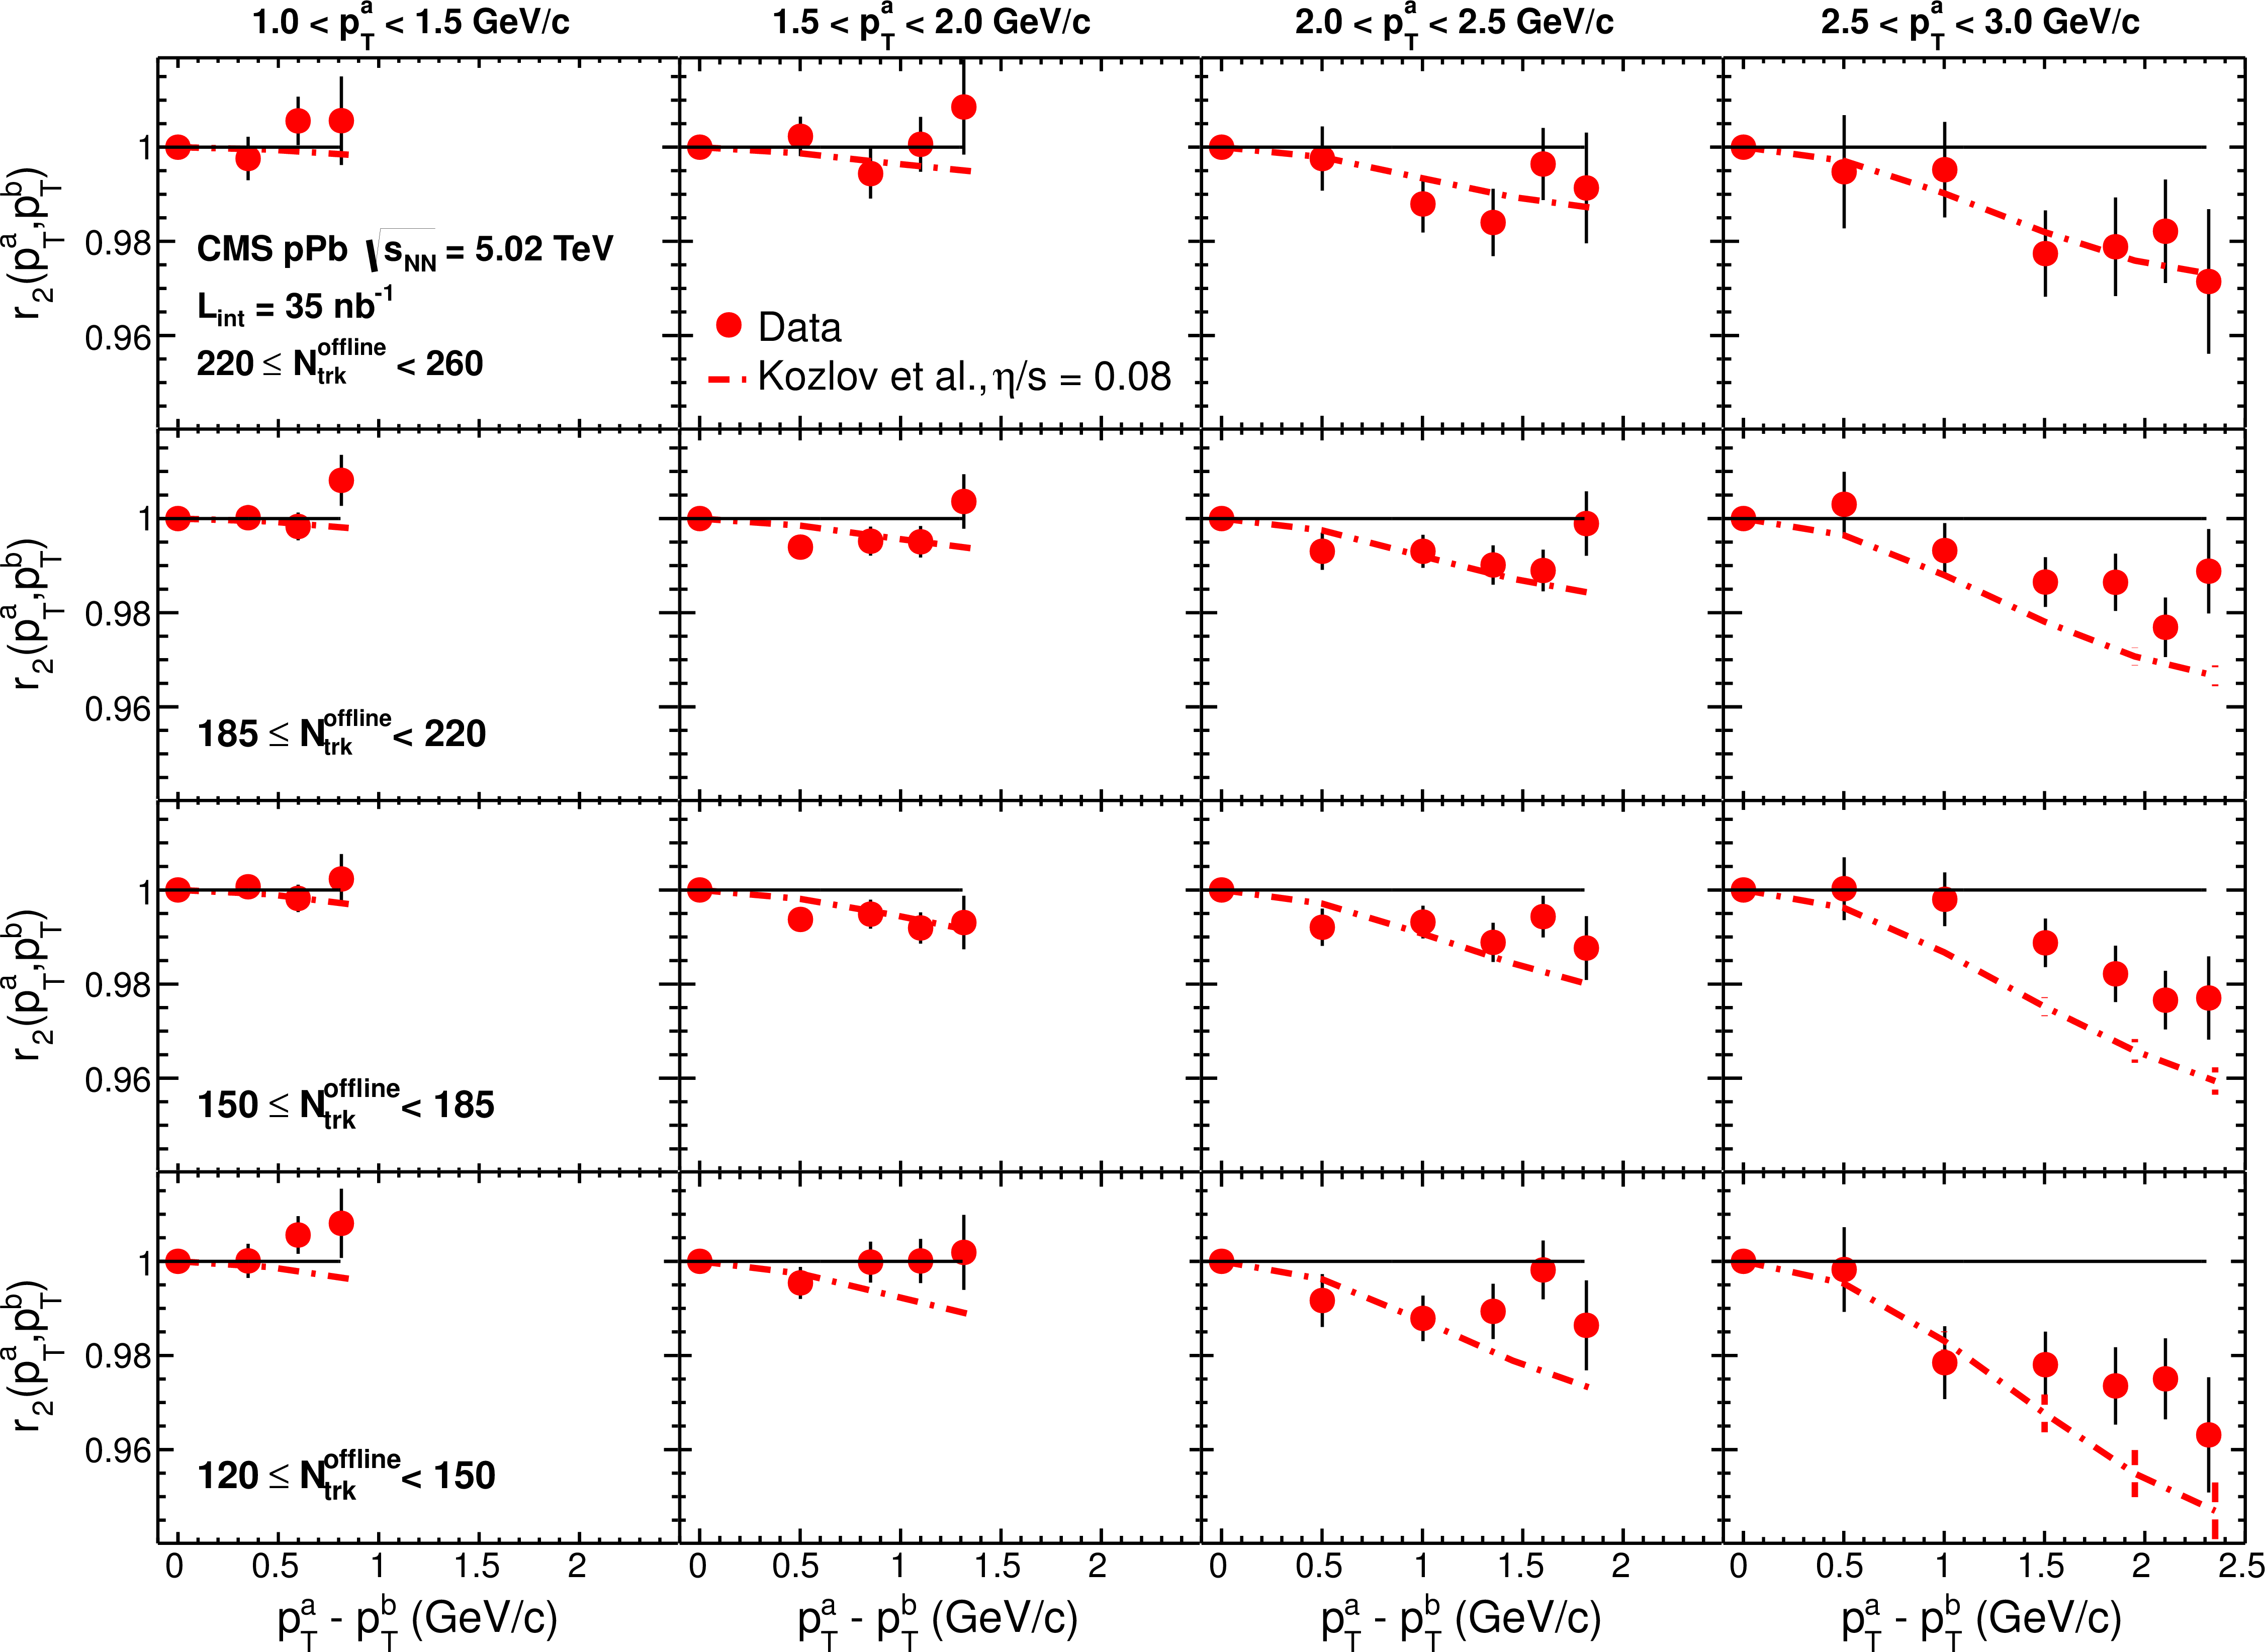
Figure 4:
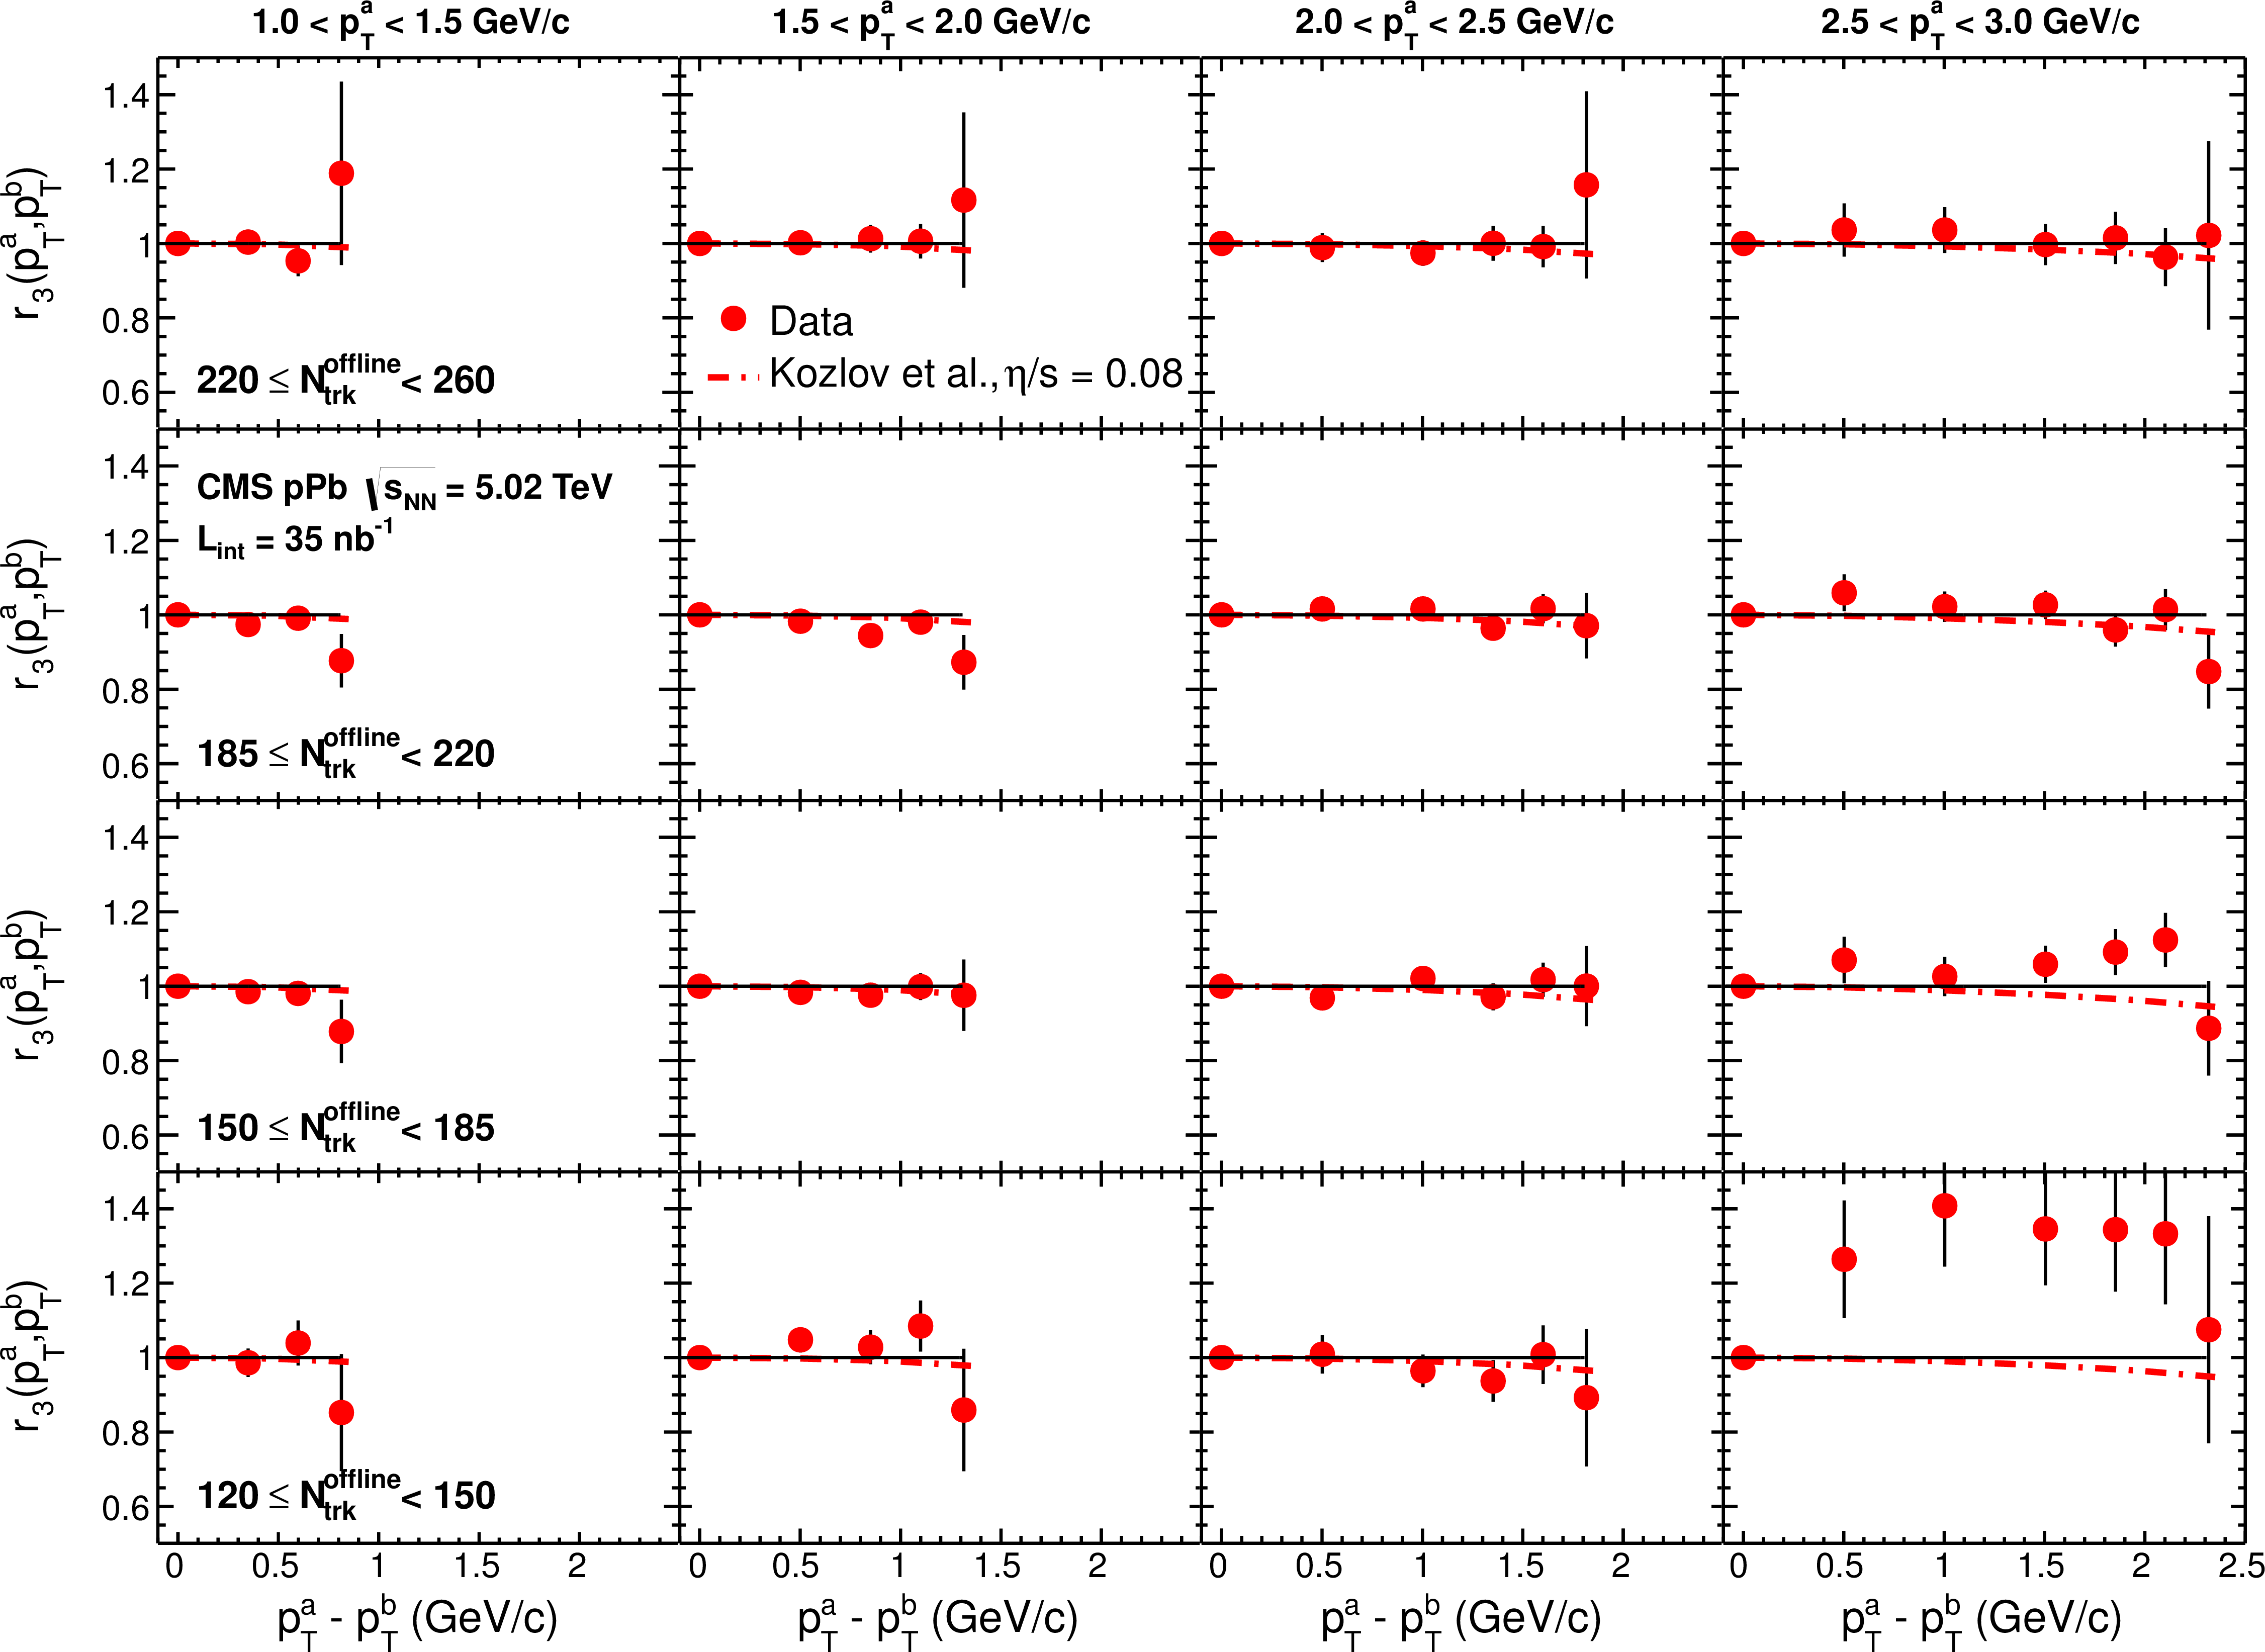
The $ {p_{\mathrm {T}}} $-dependent factorization ratio, $r_2$, as a function of $ { {p_{\mathrm {T}}} ^{a}} - { {p_{\mathrm {T}}} ^{b}} $ in bins of $ { {p_{\mathrm {T}}} ^{a}} $ for four $ {N_\text {trk}^\text {offline}} $ ranges in 5.02 TeV pPb collisions. The curves show the predictions from hydrodynamic calculations for pPb collisions of arXiv:1405.3976. The horizontal solid lines denote the $r_{2}$ value of unity. The error bars correspond to statistical uncertainties, while systematic uncertainties are negligible for the $r_n$ results, and thus are not shown. |
png pdf |
Figure 5:
Similar distributions as shown in Fig.4, but for the factorization ratio $r_3$. |
png pdf |
Figure 6:
The $ {p_{\mathrm {T}}} $-dependent factorization ratio, $r_2$, as a function of $ { {p_{\mathrm {T}}} ^{a}} - { {p_{\mathrm {T}}} ^{b}} $ in bins of $ { {p_{\mathrm {T}}} ^{a}} $ for two $ {N_\text {trk}^\text {offline}} $ ranges of 5.02 TeV pPb and 2.76 TeV PbPb collisions. The horizontal solid lines denote the $r_{2}$ value of unity. The error bars correspond to statistical uncertainties, while systematic uncertainties are negligible for the $r_n$ results, and thus are not shown. |
png pdf |
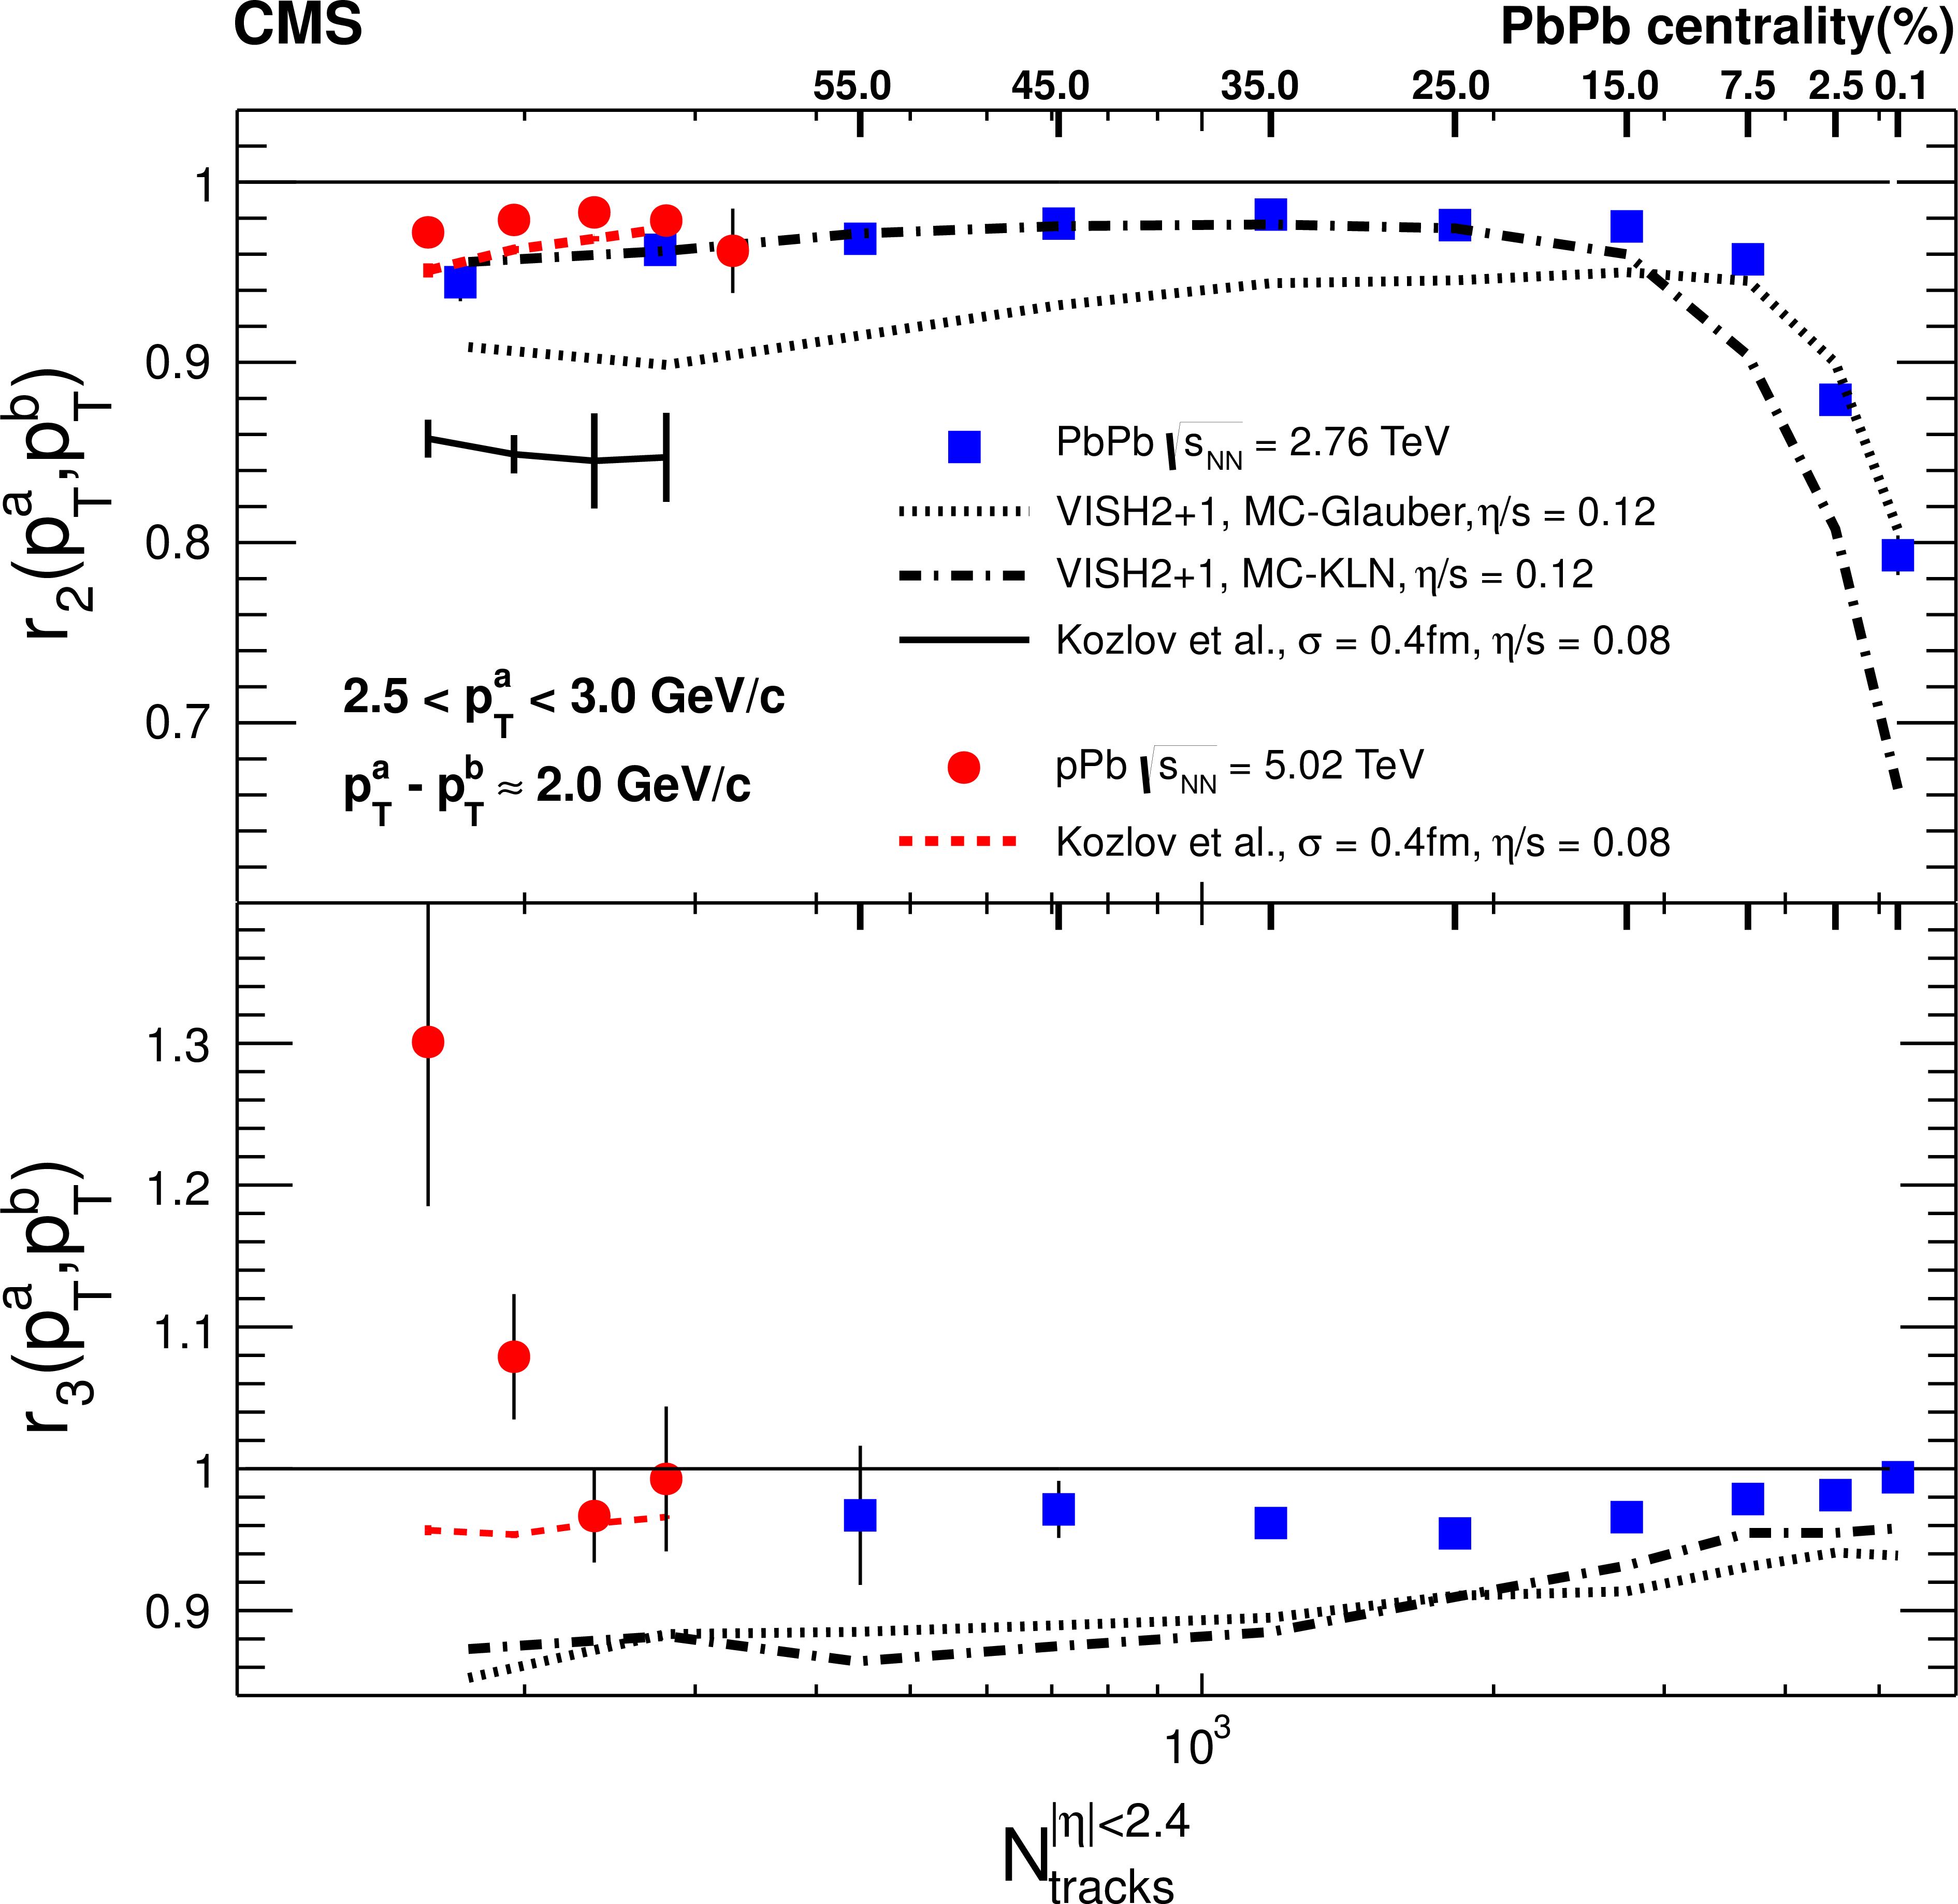
Figure 7:
The $ {p_{\mathrm {T}}} $-dependent factorization ratios, $r_2$ and $r_3$, as a function of event multiplicity in pPb and PbPb collisions. The curves show the calculations for PbPb collisions from viscous hydrodynamics in [PRC 87 (2013) 034913] with MC-Glauber and MC-KLN initial condition models and $\eta /s$ = 0.12, and also hydrodynamic predictions for PbPb and pPb data in [arXiv:1405.3976]. The horizontal solid lines denote the $r_{2}$ (top) and $r_{3}$ (bottom) value of unity. The error bars correspond to statistical uncertainties, while systematic uncertainties are negligible for the $r_n$ results, and thus are not shown. |
png pdf |
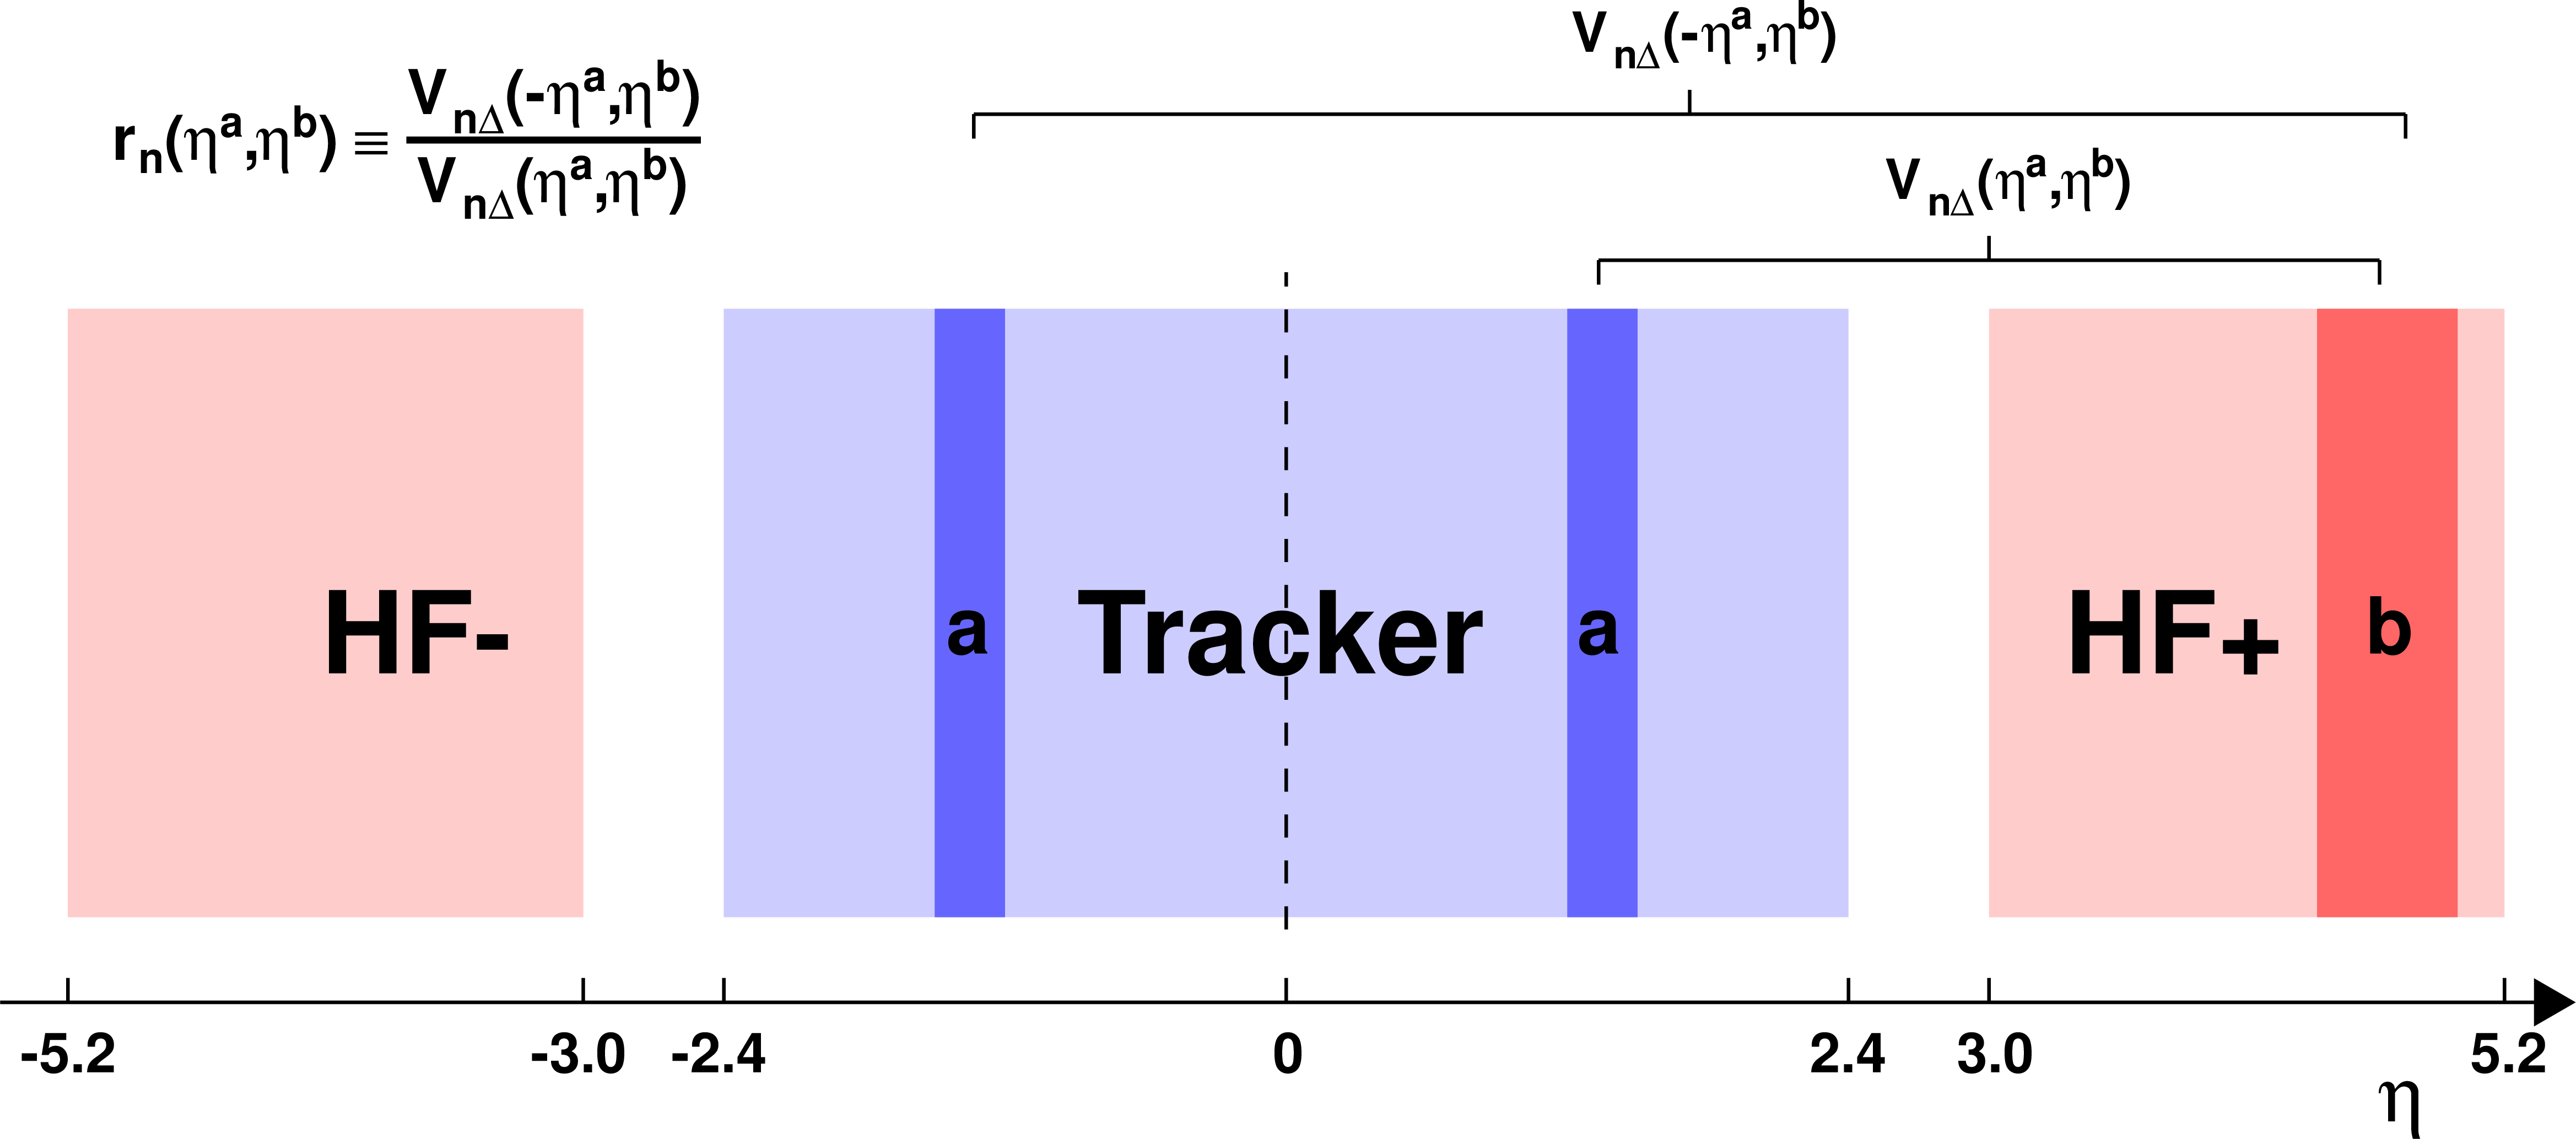
Figure 8:
A schematic illustrating the acceptance coverage of the CMS tracker and HF calorimeters, and the procedure for deriving the $\eta $-dependent factorization ratio, $r_{n}( {\eta ^{a}} , {\eta ^{b}} )$. |

png pdf |
Figure 9:
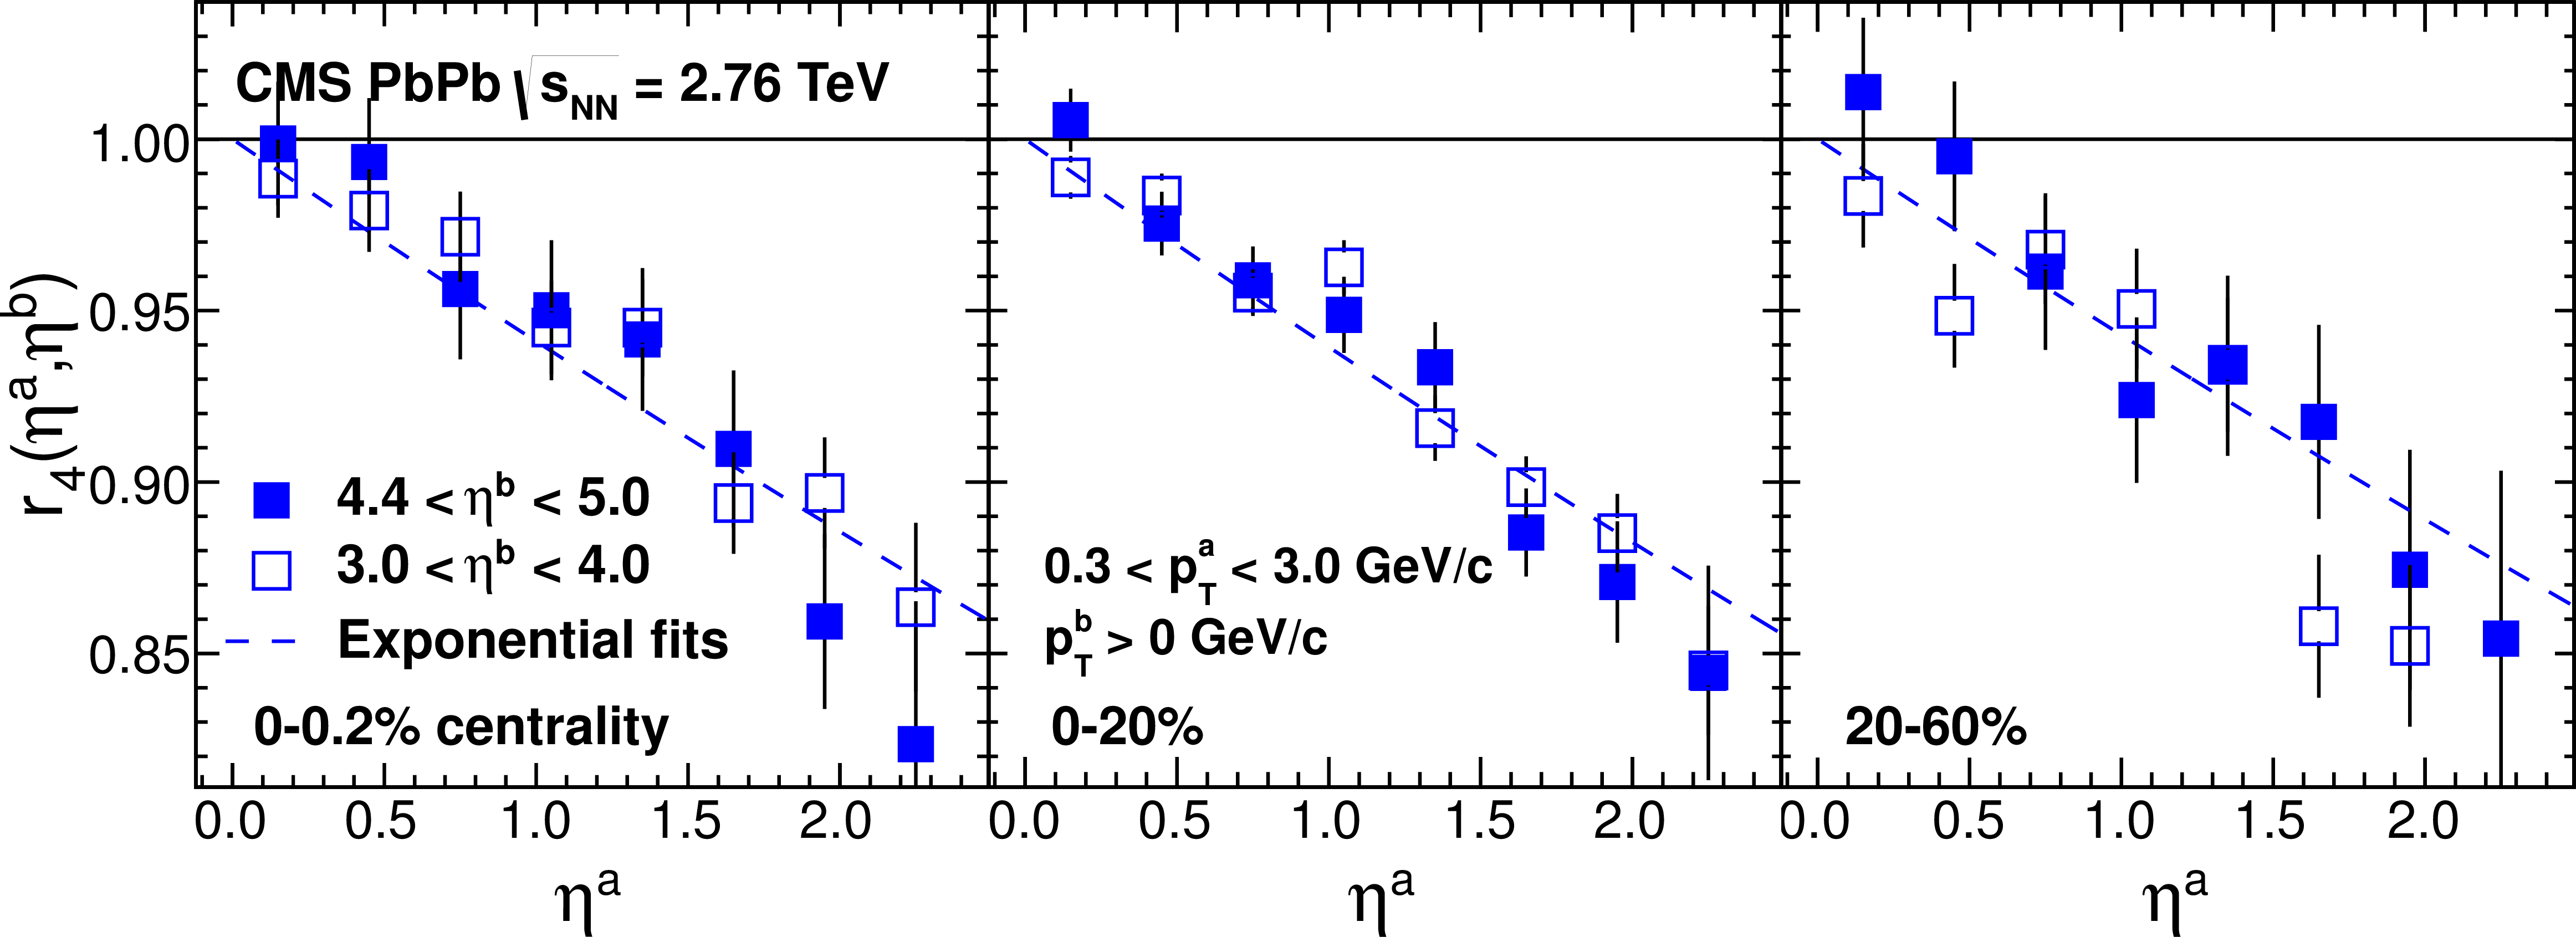
The $\eta $-dependent factorization ratio, $r_2$, as a function of $ {\eta ^{a}} $ for 3.0 $< {\eta ^{b}} <$ 4.0 and 4.4 $< {\eta ^{b}} <$ 5.0, averaged over 0.3 $< { {p_{\mathrm {T}}} ^{a}} <$ 3.0 GeV/$c$, in eight centrality classes of PbPb collisions at $\sqrt {s_{NN}} $ = 2.76 TeV . The curves correspond to fits to the data for 4.4 $< {\eta ^{b}} <$ 5.0 given by Eq.12. The horizontal solid lines denote the $r_{2}$ value of unity. The error bars correspond to statistical uncertainties, while systematic uncertainties are negligible for the $r_n$ results, and thus are not shown. |

png pdf |
Figure 10:
Similar distributions as shown in Fig.9, but for the factorization ratio $r_3$. |
png pdf |
Figure 11:
Similar distributions as shown in Fig.9, but for the factorization ratio $r_4$ in fewer centrality ranges. |
png pdf |
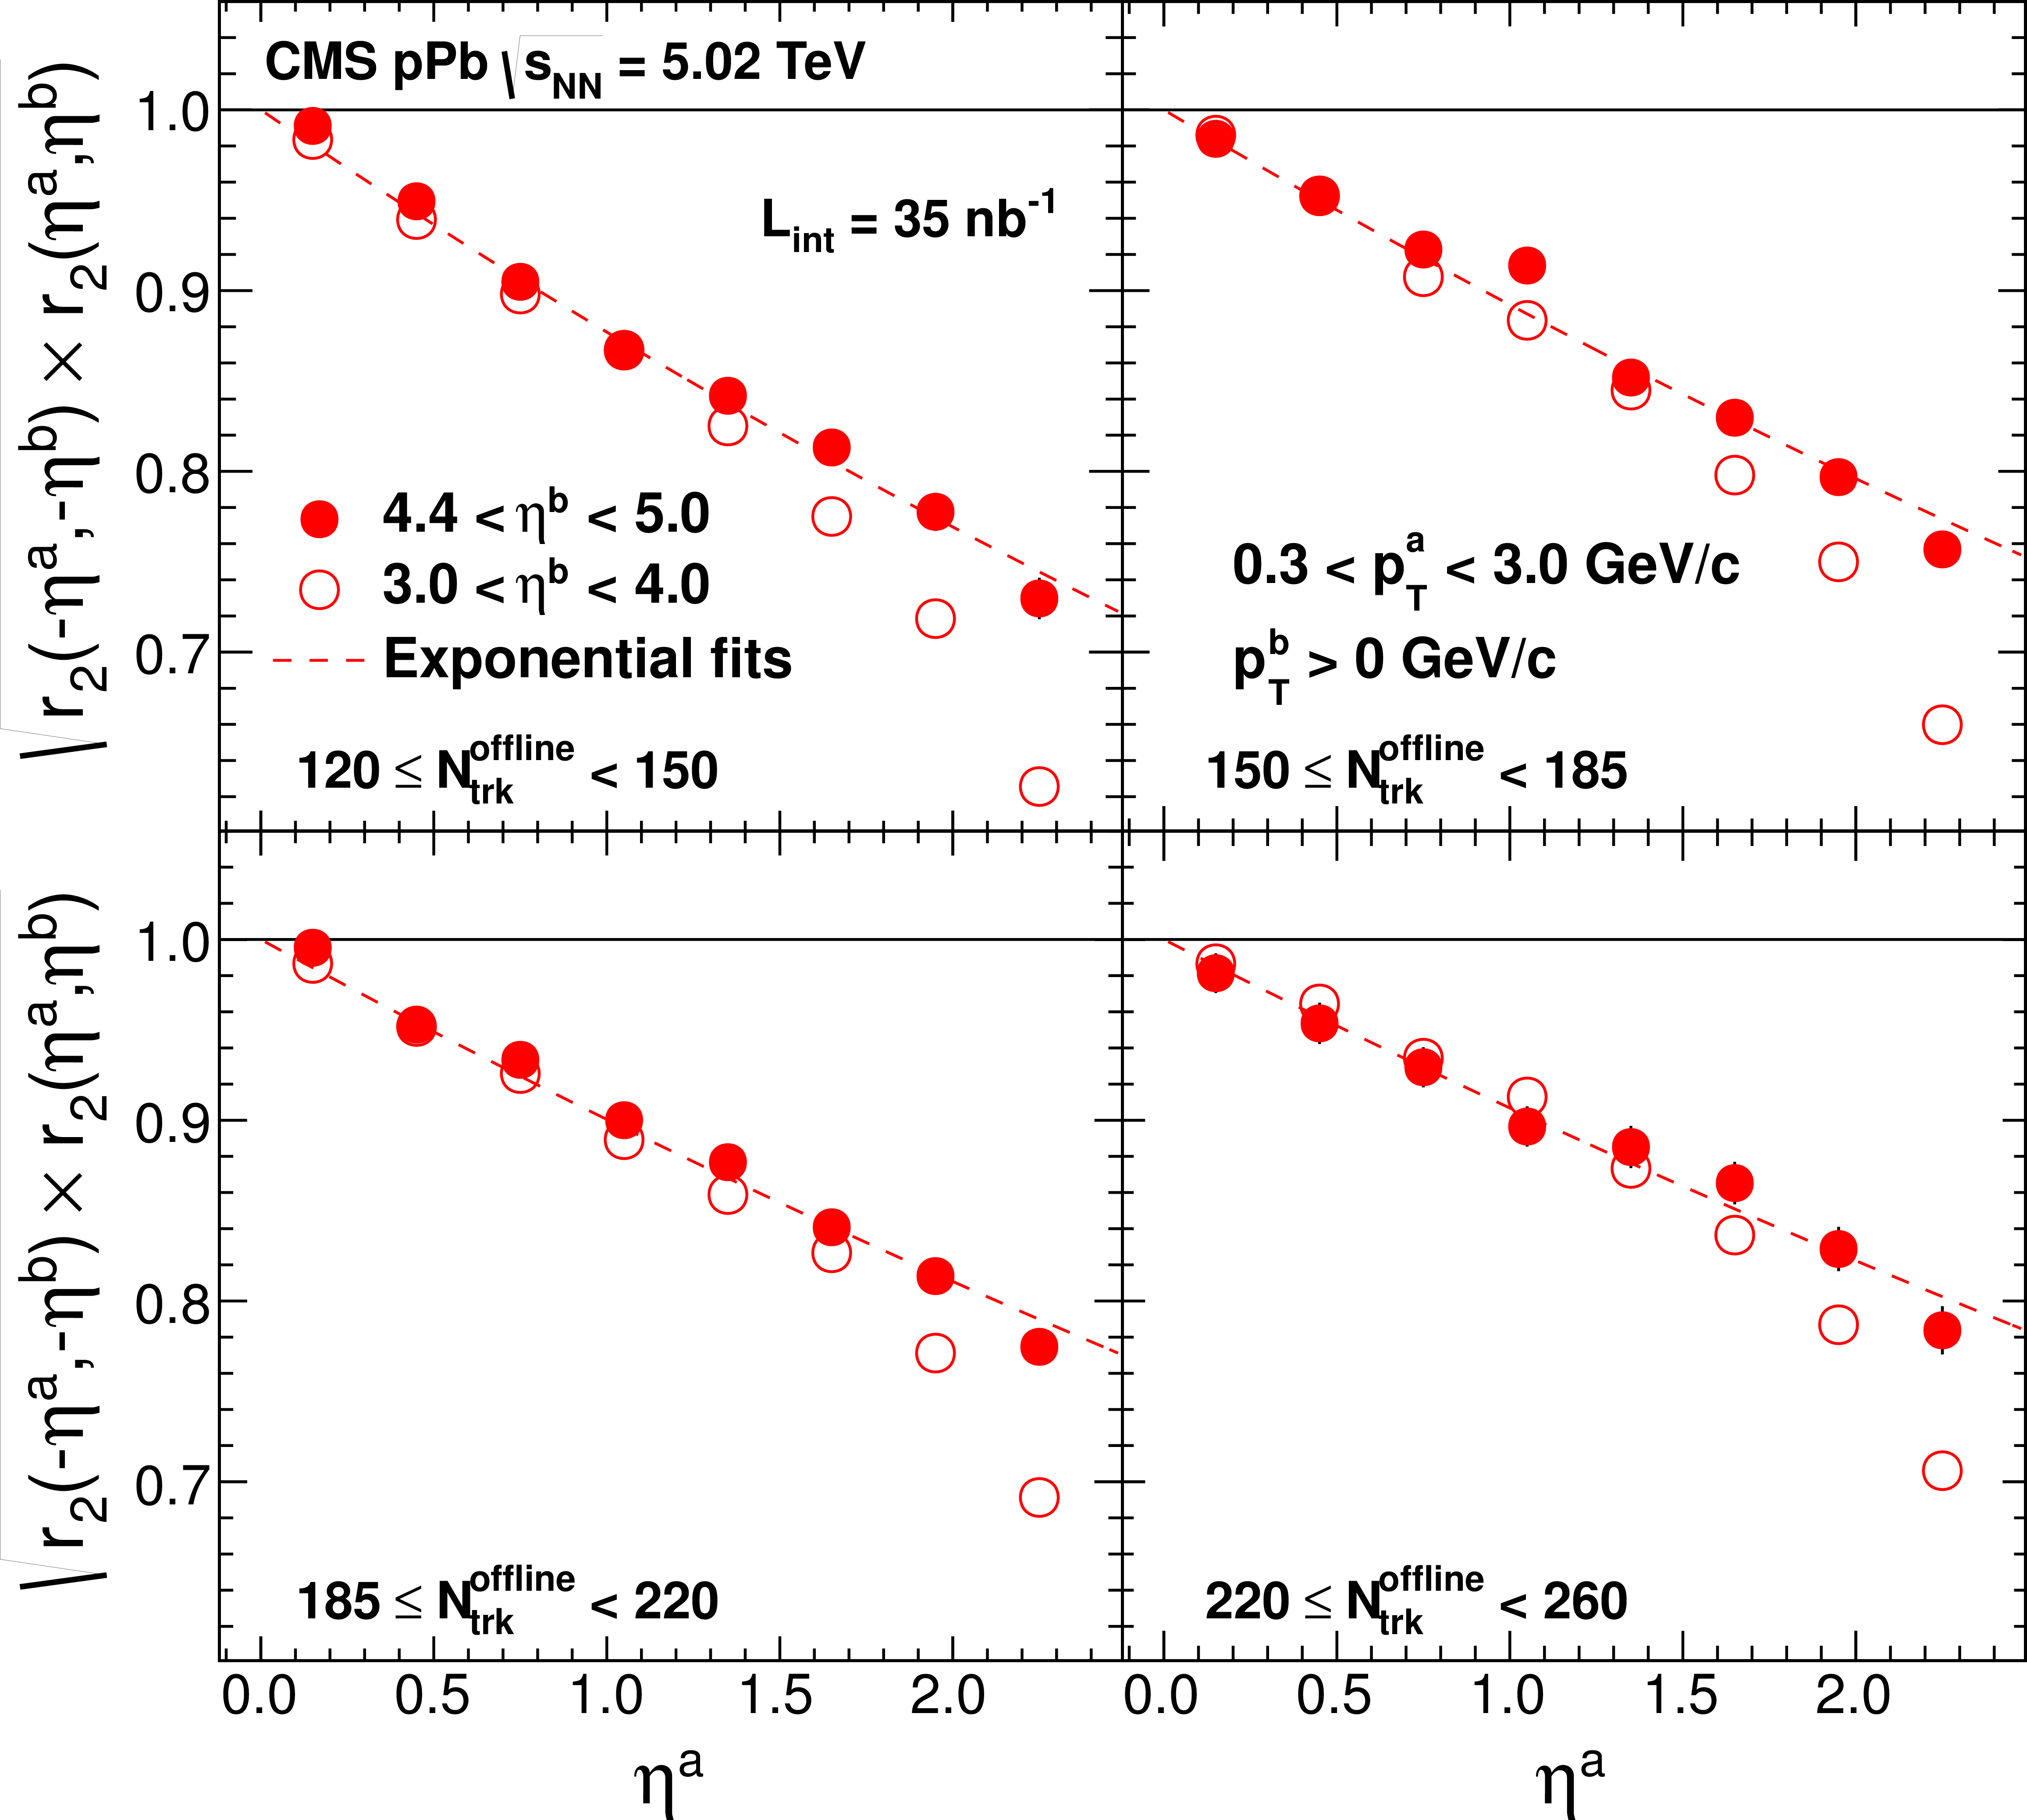
Figure 12:
The square root of the product of factorization ratios, $\sqrt {r_{2}( {\eta ^{a}} , {\eta ^{b}} ) \times r_{2}(- {\eta ^{a}} ,- {\eta ^{b}} )}$, as a function of $ {\eta ^{a}} $ for 3.0 $< {\eta ^{b}} <$ 4.0 and 4.4 $< {\eta ^{b}} <$ 5.0, averaged over 0.3 $< { {p_{\mathrm {T}}} ^{a}} <$ 3.0 GeV/$c$, in four multiplicity classes of pPb collisions at $ {\sqrt {s_{_\mathrm {NN}}}} $ = 5.02 TeV. The curves correspond to the fits to the data for 4.4 $< {\eta ^{b}} <$ 5.0 using Eq.12. The horizontal solid lines denote the $r_{2}$ value of unity. The error bars correspond to statistical uncertainties, while systematic uncertainties are negligible for the $r_2$ results, and thus are not shown. |
png pdf |
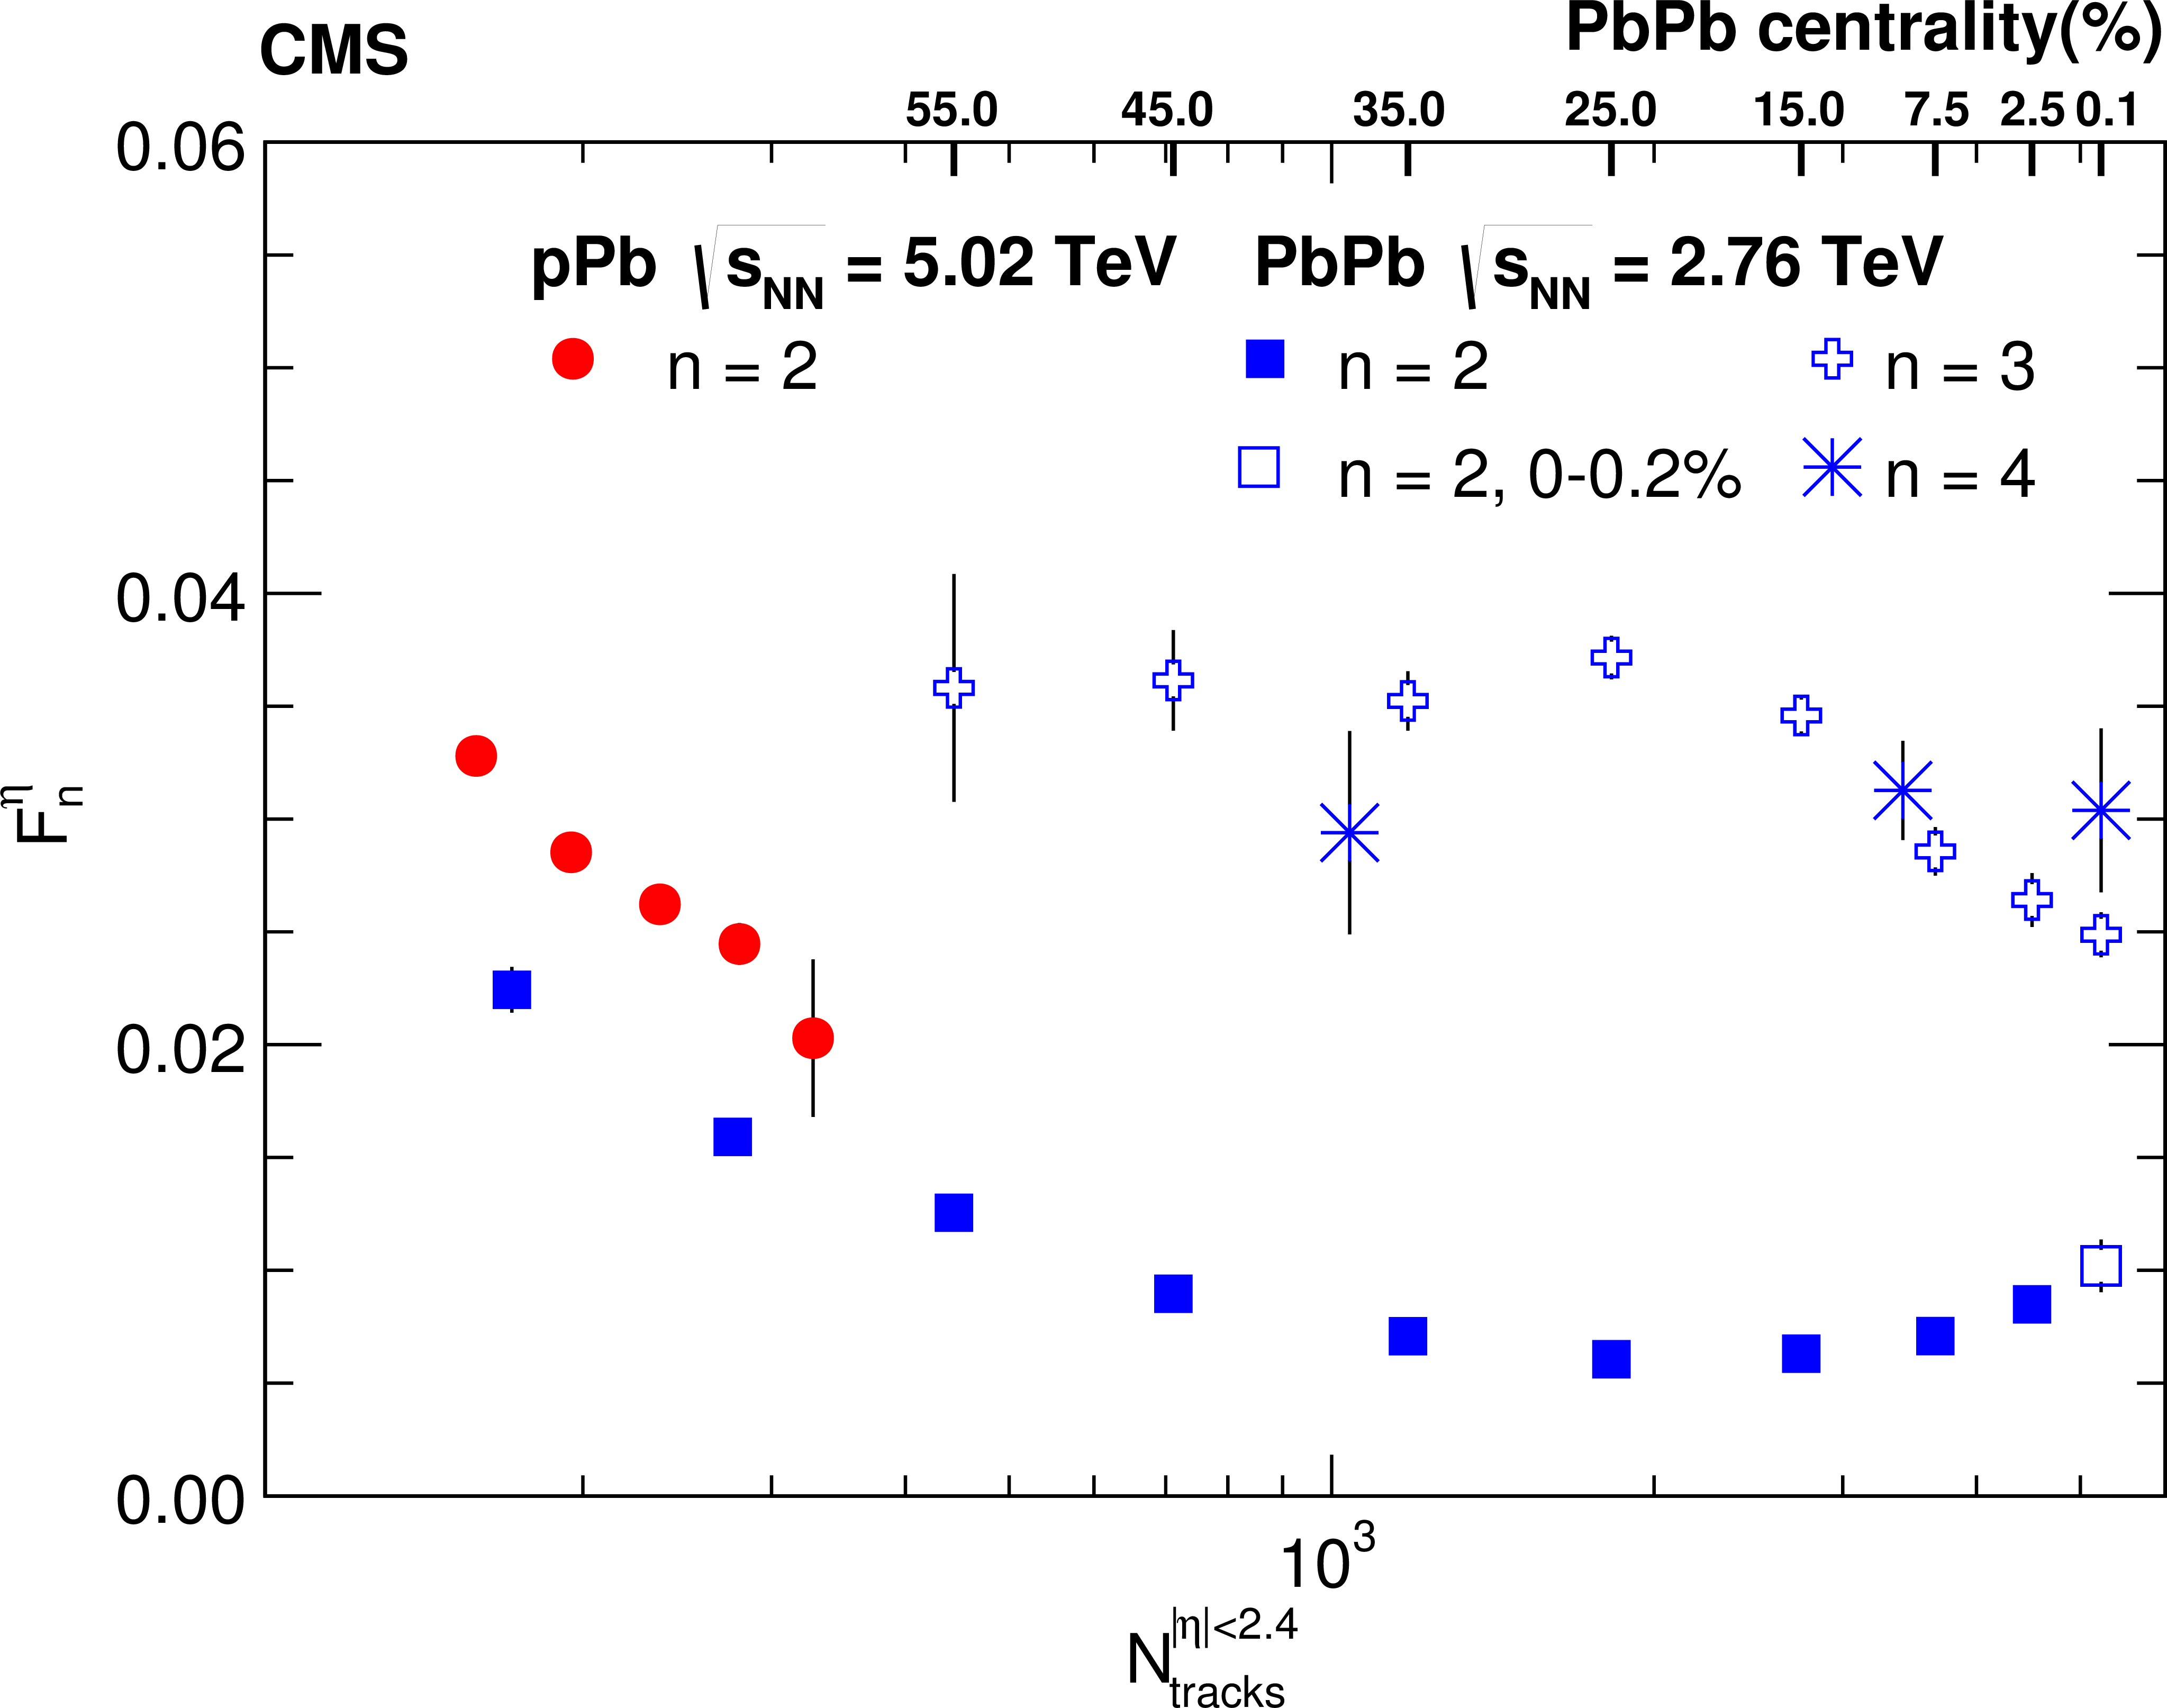
Figure 13:
The $F^{\eta }_{n}$ parameter as defined in Eq.12 as a function of event multiplicity in PbPb collisions at $ {\sqrt {s_{_\mathrm {NN}}}} $ = 2.76 TeV for $n=2$--$4$ and pPb collisions at $ {\sqrt {s_{_\mathrm {NN}}}}$ = 5.02 TeV for $n=2$. The error bars correspond to statistical uncertainties, while systematic uncertainties are negligible for the $r_n$ results, and thus are not shown. |
|
|
Compact Muon Solenoid LHC, CERN |
|

|

|

|

|

|